Article

Transcriptome Identification of R2R3-MYB Gene Family Members in Pinus massoniana and PmMYB4 Response to Drought Stress

State Key Laboratory of Tree Genetics and Breeding, Key Laboratory of Forestry Genetics & Biotechnology of Ministry of Education, Co-Innovation Center for Sustainable Forestry in Southern China, Nanjing Forestry University, Nanjing 210037, China
*
Author to whom correspondence should be addressed.
Forests 2023, 14(2), 410; https://doi.org/10.3390/f14020410
Submission received: 9 December 2022 / Revised: 6 February 2023 / Accepted: 15 February 2023 / Published: 16 February 2023
(This article belongs to the Section Genetics and Molecular Biology)

Abstract

:
One of the largest families of transcription factors in plants, the MYB transcription factors family (Myeloblastosis, MYB TF), plays a vital role in regulating plant biochemical and physiological processes. The role of MYB TF in coping with stresses, such as drought, salt and cold, has been reported. Unfortunately, a comprehensive identification of R2R3-MYB TF in Masson pine (Pinus massoniana) has not been achieved. In this study, a total of 49 sequences were identified as R2R3-MYB TF. The structure, function and phylogenetic relationships of the conserved structural domains of Masson pine R2R3-MYB TF and Populus trichocarpa Torr. & A.Gray ex Hook. TFs were compared using bioinformatics tools. The results showed that Masson pine R2R3-MYB TF was divided into 24 groups, mainly located in the nucleus, and mostly lacking signal peptides and transmembrane structural domains with multiple phosphorylation sites. The drought stress-responsive R2R3-MYB gene, PmMYB4, was selected from the drought stress transcriptome based on analysis of the expression pattern and tissue specificity of PmMYB4 gene under abiotic stress using qPCR. The results showed that PmMYB4 can be involved in drought stress treatment through ABA signaling, as well as in multiple stress responses such as salt stress, and there were significant differences in the expression of PmMYB4 in the eight tissues. These results provide a reference scheme for the functional identification of R2R3-MYB transcription factors, which may be involved in plant responses to multiple stresses such as drought, and enrich our understanding of the functions of R2R3-MYB transcription factors in plants.

1. Introduction

The MYB protein is widely expressed in plants. It usually has two distinct regions, a regulatory region at the C-terminus responsible for regulating protein activity, and a highly conserved N-terminal DNA-binding domain [1]. Based on the number of R structures contained in the structural domain, the MYB TF can be classified into four categories, namely 1R structure (R1-MYB/MYB-related), 2R structure (R2R3-MYB), 3R structure (R1R2R3-MYB), and 4R structure (4R-MYB) [1]. In plants, most MYB belong to the 2R structure, R2R3-MYB, class of transcription factors [2]. Overall, most MYB TF act as early responders to environmental signals and can further induce or repress the expression of relevant genes essential for plant responses to stress. Researchers have identified massive R2R3-MYB TF in Glycine max [3], Arabidopsis [4] and Oryza sativa [5]. They play important roles in response to abiotic and biotic stresses and in regulating secondary metabolite biosynthesis [6].
Water deficit is one of the abiotic stresses that severely inhibit plant development [7,8]. When plants are subjected to drought stress, MYB TF respond to drought signals and regulate the expression of some downstream genes to bring about changes in plant response to biochemical physiological processes, thus exerting a drought-resistant function [9,10,11]. It was found that FtMYB9 and FtMYB13 could activate different stress response signals of Fagopyrum tataricum (L.) Gaertn. and increase the response to ABA, thus improving drought tolerance of plants [12,13]. The HvMYB1 in barley positively regulates plant drought tolerance [14], ZmMYB3R in maize improves drought tolerance [15], and overexpression of NtMYB4a reduces malondialdehyde content in tobacco, accumulates more proline, and improves plant drought and cold resistance [16]. The SbMYB8 in Scutellaria baicalensis Georgi regulates flavonoid biosynthesis to enhance drought resistance [17], and PtrMYB94 in poplar acts synergistically with ABA signaling to improve plant drought resistance [18].
Pinus massoniana Lamb. (Masson pine) is the most abundant conifer species distributed in the humid eastern subtropical region, and is a major fast-growing and productive timber, lipid-producing and ecologically important protected species, with high economic value in China [19,20]. The frequent occurrence of abnormal climate, such as drought and high temperatures, not only aggravates the deterioration of the habitat of Masson pine, but also seriously threatens its growth and restricts the development of the Masson pine industry [21]. The drought resistance ability of adult Masson pine is strong, but at the seedling stage, at the early stage of large-scale plantation and after woodland tending, the woodland is without shade and relatively dry. Under such conditions, drought is the main limiting factor for forestation survival of Masson pine, resulting in the low survival rate at the seedling stage. Some progress has been made in the physiological mechanism of resistance to drought stress, phosphorus stress and other abiotic stresses of Masson pine, as well as the cloning of resistance genes [22,23]. However, studies on the response of the MYB gene to abiotic stresses in Masson pine are relatively blank.
In this study, we investigated the R2R3-MYB transcription factors of Masson pine, identified the R2R3-MYB gene family, and isolated a drought-inducible gene, PmMYB4, by screening. The expression of the PmMYB4 gene in different environmental stresses, such as drought, was analyzed by q-PCR. The gene functions of the R2R3-MYB genes of Masson pine under stress and their response mechanisms were explored. These results provide a reference for the functional identification of R2R3-MYB TF and enrich our understanding of the functions of R2R3-MYB TF in plants.

2. Materials and Methods

2.1. Identification and Classification of R2R3-MYB Genes from Masson Pine

The transcriptome data for each of the four Masson pine species were the drought stress transcriptome (PRJNA595650), the transcriptome under CO2 stress [24], the transcriptome of pine wood nematode inoculation (PRJNA660087), and the transcriptome of shoots (PRJNA655997) [25]. Protein translation was performed online by ExPASy (https://web.expasy.org/translate/, accessed on 15 April 2022). The Hidden Markov Model (HMM) of the MYB binding domain (PF00249) was obtained from the Pfam database (http://pfam.xfam.org/, accessed on 15 April 2022) and used to identify all MYBs in Masson pine [26]. The transcription factors of the Masson pine MYB family were screened by default parameters of HMMER3 V3.0 software. Using Pfam and the Conserved Domain Search, all domains of the MYB protein sequence and deleted domains that did not have MYB protection sequences that defend the domain, or did not have the complete conserved domain, of MYB were held by MYB TF R2R3-MYB TF, obtained and further analyzed [27,28].

2.2. Characterization of MYB Gene Family Members of Masson Pine

Physicochemical properties of the gene, such as isoelectric point, protein instability coefficient, and molecular mass, were determined using ExPASy (https://web.expasy.org/, accessed on 22 April 2022). Subcellular localization was analyzed by WoLF PSORT (https://psort.hgc.jp/, accessed on 22 April 2022). Protein transmembrane structure was analyzed using TMHMM v.2.0 (http://www.cbs.dtu.dk/services/TMHMM/, accessed on 23 April 2022). NetPhos 3.1 and SignalP 5.0 (https://www.nature.com/articles/s41587-019-0036-z, accessed on 23 April 2022) phosphorylation sites and signal peptides were used [29].

2.3. Phylogenetic Analysis of R2R3-MYB Proteins in Masson Pine

The phylogenetic tree was constructed using MEGA 10.0, and the partial deletion (Pairwise deletion) option was selected according to the R2R3-MYB classification of Populus trichocarpa [30] using the neighborhood join method (NJ) p-distance model. The bootstrap method was used with a value of 1000 [28,31], and then embellished using Evolview (https://academic.oup.com/nar/article/47/W1/W270/5494715?login=false, accessed on 24 April 2022). The MEME tool (version 5.3.3) (https://academic.oup.com/nar/article/43/W1/W39/2467905, accessed on 24 April 2022) analyzed the amino acid motifs of the PmMYB protein with 5 motifs sets. Fragment sizes ranged from 6 to 70 amino acids and all other default parameter values. The conserved motifs obtained from the search were annotated using SMART (http://smart.embl-heidelberg.de/, accessed on 25 April 2022) online analysis software [32].

2.4. Expression Pattern Analysis of Masson Pine R2R3-MYB Genes

Expression of the R2R3-MYB gene was studied by drought transcriptome data (PRJNA595650). To estimate the abundance of PmMYB gene transcripts, the number of fragments per kb per exon model per million reads mapping (FPKM) value was used and heat maps of selected genes were plotted and analyzed on a line scale based on the value of log2 (FPKM + 0.01); the visualization process was performed using TBtools (Toolbox for biology) [33] software. The PmMYB4 (GenBank:MW579325) was selected for real-time quantitative RT-PCR (qRT-PCR) validation.
Drought stress was simulated by soaking 2-year-old Masson pine seedlings with 15% PEG6000, and Masson pine needles were collected at 0 h, 3 h, 6 h, 12 h, and 24 h and immediately stored in liquid nitrogen at −80 °C. The control group was untreated seedlings (0 h). Three biological replicates and three process replicates were performed for all treatments, respectively. After obtaining all samples, sample RNA was extracted and reverse transcribed to obtain cDNA (methods from Vazyme FastPure Plant Total RNA Isolation Kit (Polysaccharides and Polyphenolics-rich) instructions). The α-tubulin (TUA) (GenBank: KM496535.1) [34] gene was used as the internal reference gene and the PmMYB4 gene was selected for qRT-PCR. Primers for the PmMYB4 gene (PmMYB4-Q-F, PmMYB4-Q-R) were designed by Primer Premier 5.0 software. The kit used for qRT-PCR is from YEASEN. The 2−ΔΔCT [35] was used to calculate the relative changes in gene expression levels.

2.5. Subcellular Localization Detection

The PJIT166 vector contained a 2×35S double 35S strong promoter and a GFP green fluorescent reporter gene. Using CE Design software, primers carrying restriction sites were designed using the pJIT166 vector and the ORF sequence of PmMYB4 (with the termination codon removed) as templates. Next, a 2×35S::PmMYB4-GFP fusion vector was constructed and transformation performed, followed by positive detection of bacterial solution, sequencing, and screening of the correct positive clones for amplification and culture. Target gene plasmids were extracted with the QIAGEN large plasmid extraction kit and transformed into Agrobacterium tumefaciens (EAH105).
Young tobacco leaves (grown for 20 d) were infested with Agrobacterium-mediated transient transformation and incubated in an artificial climate incubator for 2 d. Tobacco leaf samples (0.5 × 0.5 cm) were taken and laid flat on slides. The expression of the fusion vector was observed under a laser confocal microscope (UV excitation wavelength 488 nm), and the results were photographed and recorded.

2.6. Response of PmMYB4 to Stress

Based on the Escherichia coli genome codon usage patterns, the codon optimization website ExpOptimizer (https://www.novopro.cn/tools/codon-optimization. html) was used to optimize the codon of the PmMYB4 gene to a pattern more suitable for expression in Escherichia coli, to optimize the structure of its mRNA and regulate the matching degree with the level of host cell tRNA [36,37,38,39,40]. The optimized PmMYB4, which we named PmMYB4-optimization nucleotide sequence, is shown in Supplementary Materials.
The PmMYB4-optimization and pET28a were fused and transformed with E. coli TransB-DE3 strain using the same method as in Section 2.5. After incubation in petri dishes overnight, positive clonal colonies were selected and tested on LB plates containing 800 mM d -mannitol, 400 mM NaCl and 20% PEG6000 to observe their growth.

2.7. Gene Expression Analysis and Promoter Cis-Acting Element Analysis of PmMYB4

Flowers (F), roots (R), xylem (X), phloem (P), old leaves (OL), young leaves (YL), old stems (OS), and young stems (YS) were collected from 15-year-old Masson pine. Phloem and xylem were obtained from developing trunks (phloem was retrieved from inside the phloem and xylem tissue from peeled logs). For abiotic stress treatments of 2-year-old Masson pine, abiotic stress treatments included mechanical damage treatment, 50 μM ethylene (ETH) treatment, 400 μM abscisic acid (ABA) treatment, 10 mM methyl jasmonate (MeJA) treatment, 10 mM H2O2 treatment, and 1 mM salicylic acid (SA) treatment. The mechanical damage was treated by cutting the upper part of the needles of Marengo pine, and the other treatments were performed by spraying hormone solutions on the plant surface. The specific methods were the same as in Section 2.4.
The local database of PmMYB4 was established and aligned with the Pinus taeda genome. The nucleotide sequence approximately 2000 bp upstream of this fragment was selected as the promoter sequence and design specific primers (Pro-PmMYB4-F, Pro-PmMYB4-R). The promoter sequences were analyzed by PlantCARE. The total reaction system was DNA (100 ng/μL) 2 μL, Pro-PmMYB4-F 2.5 μL, Pro-PmMYB4-R 2.5 μL, 2×ApexHF FS PCR Master Mix 25 μL and ddH2O 18 μL. The reaction was performed at 98 °C for 3 min, kept at 98 °C for 30 s, 60 °C for 5 s, 72 °C for 1 min, 72 °C for 5 min, 35 cycles and stored at 4 °C.

3. Results

3.1. Identification of R2R3-MYB TF in Masson Pine

We mined 57 MYB TF in the four transcriptomes of Masson pine and named them PmMYB1 to PmMYB57. The amino acid sequences of the 57 R2R3-MYB sequences are shown in Figure 1. There were three extremely conserved tryptophan (W) in the R2 structure and two extremely conserved tryptophan (W) in the R3 structure of Masson pine, in which the first tryptophan was replaced by leucine (L), isoleucine (I) and phenylalanine (F), as shown in Figure 1. The eight amino acid sequences, PmMYB13, PmMYB15, PmMYB17, PmMYB19, PmMYB31 PmMYB47, PmMYB48, and PmMYB56, did not have the complete MYB-R2R3 structural domain, while the remaining 49 Masson pine sequences MYB structural domains had high similarity and conservation, including the complete R2 and R3 regions.

3.2. Physical Properties of R2R3-MYB TF in Masson Pine

The number of amino acids in MYB proteins ranged from 114 (PmMYB55) to 1721 (PmMYB48), and protein molecular weight ranged from 13.26 kDa (PmMYB55) ~ 189.75 kDa (PmMYB48), with isoelectric points ranging from 4.72 (PmMYB44) to 9.97 (PmMYB18). The protein average hydrophilicity (GRAVY) prediction scores ranged from −1.18 (PmMYB15) ~ −0.227 (PmMYB30), indicating that all R2R3-MYB are hydrophilic proteins. The 29 R2R3-MYB proteins were acidic amino acids with isoelectric points less than 7.0. The remaining 28 proteins with isoelectric points greater than 7.0 were basic amino acids. The instability index was 42.93 (PmMYB56) ~ 71.40 (PmMYB30). Details of physicochemical properties and the length distribution of the R2R3-MYB proteins of Masson pine are shown in Table S2 of the Supplementary Material.
In addition, we found that the R2R3-MYB transcription factors of Masson pine were mainly located in the nucleus and mostly without signal peptides. The PmMYB protein secondary structure was mainly random coils (Table S3), indicating that random coils are the main component of PmMYB protein structure, followed by α-helices and relatively few extension chains and β-angles. NetPhos3.1 was used to predict the PmMYB proteins’ phosphorylation sites. The results showed (Table S4) that serine, tyrosine and threonine phosphorylation sites were present in each gene, and the number of phosphorylation sites was serine > threonine > tyrosine.

3.3. Structure Analysis and Motif Composition of Masson Pine R2R3-MYB TF

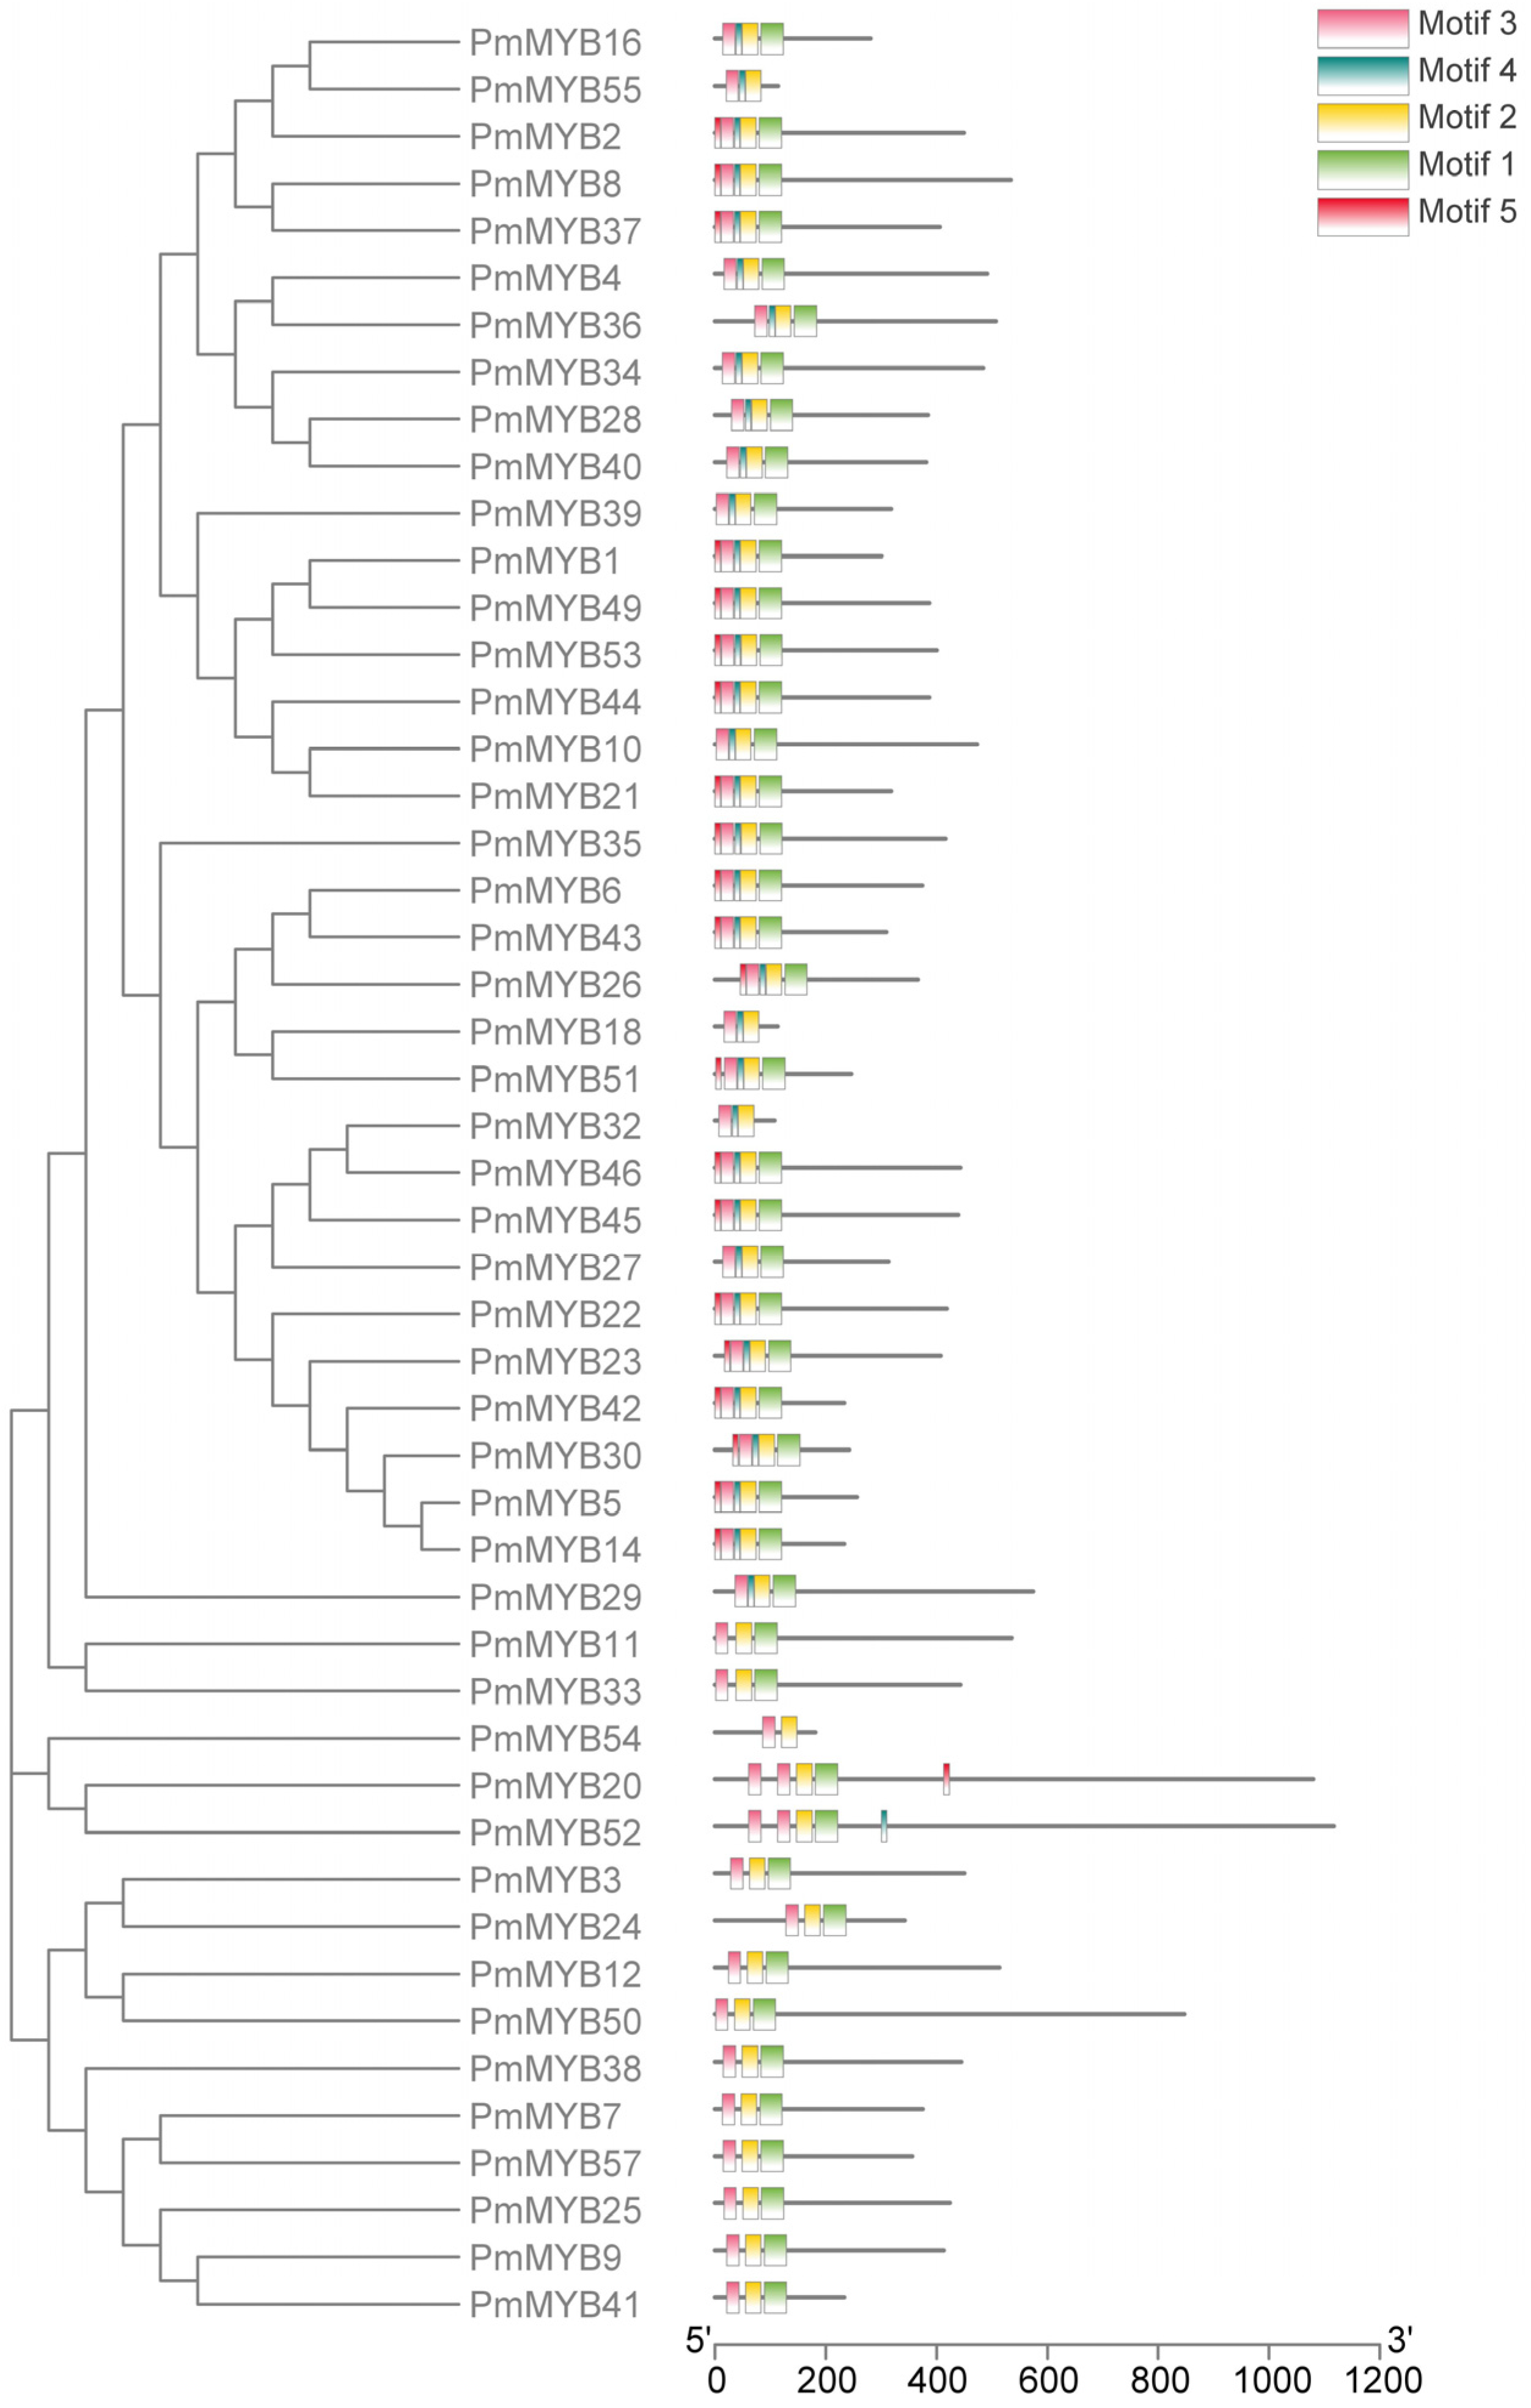
Based on the identification results of Section 3.1, we selected 49 PmMYBs containing the complete R2R3 structural domain for conserved motif distribution analysis (Figure 2). The results showed five different conserved motifs (Table S1 in supplementary material). All conserved motifs were distributed at the c-terminus of MYB proteins and belonged to the c-terminal conserved structural domain. SMART analysis showed that Motif 1, Motif 2 and Motif 4 were SANT (SWI3, ADA2, N-COR and TFIIIB B) structures, while no functional structural information was obtained for Motif 5 and Motif 3. Motif 1 and Motif 2 were R2 and R3 structural domains, respectively, and there were 47 tf containing Motif 1, accounting for 95.92%. The 45 MYB tf of Motif 2 accounted for 91.84%. In addition, only 15 MYB TF had Motif 3, 5 MYB TF had Motif 4, and 15 MYB TF had Motif 5. In general, although R2R3-MYB genes in the same subclade share common motif characteristics, this does not prove that members of the same subclade have the same or opposite functions.

3.4. Phylogenetic Relationship of Masson Pine R2R3-MYBs

To predict the biological functions of the R2R3-MYB transcription factors of Masson pine, we constructed a phylogenetic tree of Populus trichocarpa and Masson pine R2R3-MYB transcription factors together. As seen in Figure 3, 49 Masson pine R2R3-MYB TF were classified into 24 subgroups according to the classification of Populus trichocarpa R2R3-MYBs [29], and the remaining eight were not classified into taxonomic groups, accounting for 14.29%. This is consistent with previous results of structural analysis of R2R3-MYB proteins in Masson pine.

3.5. Expression Profile Analysis of Masson Pine R2R3-MYBs

We produced a heat map of the R2R3-MYB genes, derived from RNA-Seq of drought, and divided its expression levels into two groups: rising and falling. As shown in Figure 4, 11 of these genes (PmMYB4, PmMYB12, PmMYB8, PmMYB33, PmMYB40, PmMYB29, PmMYB27, PmMYB34, PmMYB43, PmMYB23, and PmMYB37) showed an increasing trend. These results suggest that these genes are responsive to drought in Masson pine. We chose PmMYB4 as a representative for our study.

3.6. Expression Profiles of PmMYB4 under Drought Stress

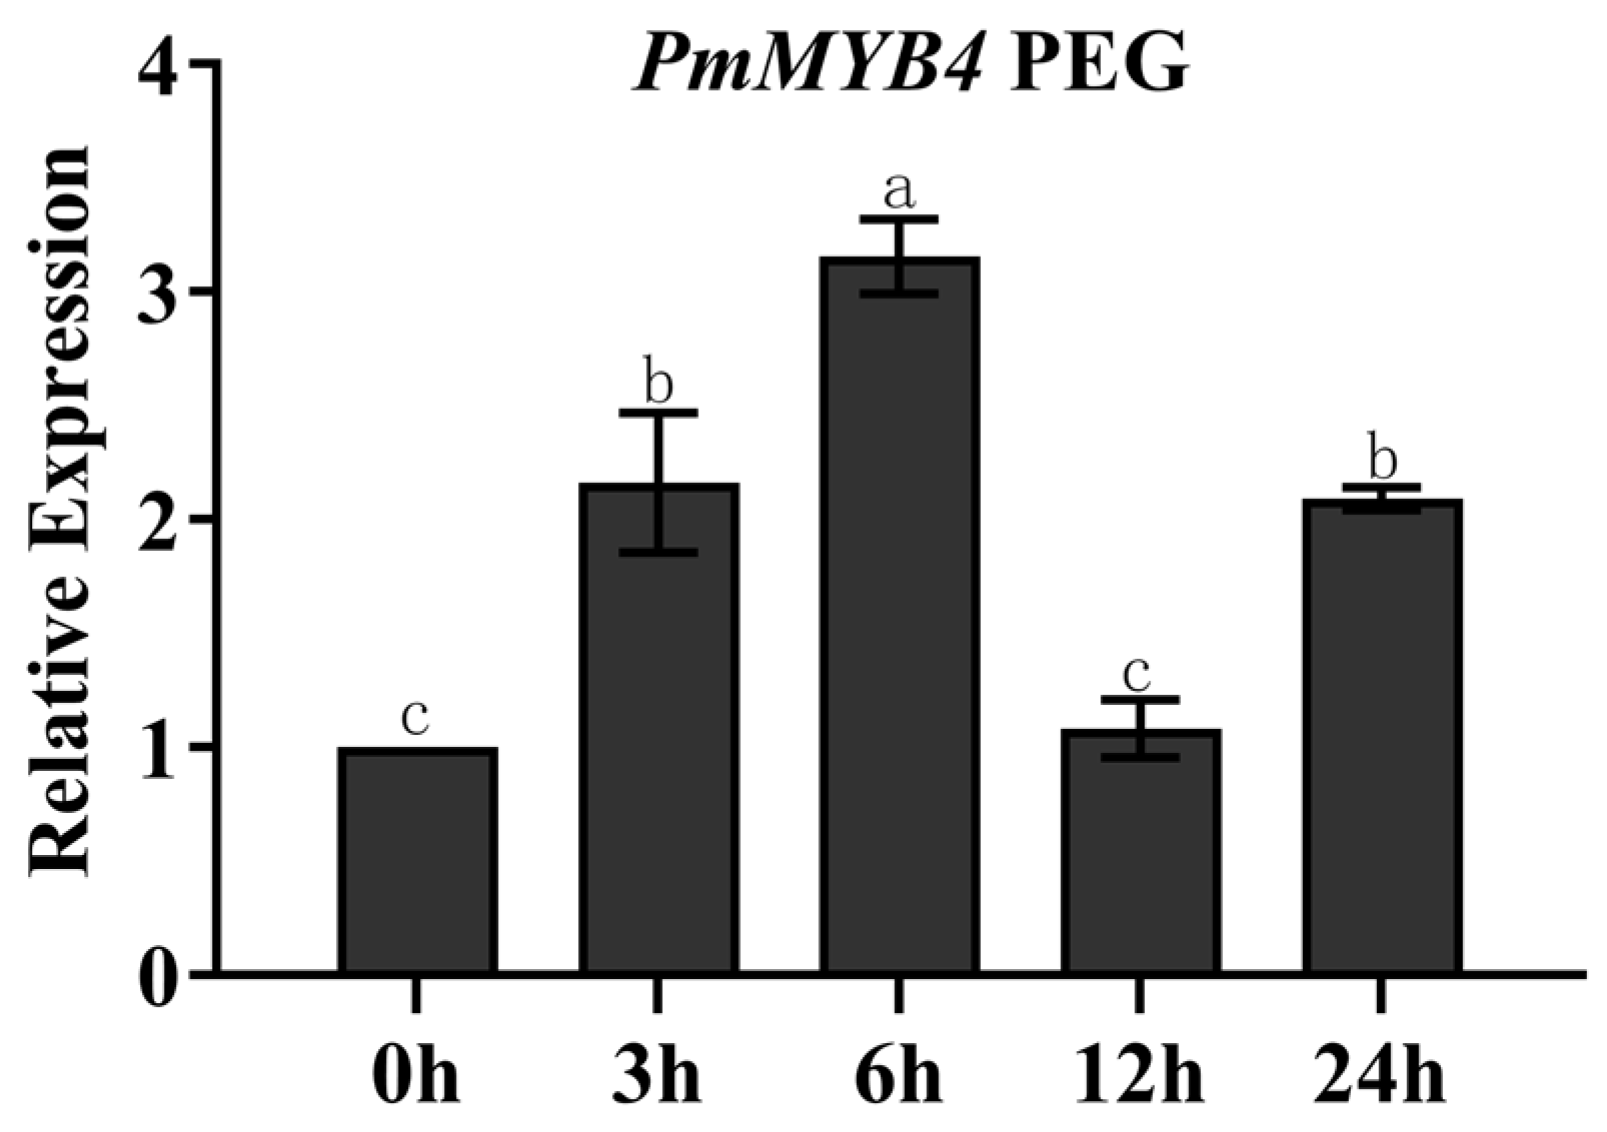
Drought stress was simulated using the 15% PEG6000 treatment. The results showed (Figure 5) that the expression level of PmMYB4 had a trend of up-regulation followed by down-regulation, peaking at 6 h, which was 3.15-fold up-regulation compared to 0 h. These results indicate that our RNA sequence data are reliable.

3.7. Subcellular Localization of PmMYB4

To understand the spatial information of PmMYB4 protein in cells, the control vector 2×35S::GFP and the experimental vector 2×35S::PmMYB4-GFP were structured and transfected into tobacco leaves by Agrobacterium infestation. The results (Figure 6) indicate that the gene signal comes from the nucleus and there is no fluorescent signal in the cytoplasm and cell membrane, indicating that the protein worked in the nucleus, consistent with the previously predicted subcellular localization.

3.8. Response of PmMYB4 to Salt and Drought Stress

The recombinant pET28a-PmMYB4 and the control pET28a were inoculated in four different LB solid media. The results (Figure 7) showed that the growth status of the vector in LB solid medium was consistent with that of the recombinant bacteria under the treatment of 800 mM D-mannitol, 20% PEG6000 and 400 mM NaCl, while the number of recombinant bacteria was significantly higher than that of the control bacteria.

3.9. The Expression Patterns of PmMYB4 in Masson Pine

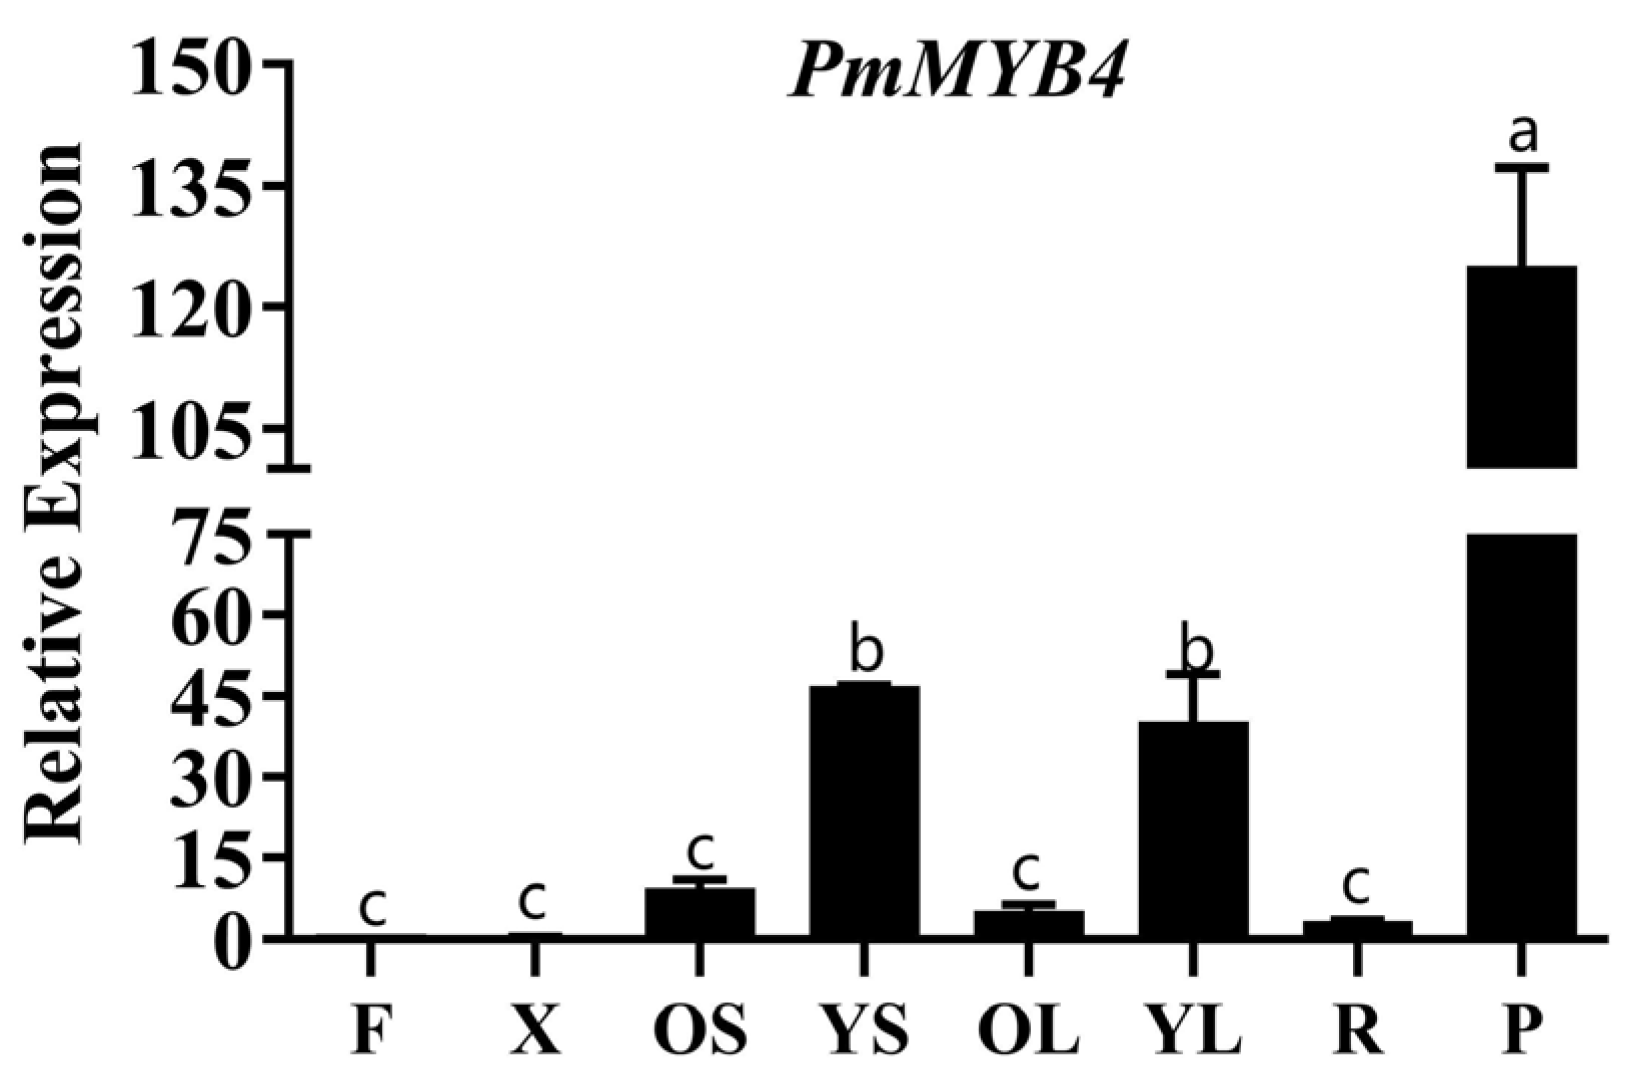
To investigate the tissue specificity of PmMYB4, the expression levels of the PmMYB4 gene were examined in 15-year-old Masson pine flowers (F), roots (R), xylem (X), phloem (P), old leaves (OL), young leaves (YL), old stems (OS) and young stems (YS) by qRT-PCR (Figure 8). The expression of the PmMYB4 gene was highest in the phloem, 120-fold higher than in the flowers, followed by the young stems and young leaves. The PmMYB4 gene expressed was lower in old leaves, old stem and roots, and almost absent in xylem.

3.10. Promoter Cis-Acting Element Analysis of PmMYB4

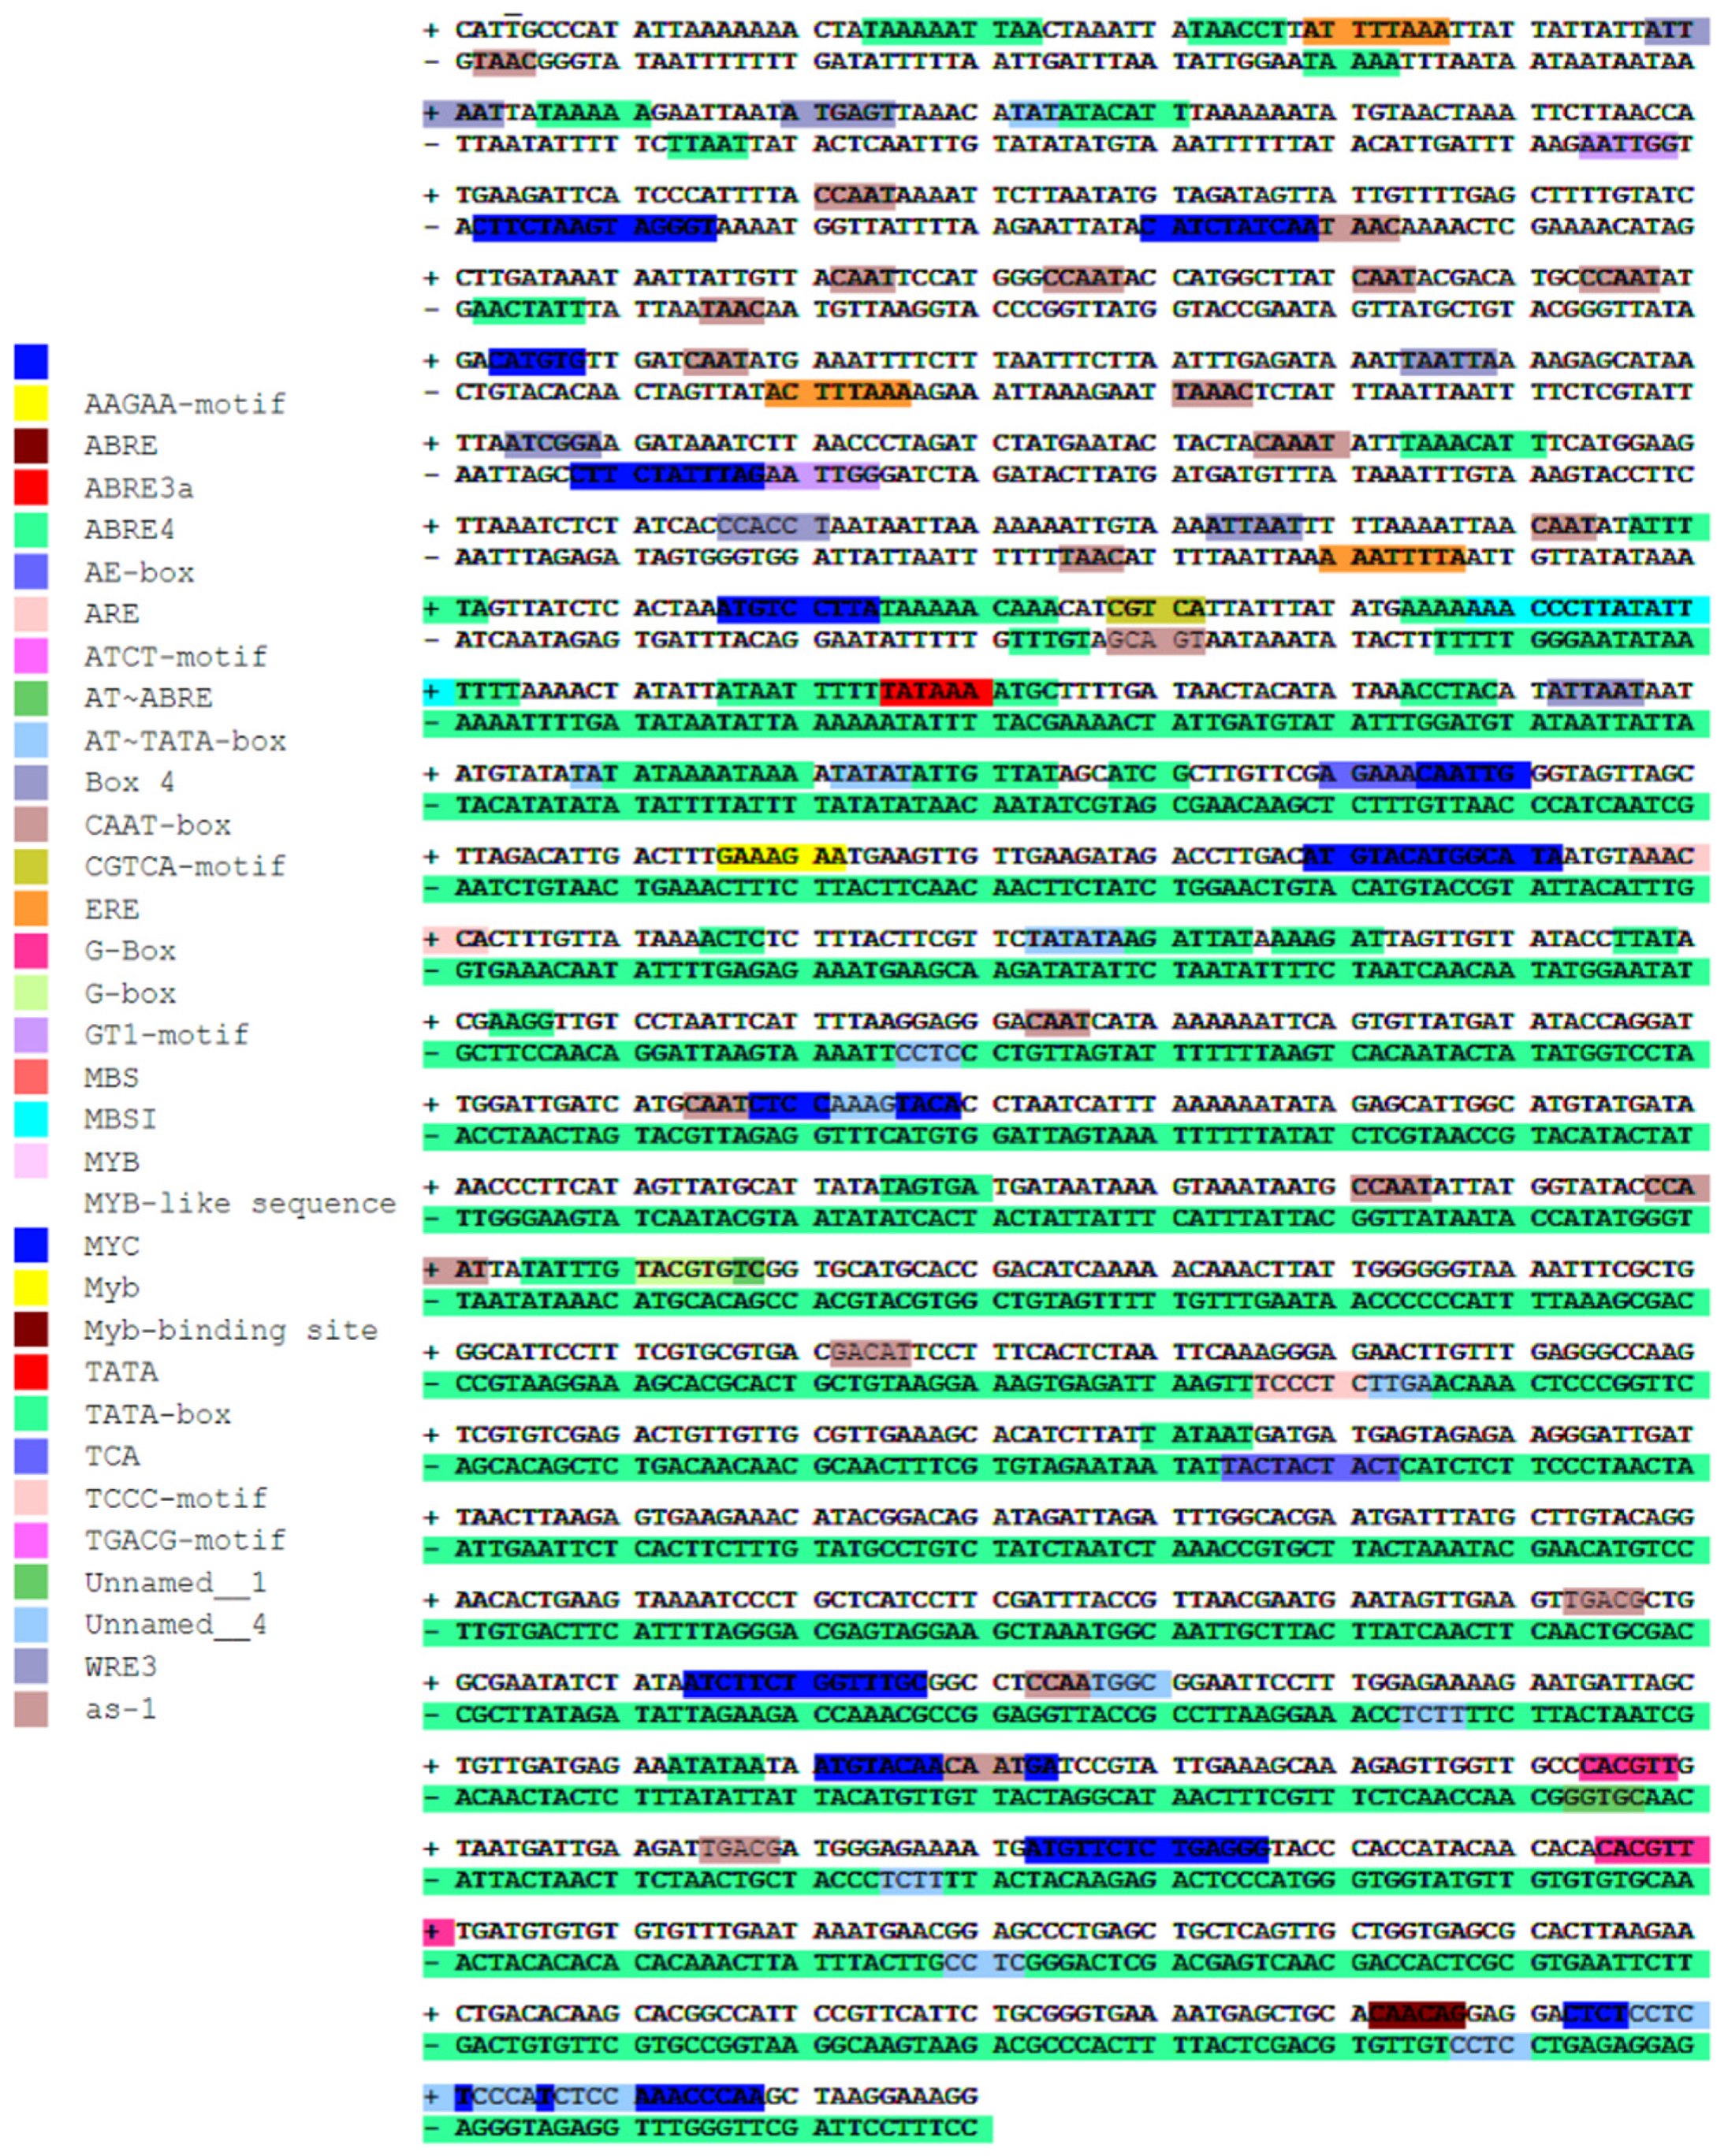
The obtained promoter was analyzed using PlantCARE and PLACE online tools. As shown in Figure 9, the sequence contains 33 cis-acting elements in addition to the CAAT-box (40 sites) and TATA-box (77 sites) core elements typical of eukaryotic promoters. It also contains the optical response element G-box, the cis-acting element essential for anaerobic induction (ARE), cis-acting element for MeJA response (CGTCA-motif, TGACG-motif), cis-acting element for ABA response (ABRE), element associated with phenylpropanoid synthesis (SNBE), and MYB binding site for flavonoid synthesis gene regulation (MBSI). Thus, this suggests that the regulation of PmMYB4 promoter expression may be regulated by photoperiodic and phytohormone signaling, and involved in the regulation of plant stress resistance.

3.11. Expression Profiles of PmMYB4 under Abiotic Stress

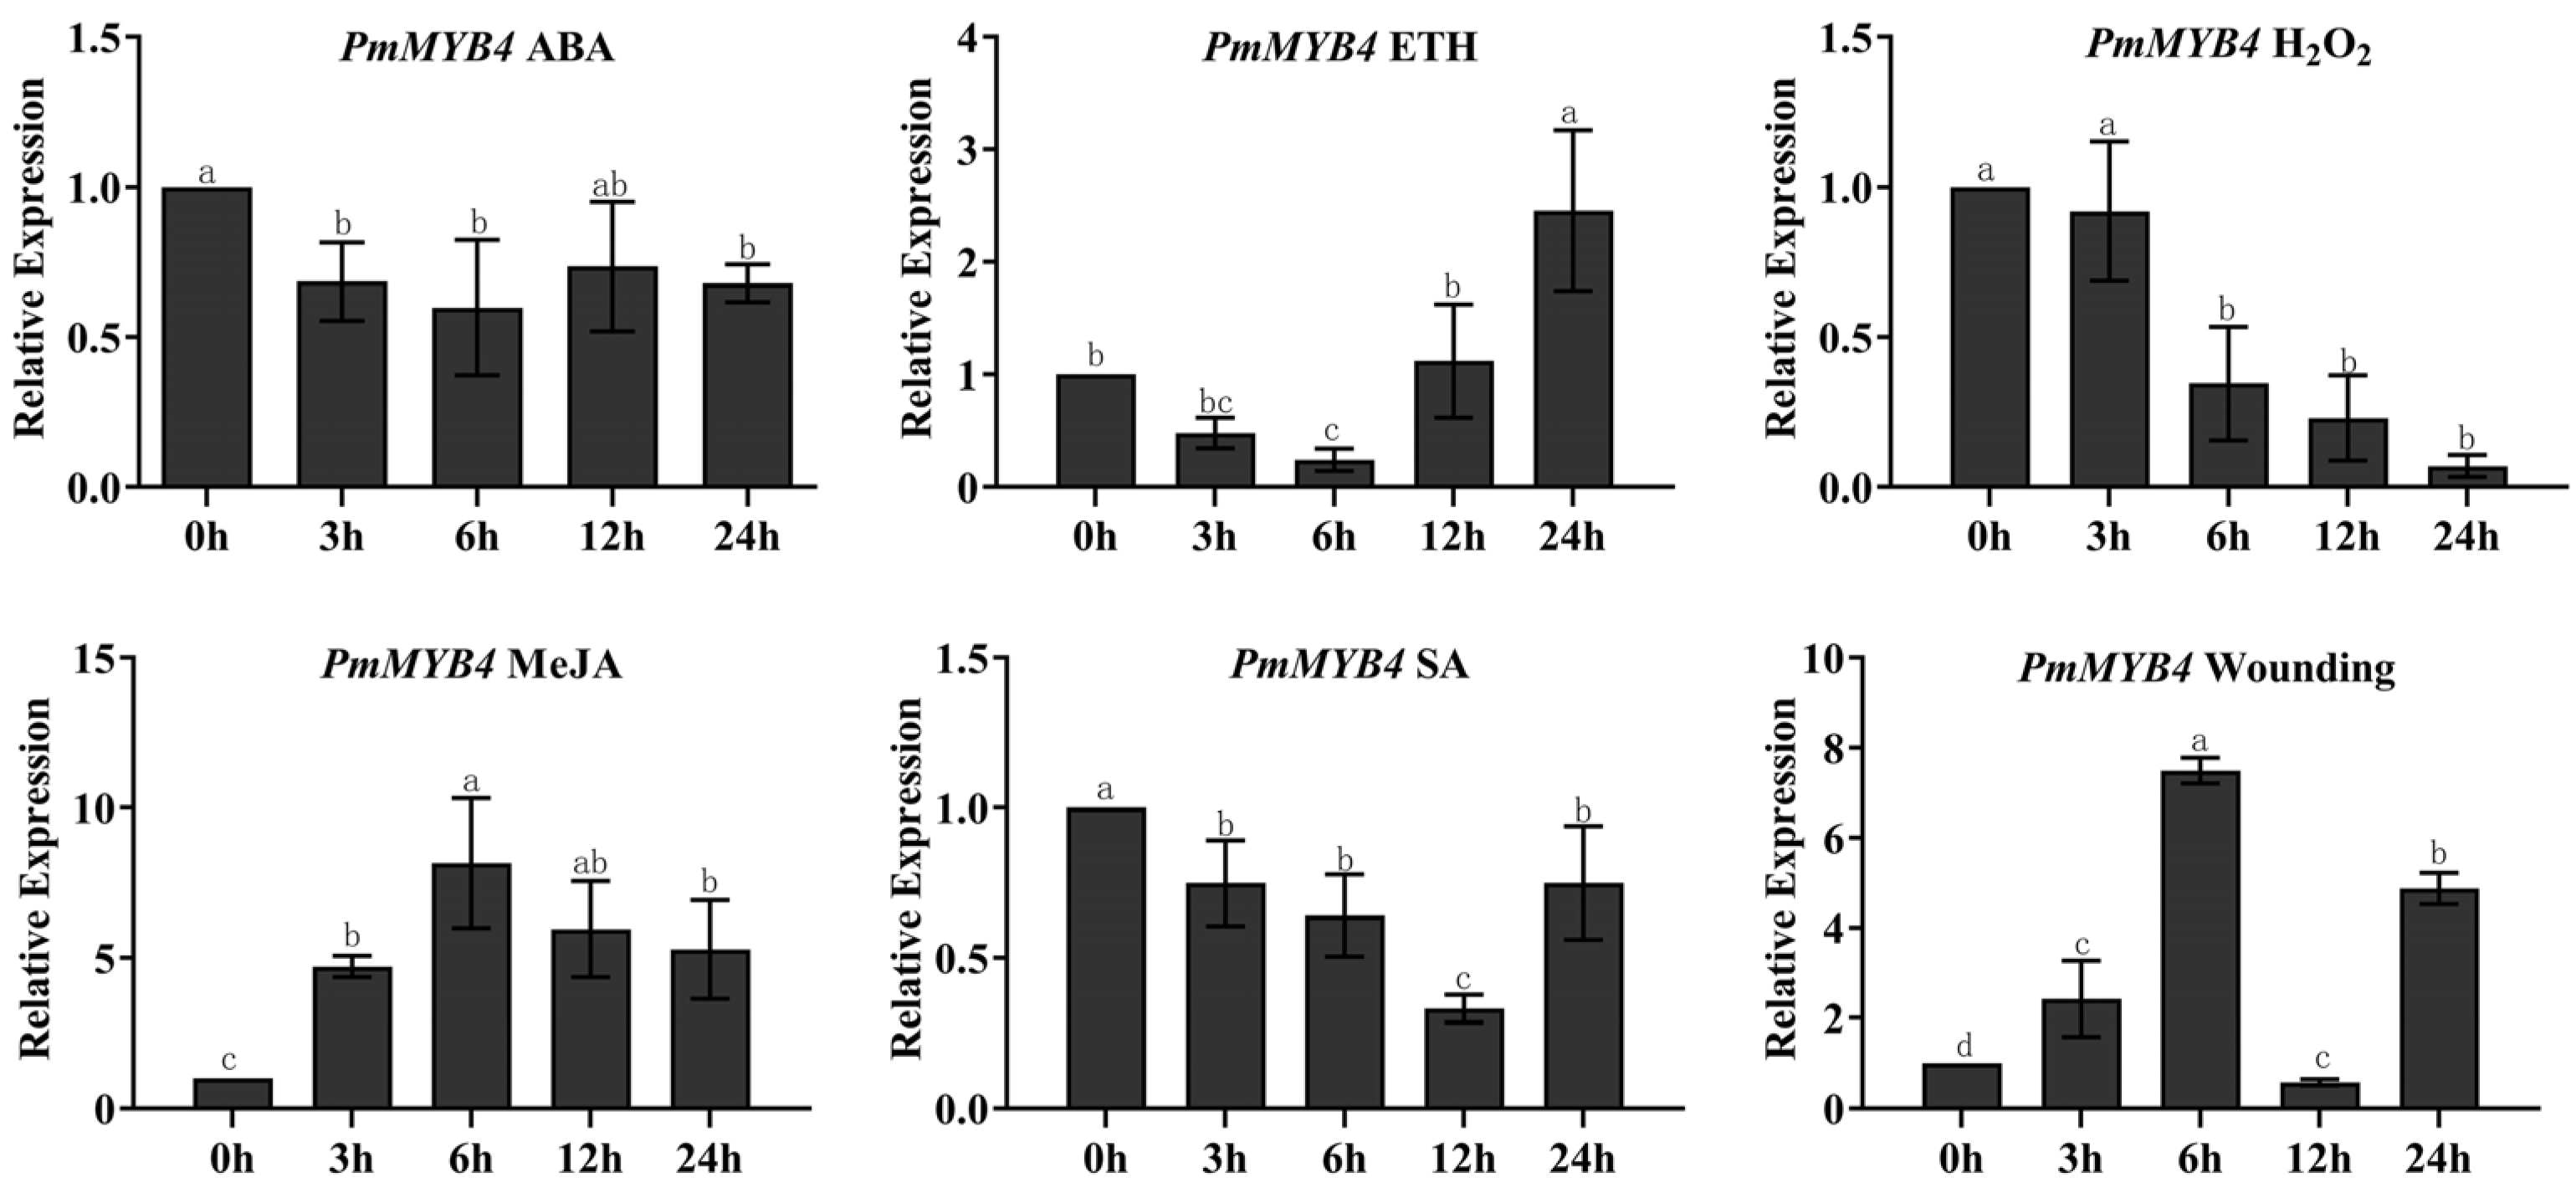
The corresponding abiotic stresses were applied to 2-year-old Masson pine under the analysis of cis-acting elements of the promoter. As shown in Figure 10, the PmMYB4 gene showed a down-regulation trend under ABA treatment within 24 h. After ETH treatment, the PmMYB4 expression exhibited a trend of first down-regulation and then up-regulation, peaking at 24 h, which was 1.52 times higher than that at 0 h. The PmMYB4 gene expression was down-regulated under SA treatment and up-regulated with increasing stress time at 24 h, but not greater than 1. The PmMYB4 expression was significantly down-regulated under H2O2 stress induction. After injury stress treatment, the PmMYB4 expression was first up-regulated and then down-regulated, with a peak at 6 h, which was 6.48 times higher than that at 0 h.

4. Discussion

The R2R3-MYB TF is considered to be a pivotal transcription factor in plants [41] for response to abiotic stresses. It has been reported that a large variety of plants contain 70~200 R2R3-MYB TF [29,42]. In this study, a total of 49 R2R3-MYBs were authenticated in four transcriptome data and the number of PmMYBs was lower than in Glycine max (244) [43], Populus trichocarpa (192) (167) [44], Linum usitatissimum (167) [45], Oryza sativa (102) [46], Prunus salicina (96) [47] and Ananas comosus (94) [48]. These results indicate that the number of R2R3-MYB genes varies widely among species. Furthermore, in terms of structural domain structure, not all MYB proteins have a complete R2R3-MYB structural domain, which is consistent with the findings of Song [49].
The physicochemical properties of 49 R2R3-MYB proteins of Masson pine were analyzed, and they were found to be hydrophobic proteins with large instability coefficients and unstable proteins, of which 29 R2R3-MYB proteins were acidic proteins. The subcellular localization results showed that R2R3-MYB is mainly located in the nucleus, indicating that R2R3-MYB mainly functions in the nucleus, also consistent with the findings of Song [50]. Most of them do not contain transmembrane structures and signal peptides, suggesting that their main working location is in the nucleus. The conserved motifs of Vaccinium R2R3-MYB genes [51] were reported to be essentially the same for the same subfamily of genes, and this was further supported by the conserved motif analysis in this study. Primary structures in subgroups are strongly correlated with the biological functions of proteins, so identifying homologous genes among plants based on phylogenetic relationships can help predict gene function [52]. A phylogenetic tree was constructed together with Populus trichocarpa [29] R2R3-MYB with the aim of further studying the biological functions of R2R3-MYB in Masson pine. All PmMYB proteins were clustered into functional groups of Populus trichocarpa, which were divided into 24 subfamilies. As shown in Table S5, members of subpopulation S1 are response to biotic and abiotic stresses [31], members of subpopulation S5 are involved in anthocyanin biosynthesis [53], members of subpopulation S9a are involved in trichome development [54], and members of subpopulations S13 and S37 play key roles in lignin biosynthesis [29,55], among others. Therefore, it is hypothesized that R2R3-MYBs in these subgroups of Masson pine also have similar functions.
The ABA is an important drought stress messenger molecule. Under drought stress, plant ABA concentration increases and the root system transmits signals to aboveground leaves and stems, regulating stomatal closure and reducing transpiration; ABA can participate in the plant drought response process by inducing differential expression of downstream drought genes. The ABA-dependent signaling pathway initiates cis-acting elements containing similar elements mainly through binding to NAC, MYB, MYC, and ABRE downstream gene expression to counteract drought; for example, OsMYB2 [56], CcMYB-R48 [57] and PtrMYB94 [18] regulate downstream gene responses that mediate plant responses to ABA and drought. The MYB has been demonstrated to be related to drought stress in plants [58]. Under adversity stress, 42 MYB genes showed transient up-regulated or down-expression in wheat [59], indicating that their gene expression levels are temporally and spatially specific under adversity. In the present study, there were a grand total of 18 R2R3-MYB genes performed as upward or downward adjustment, among which the expression of PmMYB4 was particularly significant, so we selected the PmMYB4 gene for analysis. We found ABA-responsive elements in the promoter of this gene along with MYB and MYC elements, indicating that in gene expression, it received ABA regulation. The above conclusion is further supported by the significant down-regulation of the gene in ABA hormone stress treatment. Thus, PmMYB is engaged in the ABA-dependent regulation of signaling pathways.
However, not all drought genes are regulated by ABA and a considerable number of drought genes are not controlled by ABA, thus drought signaling pathways can be broadly classified into ABA-dependent and ABA-independent [60] based on whether they depend on ABA signaling pathways. The ABA-independent signaling pathways, on the other hand, initiate downstream gene expression through DRE and ABRE elements [61]; for example, OsM1D1 [61] and OsMYB6 [62] regulate drought-related genes, but are not responsive to exogenous ABA. Coincidentally, we also found ABRE elements in the PmMYB4 promoter, and therefore hypothesized that PmMYB4 genes are jointly involved in non-ABA-dependent and ABA-dependent drought stress response signaling pathways. In addition, extensive research has indicated that lignin deposition also enhances drought resistance in plants. The tube walls of drought-tolerant plants are thicker than those of less drought-tolerant plants [63]. Both MdMYB88 and MdMYB124 can enhance drought adaptation in apple plants through improved lignin deposition [64]. Coincidentally, Yao’s study showed that PmMYB4 is homologous to AtMYB46, and overexpression of PmMYB4 in tobacco leads to xylem thickening and ectopic lignin deposition [65]. While MYB46 has also been shown to be associated with salt tolerance in apple [66], birch MYB46 can cope with drought and salt stresses [67], suggesting a potential function of MYB46 under stress induction. By analyzing the expression of PmMYB4 in different tissues, it was found that PmMYB4 expression was highest in the phloem, followed by young stems and young leaves, which may be related to the involvement of PmMYB4 in lignin deposition. This result can also support the above conclusion, indicating that PmMYBs are involved in drought regulation in multiple ways.
After constructing the prokaryotic expression vector, the gene was initially characterized using E. coli, which has the advantages of short time and easy operation [68]. Gong [69] constructed a Lavandula pET28a DXS expression vector and was successfully expressed in TransB (DE3). To further investigate the role of the PmMYB4 gene in drought tolerance, TransB/PET28a PmMYB4 was successfully induced in this study. The growth condition of both bacteria was similar on normal LB solid plates, while the recombinant strain was stronger on 800 mM D-mannitol, 20% PEG6000 and 400 mM NaCl in LB solid plates. This shows that, under drought stress, the PmMYB4 gene can promote the growth of E. coli. These results provide further evidence that R2R3-MYB transcription factors play a function in drought response. In addition, it showed positive regulation in response to drought stress, which is consistent with the results of abiotic stress response experiments. It is hypothesized that this gene plays a part in the stress response of Masson pine.
Plants are never homogeneous in their resistance to adversity, but rather have a diverse and complex regulatory network [70]. Under drought stress conditions, reactive oxygen content increased more in poorly tolerant plants, and overexpression lines were more drought resistant than wild type [71]. In apple, overexpression of MdMYB46 could improve salt tolerance. Different MYB46 knockout lines were able to maintain normal secondary growth, but pathogen-induced Ep5C gene expression levels were increased in these mutants, and Arabidopsis exhibited greater resistance to Boreal fungus [71]. These results seem to prove the existence of different regulatory modes of MYB46 in response to stress. In addition, MeJA, anaerobic induction and abiotic stress-related elements are present in the PmMYB4 promoter, and the expression of the PmMYB4 gene was significantly altered after MeJA, SA, ETH and H2O2 treatment, indicating that the gene was also involved in other stress regulatory networks. In addition, the promoter of this gene contains MBSI, the MYB binding site regulated by the flavonoid biosynthetic gene. These results seem to demonstrate that in response to stress, PmMYB4 has different regulatory modes, further suggesting that the stress modulation network of the MYB gene family is complex and diverse, with multiple modes interacting to counteract stress.

5. Conclusions

In the transcriptome of Masson pine, 49 R2R3-MYB transcription factors were characterized and divided into 24 sub-groups. They contained complete R2 and R3 structures, and more than 95.92% of R2R3-MYB TF contained conserved motif SANT structure. Transcriptome analysis showed that 18 genes were responsible for drought stress in Masson pine, PmMYB4 being one of them, which could promote the growth of recombinant bacteria in a drought environment. The expressed of PmMYB4 was dramatically increased by PEG6000 under drought stress. The expression of PmMYB4 was found in many parts of Masson pine, and the highest amount of expression was observed in the phloem. The PmMYB4 was triggered by drought, ABA, MeJA and SA. These results suggest that PmMYB4 is implicated in the response to drought stress, other abiotic stresses and exogenous hormone responses in Masson pine.

Supplementary Materials

The following supporting information can be downloaded at: https://www.mdpi.com/article/10.3390/f14020410/s1.

Author Contributions

Conceptualization, X.L. and S.Y.; data curation, X.L.; formal analysis, X.L.; funding acquisition, K.J.; investigation, X.L.; methodology, K.J., X.L., S.Y. and P.C.; software, P.C.; validation, X.L.; visualization, Y.H. and C.Z.; writing—original draft, X.L.; writing—review and editing, K.J., D.W. and R.H.A. All authors have read and agreed to the published version of the manuscript.

Funding

This research was supported by the National Key R&D Program of China (2022YFD2200202) and the project was funded by the Priority Academic Program Development of Jiangsu Higher Education Institutions (PAPD).

Institutional Review Board Statement

Not applicable.

Informed Consent Statement

Not applicable.

Data Availability Statement

All data are reported in this manuscript.

Acknowledgments

The authors appreciate the support of Sheng Yao, Peizhen Chen, Yanqing Hou, Dengbao Wang, Ye Yang and Chi Zhang of the College of Forestry of Nanjing Forestry University.

Conflicts of Interest

The authors declare no conflict of interest.

References

  1. Niu, Y.L.; Jiang, X.M.; Xu, X.Y. Research progress of plant transcription factor MYB gene family. Mol. Plant Breed 2016, 14, 2050–2059. [Google Scholar]
  2. Martin, C.; Javier, P.A. MYB transcription factors in plants. Trends Genet 1997, 13, 67–73. [Google Scholar] [CrossRef] [PubMed]
  3. Du, H.; Tang, X.-F.; Liu, L.; Yang, W.-J.; Wu, Y.-M.; Huang, Y.-B.; Tang, Y.-X. Cloning and functional identification of the two MYB transcription factors GmMYBJ6 and GmMYBJ7 in soybean. Acta Agron. Sin. 2008, 34, 1179–1187. [Google Scholar] [CrossRef]
  4. Stracke, R.; Werber, M.; Weisshaar, B. The R2R3-MYB gene family in Arabidopsis thaliana. Curr. Opin Plant Biol. 2001, 4, 447–456. [Google Scholar] [CrossRef]
  5. Katiyar, A.; Smita, S.; Lenka, S.; Rajwanshi, R.; Chinnusamy, V.; Bansal, K. Genome-wide classification and expression analysis of MYB transcription factor families in rice and Arabidopsis. BMC Genomics 2012, 13, 544. [Google Scholar] [CrossRef] [Green Version]
  6. Liu, L.; Du, H.; Tang, X.F.; Wu, Y.M.; Tang, Y.X. The roles of MYB transcription factors on plant defense responses and its molecular mechanism. Yi Chuan 2008, 10, 1265–1271. [Google Scholar] [CrossRef]
  7. Zhu, J.K. Abiotic stress signaling and responses in plants. Cell 2016, 167, 313–324. [Google Scholar] [CrossRef] [Green Version]
  8. Mohammadi, H.; Amirikia, F.; Ghorbanpour, M.; Fatehi, F.; Hashempour, H. Salicylic acid induced changes in physiological traits and essential oil constituents in different ecotypes of Thymus kotschyanus and Thymus vulgaris under well-watered and water stress conditions. Ind. Crops Prod. 2019, 129, 561–574. [Google Scholar] [CrossRef]
  9. Wang, R.K.; Cao, Z.H.; Hao, Y.J. Overexpression of a R2R3 MYB gene MdSIMYB1 increases tolerance to multiple stresses in transgenic tobacco and apples. Physiol. Plantarum 2014, 150, 76–87. [Google Scholar] [CrossRef]
  10. Wei, Q.H.; Zhang, F.; Sun, F.S.; Luo, Q.C.; W, R.B. A wheat MYB transcriptional repressor TaMyb1D regulates phenylpropanoid metabolism and enhances tolerance to drought and oxidative stresses in transgenic tobacco plants. Plant Sci. 2017, 265, 112–123. [Google Scholar] [CrossRef]
  11. Cui, J.; Ning, J.; Zhou, X.; Hou, X.; Yang, G.; Meng, J.; Luan, Y. Tomato MYB49 enhances resistance to Phytophthora infestans and tolerance to water deficit and salt stress. Planta 2018, 248, 1487–1503. [Google Scholar] [CrossRef] [PubMed]
  12. Gao, F.; Zhou, J.; Deng, R.Y.; Zhao, H.X.; Li, C.L.; Chen, H.; Suzuki, T.; Park, S.U.; Wu, Q. Overexpression of a tartary buckwheat R2R3-MYB transcription factor gene, FtMYB9, enhances tolerance to drought and salt stresses in transgenic Arabidopsis. J. Plant. Physiol. 2017, 214, 81–90. [Google Scholar] [CrossRef] [PubMed]
  13. Huang, Y.; Zhao, H.; Fei, G.; Yao, P.; Deng, R.; Li, C.; Hui, C.; Qi, W. A R2R3-MYB transcription factor gene, FtMYB13, from Tartary buckwheat improves salt/drought tolerance in Arabidopsis. Plant Physiol. Bioch. 2018, 132, 238–248. [Google Scholar] [CrossRef]
  14. Alexander, R.D.; Charlotte, W.N.; Morris, P.C. The barley transcription factor HvMYB1 is a positive regulator of drought tolerance. Plant Physiol. Bioch. 2019, 142, 246–253. [Google Scholar] [CrossRef] [PubMed]
  15. Wu, J.; Jiang, Y.; Liang, Y.; Chen, L.; Chen, W.; Cheng, B. Expression of the maize MYB transcription factor ZmMYB3R enhances drought and salt stress tolerance in transgenic plants. Plant Physiol. Bioch. 2019, 137, 179–188. [Google Scholar] [CrossRef] [PubMed]
  16. Jiang, Y.; Luo, Q.; Jiang, C.Y.; Sun, G.J.; Nie, Q. Function analysis of tobacco transcription factor NtMYB4a in response to drought, low temperature and methyl jasmonate stress. Crop Sci. 2021, 35, 43–49. [Google Scholar]
  17. Yuan, Y.; Qi, L.; Yang, J.; Wu, C.; Liu, Y.; Huang, L. A Scutellaria baicalensis R2R3-MYB gene, SbMYB8, regulates flavonoid biosynthesis and improves drought stress tolerance in transgenic tobacco. Plant Cell, Tissue Organ Cult. 2015, 120, 961–972. [Google Scholar] [CrossRef]
  18. Fang, Q.; Wang, X.; Wang, H.; Tang, X.; Luo, K. The poplar R2R3 MYB transcription factor PtrMYB94 coordinates with abscisic acid signaling toimprove drought tolerance in plants. Tree Physiol. 2020, 40, 46–59. [Google Scholar] [CrossRef]
  19. Bai, Y.; Zhou, Y.; Gong, J. Physiological mechanisms of the tolerance response to manganese stress exhibited by Pinus massoniana, a candidate plant for the phytoremediation of Mn-contaminated soil. Environ. Sci. Pollut. Res. 2021, 28, 45422–45433. [Google Scholar] [CrossRef]
  20. Ran, J. Transcriptome analysis of needle and root of Pinus massoniana in response to continuous drought stress. Plants 2021, 10, 769. [Google Scholar]
  21. Du, M.F.; Ding, G.J.; Zhao, X.Z. Responses to continuous drought stress and drought resistance of different Masson pine families. Scientia Silvae Sinicae 2017, 53, 21–29. [Google Scholar]
  22. Quan, W.X.; Ding, G.J. Dynamic of volatiles and endogenous hormones in Pinus massoniana needles under drought stress. Scientia Silvae Sinicae 2017, 53, 49–55. [Google Scholar]
  23. Wang, Q.Z.; Shang, X.W.; Tang, W.W.; Li, H.P.; Wen, X.P.; Fan, F.H. Cloning and low phosphorus tolerance function analysis of PmWRKY164 from Pinus massoniana. Chin. J. Agric. Biotechol. 2019, 27, 1016–1024. [Google Scholar]
  24. Wu, F.; Sun, X.B.; Zou, B.Z.; Zhu, P.H.; Ji, K.S. Transcriptional analysis of Masson pine (Pinus massoniana) under high CO2 stress. Genes 2019, 10, 804. [Google Scholar] [CrossRef] [Green Version]
  25. Wang, X.F.; He, W.L.; Cai, W.J.; Ruan, Q.Q.; Pan, T.; Ji, K.S. Analysis on transcriptome sequenced for Pinus massoniana. Mol. Plant Breed. 2013, 11, 385–392. [Google Scholar]
  26. El-Gebali, S.; Mistry, J.; Bateman, A.; Eddy, S.R.; Luciani, A.; Potter, S.C.; Qureshi, M.; Richardson, L.J.; Salazar, G.A.; Smart, A.; et al. The Pfam protein families database in 2019. Nucleic Acids Res. 2019, 47, D1. [Google Scholar] [CrossRef]
  27. Chen, Z.; Hu, F.C.; Ruan, C.C.; Fan, H.Y.; Guo, L.J.; Zhang, Z.L. Bioinformatics and gene expression analysis of Pineapple R2R3- MYB gene family. Chin. J. Trop. Crops 2019, 40, 1958–1971. [Google Scholar]
  28. Fan, F.; Wang, Q.; Wen, X.; Ding, G. Transcriptome-wide identification and expression profiling of Pinus massoniana MYB transcription factors responding to phosphorus deficiency. J. For. Res. 2020, 31, 11. [Google Scholar] [CrossRef]
  29. Blom, N.; Gammeltoft, S.; Brunak, S. Sequence- and structure-based prediction of eukaryotic protein phosphorylation sites. J. Mol. Biol. 1999, 5, 1351–1362. [Google Scholar] [CrossRef] [PubMed]
  30. Zhou, F.; Chen, Y.; Wu, H.; Yin, T. Genome-wide comparative analysis of R2R3 MYB gene family in Populus and Salix and identification of male flower bud development-related genes. Front. Plant Sci. 2021, 12, 721558. [Google Scholar] [CrossRef] [PubMed]
  31. Dubos, C.; Stracke, R.; Grotewold, E.; Weisshaar, B.; Martin, C.; Lepiniec, L. MYB transcription factors in Arabidopsis. Trends Genet. 2010, 15, 573–581. [Google Scholar] [CrossRef] [PubMed]
  32. Yang, Z. PAML 4, Phylogenetic analysis by maximum likelihood. Mol. Biol. Evol. 2007, 24, 1586–1591. [Google Scholar] [CrossRef] [Green Version]
  33. Letunic, I.; Bork, P. Interactive Tree Of Life (iTOL) v5: An online tool for phylogenetic tree display and annotation. Nucleic Acids Res. 2021, 49, W1. [Google Scholar] [CrossRef] [PubMed]
  34. Zhu, P.H.; Ma, Y.Y.; Zhu, L.Z.; Chen, Y.; Li, R.; Ji, K.S. Selection of suitable reference genes in Pinus massoniana Lamb. under different abiotic stresses for qPCR normalization. Forests 2019, 10, 632. [Google Scholar] [CrossRef] [Green Version]
  35. Livak, K.; Schmittgen, T. Analysis of relative gene expression data using real-time quantitative PCR and the 2−ΔΔCt method. Methods. 2001, 25, 402–408. [Google Scholar] [CrossRef]
  36. Froidure, S.; Canonne, J.; Danie, X.; Jauneau, A.; Brièr, C.; Roby, D.; Rivas, S.; Baulcombe, D.C. AtsPLA2-alpha nuclear relocalization by the Arabidopsis transcription factor AtMYB30 leads to repression of the plant defense response. Proc. Natl. Acad. Sci. USA 2010, 107, 15281–15286. [Google Scholar] [CrossRef] [PubMed] [Green Version]
  37. Zhao, C.L.; Peng, L.Y.; Wang, X.; Chen, J.L.; Wang, L.; Chen, H.; Lai, Z.X.; Liu, S.C. Codon bias and evolution analysis of AtGAI in Amaranthus tricolor L. J. China Agric. Univ. 2019, 24, 10–22. [Google Scholar]
  38. Xue, Y.; Wang, B.; Wang, L. Analysis of codon bias of PaCBF1 gene in Prunus armeniaca L. Mol. Plant Breed 2018, 16, 4890–4898. [Google Scholar]
  39. Angov, E. Codon usage, Nature’s roadmap to expression and folding of proteins. Biotechnol. J. 2011, 6, 650–659. [Google Scholar] [CrossRef] [Green Version]
  40. Tuller, T.; Waldman, Y.Y.; Kupiec, M.; Sherman, R.F. Translation efficiency is determined by both codon bias and folding energy. Proc. Natl. Acad. Sci. USA 2010, 107, 3645–3650. [Google Scholar] [CrossRef] [Green Version]
  41. Shen, Y.; Sun, T.; Pan, Q.; Nachaisin, A.; Ning, G. RrMYB5- and RrMYB10-regulated flavonoid biosynthesis plays a pivotal role in feedback loop responding to wounding and oxidation in Rosa rugosa. Plant Biotechnol. J. 2019, 17, 2078–2095. [Google Scholar] [CrossRef] [PubMed] [Green Version]
  42. Yang, X.; Li, J.; Guo, T.; Guo, B.; An, X. Comprehensive analysis of the R2R3-MYB transcription factor gene family in Populus trichocarpa. Ind. Crop. Prod. 2021, 168, 113614. [Google Scholar] [CrossRef]
  43. Du, H.; Yang, S.S.; Liang, Z.; Feng, B.R.; Lei, L.; Huang, Y.B.; Tang, Y.X. Genome-wide analysis of the MYB transcription factor superfamily in Soybean. BMC Plant Biol. 2012, 12, 106. [Google Scholar] [CrossRef] [PubMed] [Green Version]
  44. Wilkins, O.; Nahal, H.; Foong, J.; Campbell, P. Expansion and diversion of the Populus R2R3-MYB family of transcription factors. Plant Physiol. 2009, 149, 981–993. [Google Scholar] [CrossRef] [PubMed] [Green Version]
  45. Tombuloglu, H. Genome-wide identification and expression analysis of R2R3,3R- and 4R-MYB transcription factors during lignin biosynthesis in flax(Linum usitatissimum). Genomics 2019, 112, 782–795. [Google Scholar] [CrossRef]
  46. Chen, Y.H.; Yang, X.Y.; He, K.; Liu, M.H.; Li, J.G.; Gao, Z.F.; Lin, Z.Q.; Zhang, Y.F.; Wang, X.X.; Qiu, X.M.; et al. The MYB transcription factor superfamily of Arabidopsis: Expression analysis and phylogenetic comparison with the rice MYB family. Plant Mol. Biol. 2006, 60, 107–124. [Google Scholar]
  47. Liu, C.Y.; Hao, J.J.; Qiu, M.Q.; Pan, J.J.; He, Y.H. Genome-wide identification and expression analysis of the MYB transcription factor in Japanese plum (Prunus salicina). Genomics 2020, 112, 4875–4886. [Google Scholar] [CrossRef]
  48. Liu, C.Y.; Xie, T.; Chen, C.J.; Luan, A.P.; Long, J.M.; Li, C.H.; Ding, Y.Q.; He, Y.H. Genome-wide organization and expression profiling of the R2R3-MYB transcription factor family in Pineapple (Ananas comosus). BMC Genom. 2017, 18, 503. [Google Scholar] [CrossRef] [Green Version]
  49. Song, W.L.; Xiang, G.S.; Lu, Y.C.; Zhang, G.H.; Yang, S.C.; Zhao, Y. Identification and expression profiling of R2R3-MYB transcription factors in Erigeron breviscapus. CJCMM 2021, 46, 6149–6162. [Google Scholar]
  50. Song, Y.; Liu, H.D.; Zhang, H.J.; Dou, L.D. Analysis of transcriptome and R2R3-MYB transcription factors in blueberry fruit. Yuan Yi Xue Bao 2015, 42, 2383–2394. [Google Scholar]
  51. He, Y.Q.; Zhang, X.Y.; Li, L.Y.; Sun, Z.T.; Li, J.M.; Chen, X.Y.; Hong, G.J. SPX4 interacts with both PHR1 and PAP1 to regulate critical steps in phosphorus status-dependent anthocyanin biosynthesis. New Phytol. 2021, 230, 205–217. [Google Scholar] [CrossRef] [PubMed]
  52. Wu, H.T.; Tian, Y.; Wan, Q.; Fang, L.; Guan, X.Y.; Chen, J.D.; Hu, Y.; Ye, W.X.; Zhang, H.; Guo, W.Z.; et al. Genetics and evolution of MIXTA genes regulating cotton lint fiber development. New Phytol. 2018, 217, 883–895. [Google Scholar] [CrossRef] [PubMed] [Green Version]
  53. Tohge, T.; Nishiyama, Y.; Hirai, M.Y.; Yano, M.; Nakajima, J.I.; Awazuhara, M.; Inoue, E.; Takahashi, H.; Goodenowe, D.B.; Kitayama, M.; et al. Functional genomics by integrated analysis of metabolome and transcriptome of Arabidopsis plants over-expressing an MYB transcription factor. Plant J. 2005, 42, 218–235. [Google Scholar] [CrossRef] [PubMed]
  54. Zhou, J.; Lee, C.; Zhong, R.; Ye, Z.H. MYB58 and MYB63 are transcriptional activators of the lignin biosynthetic pathway during secondary cell wall formation in Arabidopsis. Plant Cell. 2009, 21, 248–266. [Google Scholar] [CrossRef] [PubMed] [Green Version]
  55. Yang, A.; Dai, X.; Zhang, W. A R2R3-type MYB gene, OsMYB2, is involved in salt, cold, and dehydration tolerance in rice. J. Exp. Bot. 2012, 63, 2541–2556. [Google Scholar] [CrossRef] [PubMed] [Green Version]
  56. Zhang, X.Q.; Dong, B.Y.; Song, Z.H.; Du, T.T.; Li, N.; Xue, J.Y.; Cao, H.Y.; Wang, T.Y.; Song, Y.B.; Meng, D.; et al. Identification of MYB-related subfamily genes in Cajanus cajan and functional analysis of CcMYB-R48 under drought stress. J. Agric. Biotechnol. 2022, 30, 1698–1712. [Google Scholar]
  57. Cutler, S.R.; Rodriguez, P.L.; Finkelstein, R.R.; Abrams, S.R. Abscisic acid: Emergence of a core signaling network. Annu. Rev. Plant Biol. 2010, 61, 651–679. [Google Scholar] [CrossRef] [PubMed] [Green Version]
  58. Kawaura, K.; Mochida, K.; Ogihara, Y. Genome-wide analysis for identification of salt-responsive genes in common wheat. Funct. Integr. Genomic. 2008, 8, 277–286. [Google Scholar] [CrossRef] [PubMed]
  59. Kizis, D.; Lumbreras, V.; Pages, M. Role of AP2/EREBP transcription factors in gene regulation during abiotic stress. Febs Lett. 2001, 498, 187–189. [Google Scholar] [CrossRef] [Green Version]
  60. Guo, H.; Wu, T.; Li, S.; He, Q.; Deng, H. The methylation patterns and transcriptional responses to chilling stress at the seedling stage in rice. Int. J. Mol. Sci. 2019, 20, 5089–5106. [Google Scholar] [CrossRef] [Green Version]
  61. Tang, Y.; Bao, X.; Zhi, Y.; Wu, Q.; Guo, Y.R.; Yin, X.H.; Zeng, L.Q.; Li, J.; Zhang, J.; He, W.L. OsMYB6 overexpression of a MYB family gene, increases drought and salinity stress tolerance intransgenic rice. Front. Plant Sci. 2019, 10, 168. [Google Scholar] [CrossRef] [Green Version]
  62. Li, Z.D.; Chen, Z.C.; Cao, Z.; Che, L.P.; Liu, S.W.; Zhang, Y.T. Xylem anatomical and hydraulic drought resistance characteristics of common tree species in hilly areas of North China. Acta Ecol. Sin. 2021, 41, 69–78. [Google Scholar]
  63. Geng, D.; Chen, A.P.; Shen, A.X.; Zhang, A.Y.; Li, B.X. MdMYB88 and MdMYB124 enhance drought tolerance by modulating root vessels and cell walls in apple. Plant Physiol. 2018, 178, 1296–1309. [Google Scholar] [CrossRef] [PubMed] [Green Version]
  64. Yao, S.; Chen, P.Z.; Yu, Y.; Zhang, M.Y.; Wang, D.B.; Liu, J.H.; Hao, Q.Q.; Ji, K.S. PmMYB4, a transcriptional activator from Pinus massoniana, regulates secondary cell wall formation and lignin biosynthesis. Forests 2021, 12, 1618. [Google Scholar] [CrossRef]
  65. Chen, K.Q.; Song, M.R.; Guo, Y.N.; Liu, L.F.; Xue, H.; Dai, H.Y.; Zhang, Z.H. MdMYB46 could enhance salt and osmotic stress tolerance in apple by directly activating stress-responsive signals. Plant Biotechnol. J. 2019, 17, 2341–2355. [Google Scholar] [CrossRef] [PubMed] [Green Version]
  66. Wang, Y.M.; Wang, C.; Guo, H.Y.; Wang, Y.C. BplMYB46 from Betula platyphylla can form homodimers and heterodimers and is involved in salt and osmotic stresses. Int. J. Mol. Sci. 2019, 20, 1171. [Google Scholar] [CrossRef] [PubMed] [Green Version]
  67. Cheng, G.; Wang, L.; Lan, H. Cloning of PEPC-1 from a C4 halophyte Suaeda aralocaspica without Kranz anatomy and its recombinant enzymatic activity in responses to abiotic stresses. Enzyme. Microb. Tech. 2016, 11, 57–67. [Google Scholar] [CrossRef]
  68. Gong, L.T.; Su, X.J.; Yin, S.S.; Sun, M.H.; Yan, B.W.; Adilai, A.A. Cloning, expression analysis and prokaryotic expression of lavender DXS gene. Xinjiang Agric. Sci. 2020, 7, 1233–1242. [Google Scholar]
  69. Ambawat, S.; Sharma, P.; Yadav, N.R.; Yadav, R.C. MYB transcription factor genes as regulators for plant responses: An overview. Physiol. Mol. Biol. Pla. 2013, 19, 307–321. [Google Scholar] [CrossRef] [Green Version]
  70. Xiong, H.; Yu, J.; Miao, J.; Li, J.; Zhang, H.; Xin, W.; Liu, P.; Yan, Z.; Jiang, C.; Yin, Z. Natural variation in OsLG3 increases drought tolerance in rice by inducing ROS scavenging. Plant Physiol. 2018, 178, 451–467. [Google Scholar] [CrossRef] [Green Version]
  71. Ramírez, V.; Agorio, A.; Coego, A.; Javier, G.A.; Hernández, M.J.; Balaguer, B.; Ouwerkerk, P.B.; Zarra, I.; Vera, P. MYB46 modulates disease susceptibility to Botrytis cinerea in Arabidopsis. Plant Physiol. 2011, 155, 1920–1935. [Google Scholar] [CrossRef] [PubMed] [Green Version]
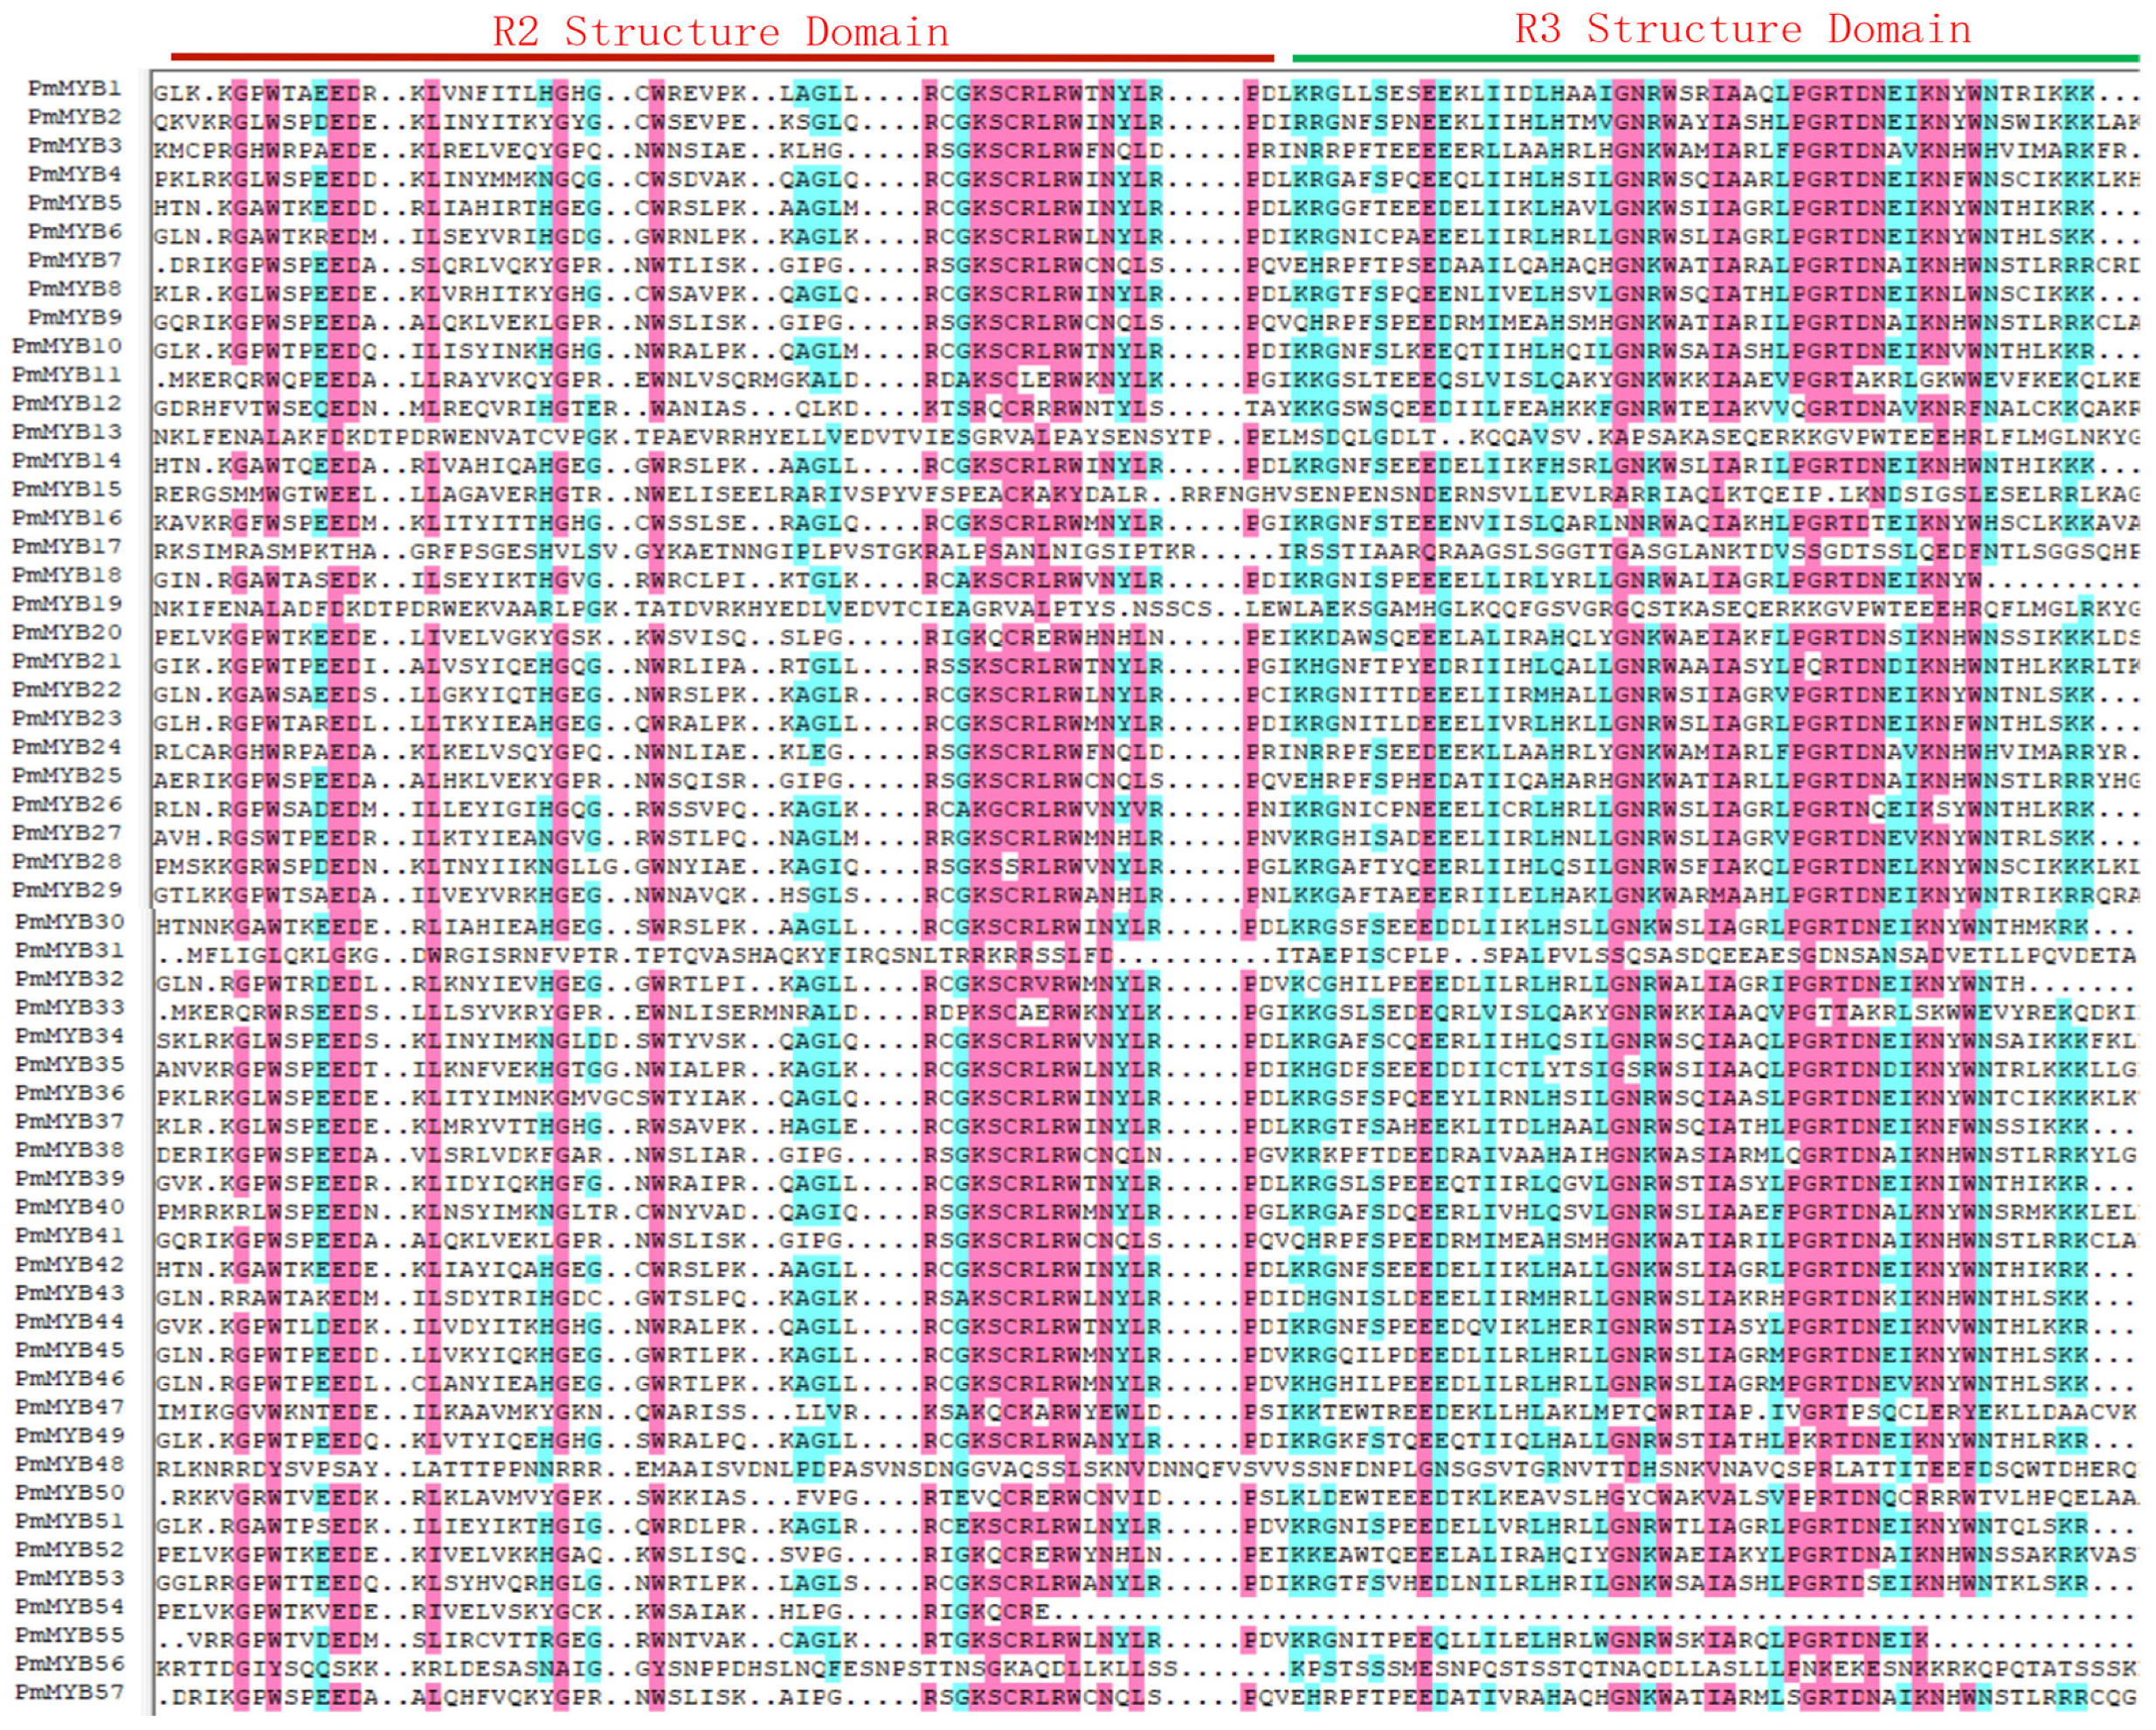
Figure 1. Protein domain analysis of R2R3-MYB in Masson pine. The red lines are the R2 domain, and the green lines are the R3 domain.
Forests 14 00410 g001
Figure 2. Analysis of conserved motif elements of Masson pine R2R3-MYB TFs.
Forests 14 00410 g002
Figure 3. Phylogenetic analysis of the R2R3-MYB TF family in Masson pine and Populus trichocarpa. Different background colors and strips are used to distinguish groups. The red asterisks represent Masson pine R2R3-MYB TFs, and the white background refers to hairy poplar R2R3-MYB only, without Masson pine R2R3-MYB is included; blue dots represent unclassified Masson pine R2R3-MYB TFs.
Forests 14 00410 g003
Figure 4. Heat map of differential expressions of Masson pine MYBs in drought stress. The horizontal coordinates T1, T2, T3, T4 indicated the water supply strength, which were 80% (±5%), 65% (±5%), 50% (±5%), and 35% (±5%), and the ordinate was gene ID. Yellow indicates positive expressions; darker yellow circles indicate higher expression levels. Blue is negative; darker blue circles indicate lower expression.
Forests 14 00410 g004
Figure 5. Expression profiles of PmMYB4 under 15% PEG6000 mimicing drought stress. Gene expression at 0 h was set to the control value 1. X-axis: 0 h, 3 h, 6 h, 12 h and 24 h are stress durations; Y-axis: relative expression. Data in the figure are presented as mean ± standard deviation (n = 3). The different letters above the bars represent significant differences (p < 0.05).
Forests 14 00410 g005
Figure 6. The subcellular localization of PmMYB4. (a) GFP, green represents the nucleus of the cell; (b) DAPI, blue represents the nucleus of the cell; (c) bright field; (d) merged, the overlap point is the nucleus.
Forests 14 00410 g006
Figure 7. Growth of recombinant bacteria (TransB/pET28a-PmMYB4) and control bacteria (TransB/pET28a) on solid LB medium.
Forests 14 00410 g007
Figure 8. Gene expression patterns of PmMYB4. The expression level in the flower was set to the value 1. X-axis: F, flower; R, root; P, phloem; X, xylem; OL, old leaves; YS, young leaves; OS, old stems; YS, young stem. Y-axis: relative expression. Data in the figure are presented as mean ± standard deviation (n = 3). The different letters above the bars represent significant differences (p < 0.05).
Forests 14 00410 g008
Figure 9. Cis-acting element analysis of PmMYB4.
Forests 14 00410 g009
Figure 10. Analysis of PmMYB4 gene expression under different stress. Gene expression at 0 h was set to the control value 1. X-axis: 0 h, 3 h, 6 h, 12 h and 24 h are stress durations; Y-axis: relative expression. Data in the figure are presented as mean ± standard deviation (n = 3). The different letters above the bars represent significant differences (p < 0.05).
Forests 14 00410 g010
Disclaimer/Publisher’s Note: The statements, opinions and data contained in all publications are solely those of the individual author(s) and contributor(s) and not of MDPI and/or the editor(s). MDPI and/or the editor(s) disclaim responsibility for any injury to people or property resulting from any ideas, methods, instructions or products referred to in the content.