Abstract
Yellowhorn (Xanthoceras sorbifolium) seeds can have as high as 67% oil content and are especially rich in oleic acid, linoleic acid, and nervonic acid. Exploration of the lipid biosynthesis regulatory network is essential for increasing the yellowhorn oil content. Long non-coding RNAs (lncRNAs) play important roles in various plant biological processes; however, there is no report on the identification of lncRNAs involved in yellowhorn seed development and lipid biosynthesis affecting oil production. We performed whole transcriptome sequencing of yellowhorn seeds at four developmental stages and identified 16,920 putative lncRNAs. Among them, 325 lncRNAs were revealed to trans-regulate 58 key genes in fatty acid (FA) and triacylglycerol (TAG) biosynthesis pathways. Of these, ECR-2–LNC_009778 was found to be involved in nervonic acid biosynthesis and DGAT-1–LNC_009778 was beneficial to TAG accumulation. sRNA-seq was performed, and 55 microRNAs (miRNAs) were found to target 26 genes involved in FA and TAG biosynthesis; miR396a-4 targets FAD2, affecting linoleic acid biosynthesis, and miR156f-5p targets PDAT-2, contributing to TAG accumulation. Interestingly, 30 lncRNA–miRNA–gene modules involved in FA and TAG biosynthesis were identified, in which the KCS11-1–miR156g-2–LNC_000849 module was found to participate in nervonic acid synthesis, and the DGAT-2–miR172j–LNC_005874 module was assumed to contribute to the accumulation of TAG. Our results constitute the first comprehensive identification of lncRNAs in developing seeds of yellowhorn and serve as a new theoretical reference for improving oil content in the future.
1. Introduction
Yellowhorn (Xanthoceras sorbifolium) belongs to the Sapindaceae family and is endemic to northern China. This oil-bearing woody plant flourishes under dry and barren conditions. Its seed kernels contain up to 67% oil content, with unsaturated fatty acids accounting for 85%–93%, including oleic acid (28.6%–37.1%), linoleic acid (37.1%–46.2%) and nervonic acid (1.3%–3.1%) [1,2]. Notably, nervonic acid is recognized as a dual-effect substance that can repair damaged brain nerve fibers and promote nerve cell regeneration, and it only exists in a limited number of plants [2,3]. Additionally, the characteristics of possessing a high content of hydrocarbon lipids and being environmentally friendly give biodiesel prepared from yellowhorn seed oil broad market prospects. In industry, yellowhorn seed oil can also be used to produce high-grade lubricating oil and other industrial raw materials. Due to its potential applications in industry, yellowhorn seed oil has garnered considerable attention in recent years. Nevertheless, an effective method for elevating yellowhorn oil production is still lacking. Identification of key genes and modules involved in oil accumulation in yellowhorn and their further utilization in breeding may provide effective strategies for developing high-oil content varieties.
The accumulation of seed oil mainly contains two parts: fatty acid (FA) biosynthesis in plastids and triacylglycerol (TAG) biosynthesis in the endoplasmic reticulum (ER) [4]. In the beginning of FA biosynthesis, the acetyl-CoA carboxylase (ACC) catalyzes the conversion of acetyl coenzyme A (acetyl-CoA) to malonyl-acyl carrier protein (malonyl-ACP). Then, the malonyl-ACP is elongated to C16:0-ACP through the fatty acid synthase (FAS system), which contains 3-ketoacyl-ACP synthase (KAS), 3-ketoacyl-ACP reductase (KAR), 3-hydroxyacyl-ACP dehydratase (HAD) and enoyl-ACP reductase (EAR). Free FAs in plastids are then released from ACP and exported to the ER in the form of acyl-coA esters. In the ER, C18:1-CoA is further desaturated to C18:2-CoA (linoleic acid) and C18:3-CoA (linolenic acid) by fatty acid desaturase 2 (FAD2) [5] and fatty acid desaturase 3 (FAD3) [6], respectively. Notably, C24:1 (nervonic acid) is synthesized from C18:1-CoAs through the fatty acid elongase (FAE) system, consisting of 3-ketoacyl-CoA synthase (KCS), 3-ketoacyl-CoA reductase (KCR), 3-hydroxyacyl-CoA dehydratase (HCD) and enoyl-CoA reductase (ECR) [3,7]. Plants synthesize TAG via two pathways. The major pathway is the Kennedy pathway, which involves three consecutive acylation steps: glyceraldehyde-3-phosphate (G3P) catalytically converted by glyceraldehyde-3-phosphate acyltransferase (GPAT) to lysophosphatidic acid (LPA), which is then catalytically converted by lysophosphatidate acyltransferase (LPAAT) to PA. Then, PA is dephosphorylated to form DAG. Finally, TAG is produced from DAG under the catalytic action of DGAT. In the other pathway, phosphatidylcholine (PC) is formed first and then converted to TAG by the phospholipid:diacylglycerol acyltransferase (PDAT). The final TAG is packed in lipid droplets [4,8].
Long non-coding RNAs (lncRNAs), typically longer than 200 nucleotides, regulate gene transcription and expression primarily at the epigenetic and transcriptional levels [9]. Researchers have identified numerous lncRNAs involved in the development of plant seeds and the synthesis of plant oils using high-throughput sequencing [10,11,12]. For instance, 22,430 lncRNAs were identified in two tree peony cultivars containing different levels of unsaturated FAs and a-linolenic acid [10]. A set of 1894 lncRNAs was identified among eight different development stages of pecan kernels from two cultivars [11]. There were also 1363 lncRNAs identified from six different mesocarp stages and oil palm spear leaf tissues mixed in equal amounts [12]. Moreover, the functions of lncRNAs in the lipid biosynthetic pathway have been identified in several plants. In Brassica napus, several lncRNAs participate in seed lipid accumulation by regulating oleosin1, a protein found in oil bodies [13]. In seeds of the tung tree, the lncRNAs LXLOC_009521 and LXLOC_020850 promote the conversion of DAG to TAG by targeting DGAT1 [14]. However, thus far, there is no report on the identification of lncRNAs in yellowhorn, and the role of lncRNA-mRNA interactions in yellowhorn lipid biosynthesis remains unknown.
MicroRNAs (miRNAs) are endogenous non-coding RNAs that regulate gene expression by cleaving target mRNA or inhibiting their translation. Previously, 33 novel and 19 known miRNAs were identified in yellowhorn flower buds [15]. Recently, 88 novel and 249 known miRNAs were identified in yellowhorn seeds at different developmental stages. miR319p_1 and miR5647-p3 were predicted to exert functions in yellowhorn lipid biosynthesis by targeting FAD2-2 and DGAT1, respectively [16]. LncRNAs can act as endogenous target mimics (eTMs) for miRNAs, thereby suppressing miRNA expression and enhancing miRNA-targeted mRNA expression. In Arabidopsis, the lncRNA MSTRG.27126.3 sequesters miR827 and release the expression of the miR827-targeted phospholipase D (PLD) gene, thereby influencing DAG flux into TAG [17]. In pigeon pea, lncRNA-1207 targets MIR-156ag, thereby regulating GPAT6 expression and influencing oil accumulation [18]. Nevertheless, the key lncRNA–miRNA–mRNA module affecting yellowhorn oil biosynthesis has not yet been reported.
Recently, the yellowhorn genome was sequenced and assembled [19]. To better understand the network of seed oil accumulation, an investigation of dynamic changes in gene expression during successive developmental stages is needed. We aim to mine the roles of lncRNAs and their regulatory network involved in oil biosynthesis in developing seeds of yellowhorn. In this study, whole transcriptome libraries from yellowhorn seeds at four developmental stages were constructed. The differentially expressed lncRNAs (DELs), mRNAs (DEGs), and miRNAs (DEMs) between different seed development stages were identified. GO enrichment and KEGG pathway enrichment analyses were executed to categorize the possible functions of the DELs, DEGs, and DEMs. Most importantly, the key DEL–DEG pairs, DEM–DEG pairs, and DEL–DEM–DEG modules in the context of FA and TAG biosynthesis were identified. The regulatory relationships within the excavated modules were then verified by a quantitative polymerase chain reaction (qPCR) assay. In summary, we identified, for the first time, the lncRNAs, lncRNA–mRNA pairs, and lncRNA–miRNA–mRNA regulatory modules involved in lipid and FA biosynthesis pathways in yellowhorn. Our study provides a new theoretical reference for breeding high-oil-content yellowhorn cultivars.
Taken together, these studies helped to assess the functions of lncRNAs during pollen development, pollination, and fertilization and deepened our understanding of the molecular mechanisms and biological behavior in these reproductive development processes.
2. Materials and Methods
2.1. Plant Materials
The yellowhorn (Xanthoceras sorbifolium) cultivar Liaoguan 8 was grown in a yellowhorn fruit base located in Chaoyang city, Liaoning Province, China. According to our previous research on the oil accumulation in yellowhorn seeds for years, 25 days post-anthesis (dpa) is the early stage of seed development, 40–55 dpa and 55–70 dpa are the rapid formation and accumulation periods of seed oil, respectively. At 70 dpa, the seeds tend to mature. Hence, we chose these time points to study the molecular mechanism of oil accumulation in yellowhorn. The seeds from the fruit were harvested at 25, 40, 55, and 70 days post-anthesis (dpa), abbreviated as the S1, S2, S3, and S4 development stages, respectively. Each time point had three biological replicates. Samples from different plants were harvested, immediately frozen in liquid nitrogen, and stored at −80 °C until transcriptome analysis.
2.2. Oil Content Analysis
The seeds harvested at the S1, S2, S3, and S4 development stages were dried at 80 °C until they reached a constant weight then were ground with a ball mill. Then, the oil in embryos was extracted using a previously described method [20]. The experiments were repeated in triplicate.
2.3. RNA Extraction and Strand-Specific Library Construction
Total RNA from the S1, S2, S3, and S4 was extracted using TRIzol reagent (Invitrogen, Carlsbad, CA, USA). The prepared RNA samples were subjected to subsequent library construction. To identify lncRNAs and mRNAs, a strand-specific library was constructed by removing ribosomal RNA using the NEBNext Ultra™ Directional RNA Library Prep Kit for Illumina (NEB, Ipswich, MA, USA). On the Illumina HiSeq 2500 platform, paired-end reads of 125 bp were generated from the libraries.
2.4. Identification of lncRNAs and mRNAs
For quality control of RNA data sets, the adaptors were removed and low-quality bases were trimmed. The clean sequencing reads were mapped to the yellowhorn genome [19] by using the spliced read aligner TOPHAT 2.0. Cuffmerge software was first used to merge the transcripts spliced by each sample and remove the transcripts with uncertain strand directions to obtain the complete transcriptome information of this sequence. After that, five steps were taken to identify lncRNAs from transcriptome assemblies by removing the transcripts with the following characteristics: (1) length < 200 bp; (2) overlap of the database annotation with the exon region; (3) fragments per kilobase of transcript per million mapped reads (FPKM) with value ≤ 0.5; and (4) failure to pass the protein-coding-score test by the Coding-Non-Coding Index (CNCI), Coding Potential Calculator (CPC), and Pfam-scan software.
2.5. Identification of Differentially Expressed lncRNAs (DELs) and mRNAs (DEGs)
In each sample, the FPKM values of lncRNAs and mRNAs were calculated by StringTie [21]. DELs and DEGs between groups (three biological replicates per group) were analyzed through Cuffdiff in the R environment [22] with an adjusted false discovery rate (FDR) less than 0.05 and|log2(Fold change)| less than one.
2.6. LncRNA Target mRNA Prediction
The mRNAs within 100 kb upstream and downstream of each lncRNA were extracted to determine the cis-regulate role of the lncRNAs acting on them. The trans-regulatory role of lncRNAs acting on mRNAs was determined by Pearson correlation coefficients, which were calculated using “cor.test” in the R environment. An absolute correlation value greater than 0.95 was considered to indicate correlation. The correlated lncRNAs and coding genes were classified as coexpressed.
2.7. Small RNA Sequencing
The prepared RNA samples were processed with the NEBNext Multiplex Small RNA Library Prep Set for Illumina (NEB, USA) for constructing twelve small RNA sequencing libraries. Then, the library preparations were sequenced on an Illumina HiSeq 2500 platform, and single-end reads of 50 bp were generated. Raw sequences were processed by removing reads containing poly-N/A/T/G/C sequences, without the insert tag or 3′ adapter and with 5′ adapter contaminants. The low-quality reads were also trimmed. Subsequently, clean reads (18–25 nt at length) were chosen for further downstream analyses.
2.8. Identification of Known and Novel miRNAs and Prediction of Their Targets
To determine expression levels of small RNA tags, Bowtie 2 [23] was used to map them to the reference sequence (miRbase (v22)). The mapped small RNA tags were subjected to a search for known miRNAs. The attributes of the miRNA precursor hairpin structure were utilized to predict novel miRNAs. The novel miRNAs were identified based on the secondary structure analyzed by miREvo [24] and mirdeep2 [25]. The classification of families to which known miRNAs belonged was performed by miFam.dat (http://www.mirbase.org/ftp.shtml, accessed on 8 January 2019). The target genes of the identified miRNAs were predicted by psRNATarget [26].
2.9. Analysis of Differentially Expressed miRNAs (DEM)
The transcripts per million (TPM) value was used to represent the accumulation of miRNAs. DEMs between groups (three biological replicates per group) were identified using DESeq2 [27] with an adjusted FDR ≤ 0.05 and |log2(fold change)| ≥ 1.
2.10. GO and KEGG Enrichment Analysis
To further understand the functions of DELs and DEMs, their target genes were used for GO enrichment analysis by GOseq [28] and KEGG enrichment analysis by KOBAS 2.0 [29].
2.11. qPCR Assay
Total RNA was isolated from the S1, S2, S3, and S4 samples, respectively. cDNA synthesis from the lncRNA/mRNA and miRNA was executed with TransScript One-Step RT–PCR SuperMix Kit (TransGen Biotech, Beijing, China) and TransScript Green miRNA Two-Step RT–PCR SuperMix Kit (TransGen Biotech, Beijing, China), respectively. Subsequently, the qPCR assay was performed using TransStart Tip Green qPCR SuperMix (TransGen Biotech, Beijing, China). The yellowhorn housekeeping genes, 5.8S rRNA, and β-actin were used as reference genes for miRNA and lncRNA/mRNA expression analysis, respectively. Based on the 2−ΔΔCt method [30], relative lncRNA/mRNA and miRNA expression levels were calculated and are displayed as the mean ± SE of three biological replicates. The primers are listed in Table S1.
2.12. Statistical Analysis
Data from all experiments were analyzed using one-way ANOVA and Duncan’s multiple range test. Significant differences (p-value < 0.05) were displayed by different lowercase letters.
3. Results
3.1. Dynamic Changes of Oil Content during Seed Development
To observe the dynamic change of oil content during seed development, seeds at the S1, S2, S3, and S4 development stages were collected for examination. The sizes of the seeds and embryos increased continuously from S1 to S3 but showed no obvious difference between S3 and S4 (Figure 1a). The embryo oil content showed a rapid accumulation of nearly 7-fold from S1 (6.6% ± 0.6%) to S3 (41.5% ± 1.0%), followed by a slight increase from S3 to S4 (45.1% ± 0.3%) (Figure 1b). S1 was considered the early embryo stage, S2 and S3 were considered the middle embryo stage, and S4 was considered the fully matured stage. The above results indicate that oil is abundantly enriched mainly in the early to middle embryonic development stages.

Figure 1.
Seed size (top left in a), embryo size (bottom left in a), and oil content (b) of yellowhorn in S1, S2, S3, and S4. Scale bar = 1 cm. The seeds from the fruit were harvested at 25, 40, 55, and 70 days post-anthesis (dpa), abbreviated as the S1, S2, S3, and S4 development stages, respectively. The dwt represents dry weight. Data from oil content experiments were analyzed using Duncan’s multiple range test. Significant differences (p-value < 0.05) are indicated by different lowercase letters.
3.2. Transcriptome Analysis during Seed Development
To mine lncRNAs and mRNAs associated with seed development, the strand-specific transcriptome was analyzed. The transcriptomes of all biological replicates in each seed development stage (S1–S4) were highly correlated (r2 > 0.9) (Figure S1a), indicating a high degree of repeatability among samples. Additionally, principal component analysis (PCA) showed that the groups of seeds at each timepoint were separated well, indicating the variation in transcription levels among the seed developmental stages (Figure S1b). Therefore, the transcriptome was available for further analysis. A summary of data quality of stranded RNA-seq is given in Table S2. The strand-specific library data have been deposited in the NCBI SRA database under the accession number PRJNA818439.
Over 1.2 billion high-quality reads were generated from the twelve samples (average 104.6 million reads per sample), of which 68.8 to 138.4 million reads (81.1%–92.7%) were mapped to the yellowhorn genome. TopHat 2 was used to analyze the reference genome, and 62.1 million to 125.3 million reads (72.5%–83.9%) were mapped to exonic sequences (Tables S2 and S3). Transcript assembly was then performed. After filtering, 16,920 transcripts were obtained and defined as lncRNAs in yellowhorn (Figure 2a). Of them, 10,693 (63.2%) transcripts were lincRNAs, 4653 (27.5%) transcripts were intronic lncRNAs, and only 994 (9.3%) transcripts were lncNATs (Figure 2b). Meanwhile, 27,831 mRNA transcripts were identified, including 24,673 known mRNAs and 3159 novel mRNAs. The lengths of the identified lncRNAs were in the range 0–2000 nt, with an average of 592 nt, shorter than the average length of the mRNAs (1571 nt) (Figure 2c). Approximately 60.0%, 26.8%, 9.6%, and 3.6% of the lncRNAs contained 1, 2–4, 5–9, and over 10 exons, respectively. Overall, mRNAs had more exons than lncRNAs, with 1, 2–4, 5–9, and over 10 exons accounting for 16.8%, 39%, 28%, and 16.2%, respectively (Figure 2d). The overall expression levels of the lncRNAs were lower than those of the mRNAs (Figure 2e).
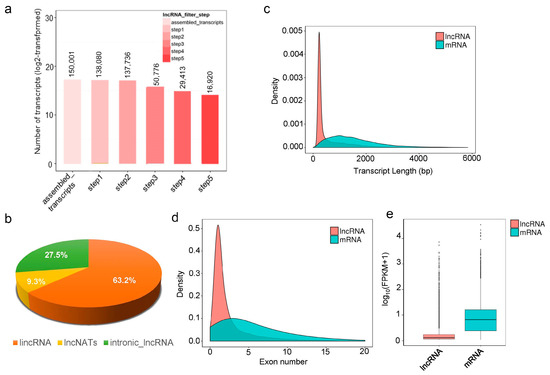
Figure 2.
Identification and characteristics of lncRNAs in the seeds of yellowhorn. (a) Number of lncRNAs identified in five screening steps. (b) Classification and percentage of lncRNAs. (c) Transcript length distribution of identified lncRNAs and mRNAs. (d) Exon number distribution of identified lncRNAs and mRNAs. (e) The overall FPKM value of identified lncRNAs and mRNAs.
3.3. Differential Expression Profiles of lncRNAs
Pairwise comparison between different developmental stages (S2 vs. S1, S3 vs. S2, and S4 vs. S3) was conducted to identify DELs and DEGs. In all, 2290 DELs were found in pairwise comparisons, including 1129 in S2 vs. S1, 762 in S3 vs. S2, and 986 in S4 vs. S3 (Figure 3a). The findings indicate that the expression of lncRNAs was spatiotemporally specific and not completely consistent during the four developmental stages. Sixty-five DELs existed in all three comparison groups (Figure 3b), and the expression patterns were divided into six categories in all three comparison groups (Figure 3c). lncRNAs in the same category may have similar functions.
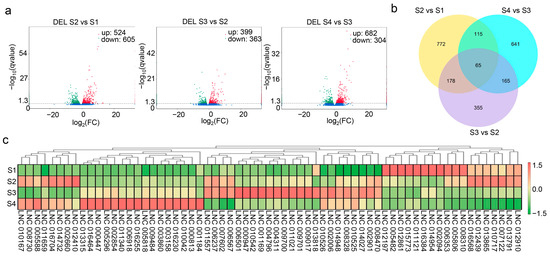
Figure 3.
Differentially expressed lncRNAs and their expression profiles. (a) Identified differentially expressed lncRNAs (DELs) in S2 vs. S1, S3 vs. S2, and S4 vs. S3. (b) Venn diagram of DELs in all three comparisons. (c) Heatmap of the expression levels of 65 DELs that existed in all three comparisons.
3.4. GO Enrichment and KEGG Enrichment Analysis of DELs
Since lncRNAs either cis or trans-regulate genes, to understand the regulatory roles of lncRNAs in yellowhorn seed development stages, we analyzed the mRNAs potentially targeted by DELs. A total of 2290 lncRNAs were predicted to cis-regulate 15,822 mRNAs, forming 31,459 DEL–mRNA pairs. In addition, 1720 lncRNAs were predicted to trans-regulate 15,742 mRNAs, forming 501,286 DEL–mRNA pairs.
To further explore the biological functions of the DELs in the seed development process, their trans-regulated genes were searched against the GO database. The GO analysis showed that overall, postembryonic morphogenesis was enriched in the biological process category by the DELs, the cell wall was enriched in the cellular component category by the DELs, and oxidoreductase activity was enriched in the molecular function category by the DELs (Figure S2). These results provide an initial framework for functional categorization related to seed development.
The KEGG enrichment pathways were analyzed as well. The KEGG enrichment pathways in S2 vs. S1, S3 vs. S2, and S4 vs. S3 showed high similarity. In S2 vs. S1, the DEL target genes were enriched in 118 pathways, mainly including “stilbenoid, diarylheptanoid and gingerol biosynthesis”, “limonene and pinene degradation”, and “alpha-linolenic acid metabolism”; in S3 vs. S2, the DEL target genes were enriched in 116 pathways mainly including “brassinosteroid biosynthesis”, “fatty acid biosynthesis”, and “alpha-Linolenic acid metabolism”; in S4 vs. S3, the DEL target genes were enriched in 115 pathways mainly including “pyruvate metabolism”, “fatty acid biosynthesis”, and “alpha-Linolenic acid metabolism” (Figure 4).

Figure 4.
KEGG enrichment pathway analysis of DELs in S2 vs. S1, S3 vs. S2, and S4 vs. S3. The top 20 KEGG pathways of the DELs are displayed.
3.5. DEGs Involved in FA and TAG Biosynthesis
A total of 11,784 DEGs were identified in pairwise comparisons (Figure 5a). KEGG enrichment pathway analysis was performed on these DEGs to classify their functions. Because the FA and TAG biosynthesis pathways are two critical pathways for oil synthesis, we focused on the DEGs involved in these two pathways in further analyses. Thirty-seven DEGs involved in the FA biosynthesis pathway and 30 DEGs involved in the TAG biosynthesis pathway were extracted (Figure 5b, Table S4). The expression patterns of FA-related DEGs (Figure 5c) and TAG-related DEGs (Figure 5d) in the transcriptome were analyzed. These 67 DEGs were considered to exert vital functions in yellowhorn FA and TAG biosynthesis pathways, so they were selected for further study and identification of their interacting DELs and DEMs.
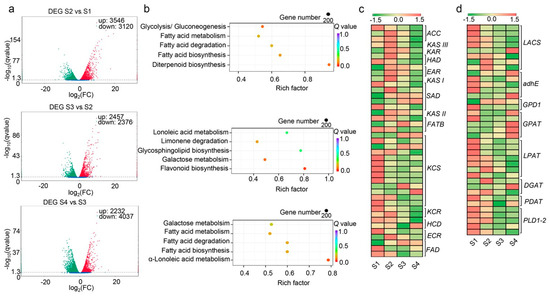
Figure 5.
Identification and KEGG analysis of differentially expressed mRNAs (DEGs). (a) Identified DEGs in S2 vs. S1, S3 vs. S2, and S4 vs. S3. (b) KEGG pathway analysis of the DEGs in the context of FA and TAG biosynthesis. (c) Heatmap of the expression levels of DEGs in the FA biosynthesis pathway. (d) Heatmap of the expression levels of DEGs in the TAG biosynthesis pathway.
Of these DEGs, most FA-related genes were found to be up-regulated at S2, which is when FAs begin to accumulate relatively rapidly; while two SAD genes (EVM0023103 and novel.841), three KCS genes (EVM0009614, EVM0000575, and EVM0022839), one HCD gene (EVM0023359) were mainly up-regulated during the middle to late stage of embryonic development. In the TAG pathway, LPAT genes and PDAT genes were significantly up-regulated at S1 and S2, the early to middle stage of embryonic development. Meanwhile, the GPAT genes were mainly up-regulated in S3 to S4, the middle to late stage of embryonic development. Two DGAT genes (EVM0023600 and EVM0003862) were up-regulated in S2 and one DGAT gene (EVM0020210) was up-regulated in S4. Thus, it was suggested that these DEGs play different regulatory roles in oil accumulation during embryonic development.
3.6. DEL–DEG Pairs Related to FA and TAG Biosynthesis
To identify DEL–DEG pairs related to FA and TAG biosynthesis, the DELs that interacted with the 67 DEGs extracted above were excerpted from 501,286 DEL–mRNA trans-regulatory pairs obtained earlier. In total, 325 DELs were suggested to interact with 58 DEGs, forming 1712 gene pairs (Table S5, Figure S3). As the DEL–DEM interaction network is very complex and large, a subnetwork including five key DEGs in FA (ACC-3, ECR-2, FAD3-2, KAR, KCS11-2) and five key DEGs in the TAG pathway (LPAT-6, LACS7-1, DGAT-1, PLD1-2-2, PDAT-1) was selected for display (Figure 6). In most cases, a DEG can be simultaneously regulated by multiple DELs. There are also cases where one DEL regulates one DEG. For example, KAR is targeted only by LNC_003993.
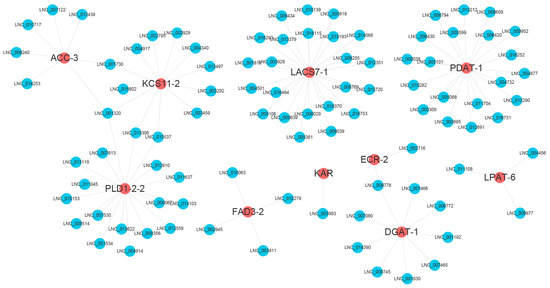
Figure 6.
A subnetwork of DEL–DEG pairs related to FA and TAG biosynthesis pathways. Five DEGs in the FA biosynthesis pathway (ACC-3, ECR-2, FAD3-2, KAR, and KCS11-2) and five DEGs in the TAG biosynthesis pathway (LPAT-6, LACS7-1, DGAT-1, PLD1-2-2, and PDAT-1) were selected and displayed by Cytoscape. The DEGs are displayed as red circles, and the DELs are represented by blue circles.
3.7. Small RNA Sequencing Profile
The sRNA-seq profiles of three biological replicates were constructed and deposited under the SRA accession number PRJNA818424. A summary of the sRNA-seq quality is given in Table S6. From twelve libraries, a total of 153,673,635 raw reads were obtained (approximately 12.8 million raw reads per library). After removing the adaptor dimers, a large number of valid sequences (18–25 bp) were obtained (average 11.9 million reads per sample, 93.65%). Moreover, reads matching rRNA, tRNA, snRNA, and snoRNA sequences accounted for 29.9% of the sequences. An average of 5.69% clean reads were mapped to NATs (Table S7).
We identified 713 mature miRNAs, including 428 known mature miRNAs belonging to 65 miRNA families and 285 novel mature miRNAs (Table S8). The most abundant miRNA family was miR169, containing 15 members, followed by miR156 and miR166, which both include 14 members. The remaining miRNA families all harbored fewer than ten members (Figure 7a). The TPM value in S1–S4 showed a similar distribution, with a TPM value >15 accounting for almost half (Figure 7b).
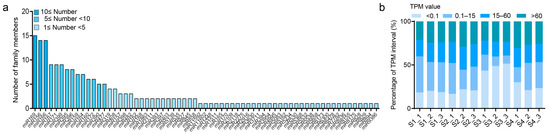
Figure 7.
Characteristics of the identified miRNAs. (a) The number of family members of identified miRNAs. (b) The percentage of TPM intervals of identified miRNAs in twelve sRNA libraries.
3.8. Different Expression Profiles of miRNAs
In all, 345 DEMs, including 185 known and 160 novel miRNAs, were identified (Figure 8a). Among them, 41 DEMs, including 32 known and nine novel miRNAs, were found in all three pairwise comparisons (Figure 8b). These DEMs can be clustered into seven groups according to their expression characteristics in the four seed developmental stages. For conserved miRNAs, most members of the same family were clustered in one group (Figure 8c).
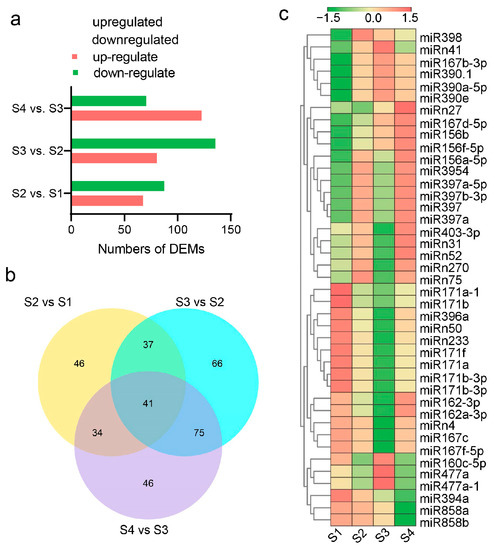
Figure 8.
Differentially expressed miRNAs (DEMs) and their expression profiles. (a) Identified DEMs in S2 vs. S1, S3 vs. S2, and S4 vs. S3. (b) Venn diagram of DEMs in all three comparisons. (c) Heatmap of the expression levels of 41 DEMs that existed in all three comparisons.
3.9. GO Enrichment and KEGG Enrichment Analysis of DEMs
Through prediction, a total of 29,845 DEM–mRNA pairs consisting of 239 DEMs and 11,737 putative target genes were identified (Table S9). GO and KEGG enrichment of 11,737 mRNAs were analyzed. The top 20 enriched GO terms, including cellular component, biological process, and molecular function terms, are presented in Figure S4. The KEGG analysis showed that the DEMs were mainly involved in linoleic acid metabolism, glycosphingolipid biosynthesis, and flavonoid biosynthesis (Figure 9).
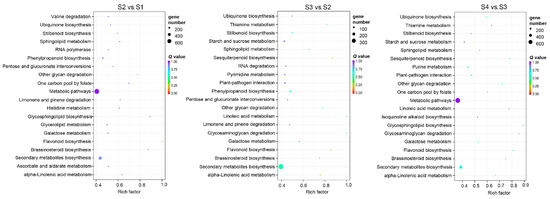
Figure 9.
KEGG enrichment pathway analysis of DEMs in S2 vs. S1, S3 vs. S2, and S4 vs. S3. The top 20 KEGG pathways of DEMs are displayed.
3.10. DEM–DEG Pairs in the Context of FA and TAG Synthesis Pathways
A total of 60 DEM–DEG pairs consisting of 55 DEMs and 26 DEGs were found to be involved in FA and TAG biosynthesis in seed development (Figure 10, Table S10). Of the 55 DEMs, 11 belonged to the miR396 family, followed by six belonging to miR156 family and five belonging to the miR166 family. Four DEMs, xso-miR396b-5p, xso-miR396f, xso-miR396h, and xso-miR6300, can target two DEGs simultaneously. Specifically, xso-miR396b-5p targets FATB-1 in the FA biosynthesis pathway and LPAAT-3 in the TAG biosynthesis pathway and xso-miR6300 targets FAD2 in the FA biosynthesis pathway and DGAT-2 in the TAG biosynthesis pathway, indicating that xso-miR396b-5p and xso-miR6300 may exert dual functions in FA and TAG synthesis pathways. Meanwhile, of the 26 DEGs, FAD2 was targeted by 11 DEMs simultaneously, followed by PDAT-2-3, which was targeted by seven DEMs at the same time, and LPAT-5 and FATB-1, which were each targeted by five DEMs. These results indicated that miRNAs may influence FA and TAG biosynthesis pathways.
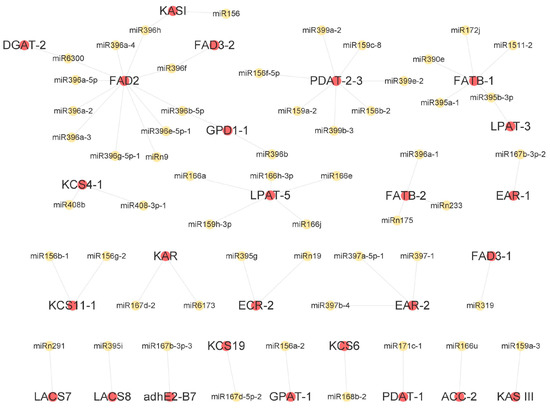
Figure 10.
Network of DEM–DEG pairs in the context of FA and TAG biosynthesis pathways. The DEGs are displayed as red circles, and the DEMs are represented by yellow circles.
3.11. DEL–DEM–DEG Network Involved in FA and TAG Synthesis
To mine lncRNAs that can act as eTMs for miRNAs, we first filtered out lncRNAs that could act as miRNA precursors. According to the sequence homology between lncRNAs and miRNA precursors, 18 lncRNAs were predicted to act as 16 miRNA precursors, and it was found that three miRNA families, miR160, miR172, and miR396, were mainly involved, while the rest were 10 novel identified miRNAs (Table S11).
After filtering out lncRNAs that could act as miRNA precursors, the potential target mimic sites of lncRNAs on miRNAs were predicted. Depended on the competing endogenous RNA (ceRNA) hypothesis, the expression patterns of lncRNAs that can act as eTMs for miRNAs should be consistent with those of miRNA target genes and opposite to those of miRNAs. Thus, a DEL–DEM–DEG network consisting of 30 modules involved in 26 DEMs, 95 DELs, and 18 DEGs was constructed in the context of the FA and TAG synthesis pathways (Figure 11, Table S12). Among 18 DEGs, FATB-1 was simultaneously targeted by five modules, including five miRNAs and 37 lncRNAs, and KCS19 was simultaneously targeted by three modules, including three miRNAs and 13 lncRNAs, indicating the vital roles of FATB-1 and KCS19 in yellowhorn oil synthesis-related molecular mechanisms.
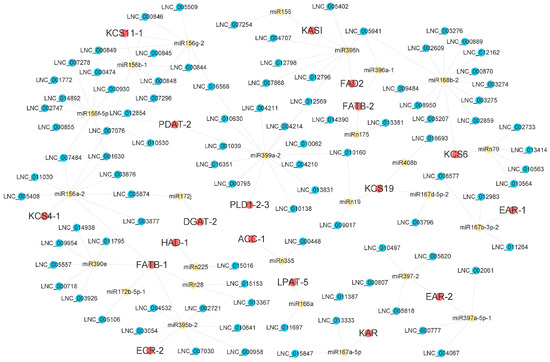
Figure 11.
Network of DEL–DEM–DEG modules related to FA and TAG biosynthesis pathways. The DEGs, DEMs, and DELs are displayed as red, yellow, and blue circles, respectively.
3.12. Verification of DEL–DEG Pairs, DEM–DEG Pairs and DEL–DEM–DEG Modules by Quantitative Assay
The expression levels of eight randomly selected DEL–DEG pairs were analyzed by qPCR assay (Figure 12a). The expression levels of ACC-3, KAR, ECR-2, LPAT-6, and DGAT-1 peaked at the S2 development stage, with an almost 10-fold change compared with S1. Meanwhile, the lncRNAs showed similar expression trends as their corresponding target genes (Figure 12a).
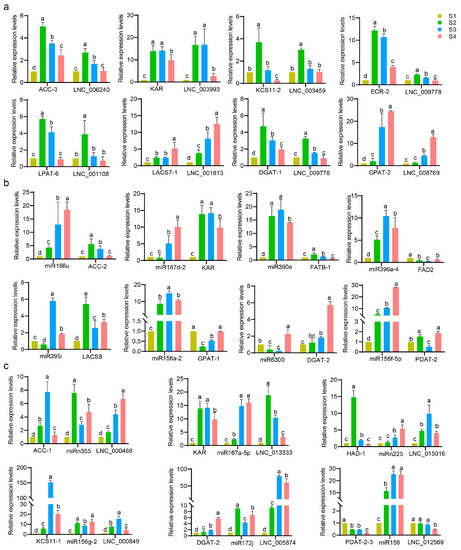
Figure 12.
Expression patterns of the selected lncRNA–mRNA pairs, miRNA–mRNA pairs, and lncRNA–miRNA–mRNA modules in the context of the FA and TAG biosynthesis pathways. The gene pairs in the upper half of (a,b) are involved in FA biosynthesis pathways, the lower half of (a,b) are pairs involved in TAG biosynthesis pathways. In (c), the ACC-1–miRn355–LNC_000488, KAR–miR167a-5p–LNC_013333, HAD-1–miRn225–LNC_015016, and KCS11-1–miR156g-2–LNC_000849 modules were suggested to be relevant to FA biosynthesis pathways, and DGAT-2–miR172j–LNC_005874 and PDAT-2-3–miR156–LNC_012569 were suggested to be relevant to TAG biosynthesis pathways. Data from qPCR experiments were analyzed using Duncan’s multiple range test. Significant differences (p-value < 0.05) are indicated by different lowercase letters.
Eight DEM–DEG pairs were randomly selected for qPCR verification (Figure 12b). Compared with S1, the fold changes of miR166u, miR390e, miR156a-2, and miR156f-5p in other development stages increased more than 10-fold. Notably, miR395i and miR396a-4 showed contrasting expression trends with the targets LACS-8 and FAD2, respectively, from S1 to S4 development stages. From S1 to S3, miR6300 and DGAT-2 showed contrasting expression patterns; from S2 to S3, the miR390e–FATB-1 and miR156f-5p–PDAT-2 pairs showed opposite expression trends; from S2 to S4, the expression patterns of miR166u–ACC-2 and miR167d-2–KAR showed opposite trends; from S3 to S4, miR156a-2 exhibited the opposite trend as GPAT-1 (Figure 12b). It was indicated that the predicted DEM–DEG pair exhibited an apparent negative relationship.
Six DEL–DEM–DEG modules were randomly selected for qPCR (Figure 12c). From S2 to S4, the expression patterns of ACC-1 showed a contrasting trend with those of miRn355 and showed a similar trend with those of LNC_000488; LNC005874–miR172j–DGAT-2, LNC_012569–miR156–PDAT-2-3, and LNC_000849–miR156g-2–KCS11-1 also exhibited these expression trends. Notably, the fold change in KCS11-1 expression reached more than 150-fold in the S3 stage, indicating the vital role of this gene in FA biosynthesis. From S3 to S4, the expression patterns of KAR showed a contrasting trend with those of miR167a-5p and showed a similar trend with those of LNC_013333; the HAD-1–miRn225-LNC_015016 module also exhibited these expression trends.
The qPCR data of the genes were in accordance with the transcriptome data. Additionally, we selected six miRNAs (miR166u, miR396a-4, miR156a-2, miR156f-5p, miR167a-5p, and miR172j) to examine their expression in reverse transcription PCR (RT-PCR) assay. The cDNA of S3 was used as a template because it is the key stage for FA and TAG accumulation. As shown in Figure S5, all six miRNAs were expressed in S3 stage. Simultaneously, the above results suggested that the predicted DEL–DEG pairs, DEM–DEG pairs, and DEL–DEM–DEG modules were reliable and could be used for future functional analysis.
4. Discussion
4.1. LncRNAs Identified in Developing Seeds of Yellowhorn
LncRNAs are pervasive in eukaryotic cells and have been perceived as redundant in recent decades. Nevertheless, they have been found to exert vital regulatory functions in plants in recent years. Taking advantage of high-throughput sequencing technology, lncRNAs have been recently identified in several oilseed plants such as soybean [31], oil palm [12], peanut [32], and rapeseed [33]. Although lncRNAs have been discovered in some plants, the functions of a majority of them remain unknown, especially their functions in yellowhorn oil synthesis. In the present study, 16,920 lncRNAs were identified in yellowhorn seeds. Of them, lincRNAs accounted for 63.2%, followed by intronic lncRNA (27.5%) and lncNATs (9.3%). The average length and overall exons of the identified lncRNAs were shorter and fewer, respectively, than those of mRNAs (Figure 2). These results are consistent with previous studies [31,32,33]. Our results provide the first comprehensive identification of lncRNAs in developing seeds of yellowhorn.
4.2. Key lncRNAs and miRNAs Involved in TAG Assembly of Yellowhorn
To further comprehend the molecular mechanism of lncRNAs in the TAG biosynthesis pathway in yellowhorn, the mRNAs that may be targeted by lncRNAs were investigated. In the context of TAG assembly, 25 DEGs were revealed to be highly coexpressed with 262 DELs, thus forming 724 DEL–DEG pairs (Table S5, Figure S3). Here, nine DELs were suggested to be interacting with DGAT-1 (Figure 6). DGAT is responsible for the final step of acylation in TAG formation and thus is a key component for manipulating oil content. It was previously reported that manipulating a DGAT from Vernonia galamensis increased the oil content in soybean and yeast [34]. Additionally, 20 DELs were suggested to be interacting with PDAT-1. PDAT transfers the fatty acid of PC into diphenol glycerol to generate TAG [35]. Previous research showed that the increased expression of PDAT contributed to lipid accumulation in walnut [36]. Overexpressing particular flax PDAT genes in Arabidopsis resulted in an enhanced proportion of linolenic acid in TAGs [37]. In addition, 169 DELs were suggested to be interacting with LACSs. LACSs participate in the acyl-CoA thioesterification step of lipid biosynthesis, which is crucial for lipid biosynthesis [38]. Likewise, in the tung tree, nine lncRNAs were coexpressed with LACS4, two lncRNAs were coexpressed with DGAT1, and three lncRNAs were coexpressed with DGAT2, PDAT, and PDAT2 [14]. The above results indicate that lncRNAs are widely involved in yellowhorn TAG assembly.
miRNAs have been reported to play vital roles in lipid metabolism. In this study, 713 mature miRNAs, including 428 known and 285 novel miRNAs, were identified in twelve sRNA-seq datasets from four seed development stages. Among the stages, the three most abundant miRNA families were miR169, miR156, and miR166, all containing more than 10 members. Similarly, 204 known miRNAs identified in walnut were classified as 25 families. The largest family was MIR166, with 24 members, followed by MIR156, with 16 members [39]. Our previous work identified 249 known and 88 novel miRNAs in two yellowhorn lines, NM1203 (high-oil content line) and NM1003 (low-oil content line), from 16 sRNA libraries at four seed developmental stages [16]. The difference in the number of miRNAs identified in the current study compared with that in previous studies may be due to (i) different versions of miRBase being used, as Wang et al. used miRBase v21, while we used the upgraded miRBase v22; (ii) different cultivars of yellowhorn being used. In this study, we newly identified that DGAT-2 was targeted by miR6300. In addition, LPAT-5 was simultaneously targeted by four miR166 family members (miR166a, e, j, h-3p), contrary to a previous result showing that LPAT-5 was targeted by only miR1536_p5_2 [16]. In addition, two miR156 family members (miR156b-2 and miR156f-5p), two miR159 family members (miR159a-2 and miR159c-8), and three miR399 family members (miR399a-2, miR399e-2, and miR399b-3) simultaneously targeted PDAT-2. The findings indicate that miRNAs were widely involved in the conversion of PC to TAG and less involved in the conversion of DAG to TAG by DGAT. We also predicted that miR156a-2 targets GPAT-1, which was consistent with the previously identified targeting of GPAT by Cc-MIR-156ag in pigeon pea [18]. These findings suggest that diverse miRNAs were involved in yellowhorn TAG assembly.
4.3. Key lncRNAs and miRNAs Involved in the FA Biosynthesis Pathway
Increasing the FA composition is the priority for the development of yellowhorn breeding. In this study, in the context of FA biosynthesis, 67 DELs were suggested to be interacting with 33 DEGs, thus forming 990 pairs. The 11 KCS genes were suggested to be interacting with 190 DELs and formed 573 pairs, accounting for more than half of the 990 pairs. Out of the 11 KCS genes, KCS11-1 showed the highest expression level in the S3 and S4 periods (FPKM > 200) and was coexpressed with two lncRNAs (LNC_014729 and LNC_011246), indicating its putative role in nervonic acid accumulation. KCS is the enzyme that limits the rate of fatty acid elongation [40]. Seed-specific expression of the Malania oleifera KCS11 in Arabidopsis led to approximately 5% nervonic acid accumulation [41]. Meanwhile, FAD2 was suggested to interact with LNC_007653, and FAD3-1 and FAD3-2 were suggested to interact with four DELs. Likewise, in the tung tree, LXLOC_006676 targets FAD3-2, affecting α-linolenic acid synthesis [14].
A total of 38 pairs consisting of 35 DEMs and 14 DEGs were found to be associated with FA biosynthesis (Figure 10). The 14 DEGs included KAR, EAR, KASI, FATB, FAD2, FAD3, KCS, and ECR. FAD2 is targeted by the most DEMs, including nine miR396 family members and miR6300. In contrast, Wang et al. predicted that miR319p_1 targeted FAD2-2 in yellowhorn (cultivar NM1203 and NM1003); Zahra et al. reported that 47 wheat FAD genes were targeted by 91 miRNAs, but these did not include miR396 or miR6300 [42]; in sesame seed, FAD2 was revealed to be targeted by sly-miR166c-5p_1 and involved in lipid biosynthesis [43]. This may indicate that miRNAs targeting FAD2 vary among different plants or cultivars.
As mentioned above, it was predicted that miR6300 also targeted DGAT-2 in the TAG assembly pathway, suggesting that miR6300 may play dual roles in FA and TAG synthesis pathways. Similarly, it was predicted that miR396b-5p targeted FATB-1 in the FA biosynthesis pathway and LPAT-3 in the TAG biosynthesis pathways. Novel identified miRNAs such as miRn175, miRn19, and miRn9 were predicted to target FATB-2, ECR-2, and FAD2, respectively, suggesting that novel miRNAs may contribute to FAs biosynthesis. Additionally, KCS11-1 was predicted to be targeted by miR156b-1 and miR156g-2. This was consistent with a previous report showing that miR156e and miR156j targeted KCS12 in oil palm and were beneficial to FA metabolism [44].
4.4. Working Model of the lncRNA–miRNA–mRNA Modules in FA and TAG Synthesis Pathways
Thirty DEL–DEM–DEG modules related to FA and TAG biosynthesis were identified (Figure 11). Because the relationship within the overall network is very complex, we selected eight key modules and have illustrated them in Figure 13. Among them, the LNC_000849–miR156g-2–KCS11-1 module was identified as being involved in nervonic acid synthesis, and the LNC_005874–miR172j–DGAT-2 and LNC_012569–miR156–PDAT-2-3 modules contribute to the accumulation of TAG. Additionally, LNC_012569 acts as an miR396h sponge and derepresses FAD2, which is beneficial to FA elongation and linoleic acid synthesis at the same time.
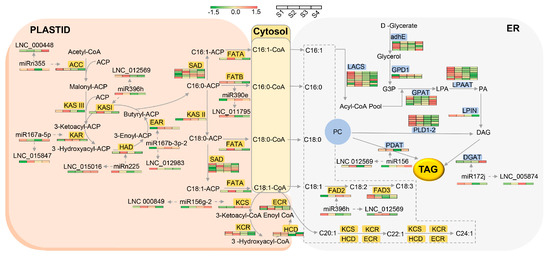
Figure 13.
Schematic diagram representing FA biosynthesis and oil accumulation in yellowhorn seeds. Key DEL–DEM–DEG modules and their expression levels in the transcriptome are marked in this diagram.
In future work, transgenic plants that overexpress positive regulators or knockout negative regulators in oil accumulation could be generated through genetic engineering. Moreover, the identification of key genes or RNA could elicit the dynamic change of downstream genes or regulatory networks. Our results could serve as a new theoretical reference for improving oil content in other woody oil crops.
5. Conclusions
During yellowhorn seed development, 325 lncRNAs were suggested to be interacting with 58 key genes in fatty acid (FA) and triacylglycerol (TAG) biosynthesis pathways. In addition, 55 miRNAs may target 26 key genes involved in FA and TAG biosynthesis. Interestingly, 30 lncRNA–miRNA–gene modules involved in FA and TAG biosynthesis were identified, in which the KCS11-1–miR156g-2–LNC_000849 module was found to participate in nervonic acid synthesis, and the DGAT-2–miR172j–LNC_005874 module was assumed to contribute to the accumulation of TAG. Our results highlight potential contributions of lncRNAs to oil accumulation in yellowhorn seeds.
Supplementary Materials
The following supporting information can be downloaded at: https://www.mdpi.com/article/10.3390/f14020407/s1. Figure S1. Pearson correlation of gene expression levels between samples (a) and principal component analysis (PCA) of samples (b). Figure S2. GO enrichment analysis of DELs in S2 vs. S1, S3 vs. S2, and S4 vs. S3. The top 20 GO categories of DELs are displayed. Figure S3. Network of DEL-DEG pairs related to FA and TAG biosynthesis pathways. The DEGs are displayed as red circles, and the DELs are represented by blue circles. Figure S4. GO enrichment analysis of DEMs in S2 vs. S1, S3 vs. S2, and S4 vs. S3. The top 20 GO categories of the DEMs are displayed. Figure S5. Electrophoretogram of PCR products of actin, miR166u, miR396a-4, miR156a-2, miR156f-5p, miR167a-5p, and miR172j in S3. Table S1. Primers used in this study. Table S2. Data quality of stranded RNA-seq in Xanthoceras sorbifolium. Table S3. Summary of stranded RNA-seq mapping. Table S4. DEGs involved in FA and TAG pathways. Table S5. DEL–DEG pairs in FA and TAG pathways. Table S6. Data quality of sRNA-seq in Xanthoceras sorbifolium. Table S7. Summary of sRNA-seq mapping. Table S8. Identified known miRNAs and novel miRNAs. Table S9. Putative target genes of 239 DEMs. Table S10. DEM–DEG pairs involved in FA and TAG synthesis pathways. Table S11. lncRNAs that may serve as miRNA precursors. Table S12. DEG–DEM–DEL network involved in FA and TAG synthesis.
Author Contributions
Conceptualization, C.R. and Y.L.; running the experiments, Y.H. and J.L.; data analysis and statistics, Y.H and J.L.; manuscript writing and revising, Y.H., C.R., and Y.L. All authors have read and agreed to the published version of the manuscript.
Funding
This work was supported by the Key R & D Plan of Liaoning Province (Grant No. 2020JH2-10200042) and the Rural Revitalization Project of Science and Technology Innovation Fund Plan of Dalian City (Grant No. 2021JJ13SN75).
Data Availability Statement
The strand-specific library and sRNA-seq data have been deposited in the NCBI SRA database under accession numbers PRJNA818439 and PRJNA818424.
Conflicts of Interest
The authors declare no conflict of interest.
Abbreviations
Acetyl-CoA carboxylase/biotin carboxylase, ACC; aldehyde dehydrogenases, adhE; Diacylglycerol O-acyltransferase, DGAT; Trans-2, 3-enoyl CoA reductase, ECR; β-hydroxyacyl CoA dehydrase, HCD; malonyl-CoA-ACP transacylase, MCMT; 3-oxoacyl-(acyl-carrier-protein) synthase II/III, KAS II/III; 3-oxoacyl-[acyl-carrier protein] reductase, KAR; β-ketoacyl CoA reductase, KCR; Stearoyl-ACP Desaturase, SAD; glycerol-3-phosphate dehydrogenase, GPD; glycerol-3-phosphate O-acyltransferase, GPAT; diacylglycerol O-acyltransferase, DGAT; phospholipase D, PLD1-2; 3-ketoacyl-CoA synthase, KCS; 3-hydroxyacyl-ACP dehydrase, HAD; enoyl-ACP reductase, EAR; Long-chain acyl-CoA synthetase, LACS; Lysophosphatidic acid acyltransferase, LPAT; Phosphatidate phosphatase, LPIN; Phospholipid-DAG acyltransferase, PDAT; Fatty acid desaturase, FAD; Fatty acid elongation 1, FAE1; Phosphatidylcholine, PC; Fragments per kilobase of transcript sequence per million base pairs sequenced, FPKM; Transcript per million, TPM.
References
- Venegas-Calerón, M.; Ruíz-Méndez, M.V.; Martínez-Force, E.; Garcés, R.; Salas, J.J. Characterization of Xanthoceras sorbifolium Bunge seeds: Lipids, proteins and saponins content. Ind. Crops Prod. 2017, 109, 192–198. [Google Scholar] [CrossRef]
- Ruan, C.J.; Yan, R.; Wang, B.X.; Mopper, S.; Guan, W.K.; Zhang, J. The importance of yellow horn (Xanthoceras sorbifolia) for restoration of arid habitats and production of bioactive seed oils. Ecol. Eng. 2017, 99, 504–512. [Google Scholar] [CrossRef]
- Zhao, Y.; Liu, X.; Wang, M.; Bi, Q.; Cui, Y.; Wang, L. Transcriptome and physiological analyses provide insights into the leaf epicuticular wax accumulation mechanism in yellowhorn. Hortic. Res. 2021, 8, 134. [Google Scholar] [CrossRef]
- Bates, P.D.; Stymne, S.; Ohlrogge, J. Biochemical pathways in seed oil synthesis. Curr. Opin. Plant Biol. 2013, 16, 358–364. [Google Scholar] [CrossRef]
- Okuley, J.; Lightner, J.; Feldmann, K.; Yadav, N.; Lark, E.; Browse, J. Arabidopsis FAD2 gene encodes the enzyme that is essential for polyunsaturated lipid synthesis. Plant Cell 1994, 6, 147–158. [Google Scholar]
- Vrinten, P.; Hu, Z.; Munchinsky, M.A.; Rowland, G.; Qiu, X. Two FAD3 desaturase genes control the level of linolenic acid in flax seed. Plant Physiol. 2005, 139, 79–87. [Google Scholar] [CrossRef]
- Fillet, S.; Ronchel, C.; Callejo, C.; Fajardo, M.J.; Moralejo, H.; Adrio, J.L. Engineering Rhodosporidium toruloides for the production of very long-chain monounsaturated fatty acid-rich oils. Appl. Microbiol. Biot. 2017, 101, 7271–7280. [Google Scholar] [CrossRef]
- Correa, S.M.; Fernie, A.R.; Nikoloski, Z.; Brotman, Y. Towards model-driven characterization and manipulation of plant lipid metabolism. Prog. Lipid Res. 2020, 80, 101051. [Google Scholar] [CrossRef]
- Wang, K.C.; Chang, H.Y. Molecular mechanisms of long noncoding RNAs. Mol. Cell 2011, 43, 904–914. [Google Scholar] [CrossRef]
- Yin, D.D.; Li, S.S.; Shu, Q.Y.; Gu, Z.Y.; Wu, Q.; Feng, C.Y.; Xu, W.Z.; Wang, L.S. Identification of microRNAs and long non-coding RNAs involved in fatty acid biosynthesis in tree peony seeds. Gene 2018, 666, 72–82. [Google Scholar] [CrossRef]
- Zhang, C.C.; Ren, H.D.; Yao, X.H.; Wang, K.L.; Chang, J. Full-length transcriptome analysis of pecan (Carya illinoinensis) kernels. G3-Genes Genom. Genet. 2021, 11, jkab182. [Google Scholar] [CrossRef]
- Xia, W.; Dou, Y.J.; Liu, R.; Gong, S.F.; Huang, D.Y.; Fan, H.K.; Xiao, Y. Genome-wide discovery and characterization of long noncoding RNAs in African oil palm (Elaeis guineensis Jacq.). PeerJ 2020, 8, e9585. [Google Scholar] [CrossRef]
- Shen, E.; Zhu, X.; Hua, S.; Chen, H.; Ye, C.; Zhou, L.; Liu, Q.; Zhu, Q.H.; Fan, L.; Chen, X. Genome-wide identification of oil biosynthesis-related long non-coding RNAs in allopolyploid Brassica napus. BMC Genom. 2018, 19, 745. [Google Scholar] [CrossRef]
- Chen, J.; Wu, Z.R.; Li, R.Y.; Huang, D.J.; Zhai, W.; Chen, C.H. New insight into LncRNA-mRNA regulatory network associated with lipid biosynthesis using Hi-C data in seeds of tung tree (Vernicia fordii Hemsl.). Ind. Crops Prod. 2021, 164, 113321. [Google Scholar] [CrossRef]
- Ao, Y. Characterization and comparison of flower bud microRNAs from yellow-horn species. Genet. Mol. Res. 2016, 15, gmr.15048899. [Google Scholar] [CrossRef]
- Wang, L.; Ruan, C.J.; Bao, A.M.; Li, H. Small RNA profiling for identification of microRNAs involved in regulation of seed development and lipid biosynthesis in yellowhorn. BMC Plant Biol. 2021, 21, 464. [Google Scholar] [CrossRef]
- Yang, W.; Wang, G.; Li, J.; Bates, P.D.; Wang, X.; Allen, D.K. Phospholipase Dζ Enhances Diacylglycerol Flux into Triacylglycerol. Plant Physiol. 2017, 174, 110–123. [Google Scholar] [CrossRef]
- Das, A.; Nigam, D.; Junaid, A.; Tribhuvan, K.U.; Kumar, K.; Durgesh, K.; Singh, N.K.; Gaikwad, K. Expressivity of the key genes associated with seed and pod development is highly regulated via lncRNAs and miRNAs in Pigeonpea. Sci. Rep. 2019, 9, 18191. [Google Scholar] [CrossRef]
- Bi, Q.; Zhao, Y.; Du, W.; Lu, Y.; Gui, L.; Zheng, Z.; Yu, H.; Cui, Y.; Liu, Z.; Cui, T.; et al. Pseudomolecule-level assembly of the Chinese oil tree yellowhorn (Xanthoceras sorbifolium) genome. GigaScience 2019, 8, giz070. [Google Scholar] [CrossRef]
- Shockey, J.M.; Gidda, S.K.; Chapital, D.C.; Kuan, J.C.; Dhanoa, P.K.; Bland, J.M.; Rothstein, S.J.; Mullen, R.T.; Dyer, J.M. Tung tree DGAT1 and DGAT2 have nonredundant functions in triacylglycerol biosynthesis and are localized to different subdomains of the endoplasmic reticulum. Plant Cell 2006, 18, 2294–2313. [Google Scholar] [CrossRef]
- Pertea, M.; Kim, D.; Pertea, G.M.; Leek, J.T.; Salzberg, S.L. Transcript-level expression analysis of RNA-seq experiments with HISAT, StringTie and Ballgown. Nat. Protoc. 2016, 11, 1650–1667. [Google Scholar] [CrossRef] [PubMed]
- Trapnell, C.; Williams, B.A.; Pertea, G.; Mortazavi, A.; Kwan, G.; van Baren, M.J.; Salzberg, S.L.; Wold, B.J.; Pachter, L. Transcript assembly and quantification by RNA-Seq reveals unannotated transcripts and isoform switching during cell differentiation. Nat. Biotechnol. 2010, 28, 511–515. [Google Scholar] [CrossRef] [PubMed]
- Langmead, B.; Salzberg, S.L. Fast gapped-read alignment with Bowtie 2. Nat. Methods 2012, 9, 357–359. [Google Scholar] [CrossRef] [PubMed]
- Wen, M.; Shen, Y.; Shi, S.; Tang, T. miREvo: An integrative microRNA evolutionary analysis platform for next-generation sequencing experiments. BMC Bioinform. 2012, 13, 140. [Google Scholar] [CrossRef]
- Friedländer, M.R.; Mackowiak, S.D.; Li, N.; Chen, W.; Rajewsky, N. miRDeep2 accurately identifies known and hundreds of novel microRNA genes in seven animal clades. Nucleic Acids Res. 2012, 40, 37–52. [Google Scholar] [CrossRef]
- Dai, X.; Zhuang, Z.; Zhao, P.X. psRNATarget: A plant small RNA target analysis server (2017 release). Nucleic Acids Res. 2018, 46, 49–54. [Google Scholar] [CrossRef]
- Love, M.I.; Huber, W.; Anders, S. Moderated estimation of fold change and dispersion for RNA-seq data with DESeq2. Genome Biol. 2014, 15, 550. [Google Scholar] [CrossRef]
- Young, M.D.; Wakefield, M.J.; Smyth, G.K.; Oshlack, A. Gene ontology analysis for RNA-seq: Accounting for selection bias. Genome Biol. 2010, 11, R14. [Google Scholar] [CrossRef]
- Xie, C.; Mao, X.Z.; Huang, J.J.; Ding, Y.; Wu, J.M.; Dong, S.; Kong, L.; Gao, G.; Li, C.Y.; Wei, L.P. KOBAS 2.0: A web server for annotation and identification of enriched pathways and diseases. Nucleic Acids Res. 2011, 39, 316–322. [Google Scholar] [CrossRef]
- Livak, K.J. and Schmittgen, T.D. Analysis of relative gene expression data using real-time quantitative PCR and the 2(-Delta Delta C(T)) Method. Methods 2001, 25, 402–408. [Google Scholar] [CrossRef]
- Lin, X.; Lin, W.G.; Ku, Y.S.; Wong, F.L.; Li, M.W.; Lam, H.M.; Ngai, S.M.; Chan, T.F. Analysis of Soybean Long Non-Coding RNAs Reveals a Subset of Small Peptide-Coding Transcripts. Plant Physiol. 2020, 182, 1359–1374. [Google Scholar] [CrossRef] [PubMed]
- Ma, X.L.; Zhang, X.G.; Traore, S.M.; Xin, Z.Y.; Ning, L.L.; Li, K.; Zhao, K.K.; Li, Z.F.; He, G.H.; Yin, D.M. Genome-wide identification and analysis of long noncoding RNAs (lncRNAs) during seed development in peanut (Arachis hypogaea L.). BMC Plant Biol. 2020, 20, 192. [Google Scholar] [CrossRef] [PubMed]
- Tan, X.Y.; Li, S.; Hu, L.Y.; Zhang, C.L. Genome-wide analysis of long non-coding RNAs (lncRNAs) in two contrasting rapeseed (Brassica napus L.) genotypes subjected to drought stress and re-watering. BMC Plant Biol. 2020, 20, 81. [Google Scholar] [CrossRef] [PubMed]
- Hatanaka, T.; Serson, W.; Li, R.Z.; Armstrong, P.; Yu, K.S.; Pfeiffer, T.; Li, X.L.; Hildebrand, D. A Vernonia Diacylglycerol Acyltransferase Can Increase Renewable Oil Production. J. Agric. Food Chem. 2016, 64, 7188–7194. [Google Scholar] [CrossRef] [PubMed]
- Pan, X.; Peng, F.Y.; Weselake, R.J. Genome-wide analysis of phospholipid:diacylglycerol acyltransferase (PDAT) genes in plants reveals the eudicot-wide PDAT gene expansion and altered selective pressures acting on the core eudicot PDAT paralogs. Plant Physiol. 2015, 167, 887–904. [Google Scholar] [CrossRef] [PubMed]
- Huang, R.M.; Zhou, Y.; Zhang, J.P.; Ji, F.Y.; Jin, F.; Fan, W.; Pei, D. Transcriptome Analysis of Walnut (Juglans regia L.) Embryos Reveals Key Developmental Stages and Genes Involved in Lipid Biosynthesis and Polyunsaturated Fatty Acid Metabolism. J. Agric. Food Chem. 2021, 69, 377–396. [Google Scholar] [CrossRef] [PubMed]
- Pan, X.; Siloto, R.M.P.; Wickramarathna, A.D.; Mietkiewska, E.; Weselake, R.J. Identification of a Pair of Phospholipid:Diacylglycerol Acyltransferases from Developing Flax (Linum usitatissimum L.) Seed Catalyzing the Selective Production of Trilinolenin. J. Biol. Chem. 2013, 288, 24173–24188. [Google Scholar] [CrossRef] [PubMed]
- Chen, J.; Liu, W.; Fan, Y.; Zhou, X.; Tang, X.; Zhang, L. Identification and analysis of tRNA genes provide new insights into oil biosynthesis in tung tree (Vernicia fordii Hemsl.). Ind. Crops Prod. 2019, 137, 74–80. [Google Scholar] [CrossRef]
- Zhao, X.; Yang, G.; Liu, X.; Yu, Z.; Peng, S. Integrated Analysis of Seed microRNA and mRNA Transcriptome Reveals Important Functional Genes and microRNA-Targets in the Process of Walnut (Juglans regia) Seed Oil Accumulation. Int. J. Mol. Sci. 2020, 21, 9093. [Google Scholar] [CrossRef]
- Beaudoin, F.; Wu, X.; Li, F.; Haslam, R.P.; Markham, J.E.; Zheng, H.; Napier, J.A.; Kunst, L. Functional characterization of the Arabidopsis beta-ketoacyl-coenzyme A reductase candidates of the fatty acid elongase. Plant Physiol. 2009, 150, 1174–1191. [Google Scholar] [CrossRef]
- Li, Z.W.; Ma, S.J.; Song, H.; Yang, Z.; Zhao, C.Z.; Taylor, D.; Zhang, M. A 3-ketoacyl-CoA synthase 11 (KCS11) homolog from Malania oleifera synthesizes nervonic acid in plants rich in 11Z-eicosenoic acid. Tree Physiol. 2021, 41, 331–342. [Google Scholar] [CrossRef] [PubMed]
- Hajiahmadi, Z.; Abedi, A.; Wei, H.; Sun, W.B.; Ruan, H.H.; Qiang, Z.G.; Movahedi, A. Identification, evolution, expression, and docking studies of fatty acid desaturase genes in wheat (Triticum aestivum L.). BMC Genom. 2020, 21, 778. [Google Scholar] [CrossRef] [PubMed]
- Zhang, Y.P.; Zhang, Y.Y.; Thakur, K.; Zhang, F.; Hu, F.; Zhang, J.G.; Wei, P.C.; Wei, Z.J. Integration of miRNAs, Degradome, and Transcriptome Omics Uncovers a Complex Regulatory Network and Provides Insights Into Lipid and Fatty Acid Synthesis During Sesame Seed Development. Front. Plant Sci. 2021, 12, 709197. [Google Scholar] [CrossRef] [PubMed]
- Zheng, Y.; Chen, C.; Liang, Y.; Sun, R.; Gao, L.; Liu, T.; Li, D. Genome-wide association analysis of the lipid and fatty acid metabolism regulatory network in the mesocarp of oil palm (Elaeis guineensis Jacq.) based on small noncoding RNA sequencing. Tree Physiol. 2019, 39, 356–371. [Google Scholar] [CrossRef]


Disclaimer/Publisher’s Note: The statements, opinions and data contained in all publications are solely those of the individual author(s) and contributor(s) and not of MDPI and/or the editor(s). MDPI and/or the editor(s) disclaim responsibility for any injury to people or property resulting from any ideas, methods, instructions or products referred to in the content. |
© 2023 by the authors. Licensee MDPI, Basel, Switzerland. This article is an open access article distributed under the terms and conditions of the Creative Commons Attribution (CC BY) license (https://creativecommons.org/licenses/by/4.0/).