Abstract
Forests cover about 1/3 of Europe’s land area and are an important source in providing goods and services such as timber, drinking water, biodiversity, and carbon storage. They are important for a bioeconomy to mitigate climate change effects by reducing greenhouse gas emissions from the combustion of fossil fuels. The purpose of this paper is to assess Europe’s potential wood supply by harvesting system. Gridded forest characteristics data are combined with other European spatially-explicit data. A set of eight mechanized harvesting systems is applied to assess the “forest available for wood supply” (FAWS) in Europe. The results show that 74.9% of the total forest area in Europe can be considered FAWS and has the potential to be harvested under the current economic and technical harvesting conditions. The remaining forest area is under legal protection (4.3%) or has limited accessibility with the current mechanized harvesting systems (20.8%). Around 79% of the FAWS can be accessed with ground-based machinery, and another 16% if their operation range is extended using special attachments (e.g., chains or band) or winch-assisted systems. Around 5% of the FAWS is only accessible by cable yarding machinery. With the fully mechanized harvesting systems (i) harvester and forwarder and (ii) winch-assisted harvester and winch-assisted forwarder, about 80% of the harvestable forest area and growing stock can potentially be utilized.
1. Introduction
While a severe decline in forest cover is evident in large parts of the world, Europe is the only continent with a continuous increase in forest area during the last 100 years [1]. Currently, more than 1/3, or 227 million ha, of Europe’s total land area is covered with forests [1]. Forests in Europe provide a variety of ecosystem services, such as timber production, water supply, biodiversity, protection of infrastructure, as well as recreation and welfare. Further, they are of increasing importance in mitigating climate change effects due to their carbon storage potential.
In achieving the climate targets of Europe, the transformation towards a sustainable forest bioeconomy is necessary [2]. Renewable wood from sustainable forest management will be an integral part of it, with a focus on the promotion of long-lived wood products [3,4]. It is expected that the importance of sustainable forest management will increase.
Europe’s forest area can be distinguished into forest areas available for sustainable harvesting versus protected forests not available for harvesting, e.g., national parks and nature conservation [5]. According to the State of Europe’s Forests 2020 report, about 50 million ha, or 23.6% of the forests in Europe, are in protected areas [1]. In most of these areas, limited harvesting is allowed if the other services, such as conservation of biodiversity, the protection of the forest soil or infrastructure, the provision of non-wood products (e.g., drinking water) or recreation near urban areas, is secured. Only in 5% of Europe’s forest area no harvesting is allowed due to its legal protection status [1]. However, with the EU aiming to protect and restore already degraded ecosystems [6], this share is expected to rise.
Even if no legal harvesting restrictions exist, timber harvesting may not be feasible due to low yield productivity, inaccessibility of the forest area, or lack of profitability. Therefore, the Food and Agriculture Organization of the United Nations (FAO) distinguishes forest areas into (i) ‘forest available for wood supply’ (FAWS) and (ii) ‘forest not available for wood supply’ (FNAWS) [5]. FAWS include forests with no environmental, social or economic restrictions, while FNAWS cover forest areas with legal restrictions on timber harvesting but also those forest areas which lack profitability. According to the State of Europe’s Forests 2020, around 77% of Europe’s forest can be considered FAWS and the remaining 23% FNAWS.
Commonly, information about the forest area, as well as the stocking biomass, is available at the country and sub-country level (NUTS—Nomenclature of territorial units for statistics) (see [7,8,9]). It includes the harvesting possibilities according to different regulations for Land Use as well as Land Use Change and Forestry (EU-LULUCF) [10].
The provision of wood as raw material depends on the growing stock and the work force for cost-efficient harvesting. Since the European forest sector faces a severe decline in man power due to aging [11] and the forest area available for wood supply will decline if more forest areas are protected [6], cost-efficient, mechanized harvesting systems are of increasing importance to secure the provision of wood [12,13]. Mechanized harvesting additionally increases harvesting safety [14] and makes forestry jobs more attractive. A recent example is the increased use of winch-assisted systems for mechanized timber harvesting operations on steep terrain [14,15].
The implementation of a timber harvesting system depends largely on the technical requirements at the harvesting site (e.g., slope, soil bearing capacity, tree dimension, and species), and the accessibility of the forest area defined by the road network density [16]. In general, from all applicable harvesting systems at a harvesting site, the most mechanized harvesting systems is the most cost-efficient. The cost relationship between harvesting systems can, however, change depending on local factors such as the silvicultural system (e.g., clearfell, group, or selection system) or the price and availability of the work force [17,18,19]. GIS-based spatial solutions have been used at the regional level to select the most suitable timber harvesting system [19,20,21,22,23,24,25]. Di Fulvio et al. [26] assessed the availability, costs of roundwood, and the logging residues on a European level using the G4M computer model [27] and by defining 10 different harvesting options according to felling, extraction, and storage method.
The purpose of this study is to provide an estimate of the forest area and growing stock potentially available for mechanized harvesting in Europe. We obtain gridded forest characteristics data, combine this data with other European spatially-explicit information, and apply a set of eight different mechanized harvesting systems. The ‘forest available for wood supply’ (FAWS) is estimated using a top-down approach, which applies the same restrictions and threshold values across European forests.
We are interested in:
- Quantifying the area of ‘forest available for wood supply’ (FAWS) versus the ‘forest not available for wood supply’ (FNAWS)—The harvestable forest area;
- Delineating the area of and growing stock in FAWS by harvesting system for Europe, European geographic region, and country—Harvestable area and growing stock by harvesting system.
2. Materials and Methods
We assess the harvesting options in Europe’s forest by combining forest characteristics [28] and other spatial data (e.g., slope, soil, road network; see next chapter) with the technical limitations of different harvesting systems. We use the Geographic Information System (GIS), ESRI® ArcGIS (Version 10.2.1, Redlands, CA, USA) [29] for initial data processing (e.g., re-projecting data) and handling the OpenStreetMap road data (see 2.1.5 Road network below). The statistical software R (Version 4.1.2, Vienna, Austria) [30] is used for further data processing (e.g., aggregation), the analysis of the data (e.g., identifying the harvesting systems), and the creation of the maps. The harvesting system analysis is conducted on a 500 m × 500 m-grid using the ETRS89-LAEA (European Terrestrial Reference System 89-Lambert Azimuthal Equal-Area) projection. The workflow of our analysis, including the input data, is shown in Figure 1.
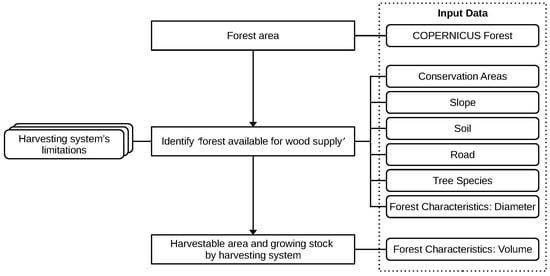
Figure 1.
General workflow of the analysis. COPERNICUS forest data are used for generating a forest area mask. ‘Forest available for wood supply’ is the forest area where harvesting is legally allowed as well as profitable. Conservation areas data are used to identify protected forest where harvesting is prohibited. The defined harvesting systems are used to identify areas where economically profitable harvesting is feasible. Harvestable forest area and growing stock are cumulated by the harvesting system and are provided at a European and regional level.
2.1. Input Data
2.1.1. COPERNICUS Forest
Forested areas are identified using the Forest Type 2018 product of the Copernicus Land Monitoring Service, provided by the European Environment Agency [31]. The data are available either at the original 10 m resolution or aggregated at a 100 m resolution. In our analysis, we use the aggregated forest type product where a 100 m × 100 m grid cell (1 hectare) is considered a forest cell if at least 50% of the enclosed 10 m cells are covered with forests. The forest area for each 500 m cell is derived as the sum of the forested 100 m cells and ranges between 0 and 25 ha of the forest land.
2.1.2. Conservation Areas
According to the State of Europe’s Forest 2020, about 5% of the forested area is legally protected and no active or only minimum interventions are allowed [1]. Protected areas are identified from the Common Database on Designated Areas for the year 2021 (Version 19) shapefile, provided by the United Nations Environment Program World Conservation Monitoring Centre (UNEP-WCMC) in collaboration with the European Environment Agency (EEA) [32]. Areas belonging to the International Union for Conservation of Nature (IUCN) categories “Ia” (strict nature reserve), “Ib” (wilderness area) and “II” (national park) are considered as not available for harvesting activities. These categories correspond to the MCPFE (Pan-European Ministerial Conference on the Protection of Forests in Europe) classes “1.1 No Active Intervention” and “1.2 Minimum Intervention” [33]. Using these categories follows the suggestion by Alberdi et al. [9] for estimating the protected areas belonging to “forest not available for wood supply” (FNAWS). A forest area mask is created, which defines the total forested area and its proportion of “protected” versus potentially “harvestable” area.
2.1.3. Slope
The European Union Digital Elevation model [34] with a 25 m resolution is used to derive the slope in percent for each 25 m × 25 m cell. The calculation of the slope is based on 8 neighboring cells using the raster package provided by [35] in the statistical software R (Version 4.1.2, Vienna, Austria) [30]. Each 25 m cell is assigned to one of three slope classes: (i) <30% (ii) 30 to 60%, and (iii) ≥60%. The three slope classes correspond to the operation range of different harvesting systems (see Section 2.2 Harvesting Systems below). The slope class for each 500 m grid cell is derived by combining the slope class share and the mean slope of the 500 m cell.
2.1.4. Soil
Soil bearing capacity is an indicator for trafficability and is strongly affected by soil type, soil texture, and soil moisture content. In general, bearing capacity decreases with an increasing moisture content [36,37]. Particularly, soils with groundwater access cannot be traversed by heavy machinery or traffic is limited to frozen or very dry periods [38].
We use soil data at a 1 km × 1 km resolution from the European Soil Database v2 (ESDB) [39] of the European Soil Data Centre [40] to identify soil types influenced by groundwater. Combining the AGLIM1, AGLIM2, PEAT, FAO85-FULL, FAO85-LEV1 and WRB-LEV1 attributes, the following soil types influenced by groundwater are considered: (i) gleyic and stagnic Albeluvisol, (ii) gleyic and fluvic Cambisol, (iii) gleyic Fluvisol, (iv) Gleysol, (v) gleyic Luvisol, (vi) Phaeozem, (vii) Planosol, (viii) gleyic Podzol, and (ix) Umbrisol [41]. Terrain roughness (microtopography) may further limit the use of wheeled and tracked machinery [22]. However, as no data are available at the required level of detail, ground roughness is not considered in our analysis.
2.1.5. Road Network
Freely available road network data from the OpenStreetMap (OSM) community project are used to calculate road density as a proxy for the extraction distance. OSM road data for each country are obtained as shapefiles from Geofabrik (www.geofabrik.de (accessed on 10 April 2019)) and cover the period between January and April 2019. Key-value pairs are used to extract road types relevant to forestry operations, i.e., secondary, tertiary, unclassified, and track. All other road types (e.g., motorway, trunk, primary, or residential) were considered not relevant to forestry operations (see https://wiki.openstreetmap.org/wiki/Key:highway (accessed on 10 February 2023) for details regarding the different road types). For each 500 m cell, road density is derived using the line density tool in the ArcGIS toolbox with 100 m, 300 m, 600 m and 1000 m radii and radius and cell centers aligned. The four radii correspond to the maximum extraction distance of the different harvesting systems, as explained below. The maximum extraction distance for a cell is then determined by the lowest radius with which a road density of at least 1 m/ha is detected. Mean road density for each 500 m cell (25 ha) is calculated using a radius of 282 m, which results in a corresponding circular area of 25 ha.
2.1.6. Forest Characteristics and Tree Species
Forest characteristics are obtained from the latest European forest structure data set [28] in combination with tree species distribution data from the European tree species maps [42]. The forest characteristics data (8 km × 8 km resolution) are based on 350,489 point samples of National Forest Inventory (NFI) data from 16 countries (Albania, Austria, Belgium, Croatia, Estonia, Finland, France, Germany, Ireland, Italy, The Netherlands, Norway, Poland, Romania, Spain, Sweden) covering the years 1996 to 2016. For details of the recorded inventory data by country we refer to [28].
The inventory data are aggregated to 8 km × 8 km grid cells by averaging the metric variables (e.g., height or diameter) and calculating the proportion for nominal values (e.g., age class and tree species group) based on the inventory plots within one cell. The 8 km × 8 km resolution follows the suggestion by Moreno et al. [43], who could show that on average a good balance between spatial resolution and accuracy of the forest characteristics by cell exists.
For countries and regions where no inventory data were available, a two-step gap-filling algorithm which (i) clusters cells by similarity and (ii) fills empty cells using a k-nearest neighbor (kNN) algorithm, is applied. The clustering is based on biogeographical regions [44] and MODIS MCD12Q1 land cover [45] information. For the kNN gap filling, the co-variates MODIS EURO net primary production (NPP) [46], NPP trend, spaceborne LiDAR based canopy height [47], and a climate limitation index are used to match forests with a similar productivity curve and development stage [48]. Pucher et al. [28] showed that gap-filled data provide realistic and unbiased estimates of the growing stock at the European level.
The forest characteristics data provide at an 8 km × 8 km the mean forest information such as biomass, volume, height, diameter at breast height, stem number, stand density index, age class, and tree species group. Thus, all forested 500 m cells within an 8 km grid cell share the same forest characteristics. The diameter at breast height (DBH) is used for selecting the harvesting system, while the volume provides the potentially harvestable growing stock by harvesting system.
Tree species are important for selecting the harvesting system. The forest characteristics data distinguish eight different tree species groups (e.g., coniferous pioneers, slow growing coniferous). However, for our analysis, we use the more detailed (1 km × 1 km) European tree species maps, which provide the dominant tree species and the share of 20 tree species [42]. The dominant tree species identified for a given cell is used for selecting the harvesting system and to distinguish forests dominated by coniferous versus broad-leaved tree species.
2.2. Harvesting Systems
Eight mechanized harvesting systems, which differ in harvesting method, technology and level of mechanization (Table 1) are considered. The harvesting systems are adopted from an earlier study [20], in which a multi-attribute decision support system for selecting timber harvesting systems on a regional level was developed. The harvesting system “tracked harvester and cable-forwarder” [20] is replaced by “winch-assisted harvester and winch-assisted forwarder” to reflect the technical improvements during the last decade [14].

Table 1.
Overview of the eight defined harvesting systems. Each harvesting system is characterized by its limitations regarding terrain (slope, soil), road infrastructure (extraction distance) and stand conditions (species, DBH—diameter at breast height). For the tree species-specific DBH limits, see Table A1 in Appendix A.
Next, we determine which of the eight harvesting systems is suitable for a given cell by matching the technical operation ranges with (i) slope, (ii) soil conditions, (iii) the extraction distance, (iv) tree species, and (v) DBH. If there is more than one harvesting system applicable, the one with the highest level of mechanization is attributed to a given cell.
2.2.1. Terrain Parameters
The slope limit for ground-based harvesting systems varies with soil bearing capacity [49] and may range between 30% to 40% to avoid excessive soil damage [50]. The operation range of ground-based machinery can be extended by special attachments (e.g., chains, bands) or winch-assisted systems [51]. Similar to Kühmaier and Stampfer [20], we use a slope limit of 30% for all ground-based harvesting systems, except for the steep terrain harvester and winch-assisted harvester and forwarder, where the limit is set to 60% [14,50] (Table 1).
Ground-based harvesting systems may have negative impacts on sensitive soils [37,52]. Thus, on groundwater-affected soils, no ground-based harvesting systems are selected except for harvesting by chainsaw and skidder, since we assume that the skidder operates on a pre-defined skidding road. Harvesting with a chainsaw and cable yarding is not limited by the soil since this method is particularly suitable for extraction on sensitive soils [13,53].
2.2.2. Road Network
In general, harvesting systems are limited by an economically feasible extraction distance, while cable harvesting systems are additionally limited by the length of the cable. In this study, we use a maximum extraction distance of (i) 1000 m for forwarder [54], (ii) 600 m for tower yarder [55], (iii) 300 m for winch-assisted forwarder [56,57] and (iv) 100 m for a skidder with winch [20]. Only road types relevant to forest operations were considered in the calculations (see Section 2.1.5 Road network). While extraction on temporary winter roads or by floating timber along lakes and rivers is possible, these extraction methods are not considered in this study.
2.2.3. Forest Characteristics
Mechanized felling is limited by the maximum cutting diameter of the employed harvester head or processor. Today’s harvester heads are mostly designed for a felling diameter between 50 and 70 cm, even though there are some heads that can cut diameters of up to 100 cm [58].
For coniferous trees, we follow the suggestion by Kühmaier and Stampfer [20] and use a more conservative DBH limit of 40 cm for felling by harvester. For cable yarders with integrated or excavator-based processors, this limit is set to 50 cm, because we assume that the butt flare is prepared by chainsaw and therefore is no longer a limiting factor.
For broad-leaved trees, the mechanized processing can be hampered by the branch diameter, forks, crooks, and sweeps, as well as the wood density [59,60]. The diameter of the branches, which usually increases with DBH, limits the machinability with harvester head and processor. We set the DBH limit for mechanized felling and processing equal to 30 cm for all broad-leaved species, except for alder, birch, and eucalyptus, which are usually easy to debranch. Finally, poplar is considered unsuitable for mechanized felling and processing because of its large dimension. A table showing the tree species-specific limits is provided in Appendix A (Table A1).
2.3. Forest Available for Wood Supply
Forests in Europe can be distinguished into ’forest available for wood supply´ (FAWS) and ´forest not available for wood supply´ (FNAWS) [5]. FNAWS include forest areas under legal protection and forest areas, which are economically unsuitable for harvesting. We use the COPERNICUS Forest Type 2018 product to determine the total forest area and combine it with the Common Database on Designated Areas for the year 2021 EEA categories “Ia” (strict nature reserve), “Ib” (wilderness area) and “II” (national park) to identify the forest area under legal protection in Europe.
FNAWS also include forest areas where harvesting is economically not feasible with the current technical standards. In our analysis, we address this by using threshold values for the extraction distance and the tree species-specific DBH for processing (see Table 1). We combine terrain, road, and forest stand data with the operation range of the different harvesting systems presented in Table 1 to identify forest areas accessible with the current mechanized harvesting systems. These areas have the potential for economically profitable harvesting. Areas where none of the defined harvesting systems are applicable are considered “areas with limited accessibility” and added to the FNAWS area.
2.4. Harvestable Volume by Harvesting System
For each forest cell identified as ’forest available for wood supply’ (FAWS), we (i) identify the suitable harvesting systems and (ii) select the harvesting system with the highest level of mechanization. For instance, if both (i) the chainsaw and forwarder and (ii) the harvester and forwarder system were applicable, the cell and its associated forest area and growing stock are attributed to the harvester and forwarder harvesting system.
The growing stock for each 500 m cell is calculated by multiplying the forest area within a cell (derived from the COPERNICUS Forest Type data) with the volume per hectare obtained from the forest characteristics data [28].
3. Results
3.1. Forest Area in Europe
The forest area of the 34 countries of our study covers 183.4 million ha, or 1/3 of the total land area (Table 2). About 7.8 million ha, or 4.3%, are under legal protection, while another 38.2 million ha, or 20.8% (Table 2, Figure 2), are considered as areas with limited accessibility with the current mechanized harvesting systems. Thus, 46.0 million hectares (7.8 and 38.2), or 25.1%, are ‘forest not available for wood supply’ (FNAWS). The remaining 137.4 million ha or 74.9% of the forest are ‘forest available for wood supply’ (FAWS), and represent the “harvestable forest area” of the 34 countries.
Table 2.
Summary of the forest area in Europe (all 34 countries considered) and distinguished by geographic regions and countries. The regions are defined according to the State of Europe’s Forests (FOREST EUROPE, 2020). ‘Forest not available for wood supply’ (FNAWS) comprises protected forest where commercial harvesting is prohibited as well as forest areas with limited accessibility (Lim. Accessibility). All other forest areas are considered as ‘forest available for wood supply’ (FAWS).
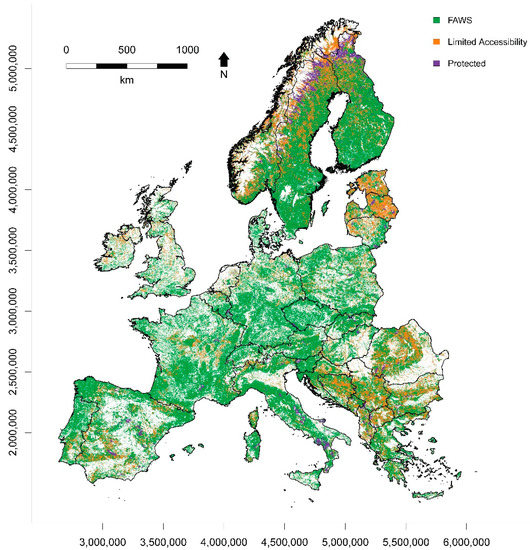
Figure 2.
‘Forest available for wood supply’ (FAWS, green) as well as ‘forest not available for wood supply’ (FNAWS) at 500 m × 500 m resolution. FNAWS is further separated into legally protected areas (purple) or areas with limited accessibility (orange). Forested areas are identified using COPERNICUS data at 100 m × 100 m resolution.
As shown in Table 2, the share of FNAWS versus FAWS varies largely by country and major geographic region. In Central-West Europe, 90% of the forest land is FAWS, while only 62% in South-East Europe is available for harvesting. The forest area under legal protection ranges from 1.1% in Central-West Europe to 7.1% in North Europe. At the country level, the variation between FNAWS and FAWS is even more pronounced and, for FAWS, ranges from less than 50% in Estonia, Latvia, Albania, and North Macedonia to over 90% in Denmark, Austria, Belgium, Germany, and the Czech Republic (see Table 2).
The Harvestable Forest Area
Harvesting operations are usually conducted if economically profitable. Profitability—among other factors—depends mostly on (i) forest stand characteristics, (ii) the species type (coniferous vs. broad-leaved), (iii) the slope, (iv) the road density or extraction distance, and (v) if ground water affects the soil, indicating sensitive harvesting conditions.
In Europe, about 2/3 of the harvestable forest area is dominated by coniferous and 1/3 by broad-leaved species (Table 3). In addition, 78.1% of the harvestable forest area is located on slopes < 30%, while the shares of slopes from 30 to 60%, and >60%, are 18% and 4%, respectively (Table 3). Higher forest road densities result in shorter extraction distances and allow the selection of less cost-intensive harvesting systems. Our analysis shows that 68.0% of the harvestable forest area is located within 300 m of the next forest road and only 8.1% of the forests revealed an extraction distance of >600 m. In addition, 2.9% of the harvestable forest area is located on soils affected by groundwater, where harvesting operations are limited to frozen soil conditions during the winter to avoid excessive soil damage (Table 3).
Table 3.
The area of ‘forest available for wood supply’ (FAWS), the average road density and area of FAWS, according to dominant tree species type, slope, soil and road infrastructure conditions, are given for Europe and by region. Dominant tree species type was provided by the tree species maps for European forests [42]. Note that only the dominant tree species is considered and that a forest area dominated by coniferous tree species need not necessarily be a coniferous forest. Regions: (i) Europe: all of the 34 countries mentioned; (ii) North Europe: Denmark, Estonia, Finland, Latvia, Lithuania, Norway, Sweden; (iii) Central-West Europe: Austria, Belgium, France, Germany, Ireland, Lichtenstein, Luxembourg, The Netherlands, Switzerland, United Kingdom; (iv) Central-East Europe: Czech Republic, Hungary, Poland, Romania, Slovakia; (v) South-West Europe: Italy, Portugal, Spain; and (vi) South-East Europe: Albania, Bosnia and Herzegovina, Bulgaria, Croatia, Greece, Montenegro, North Macedonia, Serbia, Slovenia.
As expected, there are distinct differences between geographic regions and countries within Europe. In North Europe, 85.6% of the forest area is dominated by coniferous tree species and 96.8% of the harvestable forest area is located on flat terrain. With an average road density of 9 m/ha and an average extraction distance > 300 m for 45% of the harvestable forest area, it is the region with the lowest road infrastructure (Table 3). In Central-West Europe, 3/4 of the FAWS are located on flat terrain, with 55.8% dominated by coniferous and 43.2% by broad-leaved species. With a road density of 30.2 m/ha and 50% of the harvestable forest area within a distance of <100 m from the next forest road, it is the region with the best developed road infrastructure. Central-East Europe is similar to North Europe, where the majority of FAWS are located on flat terrain and most of the area (around 3/4) is dominated by coniferous species. Compared to North Europe, Central-East Europe has a better road infrastructure, with on average 17.7 m/ha. With 5.9% and 4.0%, Central-West and Central-East Europe have the highest share of FAWS on soil affected by groundwater (Table 3).
The FAWS (forest available for wood supply) in South-West and South-East Europe are dominated by broad-leaved species (55.0% and 80.4%) and 32.9% in South-West and 40% in South-East are located on slopes ranging from 30% to 60%. Only 8.8% and 6.2% (South-West and South-East) are on slopes > 60%. The road infrastructure, with an average of 11 m/ha in South-East Europe, is similar to North Europe (9 m/ha), while South-West Europe, with 19.5 m/ha, exhibits the second highest road density of all five geographic regions (Table 3).
3.2. Harvestable Area and Volume by Harvesting System
Next, we were interested in the spatial distribution (Figure 3) of the eight mechanized harvesting systems. Note that if more than one harvesting system is possible, the most mechanized one is chosen, assuming that it is the most cost-efficient, and thus preferred harvesting system. In addition, 70.8% of the harvestable forest area and 66.7% of the growing stock can be utilized with harvester and forwarder (HFW) (Table 4 and Table 5). Winch-assisted harvester and winch-assisted forwarder (WHWF), as well as the steep terrain harvester and tower yarder (SHTY), both fully mechanized harvesting systems, are suitable on 11.7% and 4.2% of the forest area, as well as 12.2% and 3.9% of the growing stock (Table 4 and Table 5).
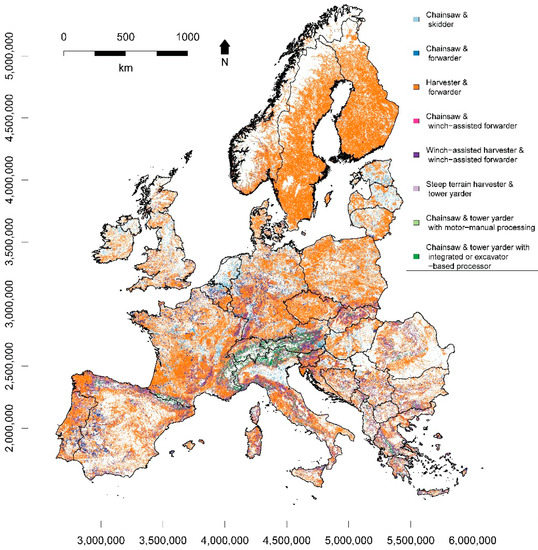
Figure 3.
Harvesting systems map at 500 m × 500 m resolution. The harvesting systems shown for each 500 m cell are identified by comparing the harvesting systems technical limitations (see Table 1) with the terrain, infrastructure and stand conditions of the cell. If more than one harvesting system is applicable for an area, only the harvesting system with the highest degree of mechanization is shown. The harvesting systems are: (i) chainsaw and skidder (light blue), (ii) chainsaw and forwarder (dark blue), (iii) harvester and forwarder (orange), (v) chainsaw and winch-assisted forwarder (pink), (v) winch-assisted harvester and winch-assisted forwarder (dark purple), (vi) steep terrain harvester and tower yarder (light purple), (vii) chainsaw and tower yarder with motor-manual processing (light green), and (viii) chainsaw and tower yarder with integrated or excavator-based processor (dark green).
Table 4.
Share of area of ‘forest available for wood supply’ (FAWS) by harvesting system for Europe and the five European regions and countries. FAWS corresponds to forest where harvesting is allowed from a legal perspective and is profitable. Harvesting Systems: CSK—chainsaw and skidder, CFW—chainsaw and forwarder, HFW—harvester and forwarder, CWF—chainsaw and winch-assisted forwarder, WHWF—winch-assisted harvester and winch-assisted forwarder, SHTY—steep terrain harvester and tower yarder, CTY—chainsaw and tower yarder, CTYP—chainsaw and tower yarder with integrated or excavator-based processor.
Table 5.
Share of growing stock in ‘forest available for wood supply’ (FAWS) per harvesting system for Europe and the five European regions and countries. FAWS corresponds to forest where harvesting is allowed from a legal perspective, and is profitable. Harvesting systems: CSK—chainsaw and skidder, CFW—chainsaw and forwarder, HFW—harvester and rorwarder, CWF—chainsaw and winch-assisted Forwarder, WHWF—winch-assisted harvester and winch-assisted forwarder, SHTY—steep terrain harvester and tower yarder, CTY—chainsaw and tower yarder, CTYP—chainsaw and tower yarder with integrated or excavator-based processor.
Chainsaw and tower yarder with integrated or excavator-based processor (CTYP) are potentially suitable on 4.3% of the forest area and 5.1% of the growing stock. On the remaining 8.9% of the forest area and 12.1% of the growing area, mechanization is only partly possible by employing chainsaw and skidder (CSK), chainsaw and forwarder (CFW), chainsaw and winch-assisted forwarder (CWF), and chainsaw and tower yarder (CTY) for harvesting.
In North Europe, over 95% of the forest area and growing stock are potentially harvestable with fully mechanized systems. Within the region, HFW is the dominant harvesting system (94.7% of the harvestable forest area and 94.5% of the growing stock), while in South-East Europe this system is suitable for less than half of the harvestable area and growing stock (45.8% and 42.7%) (Table 4 and Table 5). Since WHWF and SHTY are both suitable for around 1/3 of the forest area and growing stock in South-East Europe, a total of about 3/4 of the forest area and growing stock are harvestable with fully mechanized systems.
Central-West Europe has the lowest potential for mechanization. Nevertheless, 3/4 of the forest area and about 3/4 of the growing stock are suitable for fully mechanized harvesting systems, with HFW being suitable for 60% and the WHWF for around 15% of the forest area and growing stock. South-West Europe is the region with the highest shares (9.5% of the area and 17.9% of the growing stock) of partially and highly mechanized harvesting systems using cable yarding (chainsaw and tower yarder (CTY) and chainsaw and tower yarder with integrated or excavator-based processor (CTYP)), while in North Europe, cable yarding harvesting systems are almost neglectable (see Table 4 and Table 5).
At the country level, the variation is even more evident. For instance, while in North Europe, chainsaw and skidder (CSK) is the most suitable harvesting system only on <3% of the forest area and growing stock, it is quite important for Estonia where it is the most suitable harvesting system on almost 30% of the forest area. In the Netherlands, the CSK has a high share with around 50% for both forest area and growing stock because of the groundwater-affected soil conditions, which limit the use of mechanized harvesting systems.
While the chainsaw and tower yarder (CTY) and chainsaw and tower yarder, with integrated or excavator-based processor (CTYP) cable yarding systems, are only important on around 5% of the European forest area and 6% of the growing stock, they are highly relevant systems in countries such as Switzerland, with 35% CTYP. Similarly, the winch-assisted harvester and winch-assisted forwarder (WHWF) are important for Austria, Slovakia, Italy or Albania, where around 30% of the forest area and growing stock are harvested with this system.
Finland, Norway, Sweden, and the Czech Republic revealed the highest potential for mechanization, since the fully mechanized harvesting systems area is suitable for 95% of the forest area and growing stock. The lowest mechanization options are evident for Lichtenstein, where only 12.7% of the forest area and 18.7% of the growing stock are suitable for fully mechanized harvesting, followed by the Netherlands with 47.9% and 49%, respectively.
4. Discussion
The 34 European countries in our study exhibit an estimated growing stock in ’forest available for wood supply’ (FAWS) of 25 billion m3 (Table 5). This number is similar to the State of Europe’s Forest (SOEF) report [1], which estimate a growing stock of 26.9 billion m3, covering the same countries. The 7% difference in growing stock is mainly due to the fact that in our study, the identified area of FAWS is 12 million ha lower versus the SOEF report (137 million ha vs. 149 million ha), while the total forest area with 183 million ha is similar in both studies [1].
The difference in FAWS was expected, since the calculation methods differ. The SOEF report provides the sum of individual country reports, which may differ (i) by country-specific differences in collecting national forest inventory data, ranging from point sampling information to surveying or combinations of remote sensing and terrestrial data, (ii) by different threshold definitions (e.g., maximum extraction distance, slope classes, forest area definitions), as well as (iii) different country-specific environmental, economic, and social factors [5,9].
When estimating the protected areas belonging to “forest not available for wood supply” (FNAWS), we followed the suggestion by Alberdi et al. [9] and considered the Ministerial Conference on the Protection of Forests in the Europe (MCPFE) categories “No Active Intervention” and “Minimum Intervention”. Other areas that are not available for wood supply due to national regulations are not considered in our analysis.
Our results show a high mechanization potential for harvesting in large parts of Europe (Table 4 and Table 5), while [61] provide an estimate of the current mechanization level for selected countries. For most of North Europe (Estonia, Finland, Latvia) and parts of Central-West (Germany, Ireland, UK) and South-West (Italy) Europe, the current and potential mechanized harvesting level are similar (see [61]), while for other countries within these regions (Lithuania, Austria, France, Spain), the gap between potential and observed mechanization is higher. In Central-East (Czech Republic, Poland, Romania, Slovakia) and South-East (Bulgaria) Europe, the current level of mechanization is, in general, still relatively low [61,62]. This gap between potential and observed mechanization may be explained by forest ownership structure (e.g., share of publicly owned forest land), financial means of individual forest owners, economic condition of the country, the implemented silvicultural system, simply personal preference, or the availability of equipment and workforce [18,61,62]. These factors influence the selection of a harvesting system and the willingness to harvest.
The suitability of a harvesting system strongly depends on the regional road density, the slope, the soil water conditions, and the dominant tree species at the harvesting site (Table 3). We use road density as a proxy for the extraction distance and rather conservative values for the extraction distances by the harvesting system to address that within a 500 m cell, the forest distribution and any obstacles (e.g., waterbodies, creeks) are unknown.
Most of Europe’s landscape can be categorized as flat or hilly with a slope of <30° (see also [63]). Thus, harvester and forwarder (HFW), with its recent technological improvements, including the winch-assisted harvester and winch-assisted forwarder (WHWF), is the most important harvesting system. Extraction distance is not a limiting factor for WHWF if the road network is well-developed. However, the low average road density in South-East Europe (11 m/h) limits the use of WHWF and other harvesting systems on moderate to steep slopes, resulting in around 35% of the forest area having limited accessibility. In addition, in North Europe, ground-based machinery on flat terrain is limited by the low average road density (9 m/ha).
In our analysis we use Open Street Map (OSM) data. These data result from a community project and may underestimate the forest road density in remote areas. Therefore, a low average road density can reflect the actual infrastructure as well as an inactivity of the mapping community. In addition, temporary winter roads are not considered in our analysis.
According to the European Soil Data Base (ESDB) [39], limits in trafficability due to groundwater are mainly found in the Baltic region, the British Isles, and the Netherlands. In these areas, large-scale sensitive soil features such as wetlands exist. Small-scale soil features which might also limit the use of harvester and forwarder on a local level were not considered in our analysis due to the data limitations of the ESDB [39].
Our study suggests that tree dimension limits, only in exceptional cases, the use of harvester and forwarder (HFW), winch-assisted harvester and winch-assisted forwarder (WHWF), and chainsaw and tower yarder with integrated or excavator-based processor (CTYP). One of the reasons for this result may be the fact that we obtained the average diameter at breast height (DBH) from the forest characteristics data with a given 8 km × 8 km resolution [28]. This levels the actual DBH distribution, which may lead to a tendency of to overestimate the growing stock available for processing by a harvester or processor. We address this effect by choosing conservative maximum DBH values which can be processed: (i) For conifers, a DBH = 40 cm in case of harvester and a DBH = 50 cm in case of processor, and (ii) for selected broad-leaved species, a DBH = 30 cm for both harvester and processor. Note that, in general, harvester heads can also process thicker trees but maximum productivity is reached at a certain diameter after which it decreases again [58,60,64].
The applicability of harvesting systems mostly depends on slope and accessibility (soil, road) of the terrain. As these data were available at a higher resolution, the selection of the mechanized harvesting system was perfomed using a 500 m × 500 m grid.
The estimated forest area of and growing stock in ‘forest available for wood supply’ (FAWS) is accessible and feasible for economically profitable harvesting with current mechanized harvesting techniques. Forest ownership, which often affects the willingness to harvest, and prioritization of other ecosystem services, such as protection of soil or infrastructure, may further reduce the availability of potentially harvestable timber.
In this study, we assess the current harvesting situation in Europe’s forests without considering potential climate change effects such as changes in tree species composition or the harvesting season, especially on sensitive soils [22]. Any increase of protected forest areas will decrease the ‘forest available for wood supply’. However, technical innovations or an extension of the road network system may increase ‘forests available for wood supply’. With the methodology presented in this study, any of these changes and how they affect the mechanized harvesting potential can be addressed easily, given that suitable data are available.
5. Conclusions
The forest of the 34 European countries of our study covers 183 million ha, where 4.3%, or 7.8 million ha, are protected by legal regulations, and 20.8%, or 38 million ha, have a limited accessibility. This results in an area of 137 million ha, or 74.9%, of ’forest available for wood supply’ (FAWS). According to our results, a low road density is the most limiting factor for mechanized harvesting. Especially in North and South-East Europe, the share of FAWS could be improved by establishing additional forest roads. It is also important to note that the areas with limited accessibility can still be feasible for a profitable forest management. However, further data and/or increased care and planning might be needed when harvesting these areas. Harvester and forwarder (HFW) is by far the most important harvesting system since it is suitable for 2/3 of the area of ‘forest available for wood supply’ (FAWS) in Europe. Together with winch-assisted harvester and winch-assisted forwarder (WHWF), about 80% of the area and growing stock of FAWS in Europe can be harvested by fully mechanized harvesting systems.
Our analysis suggests a high potential for mechanized harvesting in Europe. We think that in the context of ensuring wood supply, this is a promising result, but also want to stress that, even though a harvesting system may be considered applicable to a certain forest site, thorough planning and execution of forest operations are key to limit undesired environmental impacts such as soil compaction, soil erosion, or stand damage [65,66] to avoid a negative impact on forest growth [52].
Author Contributions
Conceptualization, C.P., G.E. and H.H.; methodology, C.P., G.E. and H.H.; software, C.P.; validation, C.P.; formal analysis, C.P.; investigation, C.P.; resources, C.P.; data curation, C.P.; writing—original draft preparation, C.P., G.E. and H.H.; writing—review and editing, G.E. and H.H.; visualization, C.P.; supervision, H.H.; project administration, H.H.; funding acquisition, H.H. All authors have read and agreed to the published version of the manuscript.
Funding
This work was supported by the Bio-Based Industries Joint Undertaking under the European Union’s Horizon 2020 research and innovation program, TECH4EFFECT—Techniques and Technologies or Effective Wood Procurement project [Grant Number 720757]. The European Commission support for the production of this publication does not constitute an endorsement of the contents, which reflects the views only of the authors, and the Commission cannot be held responsible for any use which may be made of the information contained therein.
Institutional Review Board Statement
Not applicable.
Informed Consent Statement
Not applicable.
Data Availability Statement
The data produced in this study are available on request from the corresponding author. Third party data used in this study are publicly available from different sources (see references).
Acknowledgments
We acknowledge the open data policies by European forest inventory agencies, which enabled the creation of the Improved Forest Structures across Europe dataset used in this analysis, and thank Benno Eberhard, Martin Kühmaier, and Mathias Neumann for their input.
Conflicts of Interest
The authors declare no conflict of interest.
Appendix A
Table A1.
Diameter at breast height (DBH) limitations for different tree species and harvesting systems. Tree species ID and name according to the tree species maps for European forests [42]. Poplar (Populus spp.) is considered unsuitable for mechanized felling and processing. Harvester refers to harvesting systems using harvester, winch-assisted harvester or steep terrain harvester. Processor refers to the chainsaw and tower yarder with integrated or excavator-based processor harvesting system.
| DBH Limit (cm) | |||
|---|---|---|---|
| ID | Name | Harvester | Processor |
| 1 | Abies spp. | 40 | 50 |
| 2 | Alnus spp. | 40 | 50 |
| 3 | Betula spp. | 40 | 50 |
| 4 | Carpinus spp. | 30 | 30 |
| 5 | Castanea spp. | 30 | 30 |
| 6 | Eucalyptus spp. | 40 | 50 |
| 7 | Fagus spp. | 30 | 30 |
| 8 | Fraxinus spp. | 30 | 30 |
| 9 | Larix spp. | 40 | 50 |
| 10 | Broadleaved misc | 30 | 30 |
| 11 | Conifers misc | 40 | 50 |
| 12 | Pinus misc | 40 | 50 |
| 13 | Quercus misc | 30 | 30 |
| 14 | Picea spp. | 40 | 50 |
| 15 | Pinus pinaster Aiton | 40 | 50 |
| 16 | Pinus sylvestris L. | 40 | 50 |
| 17 | Populus spp. | - | - |
| 18 | Pseudotsuga menziesii (Mirb.) Franco | 40 | 50 |
| 19 | Quercus robur L. and Quercus petraea (Matt.) Liebl. | 30 | 30 |
| 20 | Robinia spp. | 30 | 30 |
References
- FOREST EUROPE. State of Europe’s Forests 2020. Available online: https://foresteurope.org/wp-content/uploads/2016/08/SoEF_2020.pdf (accessed on 15 January 2023).
- European Commission. Directorate-General for Research and Innovation A Sustainable Bioeconomy for Europe: Strengthening the Connection between Economy, Society and the Environment: Updated Bioeconomy Strategy; Publications Office: Luxembourg, 2018. [Google Scholar]
- Eyvindson, K.; Repo, A.; Mönkkönen, M. Mitigating Forest Biodiversity and Ecosystem Service Losses in the Era of Bio-Based Economy. For. Policy Econ. 2018, 92, 119–127. [Google Scholar] [CrossRef]
- European Commission. New EU Forest Strategy for 2030. Available online: https://environment.ec.europa.eu/strategy/forest-strategy_en (accessed on 4 November 2022).
- Alberdi, I.; Michalak, R.; Fischer, C.; Gasparini, P.; Brändli, U.-B.; Tomter, S.M.; Kuliesis, A.; Snorrason, A.; Redmond, J.; Hernández, L.; et al. Towards Harmonized Assessment of European Forest Availability for Wood Supply in Europe. For. Policy Econ. 2016, 70, 20–29. [Google Scholar] [CrossRef]
- European Commission. Biodiversity Strategy for 2030. Available online: https://environment.ec.europa.eu/strategy/biodiversity-strategy-2030_en (accessed on 4 November 2022).
- Verkerk, P.J.; Anttila, P.; Eggers, J.; Lindner, M.; Asikainen, A. The Realisable Potential Supply of Woody Biomass from Forests in the European Union. For. Ecol. Manag. 2011, 261, 2007–2015. [Google Scholar] [CrossRef]
- Verkerk, P.J.; Fitzgerald, J.B.; Datta, P.; Dees, M.; Hengeveld, G.M.; Lindner, M.; Zudin, S. Spatial Distribution of the Potential Forest Biomass Availability in Europe. For. Ecosyst. 2019, 6, 5. [Google Scholar] [CrossRef]
- Alberdi, I.; Bender, S.; Riedel, T.; Avitable, V.; Boriaud, O.; Bosela, M.; Camia, A.; Cañellas, I.; Castro Rego, F.; Fischer, C.; et al. Assessing Forest Availability for Wood Supply in Europe. For. Policy Econ. 2020, 111, 102032. [Google Scholar] [CrossRef]
- Nabuurs, G.-J.; Arets, E.J.M.M.; Schelhaas, M.-J. Understanding the Implications of the EU-LULUCF Regulation for the Wood Supply from EU Forests to the EU. Carbon Balance Manag. 2018, 13, 18. [Google Scholar] [CrossRef]
- Payn, T. Future Environmental Challenges and New Zealand’s Planted Forests. N. Z. J. For. 2018, 63, 14–20. [Google Scholar]
- Silversides, C.R. Broadaxe to Flying Shear: The Mechanization of Forest Harvesting East of the Rockies; Transformation Series No. 6; National Museum of Science and Technology: Ottawa, ON, Canada, 1997; ISBN 0660159805. [Google Scholar]
- Samset, I. Winch and Cable Systems; Martinus Nijhoff/Dr. W. Junk Publishers: Dordrecht, The Netherlands, 1985; ISBN 978-94-017-3684-8. [Google Scholar]
- Holzfeind, T.; Visser, R.; Chung, W.; Holzleitner, F.; Erber, G. Development and Benefits of Winch-Assist Harvesting. Curr. For. Reports 2020, 6, 201–209. [Google Scholar] [CrossRef]
- Visser, R.; Harrill, H. Cable Yarding in North America and New Zealand: A Review of Developments and Practices. Croat. J. For. Eng. 2017, 38, 209–217. [Google Scholar]
- Nordfjell, T.; Bacher, M.; Eriksson, L.; Kadlec, J.; Stampfer, K.; Suadicani, K.; Suwala, M.; Talbot, B. Operational Factors Influencing the Efficiency in Conversion. In Norway Spruce Conversion—Options and Consequences, European Forest Institute Research Report, 18; Spiecker, H., Hansen, J., Klimo, E., Skovsgaard, J.P., Sterba, H., Eds.; Brill: Leiden, The Netherlands; Boston, MA, USA, 2004; pp. 197–223. [Google Scholar]
- Mason, W.L.; Diaci, J.; Carvalho, J.; Valkonen, S. Continuous Cover Forestry in Europe: Usage and the Knowledge Gaps and Challenges to Wider Adoption. Forestry 2022, 95, 1–12. [Google Scholar] [CrossRef]
- Purser, P.; Ó’tuama, P.; Vítková, L.; Dhubháin, Á.N. Factors Affecting the Economic Assessment of Continuous Cover Forestry Compared with Rotation Based Management. Irish For. 2015, 72, 150–165. [Google Scholar]
- Bont, L.G.; Fraefel, M.; Frutig, F.; Holm, S.; Ginzler, C.; Fischer, C. Improving Forest Management by Implementing Best Suitable Timber Harvesting Methods. J. Environ. Manag. 2022, 302, 114099. [Google Scholar] [CrossRef] [PubMed]
- Kühmaier, M.; Stampfer, K. Development of a Multi-Attribute Spatial Decision Support System in Selecting Timber Harvesting Systems. Croat. J. For. Eng. 2010, 31, 75–88. [Google Scholar]
- Becker, R.M.; Keefe, R.F.; Anderson, N.M.; Eitel, J.U.H. Use of Lidar-Derived Landscape Parameters to Characterize Alternative Harvest System Options in the Inland Northwest. Int. J. For. Eng. 2018, 29, 179–191. [Google Scholar] [CrossRef]
- Berendt, F.; Fortin, M.; Jaeger, D.; Schweier, J. How Climate Change Will Affect Forest Composition and Forest Operations in Baden-Württemberg—A GIS-Based Case Study Approach. Forests 2017, 8, 298. [Google Scholar] [CrossRef]
- Marčeta, D.; Petković, V.; Ljubojević, D.; Potočnik, I. Harvesting System Suitability as Decision Support in Selection Cutting Forest Management in Northwest Bosnia and Herzegovina. Croat. J. For. Eng. 2020, 41, 251–265. [Google Scholar] [CrossRef]
- Piragnolo, M.; Grigolato, S.; Pirotti, F. Planning Harvesting Operations in Forest Environment: Remote Sensing for Decision Support. ISPRS Ann. Photogramm. Remote Sens. Spat. Inf. Sci. 2019, 4, 33–40. [Google Scholar] [CrossRef]
- Gülci, N.; Akay, A.E.; Erdaş, O.; Gülci, S. Üretim Işlerinin Planlanmasında RTK-GPS Tabanlı Sayısal Yükseklik Modelinin Kullanılması. İstanbul Üniv. Orman Fakültesi Derg. 2015, 65, 60. [Google Scholar] [CrossRef]
- Di Fulvio, F.; Forsell, N.; Lindroos, O.; Korosuo, A.; Gusti, M. Spatially Explicit Assessment of Roundwood and Logging Residues Availability and Costs for the EU28. Scand. J. For. Res. 2016, 31, 691–707. [Google Scholar] [CrossRef]
- Kindermann, G.E.; Schörghuber, S.; Linkosalo, T.; Sanchez, A.; Rammer, W.; Seidl, R.; Lexer, M.J. Potential Stocks and Increments of Woody Biomass in the European Union under Different Management and Climate Scenarios. Carbon Balance Manag. 2013, 8, 2. [Google Scholar] [CrossRef]
- Pucher, C.; Neumann, M.; Hasenauer, H. An Improved Forest Structure Data Set for Europe. Remote Sens. 2022, 14, 395. [Google Scholar] [CrossRef]
- E.S.R.I. ArcGIS Desktop: Release 10 2011; Environmental Systems Research Institute: Redlands, CA, USA, 2011. [Google Scholar]
- R Core Team. R: A Language and Environment for Statistical Computing. R Foundation for Statistical Computing: Vienna, Austria. Available online: https://www.r-project.org/ (accessed on 15 January 2023).
- EEA European Union. Copernicus Land Monitoring Service—High Resolution Layer: Forest Type (FTY). 2018. Available online: https://land.copernicus.eu/pan-european/high-resolution-layers/forests/forest-type-1/status-maps/forest-type-2018 (accessed on 7 November 2022).
- EEA. Nationally Designated Areas (CDDA) V19. Available online: https://www.eea.europa.eu/data-and-maps/data/nationally-designated-areas-national-cdda-16 (accessed on 18 November 2022).
- Frank, G.; Latham, J.; Declan, L.; Parviainen, J.; Schuck, A.; Vandekerkhove, K.; Little, D.; Parviainen, J.; Schuck, A.; Vandekerkhove, K. Analysis of Protected Forest Areas in Europe—Provisional Results of COST Action E27 PROFOR. In Proceedings of the Natural Forests in the Temperate Zone of Euroope—Values and Utilisation, Mukachevo, Ukraine, 13–17 October 2003; Commarmot, B., Hamor, F.D., Eds.; pp. 377–386. [Google Scholar]
- EEA. European Union, Copernicus Land Monitoring Service—EU-DEM. Available online: https://www.eea.europa.eu/data-and-maps/data/copernicus-land-monitoring-service-eu-dem (accessed on 18 November 2022).
- Hijmans, R.J. Raster: Geographic Data Analysis and Modeling. R Package Version 3.4-13. Available online: https://cran.r-project.org/package=raster (accessed on 15 January 2023).
- Allman, M.; Jankovský, M.; Messingerová, V.; Allmanová, Z. Soil Moisture Content as a Predictor of Soil Disturbance Caused by Wheeled Forest Harvesting Machines on Soils of the Western Carpathians. J. For. Res. 2017, 28, 283–289. [Google Scholar] [CrossRef]
- Cambi, M.; Certini, G.; Neri, F.; Marchi, E. The Impact of Heavy Traffic on Forest Soils: A Review. For. Ecol. Manag. 2015, 338, 124–138. [Google Scholar] [CrossRef]
- Goltsev, V.; Lopatin, E. The Impact of Climate Change on the Technical Accessibility of Forests in the Tikhvin District of the Leningrad Region of Russia. Int. J. For. Eng. 2013, 24, 148–160. [Google Scholar] [CrossRef]
- Panagos, P. The European Soil Database. GEO Connex. 2006, 5, 32–33. [Google Scholar]
- Panagos, P.; Van Liedekerke, M.; Jones, A.; Montanarella, L. European Soil Data Centre: Response to European Policy Support and Public Data Requirements. Land Use Policy 2012, 29, 329–338. [Google Scholar] [CrossRef]
- IUSS Working Group WRB. World Reference Base for Soil Resources 2014, Update 2015. International Soil Classification System for Naming Soils and Creating Legends for Soil Maps; World Soil Resources Reports No. 106; Food and Agriculture Organization of the United Nations: Rome, Italy, 2015. [Google Scholar]
- Brus, D.J.; Hengeveld, G.M.; Walvoort, D.J.J.; Goedhart, P.W.; Heidema, A.H.; Nabuurs, G.J.; Gunia, K. Statistical Mapping of Tree Species over Europe. Eur. J. For. Res. 2012, 131, 145–157. [Google Scholar] [CrossRef]
- Moreno, A.; Neumann, M.; Hasenauer, H. Optimal Resolution for Linking Remotely Sensed and Forest Inventory Data in Europe. Remote Sens. Environ. 2016, 183, 109–119. [Google Scholar] [CrossRef]
- EEA Biogeographical Regions. Available online: https://www.eea.europa.eu/data-and-maps/data/biogeographical-regions-europe-3 (accessed on 7 November 2022).
- Friedl, M.; Sulla-Menashe, D. MCD12Q1 MODIS/Terra+Aqua Land Cover Type Yearly L3 Global 500m SIN Grid V006. Available online: https://lpdaac.usgs.gov/products/mcd12q1v006/ (accessed on 7 November 2022).
- Neumann, M.; Moreno, A.; Thurnher, C.; Mues, V.; Härkönen, S.; Mura, M.; Bouriaud, O.; Lang, M.; Cardellini, G.; Thivolle-Cazat, A.; et al. Creating a Regional MODIS Satellite-Driven Net Primary Production Dataset for European Forests. Remote Sens. 2016, 8, 554. [Google Scholar] [CrossRef]
- Simard, M.; Pinto, N.; Fisher, J.B.; Baccini, A. Mapping Forest Canopy Height Globally with Spaceborne Lidar. J. Geophys. Res. 2011, 116, G04021. [Google Scholar] [CrossRef]
- Moreno, A.; Neumann, M.; Hasenauer, H. Forest Structures across Europe. Geosci. Data J. 2017, 4, 17–28. [Google Scholar] [CrossRef]
- Heinimann, H.R. Forest Operations under Mountainous Conditions. In Forests in Sustainable Mountain Development: A State of Knowledge Report for 2000. Task Force on Forests in Sustainable Mountain Development; CABI Publishing: Wallingford, UK, 2000; pp. 224–234. [Google Scholar]
- Visser, R.; Stampfer, K. Expanding Ground-Based Harvesting onto Steep Terrain: A Review. Croat. J. For. Eng. 2015, 36, 321–331. [Google Scholar]
- Enache, A.; Kühmaier, M.; Visser, R.; Stampfer, K. Forestry Operations in the European Mountains: A Study of Current Practices and Efficiency Gaps. Scand. J. For. Res. 2016, 31, 412–427. [Google Scholar] [CrossRef]
- Gebauer, R.; Neruda, J.; Ulrich, R.; Martinkov, M. Soil Compaction—Impact of Harvesters’ and Forwarders’ Passages on Plant Growth. In Sustainable Forest Management—Current Research; InTech: London, UK, 2012. [Google Scholar]
- Erber, G.; Spinelli, R. Timber Extraction by Cable Yarding on Flat and Wet Terrain: A Survey of Cable Yarder Manufacturer’s Experience. Silva Fenn. 2020, 54, 2. [Google Scholar] [CrossRef]
- Spinelli, R.; Owende, P.; Ward, S.; Tornero, M. Comparison of Short-Wood Forwarding Systems Used in Iberia. Silva Fenn. 2004, 38, 437. [Google Scholar] [CrossRef]
- Wassermann, C.; Kühmaier, M.; Stampfer, K. Marktübersicht—Europäische Mastseilgeräte. Osterr. Forstztg. 2019, 1–8. [Google Scholar]
- Holzfeind, T.; Stampfer, K.; Holzleitner, F. Productivity, Setup Time and Costs of a Winch-Assisted Forwarder. J. For. Res. 2018, 23, 196–203. [Google Scholar] [CrossRef]
- Holzfeind, T.; Kanzian, C.; Stampfer, K.; Holzleitner, F. Assessing Cable Tensile Forces and Machine Tilt of Winch-Assisted Forwarders on Steep Terrain under Real Working Conditions. Croat. J. For. Eng. 2019, 40, 281–296. [Google Scholar] [CrossRef]
- Leszczyński, N.; Tomczak, A.; Kowalczuk, J.; Zarajczyk, J.; Węgrzyn, A.; Kocira, S.; Depo, K. The Relationship between the Mass of the Harvester Head and Its Maximum Cutting Diameter. J. Res. Appl. Agric. Eng. 2016, 61, 50–54. [Google Scholar]
- Labelle, E.; Breinig, L.; Sycheva, E. Exploring the Use of Harvesters in Large-Diameter Hardwood-Dominated Stands. Forests 2018, 9, 424. [Google Scholar] [CrossRef]
- Mederski, P.S.; Schweier, J.; Đuka, A.; Tsioras, P.; Bont, L.G.; Bembenek, M. Mechanised Harvesting of Broadleaved Tree Species in Europe. Curr. For. Rep. 2022, 8, 1–19. [Google Scholar] [CrossRef]
- Lundbäck, M.; Häggström, C.; Nordfjell, T. Worldwide Trends in Methods for Harvesting and Extracting Industrial Roundwood. Int. J. For. Eng. 2021, 32, 202–215. [Google Scholar] [CrossRef]
- Moskalik, T.; Borz, S.A.; Dvořák, J.; Ferencik, M.; Glushkov, S.; Muiste, P.; Lazdiņš, A.; Styranivsky, O. Timber Harvesting Methods in Eastern European Countries: A Review. Croat. J. For. Eng. 2017, 38, 231–241. [Google Scholar]
- Lundbäck, M.; Persson, H.; Häggström, C.; Nordfjell, T. Global Analysis of the Slope of Forest Land. Forestry 2021, 94, 54–69. [Google Scholar] [CrossRef]
- Ackerman, S.A.; Talbot, B.; Astrup, R. The Effect of Tree and Harvester Size on Productivity and Harvester Investment Decisions. Int. J. For. Eng. 2022, 33, 22–32. [Google Scholar] [CrossRef]
- Marchi, E.; Chung, W.; Visser, R.; Abbas, D.; Nordfjell, T.; Mederski, P.S.; McEwan, A.; Brink, M.; Laschi, A. Sustainable Forest Operations (SFO): A New Paradigm in a Changing World and Climate. Sci. Total Environ. 2018, 634, 1385–1397. [Google Scholar] [CrossRef]
- Schweier, J.; Magagnotti, N.; Labelle, E.R.; Athanassiadis, D. Sustainability Impact Assessment of Forest Operations: A Review. Curr. For. Rep. 2019, 5, 101–113. [Google Scholar] [CrossRef]


Disclaimer/Publisher’s Note: The statements, opinions and data contained in all publications are solely those of the individual author(s) and contributor(s) and not of MDPI and/or the editor(s). MDPI and/or the editor(s) disclaim responsibility for any injury to people or property resulting from any ideas, methods, instructions or products referred to in the content. |
© 2023 by the authors. Licensee MDPI, Basel, Switzerland. This article is an open access article distributed under the terms and conditions of the Creative Commons Attribution (CC BY) license (https://creativecommons.org/licenses/by/4.0/).