Abstract
To identify the determining microclimatic factors affecting epiphyte distributions, we comprehensively investigated the epiphyte community of montane cloud forests in Chilan. Four sites of adjacent old-growth forests were chosen based on the degree of prevailing wind exposure. At each site, a micrometeorological station was installed about 20 m in the forest canopy. Five emergent trees (with heights of 19~46 m and DBHs of 73~230 cm) were selected at each site for tree structure measurement and epiphyte inventory. In total, 2043 occurrences of 61 epiphytic species were recorded. Epiphytes were most abundant and diverse at the Lake site, followed by the Lee, Wind, and WindN sites. The epiphyte assemblages greatly differed across these sites, which was likely determined by the range variation in vapor pressure deficit (VPD). At least 14 site-exclusive species were identified across the four sites. This is the first study comparing epiphyte distributions of old-growth forests at a fine topographic scale. We found that small changes in microclimate, especially the range variance of VPD, dramatically affect epiphyte communities. Our results reinforce the understanding that epiphytes are a highly sensitive functional group of the forest ecosystem and serve as a good indicator of climate change.
1. Introduction
Epiphytic plants have long been considered indicator species for microclimatic variation in forest ecosystems for several reasons: 1. Canopy-dwelling plants have no vascular connection to the ground or their host plants and, therefore, are directly affected by atmospheric fluctuations; 2. most epiphytes produce highly mobile propagules and grow high in the forest canopy, which allows for long-distance dispersal; 3. compared with forest trees, epiphytes have relatively short life cycles and, therefore, colonize relatively rapidly in response to environmental changes [1,2,3]. Taiwan is a mountainous island located in the western Pacific on the transitional zone from tropical to subtropical latitudes (21°45′–25°56′ N and 119°18′ E–124°34′ E). Our previous study found that regional patterns of vascular epiphyte distribution in Taiwan mostly correlated with temperature and rainfall, and prevailing seasonal winds were the main driver of epiphyte diversity [4,5]. However, in mountainous areas, there were often distinct epiphyte physiognomies within a small area. In terms of the sensitivity of epiphytes to microclimate, local climatic variation induced by topography may affect epiphyte composition at a fine scale [6]. Therefore, regional rainfall or temperature alone probably cannot explain local epiphyte distribution. The determining climatic factors that alter epiphyte distribution remain unclear.
Forests modify local climates, moderate temperature and humidity fluctuations, and maintain a stable environment for forest organisms [7,8]. The forest canopy, along with associated epiphytes, improves both thermal and moisture buffer effects on microclimates of forest ecosystems [9,10]. Tropical montane cloud forests (TMCFs) are often characterized by an abundance of epiphytes growing in thick mats of bryophyte on tree branches. The complex canopy layer intercepts vertical rainfall and horizontal fogs, retains abundant water, and mediates climate change such as drought events [10,11,12]. In terms of the sensitivity of epiphytes to microclimatic change, temporal variation in bioclimates, including temperature seasonality or humidity fluctuation, may play an essential role in epiphyte composition.
In addition to climate-related factors, epiphyte distribution also responds to environmental factors even at the stand scale [13]. Epiphyte richness may differ with host-tree (phorophyte) characteristics, such as tree age, height, size (DBH, diameter at breast height), canopy structure (i.e., number of branches), or even tree species [14]. Large and old trees that have complex canopy structures and thick canopy mats of soil (i.e., organic matter) often harbor a great number of epiphytic species [15], probably because older host trees are in later successional stages, and their canopies provide relatively large spaces for epiphytic plants [16]. Moreover, phorophytes with high crown complexity (a high number of branches) promote habitat heterogeneity and, thus, increase arboreal plant diversity [11,17,18]. How phorophyte characteristics determine epiphyte distribution is not well understood.
Many studies have compared epiphyte communities of human-modified landscapes with less disturbed forest ecosystems [12,19,20]. However, little research has focused on the comparison of epiphyte communities in old-growth forests, especially at a fine scale. This is not only because it is hard to locate an entire old primary forest with adequate topographical variation, but also because it is difficult to monitor canopy microclimates and conduct epiphyte inventory in the canopy of giant trees in an old-growth forest. The sampling of epiphytes is intrinsically difficult since they creep into the forest canopy in three dimensions. Many epiphytes colonize host trees through asexual propagation, and it is difficult to clearly identify individuals and estimate species abundance. Epiphyte ecologists have, therefore, developed protocols, such as presence/absence, to systematically estimate the epiphyte richness and abundance of a forest [21]. In addition to a description of the vertical and horizontal distribution of epiphytes in the forest canopy, identifying the host-tree specificity of epiphytes is another complex question. A review study in 2015 provided a comprehensive comparison of sampling methods and statistical analyses to determine the host-tree specificity of epiphytes [14].
In Taiwan, the Chilan Major Wildlife Habitat is well known for its pristine primary cypress forests with abundant epiphyte communities. This montane cloud forest is significantly influenced by the northeast (NE) monsoon, which is one of the leading forces shaping vegetation and epiphyte flora in Taiwan [4,5,22]. Chilan is, therefore, a suitable place to explore how the effect of local climate and phorophyte characteristics together alter epiphyte assemblages. The aim of this study was to comprehensively investigate the epiphyte community of old-growth forests in Chilan. We hypothesized that epiphyte composition (diversity and abundance) would change with local climatic variations in Chilan. We assessed the divergence of epiphyte assemblages between adjacent forests with different topographic NE monsoon exposures. We then explored to what degree the local climate varied, and thus how microclimates affected local epiphyte assemblages. In addition, host-tree characteristics were measured across the studied forests to understand their influence on epiphyte distributions.
2. Materials and Methods
2.1. Study Area
Located in northern Taiwan, spanning the borders of three counties, Chilan ranges in altitude from 1650 to 2444 m in the Central Mountain Range and hosts the watershed of two major rivers (Figure 1). Chilan is a typical subtropical montane cloud forest ecosystem comprising pristine old-growth forest primarily composed of yellow cypress (Chamaecyparis obtusa var. formosana) and Formosan cypress (also known as red cypress, Chamaecyparis formosensis). With a total area of 55,991 ha, Chilan was declared a major wildlife habitat in 2000. The area includes Yuanyang Lake (YYL) Nature Reserve, a 374 ha long-term ecosystem research (LTER) site. Based on the LTER meteorological station recording from 2003 to 2007 taken at an elevation of 1650 m, the climate is generally warm, with a mean annual temperature of 13.9 °C and annual rainfall of ca. 4000 mm, which varies erratically with the torrential rains of typhoons in summer [23]. In addition to vertical precipitation, fog water deposition is significant in the forest ecosystem of Chilan. The cloud forest is immersed in daily afternoon fog, and the area has recorded over 300 foggy days per year. The winter NE monsoon brings intense fog and rain. Annual fog deposition from 2003 to 2004 accounted for 10% of the total atmospheric hydrological input [24]. The persistent high air humidity in Chilan facilitates abundant epiphyte communities that make up a conspicuous portion of the forest canopy.
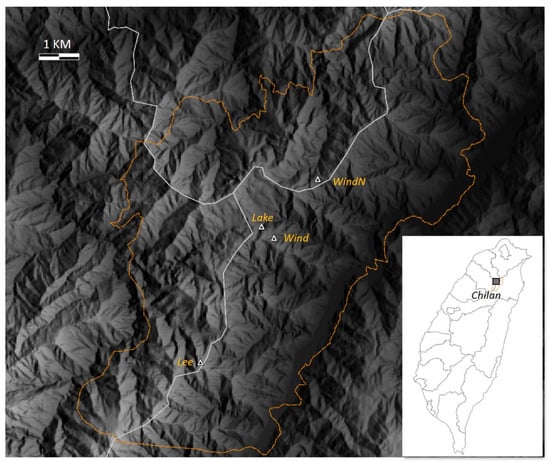
Figure 1.
Location and altitude of the four sites in Chilan: Lake (1692 m), Lee (1883 m), Wind (1703 m), and WindN (1680 m). The two most distant sites, WindN and Lee, are about 10 km from each other. Orange boundary lines indicate the Chilan Reserve area, which straddles three counties (white lines).
2.2. Data Collection
2.2.1. Canopy Microclimate Measurement
The study began in December 2017. Four sites of primary forests in adjacent areas of Chilan (Wind, WindN, Lee, and Lake; Figure 1) were selected based on their degree of NE monsoon exposure to study the effects of local climatic variation on vascular epiphyte distributions (Table 1). The two most distant sites, WindN and Lee, are about 10 km from each other, while the Lake site is only 850 m from the Wind site (Figure 1).

Table 1.
Description of the sites.
At each site, a micrometeorological station with loggers and sensors (Decagon devices, ICT International) was installed about 20 m above ground in the forest canopy. The stations measure and record wind velocity and direction, rainfall, air temperature, relative humidity (RH), and light intensity (using a HOBO Pendant UA-002-64) every 10 min. A backup temperature/RH data logger (HOBO U23-001A, Onset Computer Corp., Bourne, MA, USA) was also installed at each station.
2.2.2. Epiphyte Inventory and Host-Tree Allometry
At each site, five emergent trees (with heights of 19–46 m and DBHs of 73–230 cm) representing the top canopy layer of the local forest were chosen for epiphytic plant inventory (Figure 2). To assess the distribution of epiphytic plants on the host trees, we measured the trunk diameter every 2 m from the treetop to the base of each of the twenty sample trees. The height, girth, aspect, length, and inclination of all branches over 5 cm in diameter were recorded. Each branch was further divided into three equal segments: inner, middle, and outer, from the trunk outward. To avoid the problem of identifying individual creeping epiphytes, the occurrence (i.e., presence) of vascular epiphyte species in each segment was recorded separately. Moss cover (i.e., percentage of bryophyte and lichen coverage) was also estimated for each branch segment. Epiphyte inventory was conducted by the same two specialists to maintain consistency of species recognition and estimation of moss cover.

Figure 2.
The old-growth forests of the four sites in this study. Five emergent trees (with heights of 19~46 m and DBH 73~230 cm) were chosen at each site for epiphytic plant inventory and microclimate monitoring. Host trees at the Lake site had abundant bryophyte cover, and trees at the WindN and Lee sites were significantly taller and larger than trees at the other two sites.
2.3. Data Analysis
2.3.1. Climatic Factor Calculations
For vapor pressure deficit (VPD), we applied a simple accurate formula to calculate the saturation vapor pressure (Ps) [25].
VPD is given by
where RH (%) is relative humidity.
VPD = Ps × (1 − RH/100)
Ps for moist air is suggested to be multiplied by an enhancement factor (related to atmospheric pressure). However, since we were focused on the inter-site comparison, this correction was not applied.
To calculate evapotranspiration (ET) at each site, we adopted the Turc [26] method, suggested by Wang [27] for better fitting accuracy when using limited climatic factors to estimate ET in Taiwan, and it is expressed as follows:
where t is air temperature (in ℃), Rs is solar irradiance (MJ m−2 day−1).
We obtain Rs through a simple conversion [28]:
where illuminance was obtained from the lux meter of the micrometeorological station.
1 Sun (1000 Wm−2) = 122 klx (outdoor sunlight illuminance)
2.3.2. Epiphyte Diversity and Composition
Statistical analyses were processed with R version 4.1.0 [29]. The applied R packages and functions are described in each analysis. To explore the sampling of epiphytes in the study, we drew a species accumulation curve (SAC) using presence–absence data of holo-epiphytic species (i.e., species exclusive to the canopy) on all the branches of all twenty sample trees (using the function specaccum with the exact method from the vegan package). Epiphyte diversity indices were calculated for each site using the abundance data (i.e., occurrence numbers) of all the plant species (i.e., including accidental epiphytes) that were recorded in the study (using the functions estimateR and diversity from the vegan package). Principal coordinates analysis (PCoA) was performed on all twenty sample trees to determine whether the epiphyte assemblages inhabiting them were distinct from each other. The abundance data of holo-epiphytes on each host tree were Hellinger-transformed [30], and the Euclidean distance was calculated using the pco function from the ecodist package. Hierarchical clustering analysis was performed on the abundance data of holo-epiphytes (Hellinger-transformed) to explore the affinity of species composition at the four sites. The function pvclust with the ward.D2 method [31] from the pvclust package was used, and a p-value was derived from 1000 bootstrap resamplings. Finally, canonical correlation analysis (CCA) [32] was applied to the presence–absence data of holo-epiphytes on 698 branches as well as 6 environmental factors to explore species affinity and how those factors influence their distribution. The six factors were selected from principal component analysis suggesting better interpretation, including four quantitative variables (host-tree DBH, host-tree height, branch height, and log-transformed moss cover of branches), and two categorical variables (site and host-tree species). CCA was performed using the vegan package with the functions cca and permutest 999 times to test the significance for all constrained eigenvalues. The significance of the CCA model was checked with an ANOVA-like test with 999 permutations.
3. Results
3.1. Climatic Variations between Sites
Because we assumed that the winter NE monsoon is the major driver for local climatic variation, the result presented summer and winter months that emphasized the different monsoon effects across the sites. Ten days of mean canopy microclimates, including (a) wind speed, (b) air temperature, (c) relative humidity (RH), (d) vapor pressure deficit (VPD), (e) evapotranspiration (ET), and (f) rainfall at the four sites was graphed for the summer of 2019 and winter of 2019–2020 (shaded area) (Figure 3). The seasonal average of climatic factors and their standard deviation (S.D.) are shown in Appendix B. In general, the air temperature showed similar annual fluctuation patterns at the four sites. The Lake site recorded the lowest annual mean wind speed (Figure 3) and the most stable RH, as well as VPD, in both summer and winter (i.e., smaller S.D., B1 and B2 Figure A1). The canopy rainfall records reflected four typhoon events that occurred in early and late August, late September, and early December. A comparison of these records with those of the nearby Central Weather Bureau station revealed that the rain gauges at the Lake site canopy collected much more rainwater than those on the forest floor during typhoon events.

Figure 3.
Ten days mean canopy microclimate recorded at the four sites in 2019 summer and 2019–2020 winter (shaded area): (a) ET, evapotranspiration; (b) VPD, vapor pressure deficit; (c) rainfall; (d) wind speed; (e) RH, relative humidity; (f) air temperature.
It was not surprising that the Wind site recorded the highest wind speeds among the four sites in both summer and winter (ANOVA, p < 0.001). The peak wind speed for all sites in early August 2019 was caused by a typhoon approaching offshore Taiwan. The mean temperature was between 17 and 18.8 °C in summer and between 7 and 8.9 °C in winter at the four sites. The mean temperature at the Lake site was the lowest among the four sites, but the temperature variation between the sites was less significant than wind speed (ANOVA, p < 0.05). The relative humidity (RH) recorded in the canopies was high (>80%) among all the sites throughout the year. The VPD calculated in this study considered RH and the air temperature. In contrast to the Lake site, the Wind and WindN sites recorded fluctuating VPD, especially in summer. Evapotranspiration (ET) is related to light intensity and air temperature, and it did not vary dramatically across the different sites (ANOVA, p < 0.05); however, among all the sites, the Lake site recorded the lowest and least change in ET, followed by the Lee and Wind sites. ET was not calculated for the WindN site because we did not record light intensity at this site.
3.2. Characteristics of Phorophytes (Host Trees) at the Four Sites
The host trees selected randomly at the Lee site were all red cypress (Chamaecyparis formosensis), while the phorophytes at the Lake and WindN sites were all yellow cypress (Chamaecyparis obtusa var. formosana). The wind site had both of these species as well as Luanta fir (Cunninghamia konishii) (Table 1). The host trees at the Lee and WindN sites were larger (i.e., with large DBHs, ANOVA, p < 0.05), and the Lee site’s phorophytes were the tallest (37.1 m on average, ANOVA, p < 0.01) among all the sites (Table 2). The host trees at the Lake site had considerably more live and dead branches (ANOVA, p < 0.05) than the other sites.
Table 2.
Host-tree characteristics (averaged over five sample trees) at each of the four sites.
3.3. Epiphyte Diversity and Composition of the Four Sites
We recorded 63 epiphytic species in the forest canopy at the 4 sites, including 30 vascular epiphytes, 1 epiphytic liverwort Pleurozia acinosa, 31 accidental epiphytes, and 1 vine (Rhus ambigua) (Appendix A). Figure 4 shows the floristic composition of epiphytes at the four sites; Polypodiaceae was the largest family, followed by Orchidaceae and Ericaceae in the checklist. There were 2043 occurrences of epiphytes; the inventory showed that epiphytes were most abundant at the Lake site (1223 occurrences), followed by the Lee site (528), the Wind site (170), and the WindN site (122) (Table 3). The species accumulation curve (SAC) presented a graph of the sampled branches against epiphytic species, which showed a saturating trend (Figure 5). Table 4 presents the diversity index of epiphytes at the four sites. The Lake site hosted the most diverse epiphyte communities (S. chao, 73.7), followed by the Lee site (29), the Wind site (15.5), and the WindN site (11.3). Other diversity indexes showed a similar pattern, and species evenness did not vary dramatically.

Figure 4.
Recorded species and the floristic composition of epiphytes at the four sites. Epiphytic ferns and orchids were most abundant, followed by epiphytic Ericaceae.
Table 3.
Epiphyte abundance within crown locations at the four sites.

Figure 5.
The species accumulation curve (SAC) of epiphytic plants in this study, using presence–absence data of the 31 holo-epiphytic species on all branches of the twenty sample trees.
Table 4.
Epiphyte diversity and evenness indexes at the four sites. Indicator species are exclusive species of each site. Appendix A lists the number of species.
Principal coordinate analysis (PCoA) based on epiphyte assemblage on host trees revealed the distribution of twenty host trees at the four sites (Figure 6). The host trees at the Lee and Lake sites formed compact and distinct groups, while those at the Wind and WindN sites formed a common group. As shown in the graph, the most separated groups were the host trees at the Lee and WindN sites. The Lake site trees remained on the bottom of the second axis, and one host tree from the Wind site was located close to the Lake group. Hierarchical clustering analysis (Figure 7) showed that the Wind and WindN sites combined into one cluster (bootstrapped au p-value: 81). The cluster was then combined with the Lake site (p-value: 87). From the dendrogram, it can be inferred that the Lee site was the most distant site from the WindN site in terms of the PCoA results.

Figure 6.
PCoA plot of the twenty host trees at the four sites (○ Lake, ∆ Lee, + Wind, and × WindN). Epiphyte assemblage affinity was analyzed using the abundance data (Hellinger-transformed) of 31 holo-epiphyte species on each host tree.

Figure 7.
Hierarchical clustering analysis based on species composition at the four sites. The p-value (au) was given by 1000 bootstrap resampling.
The final CCA model suggested that the first and second axis of environmental variables together explained 60% (33.8% and 26.6%, respectively) of the variation in epiphyte community composition (Figure 8). The constraining variables in the final model were site, host-tree species, moss cover, host-tree height, DBH, and branch height (p < 0.001 with 999 permutation tests). There were 14 epiphytes that only occurred in one site (red color circles). The variables yellow cypress and moss cover distributed to the far-left side of the first CCA axis, with six epiphytic species that only occurred in the Lake site. The variables Lee site, red cypress, host-tree DBH, height, and branch height (BrH) were located on the right side of the first CCA axis, with seven epiphytic species that only occurred in the Lee site. The variable WindN site was on the upper part of the second CCA axis, and an epiphytic species that only occurred at the WindN site was also at the top of the triplot graph.

Figure 8.
Triplot graph of canonical correspondence analysis (CCA) showing the scores of epiphytic species (circles), category variables (squares: site, host-tree species), and quantitative variables (line arrows: moss-cover, host-tree height, DBH, and branch height (BrH)) from the study in the first two axes. Explanatory variables shown were found significant by 999 permutation tests (p < 0.001). Warm to cold colors of circles indicate the gradient of species that occurred once (specialists) to those that occurred at all study sites (generalists). See text for further explanation.
4. Discussion
4.1. Local Climatic Factors That Affect Epiphyte Abundance and Composition
Our results indicate that epiphyte communities greatly vary across the four sites (Table 3, Table 4 and Figure 7). The greatest diversity and abundance of epiphytes was found at the Lake site, which showed almost double the values of the Lee site and much higher than the two wind sites (Wind and WindN). The local climatic data recorded at the four sites were also distinct, especially the moisture-related variables. The variations in climatic factors among the four sites were higher in summer than in winter (Figure 3). Two studies indicated that VPD is critical for epiphyte distribution in neotropical forests, and epiphyte abundance is negatively correlated with the daily max VPD [15,33]. In our case, the stability rather than the average VPD coincided with the pattern of epiphyte distribution across the four sites (Figure 3b, B2 in Figure A1). The Lake site is only 850 m from the Wind site, and the two sites showed similar mean VPD, but the range variance of VPD at the Wind site in summer was much greater than that at the Lake site. The epiphyte community showed the least abundance and diversity at the WindN site, where host trees are very large; the dendrochronological data indicated one of the sample yellow cypress trees was 800 years old. The WindN site recorded the highest mean and range change for VPD in summer.
VPD is likely a better predictor for epiphyte distribution since it takes into account both the temperature and RH. Changes in VPD are important for the structure and function of forest ecosystems because photosynthetic rates decline when atmospheric VPD increases due to leaf stomata closure. Epiphytic plants are particularly sensitive to VPD changes since the arboreal habitat receives more frequent drought stress than the understory [34]. The stomata density of epiphytes was found to increase with low VPD rather than high rainfall in neotropics [35]. Epiphytes rely on foliar water uptake to maintain positive water balance, and even a small change in VPD can influence their sap flow [36,37]. Rising VPD greatly limits evapotranspiration (ET) by modulating the stomata behavior of forest plants, especially in montane cloud forests [23]. During drought events, epiphytes tend to close their stomata to favor water conservation over photosynthesis [37,38]. A recent study identified ET as an important driver of epiphyte mortality [39]. In this study, the local canopy ET showed a low value and the least change at the Lake site, which suggests that the low light availability and stable temperatures of this site may favor epiphyte colonization.
4.2. Bryophyte Cover as an Indicator for Epiphyte Distribution
The variable moss cover (including bryophytes and lichens) at the four sites dramatically varied in this study (Table 2, Figure 2). The abundance and diversity of epiphyte communities in this study were also ranked according to moss coverage, with the highest coverage observed at the Lake site, followed by the Lee, Wind, and WindN sites. Bryophyte cover was a strong predictor of epiphyte richness and rapidly declined when the mean annual temperature and solar radiation increased [13]. The Lake site recorded the lowest and least change in the monthly mean temperature across the four sites (Figure 3, B4 in Figure A1), and bryophytes were a particularly conspicuous feature of the forest canopy in this site (Figure 2). The evapotranspiration rate that took solar radiation into account also had the lowest value at the Lake site among all the sites. Moreover, the rate of absorption/evaporation of water by bryophytes is a function of wind speed [38]. The host trees at the Lake site generally have many branches, which is perhaps due to the less windy conditions at this site, thus allowing longer persistence of dead branches (>38%, Table 2).
The Lake site, located in a wind-sheltered basin, with relatively windless conditions and prolonged air humidity, presents a stable annual temperature range with relatively low temperatures that may benefit growth and slow the decomposition rates of bryophyte cover [40,41]. The presence of a thick bryophyte mat could reversely mediate the canopy microclimate and contribute to the structuring of the epiphyte community [13]. Our rain gauge records at the Lake site suggested that complex crown structures with abundant bryophyte mats may also foster rainfall interception, which would dramatically modify the microclimates of the forest canopy [10]. High bryophyte cover corresponding to prolonged air humidity may also favor numerous accidental epiphytes such as cypress seedlings in the Lake site canopy. More than half of the epiphytic species in the Lake site canopy were accidental epiphytes (Figure 4). The constantly high air humidity, along with abundant bryophyte mats, may contribute to the colonization of terrestrial species that are not as drought-tolerant as holo-epiphytes [42]. The CCA analysis results also suggest that moss cover is a significant explanatory variable for epiphyte distribution (Figure 8). Therefore, we conclude that bryophyte cover is one of the most important factors for epiphyte distribution in Chilan.
4.3. Phorophyte Characteristics and In-Crown Microclimates
Numerous studies suggest that epiphyte abundance increases with host trees’ size [11,17,43]. However, this relationship proved not so simple in this study. The host-tree size of the Lee and WindN sites was significantly larger among the four sites (Table 2). Red and yellow cypresses at these two sites (Lee and WindN, respectively) were estimated to be between 500 and 800 years old, while the host trees at the Lake site were approximately 300 to 400 years old (pers. commun.). The epiphyte communities of the Lee and WindN sites were dramatically different, in both abundance and composition, although the phorophytes of the two sites shared similar characteristics (Table 2). These two cypress species are difficult to distinguish from their appearance and commonly form mixed forests such as that at the Wind site in this study. Therefore, it is probably not the host specificity but the local climatic variations described above that differentiate epiphyte distribution at these two sites.
Although tree size/age did not linearly correlate with epiphyte distribution across our four sites, CCA analysis results (Figure 8) suggest that host trees’ DBH, height, and branch height are significant explanatory variables for epiphyte assemblages. The CCA results also indicate that the branch girth and azimuth of host trees were poorly correlated with epiphyte composition. However, epiphyte distribution indeed varied with different crown zones (Table 3), as many previous studies have reported [15,44]. Trees with higher crown complexity that enable niche differentiation also promote diversity in epiphyte communities [11,15]. Our approach designated crown zones based on the distance from the trunk, which was adapted to the structures of conifers rather than the Johansson zones suitable for broadleaf trees [45]. The inner crown of the phorophytes hosted many more epiphytes than the outer crown at every site. Tree crowns showed a clear buffering effect on the microclimatic extremes favoring epiphyte colonization [20]. Stable climatic conditions in the inner crown may benefit epiphyte survivorship. Tree crowns may also dampen the effect of the prevailing winds, and we did not find a correlation between azimuth and epiphyte distribution. We observed abundant suspended soils at the inner crown of the Lee and Lake sites, which are likely formed from the accumulated epiphyte remains and dust. Epiphyte survivorship is well known to tightly correlate with microorganisms in the forest canopy [46,47,48]. Preliminary analysis revealed that the microbiomes of canopy soils at these two sites were very distinct (unpublished data). Studies also indicated terrestrial soil fertility and chemistry alter mycorrhizal fungal and epiphyte communities [49,50]. The influence of soil microbiomes on the ecosystem certainly demands further study.
4.4. Site Variations in Epiphyte Composition and Indicator Species
The species accumulation curve (SAC) of the epiphytes rose asymptotically, suggesting an adequate sampling effort for this study (Figure 5). Since our sampled trees were between 300 and 800 years old, their tree crowns would host early- and late-colonizing species based on the replacement model of epiphyte succession [16]. Older phorophytes such as our sample trees are continuously colonized by epiphytic species through a long sequence of succession, while early successional species retain their niche in the young branches. Thus, the epiphyte communities of small phorophytes that are nested subsets of larger ones and local epiphyte flora were well represented in large trees [11].
The epiphyte assemblages of host trees were separately grouped by ordination analysis (PCoA, Figure 6) and hierarchical clustering analysis (Figure 7), suggesting a well-recognized variance of species composition across the four sites. Of the 31 holo-epiphytic species, we observed a few site-exclusive species (indicator species) from the CCA analysis (Figure 8). The indicator species included several late-successional species that were only observed in large trees, including Orchidaceae and Asparagaceae; they were Goodyera bilamellata and Heteropolygonatum altelobatum (Lee site); Bulbophyllum setaceum (WindN site); and Pleione bulbocodioides and Maianthemum formosanum (Lake site). Beginning in the autumn of 2008, we started monitoring the population of P. bulbocodioides at the Lake site and collected seed pods for asymbiotic germination to conserve this orchid. We observed that rising temperatures in summer corresponded to low seed productivity and quality of the species. Global climate change seems a growing crisis for this endangered orchid in addition to illegal poaching [51].
The Wind site was the only site that did not have exclusively epiphytic species. However, a rare non-vascular epiphyte Pleurozia acinosa was almost uniquely observed in the northward branches, especially at the two wind sites. Further research is needed to explore this carnivorous liverwort. Interestingly, we found an epiphytic orchid Dendrobium moniliforme at both WindN and Lee sites, where our analyses revealed the most distinct epiphyte assemblages between the two sites. The only similarity between these two sites was the size and age of the host trees. Aged trees act as propagule sources for many rare epiphytic and terrestrial species [17,42]. Although the WindN site had the lowest epiphyte diversity among the four sites, the indicator species may never colonize other sites, suggesting habitat heterogeneity is crucial for biodiversity conservation. We believe that the observed epiphyte distribution in Chilan reflects the long-term interaction of both microclimate-related physiology and the successional processes of epiphyte communities.
5. Conclusions
Chilan was designated a vulnerable forest ecosystem under the conditions of future climate change based on our previous research [52]. The results of this study reinforce the idea that epiphytes are highly sensitive to local climatic variation and serve as good indicators of environmental conditions. This is the first study to locate epiphytic community dissimilarity and possible microclimatic factors at a fine scale (within 100 km2) [53]. The local climatic variations induced by topography shape the epiphyte distributions in Chilan. Epiphyte communities greatly vary at the fine scale due to small changes in microclimates, especially due to the range variance of VPD. The influence of local climatic variations on epiphyte distributions even suppressed the effect of host-tree characteristics. Although many epiphytes are accustomed to drought stress and show a high recovery capacity [37], our findings show that epiphytes in tropical montane cloud forests will be particularly vulnerable during future climate change, which is expected to bring increasing weather extremes. More importantly, we identified specific indicator species for monitoring the parameters affecting future climate change in the pristine Chilan montane cloud forest ecosystem.
Author Contributions
Conceptualization, R.C.-C.H.; methodology, R.C.-C.H. and C.L.; formal analysis, R.C.-C.H.; investigation, R.C.-C.H., C.L. and C.C.; writing—review and editing, R.C.-C.H. All authors have read and agreed to the published version of the manuscript.
Funding
This research was sponsored by the National Science and Technology Council (MOST 106-2621-B-054-001).
Informed Consent Statement
Not applicable.
Data Availability Statement
The data that support the findings of this study are available in Appendix A and Appendix B or through personal correspondence.
Acknowledgments
We thank the team Sun-Moon for supporting tree rigging and climbers. We also express our appreciation to the Forest Conservation and Management Administration (FCEA) for their kind assistance in Chilan.
Conflicts of Interest
The authors declare no conflict of interest.
Appendix A. Checklist of Epiphytic Plants in This Study
Symbols: “#” endemic species, “*” accidental epiphytes, “+” vine.
(VU) vulnerable, (NT) near-threatened, and (EN) endangered species, based on IUCN definitions.
Numbers [1][2][3][4] indicate sites: Lake, Lee, Wind, and WindN where holo-epiphytes were recorded.
Bryophytes
Pleuroziaceae
- Pleurozia acinosa (Mitt.) Trevis. [1][3][4]
Ferns and Lycophytes
Aspleniaceae
- 2.
- Asplenium wilfordii Mett. ex Kuhn [2]
Davalliaceae
- 3.
- Araiostegia parvipinnula (Hayata) Copel. [1][2][4]
Dryopteridaceae
- 4.
- Ctenitis kawakamii (Hayata) Ching *
- 5.
- Elaphoglossum conforme (Sw.) Schott [1]
Hymenophyllaceae
- 6.
- Mecodium polyanthos (Sw.) Copel. [1][2][3][4]
Polypodiaceae
- 7.
- Arthromeris lehmannii (Mett.) Ching [1][2]
- 8.
- Crypsinus echinosporus (Tagawa) Tagawa [1][2][3][4]
- 9.
- Lepisorus monilisorus (Hayata) Tagawa [2]
- 10.
- Lepisorus obscurevenulosus (Hayata) Ching [1][2]
- 11.
- Polypodium amoenum Wall. ex Mett. [2]
- 12.
- Polypodium argutum Wall. ex Hook. [1][2]
- 13.
- Pyrrosia lingua (Thunb.) Farw. [1][2]
- 14.
- Xiphopteris okuboi (Yatabe) Copel. [1][3]
Pteridaceae
- 15.
- Vittaria anguste-elongata Hayata [2]
- 16.
- Vittaria flexuosa Fée [1][2][3]
Gymnosperms
Cupressaceae
- 17.
- Chamaecyparis obtusa var. formosana (Hayata) Hayata * # (NT)
Pinaceae
- 18.
- Tsuga chinensis var. formosana (Hayata) H.L. Li and H. Keng * # (LC)
Dicotyledons
Adoxaceae
- 19.
- Viburnum plicatum var. formosanum Y.C. Liu and C.H. Ou * # (NT)
- 20.
- Viburnum taitoense Hayata *
- 21.
- Viburnum urceolatum Siebold and Zucc. *
Anacardiaceae
- 22.
- Rhus ambigua Lav. ex Dippel +
Aquifoliaceae
- 23.
- Ilex hayatana Loes. * #
Araliaceae
- 24.
- Aralia bipinnata Blanco *
- 25.
- Dendropanax dentiger (Harms) Merr. *
- 26.
- Hedera rhombea var. formosana (Nakai) H.L. Li #[1]
- 27.
- Schefflera taiwaniana (Nakai) Kaneh. #[1]
Asteraceae
- 28.
- Ainsliaea latifolia subsp. henryi (Diels) H. Koyama *
Elaeocarpaceae
- 29.
- Elaeocarpus japonicus Siebold *
Ericaceae
- 30.
- Rhododendron kawakamii Hayata # (NT) [1][2][3]
- 31.
- Vaccinium dunalianum var. caudatifolium (Hayata) H.L. Li [1][2][3][4]
- 32.
- Vaccinium emarginatum Hayata #[1][2][3][4]
- 33.
- Vaccinium merrillianum Hayata * #
Gesneriaceae
- 34.
- Lysionotus pauciflorus Maxim. [2]
Hydrangeaceae
- 35.
- Hydrangea integrifolia Hayata [1][2][3]
Lauraceae
- 36.
- Litsea acuminata (Blume) Kurata *
- 37.
- Neolitsea aciculata var. variabillima J.C. Liao * #
- 38.
- Neolitsea acuminatissima (Hayata) Kaneh. and Sasaki * #
Oleaceae
- 39.
- Ligustrum sinense Lour. *
Pentaphylacaceae
- 40.
- Eurya glaberrima Hayata * #
- 41.
- Eurya loquaiana Dunn *
Primulaceae
- 42.
- Ardisia pusilla A. DC. *
Rosaceae
- 43.
- Prunus matuurae Sasaki * #
- 44.
- Rubus corchorifolius L. f. *
Rubiaceae
- 45.
- Damnacanthus angustifolius Hayata * #
- 46.
- Mitchella undulata Siebold and Zucc. (VU)[1]
Sapindaceae
- 47.
- Acer morrisonense Hayata *#
Schisandraceae
- 48.
- Illicium anisatum L. *
Symplocaceae
- 49.
- Symplocos arisanensis Hayata *
Theaceae
- 50.
- Schima superba Gardner and Champ. *
Monocotyledons
Araceae
- 51.
- Arisaema formosanum (Hayata) Hayata * #
Asparagaceae
- 52.
- Heteropolygonatum altelobatum # (VU) [2]
- 53.
- Maianthemum formosanum (Hayata) La Frankie [1]
- 54.
- Ophiopogon intermedius D. Don *
Orchidaceae
- 55.
- Bulbophyllum pectinatum Finet (NT) [3][4]
- 56.
- Bulbophyllum setaceum T.P. Lin # (NT) [4]
- 57.
- Calanthe puberula Lindl. *
- 58.
- Dendrobium moniliforme (L.) Sw. [2][4]
- 59.
- Epigeneium fargesii (Finet) Gagnep. [1][2][4]
- 60.
- Goodyera bilamellata Hayata [2]
- 61.
- Platanthera brevicalcarata Hayata * #
- 62.
- Pleione bulbocodioides (Franch.) Rolfe (VU) [1]
Poaceae
- 63.
- Yushania niitakayamensis (Hayata) Keng f. *
Appendix B

Figure A1.
Three month mean and standard deviation of canopy microclimate at four sites in 2019 summer and 2019–2020 winter. B1: RH, relative humidity, B2: VPD, vapor pressure deficit, B3: windspeed, B4: air temperature, B5: rainfall, B6: ET, evapotranspiration.
References
- Petter, G.; Wagner, K.; Wanek, W.; Sánchez Delgado, E.J.; Zotz, G.; Cabral, J.S.; Kreft, H. Functional leaf traits of vascular epiphytes: Vertical trends within the forest, intra-and interspecific trait variability, and taxonomic signals. Funct. Ecol. 2016, 30, 188–198. [Google Scholar] [CrossRef]
- Benzing, D.H. Vulnerabilities of tropical forests to climate change: The significance of resident epiphytes. Clim. Chang. 1998, 39, 519–540. [Google Scholar] [CrossRef]
- Zotz, G. Plants on Plants—The Biology of Vascular Epiphytes; Springer: Berlin, Germany, 2016; p. 282. [Google Scholar]
- Chiou, C.-R.; Song, G.-Z.M.; Chien, J.-H.; Hsieh, C.-F.; Wang, J.-C.; Chen, M.-Y.; Liu, H.-Y.; Yeh, C.-L.; Hsia, Y.-J.; Chen, T.-Y. Altitudinal distribution patterns of plant species in Taiwan are mainly determined by the northeast monsoon rather than the heat retention mechanism of Massenerhebung. Bot. Stud. 2010, 51, 89–97. [Google Scholar]
- Hsu, R.C.C.; Wolf, J.H.D.; Tamis, W.L.M. Regional and Elevational Patterns in Vascular Epiphyte Richness on an East Asian Island. Biotropica 2014, 46, 549–555. [Google Scholar] [CrossRef]
- Werner, F.; Homeier, J.; Oesker, M.; Boy, J. Epiphytic biomass of a tropical montane forest varies with topography. J. Trop. Ecol. 2012, 28, 23–31. [Google Scholar] [CrossRef]
- Nakamura, A.; Kitching, R.L.; Cao, M.; Creedy, T.J.; Fayle, T.M.; Freiberg, M.; Hewitt, C.; Itioka, T.; Koh, L.P.; Ma, K. Forests and their canopies: Achievements and horizons in canopy science. Trends Ecol. Evol. 2017, 32, 438–451. [Google Scholar] [CrossRef]
- De Frenne, P.; Lenoir, J.; Luoto, M.; Scheffers, B.R.; Zellweger, F.; Aalto, J.; Ashcroft, M.B.; Christiansen, D.M.; Decocq, G.; De Pauw, K. Forest microclimates and climate change: Importance, drivers and future research agenda. Glob. Chang. Biol. 2021, 27, 2279–2297. [Google Scholar] [CrossRef]
- Campbell, J.; Coxson, D.S. Canopy microclimate and arboreal lichen loading in subalpine spruce-fir forest. Can. J. Bot. 2001, 79, 537–555. [Google Scholar]
- Stanton, D.E.; Chávez, J.H.; Villegas, L.; Villasante, F.; Armesto, J.; Hedin, L.O.; Horn, H. Epiphytes improve host plant water use by microenvironment modification. Funct. Ecol. 2014, 28, 1274–1283. [Google Scholar] [CrossRef]
- Sillett, S.C.; Pelt, R.V. Trunk reiteration promotes epiphytes and water storage in an old-growth redwood forest canopy. Ecol. Monogr. 2007, 77, 335–359. [Google Scholar] [CrossRef]
- Wu, Y.; Song, L.; Liu, W.; Liu, W.; Li, S.; Fu, P.; Shen, Y.; Wu, J.; Wang, P.; Chen, Q. Fog water is important in maintaining the water budgets of vascular epiphytes in an Asian tropical karst forests during the dry season. Forests 2018, 9, 260. [Google Scholar] [CrossRef]
- Richards, J.H. Assessing the strength of climate and land-use influences on montane epiphyte communities. Conserv. Biol. 2021, 35, 1496–1506. [Google Scholar] [CrossRef]
- Wagner, K.; Mendieta-Leiva, G.; Zotz, G. Host specificity in vascular epiphytes: A review of methodology, empirical evidence and potential mechanisms. AoB Plants 2015, 7, plu092. [Google Scholar] [CrossRef]
- Woods, C.L.; Cardelús, C.L.; DeWalt, S.J. Microhabitat associations of vascular epiphytes in a wet tropical forest canopy. J. Ecol. 2015, 103, 421–430. [Google Scholar] [CrossRef]
- Woods, C.L. Primary ecological succession in vascular epiphytes: The species accumulation model. Biotropica 2017, 49, 452–460. [Google Scholar] [CrossRef]
- Richards, J.H.; Luna, I.M.T.; Waller, D.M. Tree longevity drives conservation value of shade coffee farms for vascular epiphytes. Agric. Ecosyst. Environ. 2020, 301, 107025. [Google Scholar] [CrossRef]
- Flores-Palacios, A.; García-Franco, J.G. The relationship between tree size and epiphyte species richness: Testing four different hypotheses. J. Biogeogr. 2006, 33, 323–330. [Google Scholar] [CrossRef]
- Oswaldo, J.; Hugo, C.; Wilmer, T.; Ismael, P.; Wilson, Q.; Omar, C. Successional forests stages influence the composition and diversity of vascular epiphytes communities from Andean Montane Forests. Ecol. Indic. 2022, 143, 109366. [Google Scholar] [CrossRef]
- Jucker, T.; Hardwick, S.R.; Both, S.; Elias, D.M.; Ewers, R.M.; Milodowski, D.T.; Swinfield, T.; Coomes, D.A. Canopy structure and topography jointly constrain the microclimate of human-modified tropical landscapes. Glob. Chang. Biol. 2018, 24, 5243–5258. [Google Scholar] [CrossRef]
- Wolf, J.H.; Gradstein, S.R.; Nadkarni, N.M. A protocol for sampling vascular epiphyte richness and abundance. J. Trop. Ecol. 2009, 25, 107–121. [Google Scholar] [CrossRef]
- Chiu, C.-A.; Lin, P.-H.; Tsai, C.-Y. Spatio-Temporal Variation and Monsoon Effect on the Temperature Lapse Rate of a Subtropical Island. Terr. Atmos. Ocean. Sci. 2014, 25, 203–217. [Google Scholar] [CrossRef] [PubMed]
- Chu, H.S.; Chang, S.C.; Klemm, O.; Lai, C.W.; Lin, Y.Z.; Wu, C.C.; Lin, J.Y.; Jiang, J.Y.; Chen, J.; Gottgens, J.F. Does canopy wetness matter? Evapotranspiration from a subtropical montane cloud forest in Taiwan. Hydrol. Process. 2014, 28, 1190–1214. [Google Scholar] [CrossRef]
- Chang, S.-C.; Yeh, C.-F.; Wu, M.-J.; Hsia, Y.-J.; Wu, J.-T. Quantifying fog water deposition by in situ exposure experiments in a mountainous coniferous forest in Taiwan. For. Ecol. Manag. 2006, 224, 11–18. [Google Scholar] [CrossRef]
- Huang, J. A simple accurate formula for calculating saturation vapor pressure of water and ice. J. Appl. Meteorol. Climatol. 2018, 57, 1265–1272. [Google Scholar] [CrossRef]
- Turc, L. Estimation of irrigation water requirements, potential evapotranspiration: A simple climatic formula evolved up to date. Ann. Agron. 1961, 12, 13–49. [Google Scholar]
- Wang, S.-M. Using Limited Weather to Estimate the Evaportranspiration; National Cheng Kung University: Tainan, Taiwan, 2014. [Google Scholar]
- Michael, P.R.; Johnston, D.E.; Moreno, W. A conversion guide: Solar irradiance and lux illuminance. J. Meas. Eng. 2020, 8, 153–166. [Google Scholar] [CrossRef]
- R Core Team. R: A Language and Environment for Statistical Computing; R Foundation for Statistical Computing: Vienna, Austria, 2019; Available online: https://www.R-project.org/ (accessed on 20 May 2022).
- Legendre, P.; Gallagher, E.D. Ecologically meaningful transformations for ordination of species data. Oecologia 2001, 129, 271–280. [Google Scholar] [CrossRef]
- Murtagh, F.; Legendre, P. Ward’s hierarchical agglomerative clustering method: Which algorithms implement Ward’s criterion? J. Classif. 2014, 31, 274–295. [Google Scholar] [CrossRef]
- Ter Braak, C.J. The analysis of vegetation-environment relationships by canonical correspondence analysis. Vegetatio 1987, 69, 69–77. [Google Scholar] [CrossRef]
- Gotsch, S.G.; Davidson, K.; Murray, J.G.; Duarte, V.J.; Draguljić, D. Vapor pressure deficit predicts epiphyte abundance across an elevational gradient in a tropical montane region. Am. J. Bot. 2017, 104, 1790–1801. [Google Scholar] [CrossRef]
- Campany, C.E.; Pittermann, J.; Baer, A.; Holmlund, H.; Schuettpelz, E.; Mehltreter, K.; Watkins, J.E., Jr. Leaf water relations in epiphytic ferns are driven by drought avoidance rather than tolerance mechanisms. Plant Cell Environ. 2021, 44, 1741–1755. [Google Scholar] [CrossRef] [PubMed]
- Cach-Pérez, M.J.; Andrade, J.L.; Cetzal-Ix, W.; Reyes-García, C. Environmental influence on the inter-and intraspecific variation in the density and morphology of stomata and trichomes of epiphytic bromeliads of the Yucatan Peninsula. Bot. J. Linn. Soc. 2016, 181, 441–458. [Google Scholar] [CrossRef]
- Darby, A.; Draguljić, D.; Glunk, A.; Gotsch, S.G. Habitat moisture is an important driver of patterns of sap flow and water balance in tropical montane cloud forest epiphytes. Oecologia 2016, 182, 357–371. [Google Scholar] [CrossRef] [PubMed]
- Williams, C.B.; Murray, J.G.; Glunk, A.; Dawson, T.E.; Nadkarni, N.M.; Gotsch, S.G. Vascular epiphytes show low physiological resistance and high recovery capacity to episodic, short-term drought in Monteverde, Costa Rica. Funct. Ecol. 2020, 34, 1537–1550. [Google Scholar] [CrossRef]
- Pypker, T.G.; Unsworth, M.H.; Van Stan, J.T.; Bond, B.J. The absorption and evaporation of water vapor by epiphytes in an old-growth Douglas-fir forest during the seasonal summer dry season: Implications for the canopy energy budget. Ecohydrology 2017, 10, e1801. [Google Scholar] [CrossRef]
- Zuleta, D.; Benavides, A.M.; López-Rios, V.; Duque, A. Local and regional determinants of vascular epiphyte mortality in the Andean mountains of Colombia. J. Ecol. 2016, 104, 841–849. [Google Scholar] [CrossRef]
- Davis, R. Environmental factors influencing decomposition rates in two Antarctic moss communities. Polar Biol. 1986, 5, 95–103. [Google Scholar] [CrossRef]
- Karger, D.N.; Kluge, J.; Abrahamczyk, S.; Salazar, L.; Homeier, J.; Lehnert, M.; Amoroso, V.B.; Kessler, M. Bryophyte cover on trees as proxy for air humidity in the tropics. Ecol. Indic. 2012, 20, 277–281. [Google Scholar] [CrossRef]
- Ishii, H.R.; Minamino, T.; Azuma, W.; Hotta, K.; Nakanishi, A. Large, retained trees of Cryptomeria japonica functioned as refugia for canopy woody plants after logging 350 years ago in Yakushima, Japan. For. Ecol. Manag. 2018, 409, 457–467. [Google Scholar] [CrossRef]
- Ceballos, S.J.; Chacoff, N.P.; Malizia, A. Interaction network of vascular epiphytes and trees in a subtropical forest. Acta Oecol. 2016, 77, 152–159. [Google Scholar] [CrossRef]
- Wang, X.; Long, W.; Schamp, B.S.; Yang, X.; Kang, Y.; Xie, Z.; Xiong, M. Vascular epiphyte diversity differs with host crown zone and diameter, but not orientation in a tropical cloud forest. PLoS ONE 2016, 11, e0158548. [Google Scholar] [CrossRef]
- Sanger, J.C.; Kirkpatrick, J.B. Fine partitioning of epiphyte habitat within Johansson zones in tropical Australian rain forest trees. Biotropica 2017, 49, 27–34. [Google Scholar] [CrossRef]
- Eskov, A.K.; Zverev, A.O.; Abakumov, E.V. Microbiomes in suspended soils of vascular epiphytes differ from terrestrial soil microbiomes and from each other. Microorganisms 2021, 9, 1033. [Google Scholar] [CrossRef]
- Petrolli, R.; Vieira, C.A.; Jakalski, M.; Bocayuva, M.F.; Vallé, C.; Cruz, E.D.S.; Selosse, M.A.; Martos, F.; Kasuya, M.C.M. A fine-scale spatial analysis of fungal communities on tropical tree bark unveils the epiphytic rhizosphere in orchids. N. Phytol. 2021, 231, 2002–2014. [Google Scholar] [CrossRef]
- Cevallos, S.; Herrera, P.; Vélez, J.; Suárez, J.P. Root-Associated Endophytic and Mycorrhizal Fungi from the Epiphytic Orchid Maxillaria acuminata in a Tropical Montane Forest in Southern Ecuador. Diversity 2022, 14, 478. [Google Scholar] [CrossRef]
- Benner, J.W.; Vitousek, P.M. Development of a diverse epiphyte community in response to phosphorus fertilization. Ecol. Lett. 2007, 10, 628–636. [Google Scholar] [CrossRef]
- Kaur, J.; Phillips, C.; Sharma, J. Host population size is linked to orchid mycorrhizal fungal communities in roots and soil, which are shaped by microenvironment. Mycorrhiza 2021, 31, 17–30. [Google Scholar] [CrossRef]
- Hsu, R.C.-C. Asymbiotic seed germination, seedling development and reintroduction of Pleione formosana Hayata., an endangered epiphytic orchid. In Proceedings of the 23rd World Orchid Conference, Taichung, Taiwan, 23–26 April 2021; pp. 431–433. [Google Scholar]
- Hsu, R.C.C.; Tamis, W.L.M.; Raes, N.; de Snoo, G.R.; Wolf, J.H.D.; Oostermeijer, G.; Lin, S.-H. Simulating climate change impacts on forests and associated vascular epiphytes in a subtropical island of East Asia. Divers. Distrib. 2012, 18, 334–347. [Google Scholar] [CrossRef]
- Marí, M.L.; Toledo, J.J.; Nascimento, H.E.; Zartman, C.E. Regional and Fine Scale Variation of Holoepiphyte Community Structure in Central Amazonian White-Sand Forests. Biotropica 2016, 48, 70–80. [Google Scholar] [CrossRef]
Disclaimer/Publisher’s Note: The statements, opinions and data contained in all publications are solely those of the individual author(s) and contributor(s) and not of MDPI and/or the editor(s). MDPI and/or the editor(s) disclaim responsibility for any injury to people or property resulting from any ideas, methods, instructions or products referred to in the content. |
© 2023 by the authors. Licensee MDPI, Basel, Switzerland. This article is an open access article distributed under the terms and conditions of the Creative Commons Attribution (CC BY) license (https://creativecommons.org/licenses/by/4.0/).