Article

Linkage between Leaf–Litter–Soil, Microbial Resource Limitation, and Carbon-Use Efficiency in Successive Chinese Fir (Cunninghamia lanceolata) Plantations

1
Guangxi Key Laboratory of Forest Ecology and Conservation, College of Forestry, Guangxi University, Nanning 530004, China
2
Key Laboratory of National Forestry and Grassland Administration on Cultivation of Fast-Growing Timber in Central South China, College of Forestry, Guangxi University, Nanning 530004, China
3
Guangxi Colleges and Universities Key Laboratory for Forestry Science and Engineering, College of Forestry, Guangxi University, Nanning 530004, China
*
Author to whom correspondence should be addressed.
Forests 2023, 14(2), 357; https://doi.org/10.3390/f14020357
Submission received: 27 November 2022 / Revised: 20 January 2023 / Accepted: 9 February 2023 / Published: 10 February 2023
(This article belongs to the Section Forest Soil)

Abstract

:
Chinese fir (Cunninghamia lanceolata) is a kind of evergreen coniferous tree species, the expansion of its pure forest area and multiple generations of continuous planting has led to a decline of stand quality and woodland fertility. To further investigate the relationship between leaf, litter, and soil stoichiometry, microbial community status, and microbial resource limitation of Chinese fir after continuous planting. We studied the C, N, and P stoichiometries of leaf, litter, and soil from successive rotations of Chinese fir plantations. In addition to this, soil microbial biomass C, N, and P, extracellular enzymes, as well as the soil microbial community composition, were determined. The continuous planting of Chinese fir significantly increased the leaf N and P contents and decreased the C content of litter, and the soil C:N and C:P ratios, thus leading to a soil stoichiometric imbalance. The continuous planting of Chinese fir plantations significantly increased the soil microbial biomass. Compared with the first-generation plantations, the N and P contents of the second- and third-generation plantations increased by 37.11%, 21.83% and 46.28%, 73.38%, respectively, thus alleviating the restriction of microbial N and P. Under continuous planting, the extracellular enzyme activities of N (NAG + LAP) and P (AP) were significantly decreased, and those of the second- and third-generation plantations were significantly decreased by 7.05%, 9.43% and 11.79%, 48.94%, respectively, compared with those of the first-generation plantations, resulting in an increase of 7.85 and 3.19% in carbon-use efficiency. The fungi:bacteria (F:B) ratio of the soil microbial community was elevated in successive plantations. The least squares pathway model (PLS-PM) indicated that the stoichiometric ratio of ecological enzymes had an indirect negative effect on CUE, and was the strongest predictor. This study showed that the successive plantation of Chinese fir resulted in a leaf, litter, and soil stoichiometric imbalance, further affecting community composition and resource limitation of soil microorganisms.

1. Introduction

Chinese fir (Cunninghamia lanceolata) is a unique evergreen coniferous tree species, regarded as an important timber tree in southern China because of its fast growth, high yield, and good wood quality [1]. At present, the plantation areas of Chinese fir plantation have exceeded 1.1 × 10⁷ hm2, accounting for more than 6.66% of China’s total forest areas [2]. However, the continuous expansion of pure Chinese fir forest area and successive multi-generation planting has resulted in the decline of stand quality and the woodland fertility of Chinese fir plantations, which has seriously affected the sustainable development of Chinese fir plantations [3]. At present, the nth generation effect caused by the continuous planting of Chinese fir has attracted extensive attention from many scholars. Many scholars have studied the aspects of stand productivity, nutrient cycle, and microbial community. They believe that Chinese fir continuous planting would lead to a reduction in net stand productivity, leaf nutrient utilization efficiency, soil nutrient, and microbial community diversity [4,5,6,7]. Although the effects of Chinese fir plantations on nutrient cycling and microbial community diversity have been demonstrated, few studies have examined the relationship between the “leaf-litter-soil” of Chinese fir plantations as a whole and the microbial resource constraints and community structure from the perspective of the whole ecosystem.
Studying the equilibrium of elements such as carbon, nitrogen, and phosphorus in ecological processes requires the use of ecological chemometry [8]. Leaf stoichiometry can characterize ecosystem nutrient limitation under environmental changes [9]. Similarly, the relative resorption hypothesis emphasizes that the N:P ratio identifies the nutrient acquisition and limitation of plant growth between plants and soil [10]. It has been discovered that N addition increases leaf N content and induces a high P demand, leading to cautious P usage and limitation [11]. The resorption of nutrients by plants is a crucial internal mechanism for nutrient conservation, and an efficient utilization strategy that not only reduces plant dependence on external nutrients, but also reflects the nutrient limitation of plant litter [12]. Domestic and foreign scholars have carried out a large number of studies on the effect of leaf stoichiometry on plant growth nutrient restriction and verified the specific factors limiting plant growth through leaf N:P ratios, leaf nutrient absorption efficiencies, and the correlation between nutrient absorption efficiency and soil [13,14,15]. Nutrient absorption would decrease with the increase in soil phosphorus content recently reported by Tully et al. [16]. However, some studies of Chinese fir plantations focused on the stoichiometric ratio of C, N, and P between leaf and litter [17,18], while there are few studies on leaf stoichiometric and nutrient-use efficiency evaluation of the plant nutrient limits of Chinese fir plantations.
Research has shown soil microorganisms influence the decomposition and storage of soil C, and regulate the fixation and mineralization of soil N [19]; yet, nutrient resources are often unable to meet microbial demand, and so microbial biomass and activity are frequently constrained by resources [20]. In terms of microbial resource limitation, the stoichiometric mismatch between microbial communities and their resources plays a significant role in forming ecosystems [21]. For example, a large C:N imbalance corresponds to a lower N availability relative to C availability [22]. The microbial community generally produces certain external enzymes to overcome resource limitations, but this extracellular enzyme synthesis is also constrained by the needs of the microbial community [23,24]. The threshold elemental ratio (TER), which denotes the elemental ratio at which microbial metabolism shifts from being C-limited to being N- or P-limited, can identify shifts in microbial metabolism between energy and nutrient limitation, and is considered to be strong evidence of micronutrient limitation [25]. At present, many scholars have discussed the limitation of soil quality and microbial resources from the aspects of stoichiometric imbalance [26], extracellular enzyme stoichiometry [27], and threshold element ratio [25]. Understanding how soil microbial communities change with further continuous planting is of great importance to solving the problems associated with continuous planting. However, little is known about the dynamics of the microbial community in continuous plantation system. Some studies have focused on the changes in soil nutrients, soil microbial community structure, and related extracellular enzymes at different stand ages and soil layers during continuous plantation [28,29].
Stoichiometric imbalance can not only determine the nutritional limits of microorganisms but also change the content of the microbial community composition [30,31]. In other words, the microbial nutrient restriction means that C is high relative to N or P availability, so the fate of C will depend on microbial community growth resources and adaptive strategies [32]. It has been discovered that soil bacteria are more dependent on unstable C sources heavily impacted by harsh N treatments, while soil fungi may digest relatively poor or persistent substrates [33,34]. Additionally, they accelerate metabolism by releasing extracellular enzymes that break down complex organic substances [35]. As a result, the various soil microbial communities are resource-limited by C, N, and P, likely due to changes in the litter and soil stoichiometry, and they metabolize the limiting substrate elements to satisfy the ecological mechanisms of the soil [33].
Microbial carbon-use efficiency (CUE) measures the allocation of carbon between microbial biomass and respiration [36]. Microorganisms can respond to their nutrient-use efficiency according to the chemical imbalance between resources and microorganisms [37]. For example, a lower CUE may be associated with the C:N ratio (N-deficiency) of higher substrates [38]. Chinese fir plantations will change the soil environment and microbial composition, which may lead to changes in microbial nutrient-use efficiency. However, there is little information about how different successive generations of Chinese fir plantations affect microbial carbon-use efficiency and their relationship with soil-nutrient efficiency.
Therefore, this study sought to explore the relationships between leaf, litter, and soil stoichiometry, and the effects of several subsequent generations of Chinese fir on soil nutrient restriction, microbial community structure, resource limitation status, and microbial carbon-use efficiency. We obtained leaf, litter, and soil samples from three Chinese fir plantations with various subsequent planting generations to test the theory. The soil characteristics, microbial biomass and community composition, leaf and litter C, N, and P contents, and extracellular enzyme activities in the soil were all assessed. To reveal the nutrient restriction pattern and ecological adaptability of Chinese fir continuous planting, and provide a scientific basis for the further study of Chinese fir continuous planting.

2. Materials and Methods

2.1. Experiment Site

The study site was situated in the primary Chinese fir plantation-producing region in Guangxi, Beijianghe Forest Farm, Rongshui County, Liuzhou City, Guangxi Zhuang Autonomous Region, China (108°54′–109°00′ E, 25°08′–25°17′ N) (Figure S1). The study area has a subtropical monsoon climate with an average annual temperature of 18.8 ℃, an average annual precipitation of 1824.8 mm, mostly falling between April and August, an average annual relative humidity of 77%, an altitude of 500–900 m, a slope of 18–23°, and a low mountainous hilly landscape type. The soils of the area are of the Latosol type according to the International Soil Classification System of the IUSS Working Group [39], with a loamy clay texture, which is derived from primary sedimentary rocks. The Chinese fir plantations are managed in a near-natural way to reduce disturbance from human activities. The main understory vegetation in the study area includes Ficus hirta Vahl, Blechnum orientale, Woodwardia japonica (L. F.) Sm., and Clerodendrum cyrtophyllum Turcz.
In June 2020, three Chinese fir plantations with different various subsequent planting generations were chosen in this study location, where the natural characteristics (elevation, slope direction, slope, and vegetation type) of each Chinese fir stand planting site were relatively similar. The rotation cycle of the Chinese fir plantations was generally 13–25 years, and so a “space-for-time substitution” approach was used to study the changes in litter and soil stoichiometry [3], as well as the microbial community and microbial resource limitation during the rotation in Chinese fir plantations. The three selected Chinese fir plantations were all at maturity. The first-generation Chinese fir plantations (G1) were planted in 1992, the second-generation Chinese fir plantations (G2) were planted in 1965, and the third-generation Chinese fir plantations (G3) were planted in 1955. Three experimental sample plots of 20 × 20 m were established in G1, G2, and G3, respectively. The horizontal distance between each sample site was about 1.3 km.

2.2. Sample Collection

Within each sample plot in G1, G2, and G3, five well-developed Chinese firs were selected according to diagonal placement. Leaves of the lower crown layer were collected from the four directions of east, south, west, and north; and the leaf samples from the five trees were evenly mixed into one sample. The undecomposed litter on the ground surface was collected in a 1 × 1 m sample square under the corresponding five Chinese fir stands, and the litter from the five trees was evenly mixed into one sample. The soil was collected from 0 to 10 cm using the diagonal method in the corresponding five sample plots where the litter was collected, and the soil samples from the five plots were evenly mixed into one sample.

2.3. Leaf, Litter, and Soil Chemical Assays

The leaf and litter were dried to a constant weight at 60 °C, then crushed and prepared for the determination of total organic carbon (MOC, leaf organic carbon. LOC, litter organic carbon) and total nitrogen (MTN, leaf total nitrogen. LTN, litter total nitrogen) using a Vario MACRO cube macronutrient analyzer, and total phosphorus (MTP, leaf total phosphorus. LTP, litter total phosphorus) using a perchloric acid-nitric acid digestion-molybdenum antimony colorimetric method (LY /T1270-1999, China). The soil samples were screened through a 2 mm screen to remove debris, and finally, homogenized by grinding. Some of the soil samples were air-dried for the determination of soil organic carbon (SOC), total nitrogen (STN), total phosphorus (STP), soil available phosphorus (SAP), and pH, according to Lu [40]. Another part of the soil sample was kept at 4 °C and utilized to assess the extracellular enzyme activity, soil microbial biomass carbon (MBC), the soil microbial biomass nitrogen (MBN), and the soil microbial biomass phosphorus (MBP). The carbon and nitrogen in the non-fumigated soil samples were deemed to represent soil-dissolved organic carbon (DOC) and total dissolved nitrogen (TDN) by Vance et al. [41]. Soil microbial biomass C, N, and P were assessed using chloroform fumigation extraction. The activities of the soil enzymes β-1,4-glucosidase (BG), β-1,4-N-acetylaminoglucosidase (NAG), leucine aminopeptidase (LAP), and acid phosphatase (AP) were measured using a colorimetric approach with p-nitrophenol (pNP) as a substrate by Verchot et al. [42]. C-cycle enzyme activity was represented by BG, N-cycle enzyme activity was represented by NAG + LAP, and P-cycle enzyme activity was represented by AP. The stoichiometric ratios of the extracellular enzymes C:N, C:P, and N:P were written as BG:(LAP + NAG), BG:AP, and (LAP + NAG):AP, respectively [43].

2.4. Phospholipid Fatty Acid (PLFA)

Phospholipid fatty acid analysis was used to determine the microbial communities in the soil [44]. Soil PLFA was extracted using Bligh and Dyer’s method, and fatty acid methyl esters were identified on a gas chromatograph (Agilent, Santa Clara, CA, USA) using 19:0 (Nonadecanoic acid, methyl ester) as an internal standard. The fatty esters were measured by comparing the peak areas of the samples with the peak areas of the internal standards to determine their composition and content by using the Sherlock MIS4.5 system, with concentrations expressed as nmol PLFA g−1 dry soil. Reference was made to the phospholipid fatty acid nomenclature of Zak et al. [45]. Referring to previous studies [44,46], 18:1ω9c and 18:2ω6c were characterized as fungi; 10Me16:0, 10Me17:0, and 10Me18:0 as actinomycetes; i14:0, i15:0, a15:0, i16:0, a16:0, i17:0, and a17:0 as Gram-positive bacteria (G+); cy17:0, cy19:0, 16:1ω7c, 17:1ω8c, and 18:1ω7c were characterized as Gram-negative bacteria (G−). The total PLFA concentrations were summed over all of the identified PLFAs. The bacterial biomass was obtained by summing the G+ and G− bacterial biomasses.

2.5. Calculation of Plant N and P Resorption Efficiency (%), Stoichiometric Imbalance, Microbial Resource Limitation, and CUE

The percentage reduction in nutrients from leaf and litter was determined using the formula for leaf N and P nutritional resorption efficiency:
NRE = N m N l N m   ×   100 %
PRE = P m P l P m × 100 %
where NRE is the leaf N resorption efficiency (%), Nm is the content of leaf N, Nl is the content of litter N, PRE is the leaf P resorption efficiency (%), Pm is the content of leaf P, and Pl is the content of litter P.
The ratio of resource stoichiometry to microbial biomass stoichiometry represents the imbalance in soil microbial stoichiometry. For the total pool, the ratios SOC:STN, SOC:STP, and STN:STP were utilized, and for the labile pool, the ratios DOC:TDN, DOC:SAP, and TDN:SAP were employed. The microbial biomass stoichiometry ratios were MBC:MBN, MBC:MBP, and MBN:MBP [31,47].
To demonstrate microbial resource constraint, three methods were applied. The first indicator is the proportion of C, N, and P needed to produce enzyme activity; the second indicator is a vector analysis of the extracellular enzyme activity, where larger vector lengths represent a greater C limitation, vector angles more than 45° represent a P limitation, and vector angles of less than 45° represent an N limitation. Based on the ratios BG:(NAG + LAP) and BG:AP, we estimated the vector lengths and vector angles of enzyme activity for all the data. The vector length is equal to the square root of the product of the squared values of x and y, and the vector angle is equal to the arctangent of the line connecting the origin to point (x, y) [48,49].
Vector   length = x 2 + y 2 .  
Vector   angle = Degree Atan 2 x , y
where x denotes the relative activities of enzymes gained from carbon (C) to nitrogen (N), and y denotes the relative activities of enzymes acquired from carbon (C) to phosphorus (P).
The third indication, the microbial threshold element ratio (TER), shows the conversion threshold at which the growth of microorganisms is constrained by the availability of nutrients or energy. The following are the calculations for the threshold element ratios TERC:N and TERC:P [30]:
TER C : N = ( ( BG / NAG + LAP ) B C : N / n 0
TER C : P = ( BG / AP ) B C : P / p 0
where BC:N and BC:P represent the ratios of microbial biomass MBC:MBN and MBC:MBP, and n0 and p0 represent the intercepts of the regression analysis of ln (BG) vs. ln (NAG + LAP) and ln (BG) vs. ln (AP).
Additionally, the following formula was used to determine the soil microbial carbon-use efficiency, which measures the ratio of carbon sequestered in an organism to the overall amount of carbon ingested [50]:
CUE C : X = CUE max S C : X / S C : X + K X
S C : X = 1 / EEA C : X B C : X / L C : X
CUE = CUE C : N × CUE C : P 1 / 2
where CUEmax denotes the maximum efficiency of microbiological growth under thermodynamic restrictions and is set at 0.6; SC:X indicates the extent to which the difference in soil extracellular enzyme activity offsets the elemental ratio of available N or P resources and the elemental ratio of soil microbial biomass; KX indicates the half-saturation constant and is set at 0.5; EEAC:X indicates the enzymatic activity of the direct environmental acquisition of the C, N, and P ratios; BC:X indicates the ratios of soil microbial biomasses C, N, and P; and LC:X uses an estimate of the molar ratio of soil C, N, and P.

2.6. Statistical Analysis

Data processing and statistical analysis were performed using SPSS 25 and Microsoft Excel 2010. The statistical significance of the variations between treatments was assessed using one-way ANOVA and the Duncan multiple-range test at p < 0.05. The mean and standard error of the three replicates is used to represent all the results. The links between soil resources and microorganisms, as well as between microbial stoichiometric imbalance, CUE, and TER, were identified using regression analysis. Pearson’s correlation approach was used to conduct correlation analyses. The envelope multivariate analysis of variance was used to examine significant differences in the enzyme activities and microbial community composition between treatments (PERMANOVA) [37]. To examine the correlations between the physicochemical, enzyme, and microbial community properties of soil, leaf, and litter, redundancy analysis (RDA) was carried out using Canoco5 software, among them, variance inflation factor (VIF) should be greater than or close to one to avoid autocorrelation. The partial least squares pathway model (PLS-PM) was constructed in R (4.1.2) using the “Plspm” package to determine how different successive generations of Chinese fir affect microbial CUE based on the links between leaf, litter, soil microbial stoichiometric imbalance, microbial community structure, and enzyme stoichiometry. All of the other figures are drawn using Origin 2021.

3. Results

3.1. Leaf and Litter Stoichiometry, and N and P Resorption Efficiency

The C, N, and P, and the stoichiometric ratios of leaf and litter differed significantly among three generations of stands planted successively with Chinese fir (p < 0.05; Table 1). Successive rotations of Chinese fir had no significant effect on the C of leaf, but the leaf of third-generation plantations exhibited significantly higher N and P, by 18.55% and 69.23%, respectively, with the resulting ratios of C:N, C:P, and N:P being lower than the first- and second-generation plantations. The C:N and C:P ratios of the litter dramatically reduced with the increase in successive rotation generations. In addition, the ratio of C:N to C:P of litter in third-generation plantations was much higher than that of leaf, 14.62 to 55.86% and 136.86 to 359.97% higher, respectively. The ratio of N to P resorption efficiency were significantly lowest at the second-generation plantations.

3.2. Soil Physicochemical Properties and Microbial Stoichiometry

Except for water content, the soil physicochemical properties, and C, N, and P stoichiometry differed significantly among the three Chinese fir generations of stands planted successively (p < 0.05; Table 2). As the successive planting generations increased, the pH value increased significantly. The soil C:N and C:P ratios decreased significantly with the increase in the number of successive planting generations. Compared with the first-generation plantations, the C:N ratio and C:P ratio of the third-generation plantations decreased by 9.11% and 17.14%, respectively. In the third-generation plantations, the soil available P content reached a maximum, resulting in the smallest C:P ratio.
There were significant differences in the soil microbial biomass and stoichiometric ratios among the three Chinese fir generations of successive stands (p < 0.05; Table 2). Microbial biomass P content increased significantly in the three generations of stand, and the third-generation plantations increased significantly by 73.38% compared with the first-generation plantations. In addition, further regression analysis showed that there were significant positive correlations between soil C:N vs. microbial biomass C:N, soil C:P vs. microbial biomass C:P, and soil N:P vs. microbial biomass N:P (Figure S2).

3.3. Changes in Stoichiometric Imbalance

The stoichiometric imbalance of the total resource pool and the stoichiometric imbalance of the labile resource pool differed significantly between the successive planting generations (p < 0.05, Figure 1A,B). The stoichiometric imbalance of the total resource pool increased significantly with the increase in the number of successive planting generations. The C:N imbalance of the labile resource pool tended to decrease and then increase with the number of successive generations, reaching a maximum in the first-generation plantations. In contrast, the N:P imbalance of the labile resource pool increased and then decreased when the number of consecutive generations increased, with a maximum being observed in the second-generation plantations. In addition, the C:P imbalance in the labile resource pool increased significantly, with non-significant differences between the second- and third-generation plantations.

3.4. Microbial Community Structure

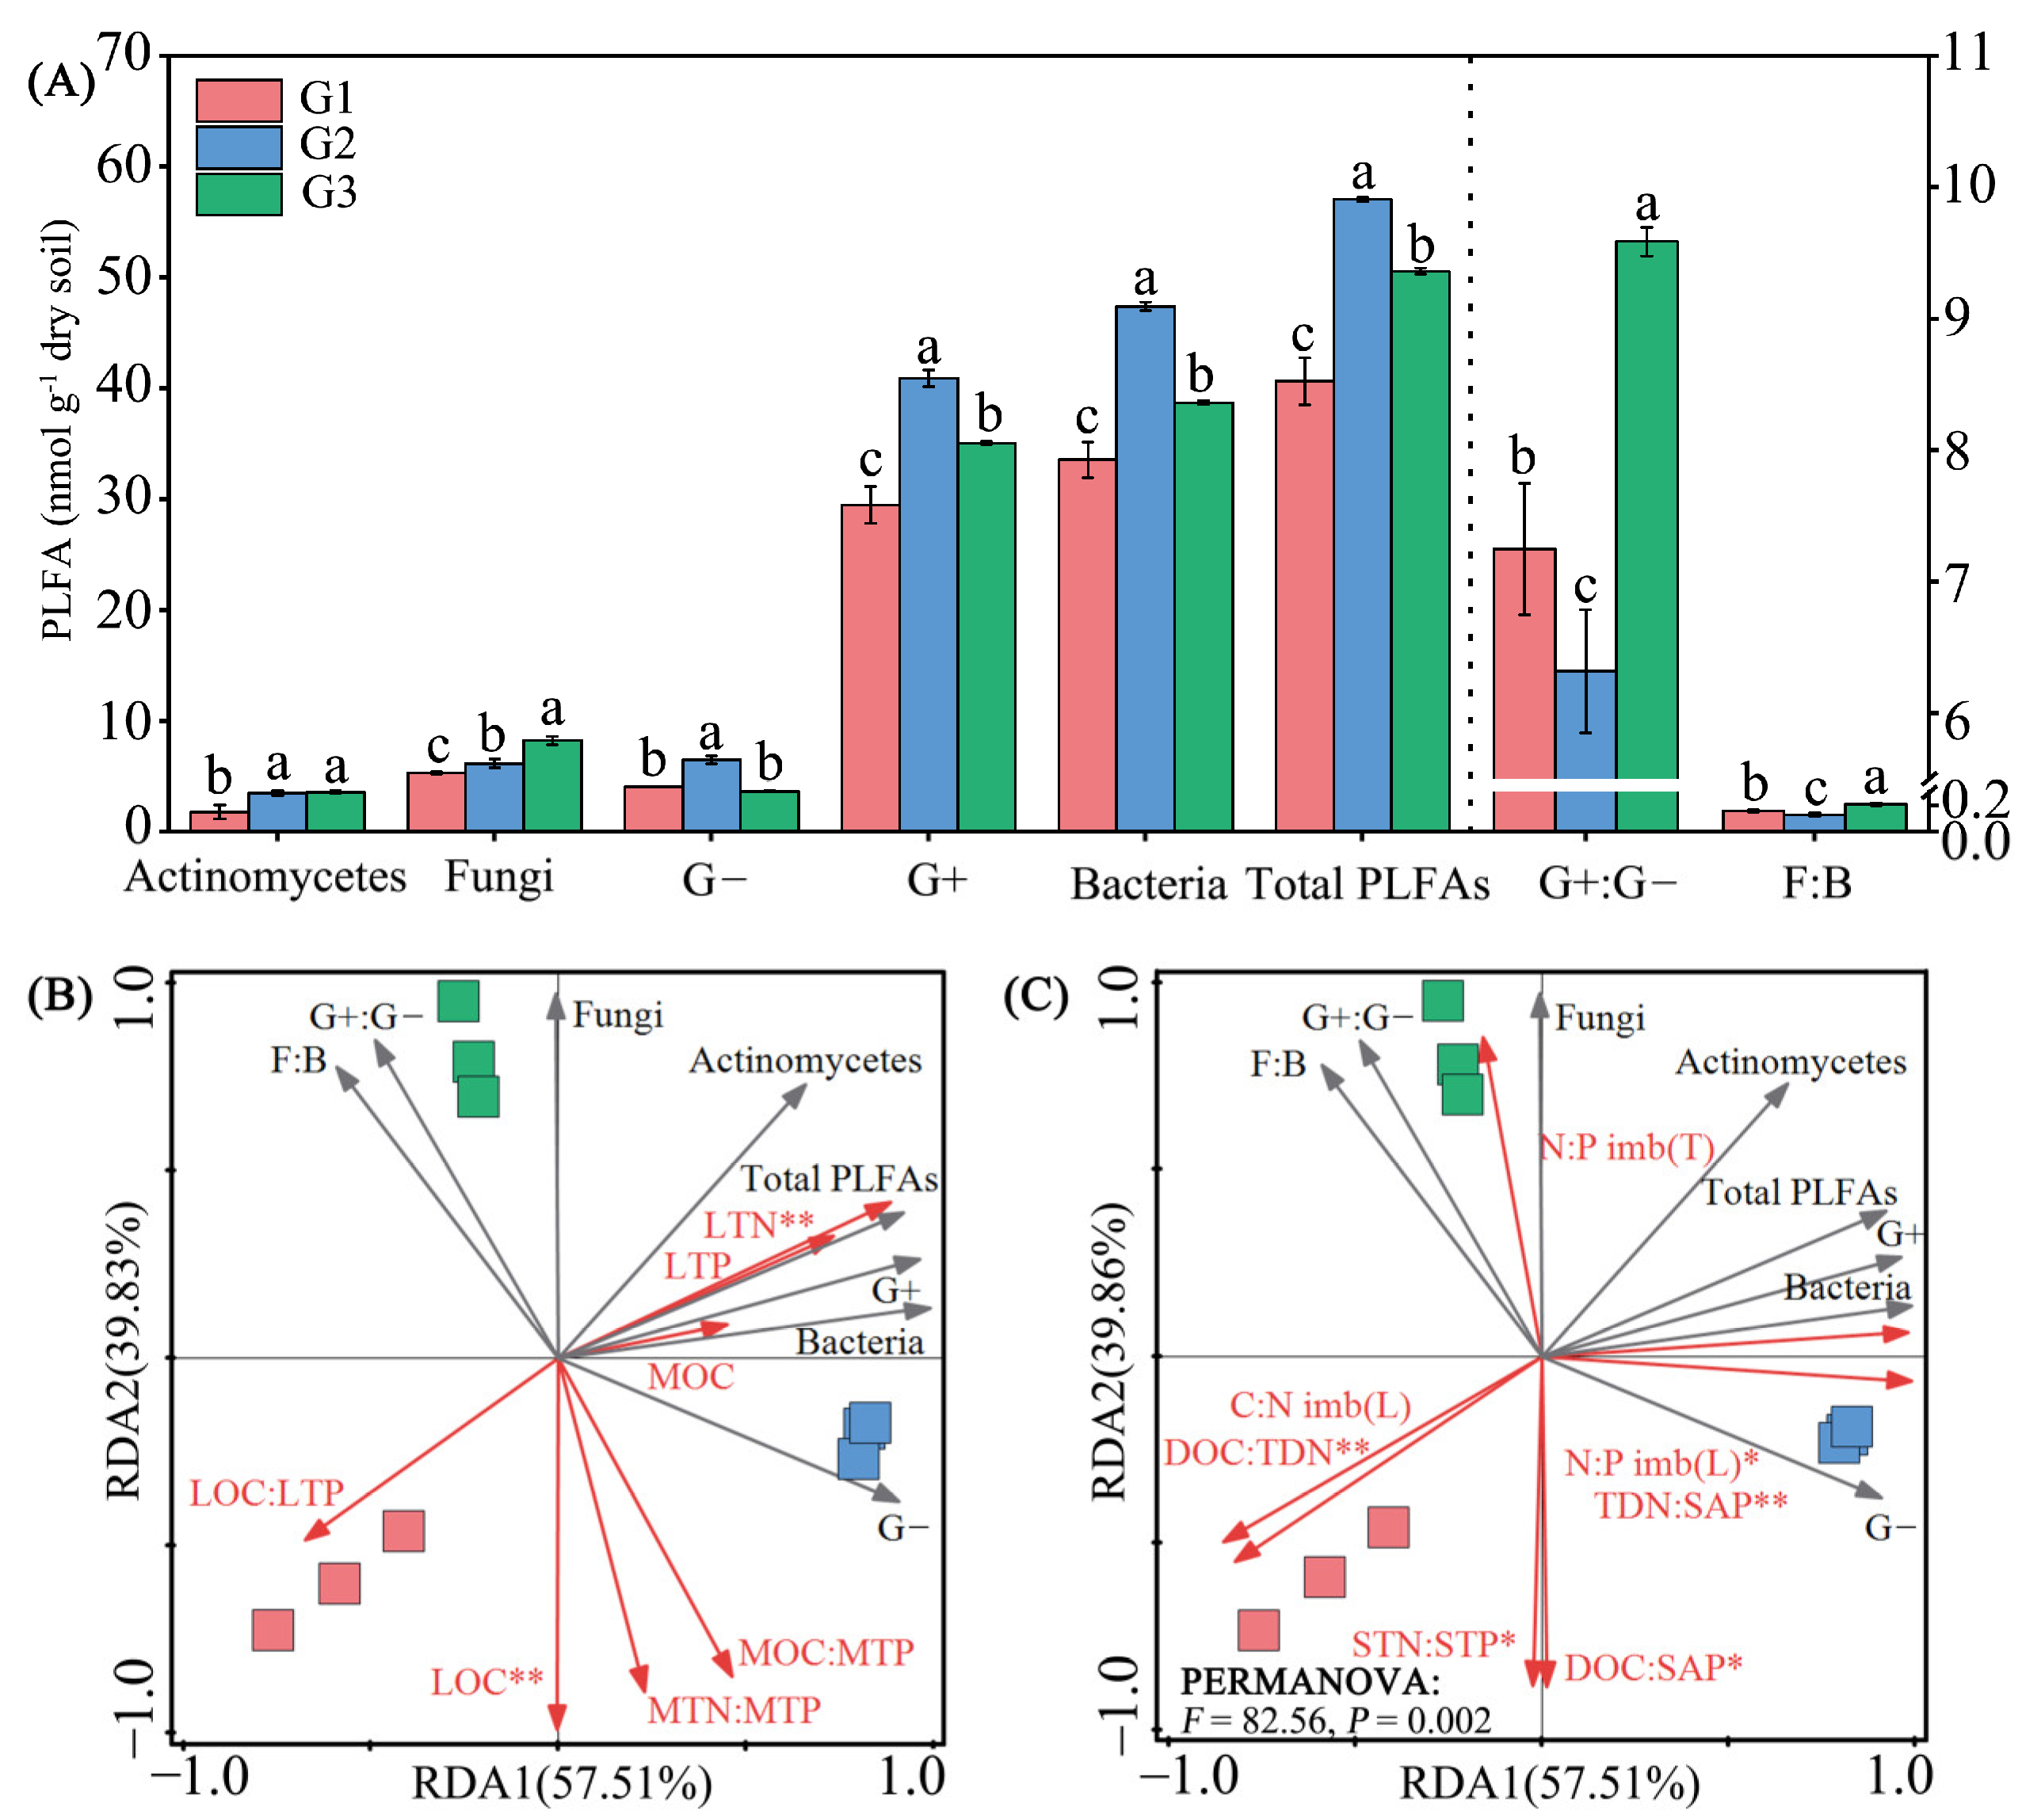
The total PLFAs, as well as other specific indicators, changed significantly with different generations of successive plantings of Chinese fir (p < 0.05, Figure 2A). As the number of successive planting generations of Chinese fir increased, total PLFAs, bacteria, Gram-positive bacteria (G+), and Gram-negative bacteria (G−), increased and then decreased, reaching a maximum in the second-generation plantations. On the contrary, the ratio of Gram-positive to Gram-negative bacteria (G+:G−), and the fungi-to-bacteria ratio (F:B) showed a trend of decreasing and then increasing with an increasing number of successive planting generations, reaching a minimum in the second-generation plantations. In addition, the fungus increased significantly with the number of successive planting generations.
The PERMANOVA results demonstrated a considerably different makeup of the major microbial groupings (F = 82.56, p = 0.002) altered under successive rotations of Chinese fir. The RDA results revealed that litter C, litter N, soil N:P, soil-dissolved C:N, soil-dissolved C:P, soil-dissolved N:P, and N:P imbalance in labile resources were considered important parameters that were significantly correlated with changes in microbial community composition (Table S1, Figure 2B,C). Soil-dissolved C:N, soil N:P, and soil-dissolved C:P were positively correlated with soil samples from first-generation plantations, and negatively correlated with soil samples from third-generation plantations.

3.5. Extracellular Enzyme Activity

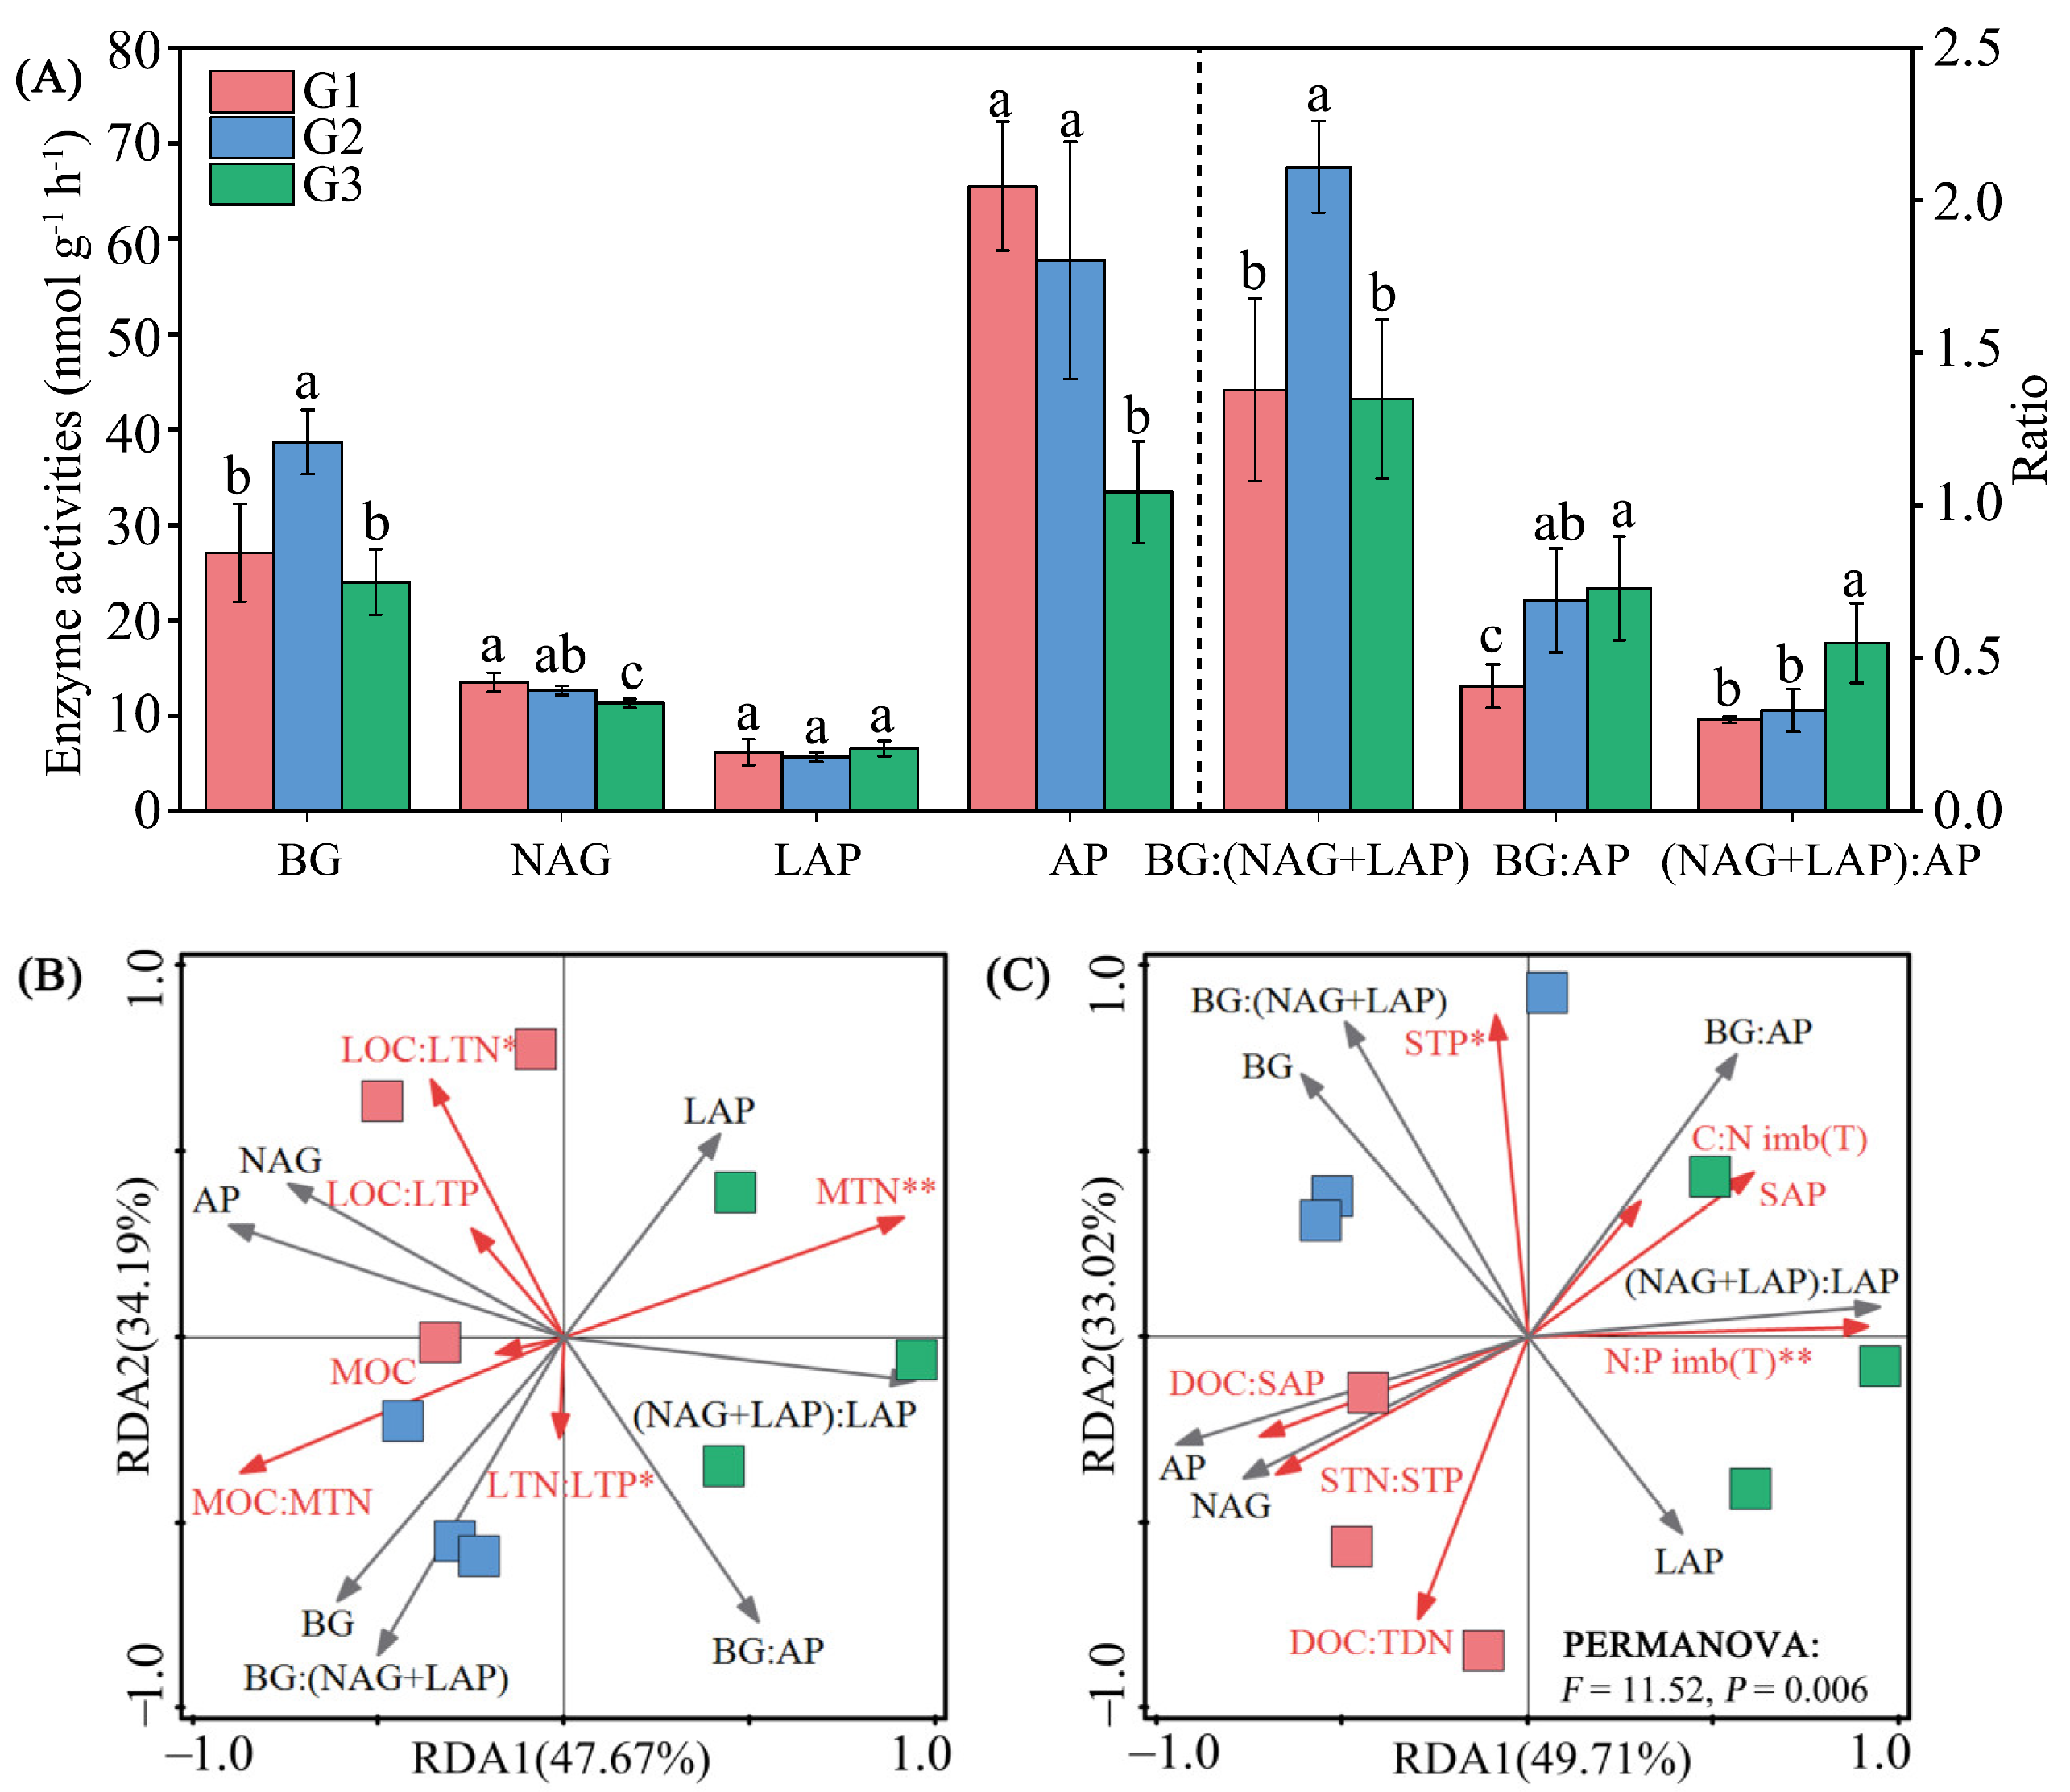
Soil extracellular enzyme activities, as well as stoichiometries, differed significantly among different successive generations of Chinese fir (p < 0.05, Figure 3A). The C-cycling enzyme BG was significantly higher in the second-generation plantations than in the first- and third-generation plantations, which resulted in the ratio of BG:(NAG + LAP) firstly increasing and then decreasing as the number of successive generations increased. The N-cycling enzyme NAG decreased significantly with the increase in successive planting generations, and there was no significant difference in the N-cycling enzyme LAP. In addition, The P-cycling enzyme AP significantly decreased by 11.79–48.94% with the increase in successive planting generations, and there was no significant difference between the first- and second-generation plantations.
The PERMANOVA results showed that the composition of the enzyme activities was significantly (F = 11.52, p = 0.006) altered under the successive rotation of Chinese fir plantations. The RDA results revealed that changes in the composition of the microbial community were substantially correlated with changes in leaf N, litter C:N, litter N:P, soil P, and N:P imbalance in the total resources (Table S2, Figure 3B,C).

3.6. Indicators of Microbial Resource Limitation

The characteristics of ecological enzyme stoichiometry differed among successive rotations of Chinese fir plantations. All of the data points were above the 1:1 line, indicating a strong P limitation in the soil microbial community (Figure 4A). Further, the relative C and P limitation of the soil microbes was quantified by calculating the vector lengths and angles. The vector analysis showed significant changes in vector length and angle for the three generations of plantations. For the second-generation plantations, the vector length was the longest, indicating that the second-generation plantations had the highest microbial C limitation. Similarly, the vector angle was greater than 45° in all three generations of plantations, with the third-generation plantations having a significantly smaller vector angle, indicating that the third-generation plantations had the lowest microbial P limitation (Figure 4B). TERC:N and TERC:P increased and then decreased with the number of successive generations, with a maximum being observed in the second-generation plantations (Figure 4C).

3.7. Linkages between Leaf, Soil, Microbial Resource Limitation, and Carbon-Use Efficiency

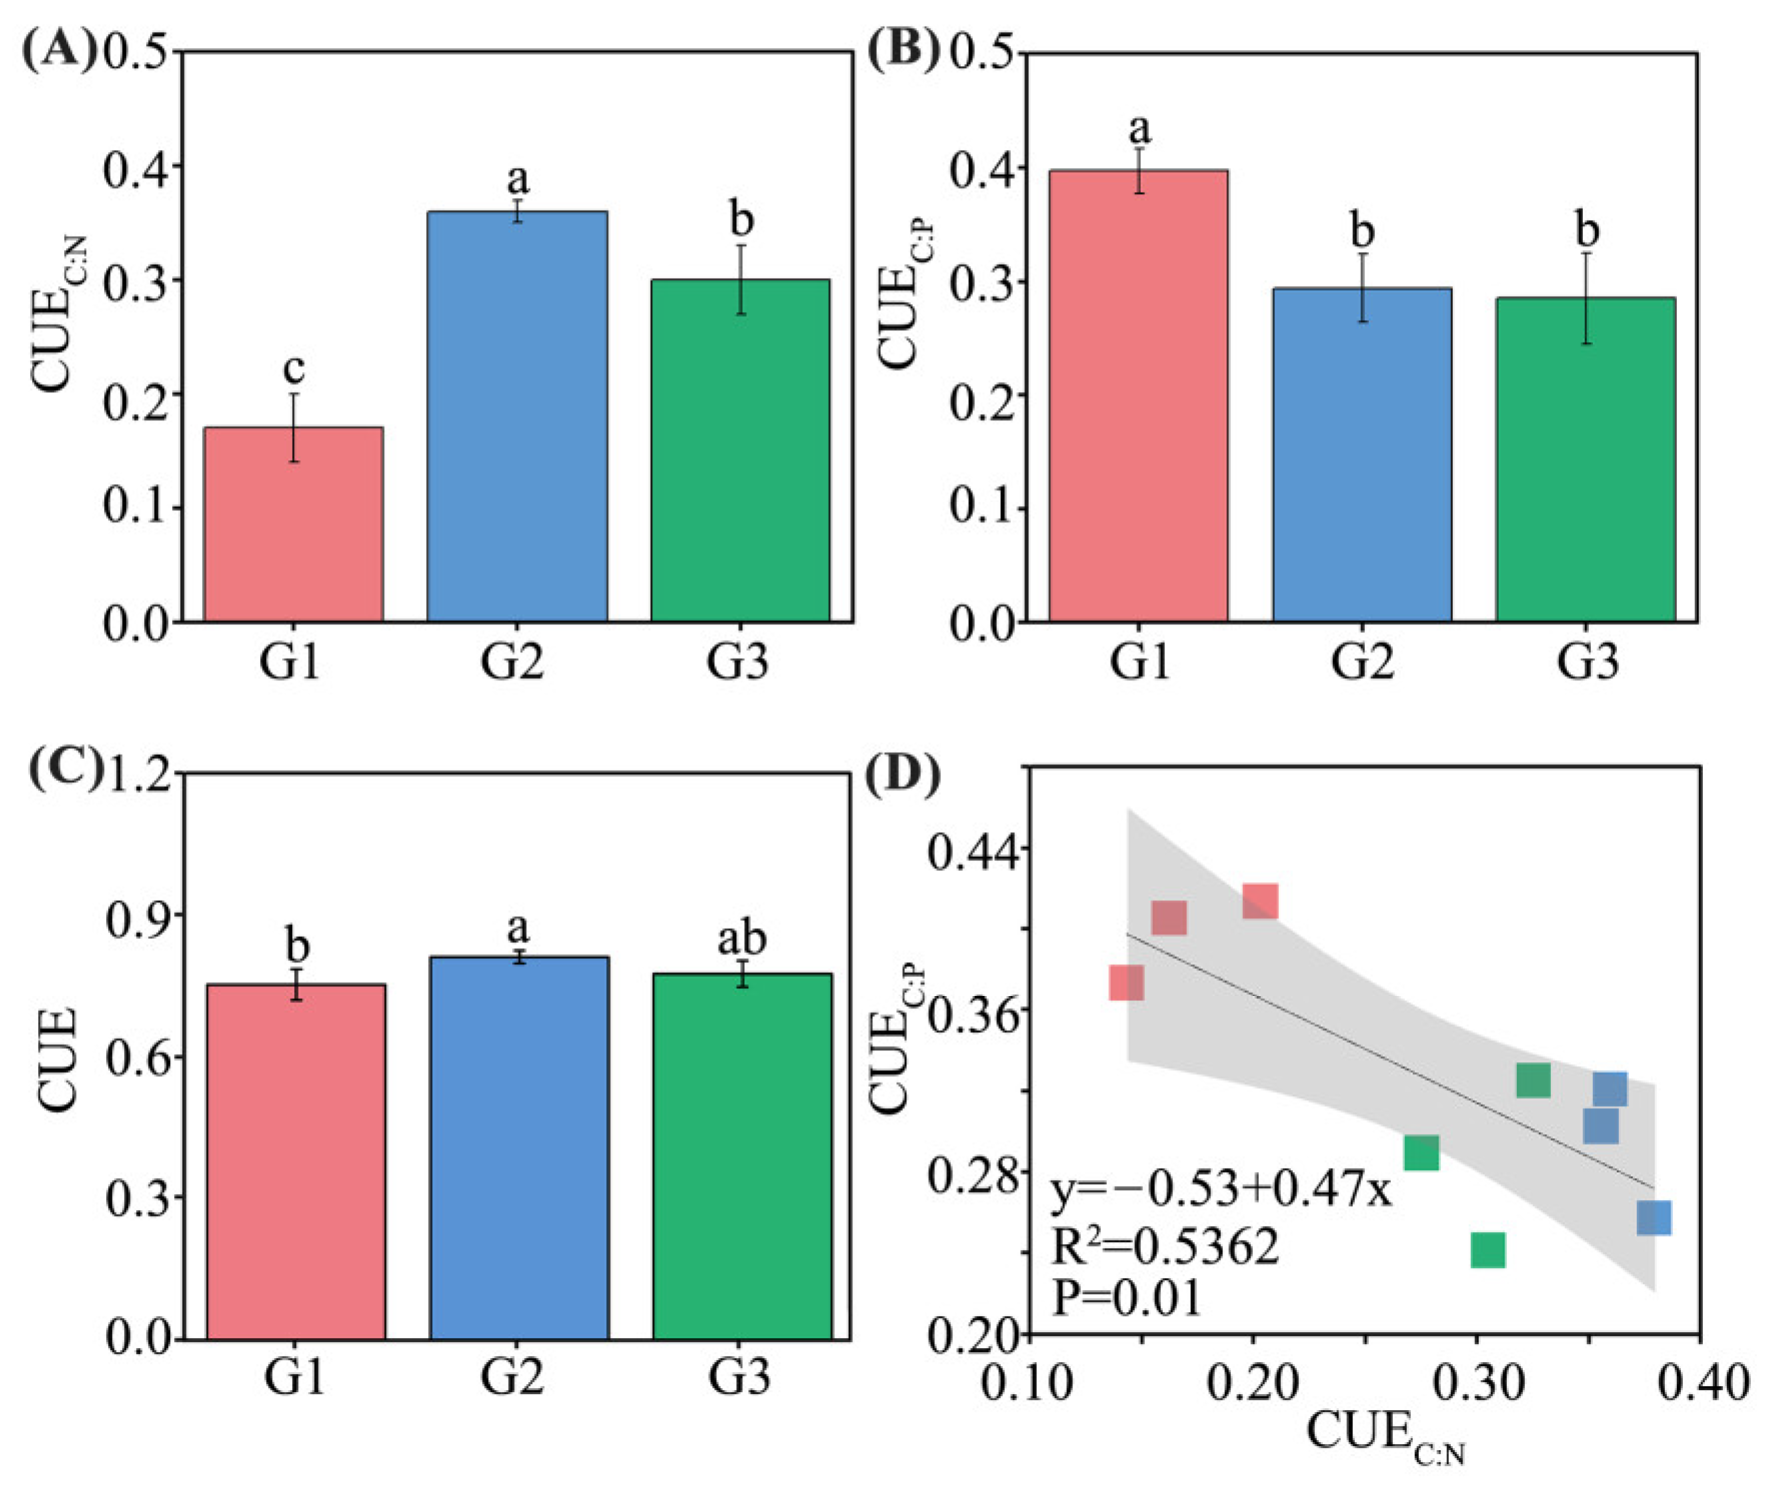
The microbial CUEC:N and CUEC:P differed significantly among the three generations of plantations (p < 0.05, Figure 5A,B). Successive rotations of Chinese fir resulted in a significantly increase of 3.19–7.85% in microbial CUE (Figure 5C). In addition, a significant negative correlation was observed between CUEC:N and CUEC:P based on linear regression analysis (Figure 5D). Additional regression analyses revealed that the C:N imbalance of the total resource pool was significantly and positively correlated with CUEC:N, the C:N imbalance of the labile resource pool was both significantly and negatively correlated with CUEC:N, and the C:P imbalance of the total and labile resource pools was significantly and negatively correlated with CUEC:P (Figure S3). The relationship between the leaf, litter, and soil characteristics, and the N and P resorption efficiency, stoichiometric imbalance, and markers of microbial resource limitation are presented in Figure S4.
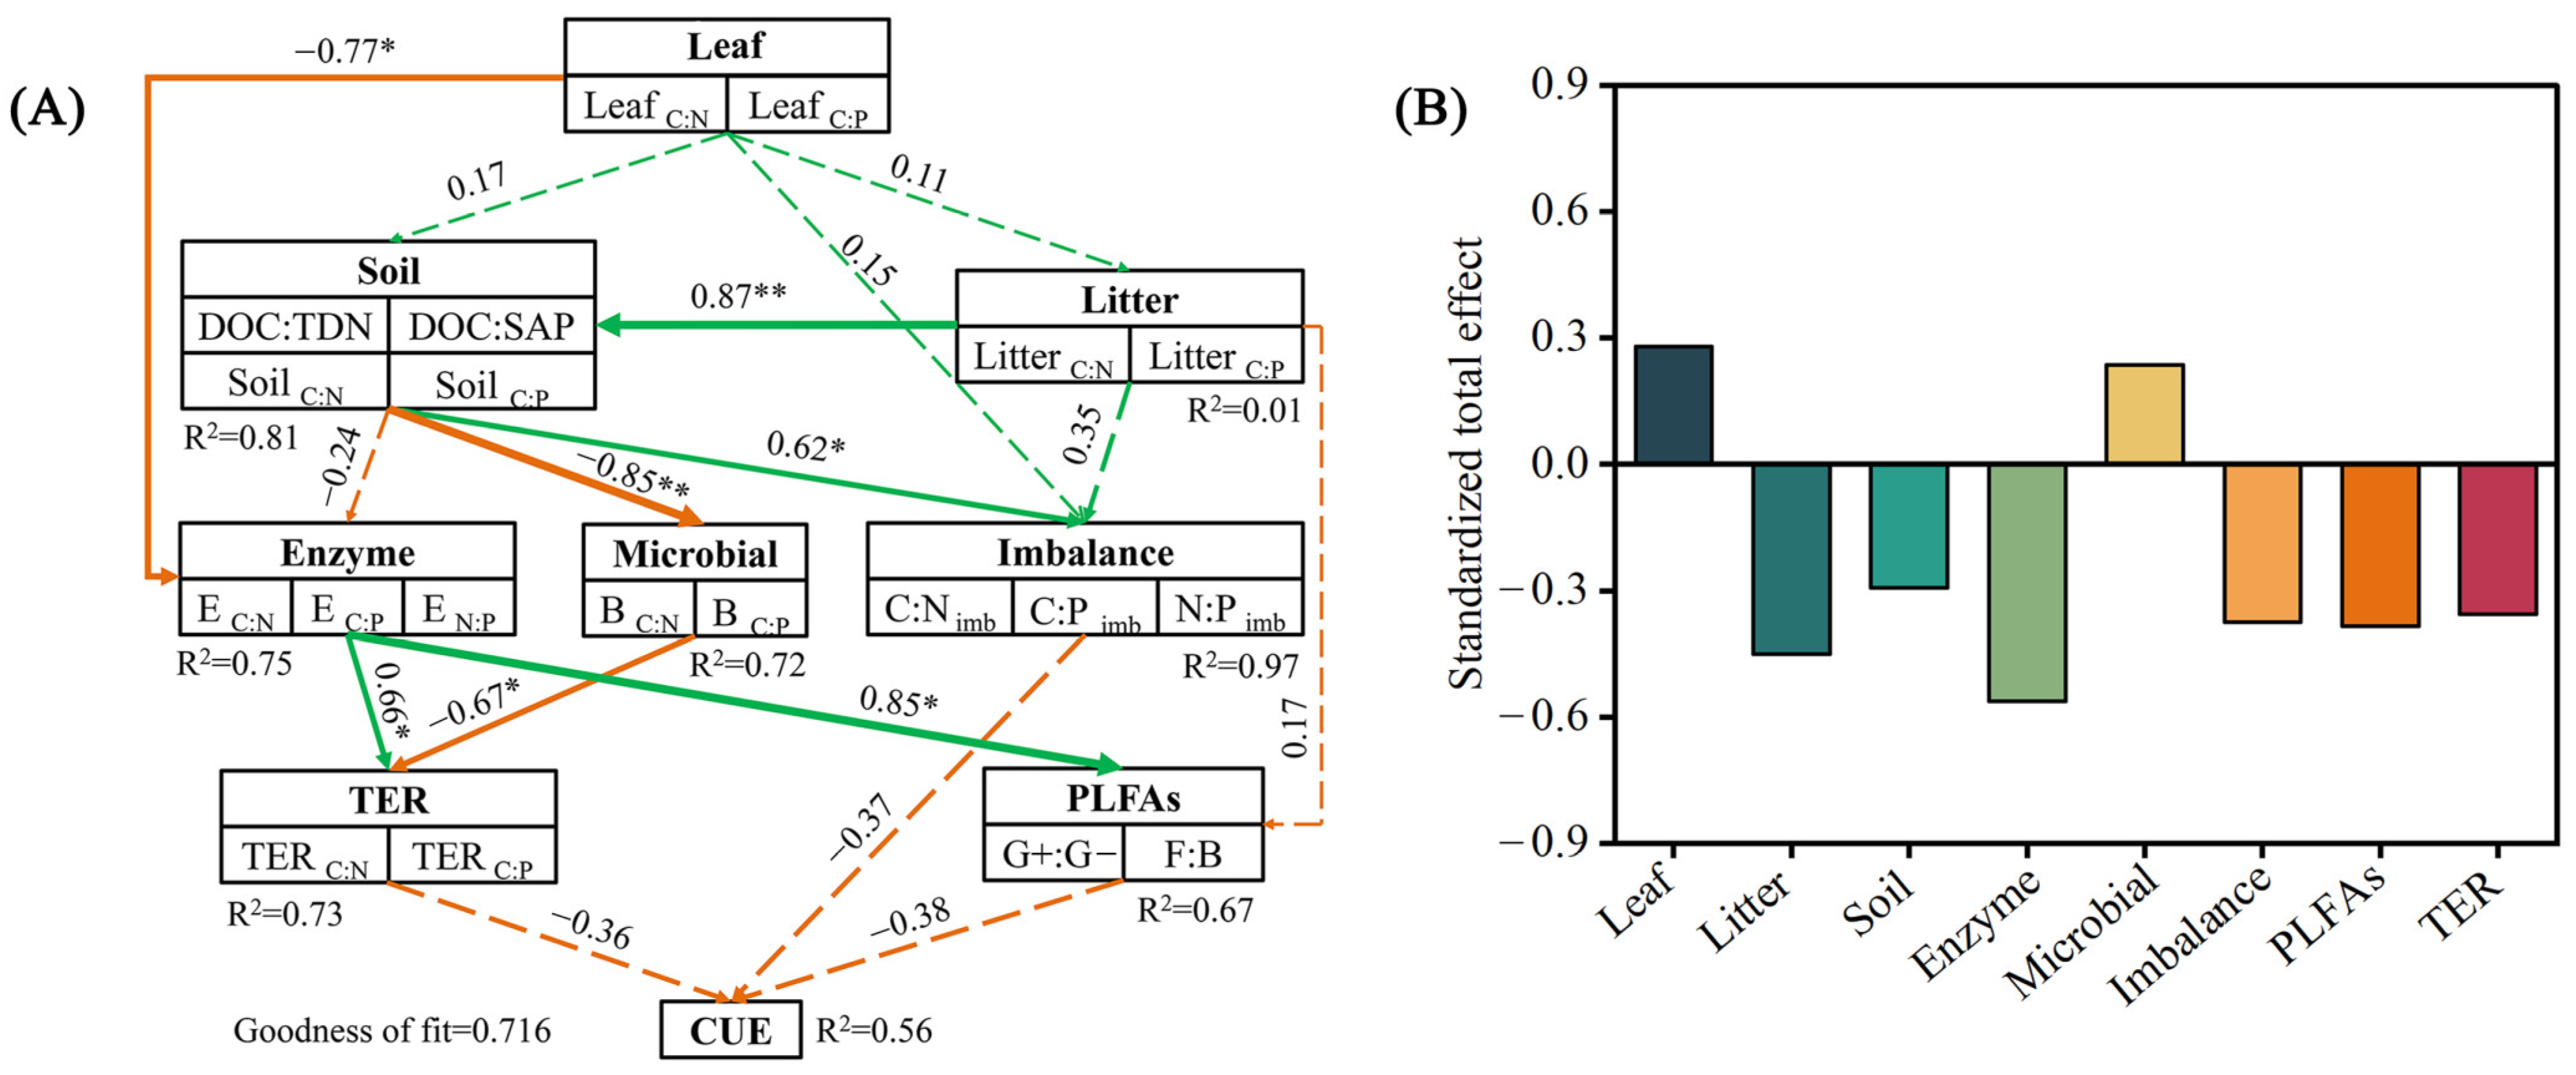
The partial least squares pathway model (PLS-PM) provided good fits for the data and explained 56% of the variance in CUE (Figure 6A). The pathways of leaf stoichiometry, litter stoichiometry, and soil physicochemical characteristics stoichiometry explained 97% of the total variance in the stoichiometric imbalance. Different successive planting generations of Chinese fir indirectly influenced CUE by affecting the litter stoichiometry, soil physicochemical characteristics stoichiometry, microbial biomass stoichiometry, and the threshold element ratio. Stoichiometric imbalance, threshold element ratio, and microbial community structure (F:B and G+:G−) had a direct negative effect on CUE. The stoichiometry of ecological enzymes was the strongest predictor of CUE (Figure 5B).

4. Discussion

4.1. Leaf, Litter and Soil Nutrient Reabsorption Efficiency and Soil Resource Limitation among Different Successive Planting Generations of Chinese Fir

In most plants, there is usually a high C content, with N and P being the most common limiting factors [51]. Some studies have found that the N and P contents of plant leaf may be affected by plant species and soil nutrients [52]. Leaf N:P is often used as a measure of the environmental nutrient limitation of plants, with leaf N:P < 14 indicating that plant growth is mainly N-limited; leaf N:P > 16, plant growth is mainly P-limited; 14 < N:P < 16, plant growth is limited by both N and P, or not [53]. In this study, the leaf N:P (7.26–10.39) of the three generations of Chinese fir stands were less than 14 (Table 1), which indicated that the growth of Chinese fir was mainly limited by N. This is consistent by Tong Ran et al. [13], but not with the general view that plant growth at low latitudes is usually limited by P. It has been shown that the leaf-limiting element N is mainly determined by plant genetic characteristics, and its low N variability may be an inherent physiological characteristic, thus promoting the N limitation of Chinese fir growth [10,54]. The correlation analysis revealed that the N and P reabsorption efficiency was significantly and positively correlated with the leaf N and P content, indicating that the N and P elements of leaf were synergistic (Figure S4).
An important aspect of the plant nutrient cycle is the effectiveness of leaf nutrient absorption [55], and plants tend to increase their P uptake efficiency when P is restricted, so that an efficient P uptake is an adaptive strategy for plants to retain phosphorus in phosphorus-poor soil ecosystems [56]. As has been observed in several tropical and subtropical forests [57], the P resorption efficiencies were higher in all three generations of Chinese fir stands than in N, indicating that the soils in all three generations are P-limited (Table 1). Additionally, our findings demonstrated that the soil P content (0.25 mg·kg−1) of the third-generation forest was significantly lower than that (0.41–1.5 mg·kg−1) of the previously generations, which appeared to demonstrate a soil P limitation [58]. P-limited soils with high N:P ratios of litter indicate the limiting effect of P on the soil decomposer community [59]. In this study, the litter N:P ratio of all three generations of stands was greater than 20 and significantly higher than the leaf N:P ratios (Table 1). The N:P resorption efficiency ratio usually increases in N-limited soils and usually decreases in P-limited soils [60]. The highest N:P resorption efficiency ratio was found in the third-generation of Chinese fir stands, indicating the lowest soil P limitation in the third generation. This is in line with the theories that the soil was P-limited, that the nutrient resorption efficiency grew dramatically with the number of subsequent planting generations, and that the P resorption efficiency was higher than the N resorption efficiency.

4.2. Stoichiometric Imbalance and Microbial Resource Limitation among Different Successive Planting Generations of Chinese Fir

In addition to the environmental factors, resource stoichiometry can limit the activity of microbial communities [61]. Since soil microbial stoichiometry is the nutritional basis of decomposing communities, stoichiometric imbalance between resources and microbial biomass can reflect the resource limitations of microorganisms [59]. The stoichiometric limitation of microbial metabolism is influenced by the available dissolved organic nutrients C:N:P in the soil [62]. Changes in the stoichiometric imbalance may be related to a microbial demand for C or N [63]. The lower C:N imbalance in second- and third-generation stands suggests that soils have a higher N effectiveness relative to C after three successive generations of Chinese fir plantation (Figure 1B), and since the global average of forest soil microbial biomass C:N is about 8.2 [64], the microbial biomass C:N ratios in three generations of Chinese fir plantations (12.49–15.94) are above the average, reflecting a higher demand of C relative to N in Chinese fir plantations that significantly decreased with the increase in successive planting generations, which may be due to the reduced availability of soil C due to the successive planting of Chinese fir [65]. Based on enzyme ratios, vector variables, and TER assessments, the alleviation of N limitation and P limitation after the continuous planting of Chinese fir was confirmed [66]. The stoichiometric homeostasis of microbial communities is met by an extracellular enzyme production and the mobilization of resources to meet their needs [47]. The BG:AP (enzyme C:P) ratio increased significantly as the number of successive generations increased, indicating a higher P availability relative to C (Figure 3A). Whether soil microorganisms are constrained by N or P is shown by the vector angle [48]. The vector angles of Chinese fir plantations for three generations were all greater than 45°, and there was no significant difference between the first- and second-generation stands, indicating that soil microorganisms were more restricted by P than by N (Figure 4A). It also further suggests that P limitation is prevalent in the soils of subtropical forests [63]. TER is a resource stoichiometry function that predicts microbial C and nutrient fluxes, and is defined as the elemental C:nutrient ratio that allows microbial metabolism to switch from energy (C) to nutrients (N or P) [48,67]. Thus, when the resource nutrient is greater than the TER, nutrients availability will limit growth. Both TERC:N and TERC:P in this study were lower than their labile resource ratios (DOC:TDN and DOC:SAP), and the limitation of microbial N and P was reduced with an increasing number of successive planting generations (Figure 4C). The stoichiometric imbalance and the limitation of microbial resources N and P may be due to changes in soil nutrient effectiveness and litter content. Stoichiometric imbalances reflect the availability and limitation of C and nutrients to the soil microbial community [31,47]. Previous studies have shown that when the effective level of a nutrient in the environment is low, microorganisms enhance the reuse of soil C and nutrients to meet the growth and metabolic demands [47,68]. As supported, we found that a C:N imbalance and a C:P imbalance in the total pool, and a C:P imbalance in the labile pool were negatively correlated with litter C:N and C:P, and soil C:N and C:P; and C:N imbalance in the labile pool was positively correlated with litter C:N and C:P, and soil C:N and C:P. PLS-PM also demonstrated the direct effects of leaf, litter, and soil on stoichiometric imbalance. It has been shown that successive rotations of Chinese fir plantations lead to a gradual decrease in the soil N and P contents with increasing rotation generations [69]. In contrast, no significant decreases in the soil C and N contents were detected in the second- and third-generation plantations compared to the first-generation plantations reported by Liu et al. [29], but the soil available P continued to decline, considering that soil P may be a more limiting nutrient than C or N in the subtropical forest soils of southern China [69]. Another important aspect affecting stoichiometric imbalance and microbiological resource constraint may be a variation in the litter quality between subsequent planting generations. Litter is the main source of material for the formation of soil organic C, and to some extent, it affects the nutrient effects of the soil [70]. In addition, the quality of the litter may influence the main physicochemical properties of the soil, which in turn regulates soil enzyme activity, microbial biomass, and nutrient requirements [71]. For example, previous studies have shown that the litter of certain coniferous trees in artificial pure forests in the northern Shanxi wind and sand zone, which contain more waxes and resins, produce more organic acids and poor humus when decomposing, leading to a reduction in soil pH, making the soil more acidic [72]. Due to the presence of litter, it modifies the soil microenvironment, removes microbial limitations, enhances activity, and promotes soil nitrogen mineralization [73]. A decrease in litter N and an increase in litter P were reported in Eucalyptus succession plantations in third-generation stands compared to second-generation stands, and this resulted in a change in the stoichiometric ratio of the litter, indicating a decrease in litter N release, and an increase in P release after successive rotations [74]. As supported, the litter C:N and C:P ratios, and the soil C:N and C:P ratios decreased significantly after three consecutive generations of Chinese fir planting, which may increase the effectiveness of soil N and P relative to C, and thus alleviate N and P limitation.

4.3. Soil Microbial Community Structure, Enzyme Activity, and CUE among Different Successive Planting Generations of Chinese Fir

The F:B ratio decreased and then increased after three consecutive generations of Chinese fir, showing a significant overall increase and reaching a maximum in the third-generation with the highest fungal content, showing that bacterial diversity continued to successively decline, and that fungal diversity became more abundant which is consistent with the report by Wu et al. [6]. However, several studies have found less fungal variety in the successive rotations of Chinese fir plantations [29,75], which may be related to the varied methodologies used in these studies. There is growing evidence that soil microorganisms can promote the decomposition of litter, reduce nutrient loss, and sustain resource exchange between above- and below-ground communities [76]. The positive correlations of total PLFAs with litter N, and the negative correlations with soil-dissolved C:N, C:P, and N:P ratios, and soil N:P and soil N:P imbalances in third-generation stands of Chinese fir confirmed that the continuous plantings of Chinese fir changed the microbial structure by changing the stoichiometric imbalance between soil microorganisms and their resources, as well as the microbial structure. This relationship is likely to be closely linked to fungal and bacterial communities. Typically, bacteria are associated with nitrogen-rich substrates, while fungi are associated with more acid-tolerant and nitrogen-poor substrates [77]. Therefore, after three consecutive generations of Chinese fir planting, the soil of the third generation of stands may favor the growth of fungi rather than bacteria.
N and P are the main limiting nutrients for plant growth, and the soil microbial community provides these nutrients to plants, but also competes with plant roots for nutrients when the soil nutrients are scarce [78]. Previous studies have shown that microorganisms are able to cope with the limited and saturated substrates or other resources by regulating enzyme production and ecological enzyme stoichiometry [79]. The microbial communities may consume more C and N to produce and excrete enzymes that are associated with P metabolism if P is a relatively restricted element reported by Marklein et al. [80]. Conversely, microorganisms are able to reduce the expression of N acquisition enzymes such as leucine aminopeptidase (LAP) when N is saturated, due to the addition of N [81]. Long-term N deposition simulations in the semi-arid grassland of northern China resulted in a significant reduction in soil N acquisition enzyme activity (LAP + NAG) at a high N addition rate of 13.80 g·N·m−2·yr−1 reported by Yuan et al. [31]. In this study, there was a positive correlation between acid phosphatase (AP), soil-dissolved C:P, and litter C:P (Figure 3B,C), suggesting that soil microbes of the third generation of stands may have reduced P acquisition enzyme production due to a higher availability of P relative to C. After three consecutive generations of Chinese fir plantations, soil C was significantly reduced, as was β-1,4-glucosidase (BG). The results of this study showed that soil β-1,4-glucosidase (BG), β-1,4-N-acetylglucosaminidase (NAG), and acid phosphatase (AP) activities showed a decreasing trend after three successive generations of Eucalyptus plantations, which is consistent with the report by Li [82]. Therefore, the results of this study suggest that soil microorganisms can adapt to the stoichiometric imbalance in the successive rotations of Chinese fir plantations by regulating extracellular enzyme activity. The regulation of extracellular enzyme production by soil microorganisms in this study is consistent with “the allocation theory of resources” of microorganisms, which invests more nutrients and energy into the production of limiting element-related enzymes to cope with the stoichiometric imbalance between microorganisms and resources [83].
In addition, the elemental-use efficiency of soil microorganisms is another major mechanism by which they cope with stoichiometric imbalances [47]. Previous studies have suggested that a low CUE may be associated with high C:N substrates or an N-limited environment [38]. When nutrients are more effective and their concentration is greater than the equilibrium concentrations of microbes, CUE increases; when nutrient limitation is altered, their microbial breakdown and synthesis, and coupled metabolic processes also change and reduce CUE [84]. In the present study, CUEC:N was lowest in the first-generation of stands, and showed an overall increasing trend in the three generations of stands, based on changes in carbon-use efficiency, suggesting that three successive generations of Chinese fir planting led to a shift in the microbial community towards a higher CUE, which may be due to the increased effectiveness of soil nutrients (reduced N and P limitations). However, the strong negative connection between the C:N imbalance and microbial CUEC:N also suggests that three generations of forests with decreasing soil C, and constant N and P levels, might control soil microbes to increase CUE and to store more carbon. As a result, when microbes lack a nutrient, they will expend more energy to seek it, which will hinder CUE and microbial growth [68]. In conclusion, these results suggest that changes in the stoichiometric imbalance after three consecutive generations of Chinese fir planting have affected the structure of the microbial community, and control microbial carbon-use efficiency.

5. Conclusions

We concluded that the continuous planting of Chinese fir plantations significantly increased the content of N and P in leaves by 18.55% and 69.23%, the ratio of C:N to C:P in litter decreased by 8.41% and 10.27%, and the content of C:N and C:P ratio decreased by 9.11% and 17.14%, and the contents of soil microbial biomass N and P increased by 21.83–37.11% and 46.28–73.38%, respectively, which resulted in the imbalance of soil stoichiometry and alleviated the limits of soil microbial N and P. The continuous planting of Chinese fir plantations has also resulted in changes in the microbial carbon-use efficiency, and shifted the major community composition towards a higher F:B ratio. Our research provides significant new information about the relationship between microbial community structure and activity, and resource stoichiometric imbalances, by arguing that changes in leaf, litter, and soil C:N:P stoichiometries after continuous Chinese fir planting can affect soil nutrient cycling.

Supplementary Materials

The following supporting information can be downloaded at: https://www.mdpi.com/article/10.3390/f14020357/s1, Table S1: Results of the permutation test of the redundancy analysis (RDA), estimating potential significant relationships between microbial community composition, leaf, litter and soil properties. The results are based on 999 permutations. Table S2: Results of the permutation test of the redundancy analysis (RDA), estimating potential significant relationships between soil extracellular enzyme, leaf, litter and soil properties. The results are based on 999 permutations. Figure S1: Research area. G1, The first-generation Chinese fir plantations; G2, The second-generation Chinese fir plantations; G3, The third-generation Chinese fir plantations. Figure S2: Relationships between the stoichiometry of soil organic carbon, nitrogen, and phosphorus (SOC:STN, SOC:STP, STN:STP) and microbial biomass (MBC:MBN, MBC:MBP, MBN:MBP). Figure S3: Carbon-use efficiency CUEC:N and CUEC:P, threshold elemental ratio TERC:N and TERC:P and their relations to the C:N imbalance and C:P imbalance for the total resource pool (A–D) and labile resource pool (E–H). Figure S4: The N and P resorption efficiency, the stoichiometric imbalance, indicators of microbial resource limitation in relation to leaf, litter and soil properties.

Author Contributions

Sample determination, data analysis, and paper writing, L.S.; sample determination and data analysis, H.L.; survey and sample collection, X.D. and P.H.; experimental design, sample survey, sample collection, and paper modification, F.C.; designed the experiment and revised the paper, S.Y. All authors have read and agreed to the published version of the manuscript.

Funding

This research was funded by the “Characteristics of microbial communities during decomposition of underground coarse roots of Eucalyptus stumps” (32160359) from the National Natural Science Foundation of China.

Data Availability Statement

Most of the data presented in this study are included in the articles and Supplementary Materials.

Acknowledgments

Thanks to Zhen Lei, the staff of Beijianghe Forest Farm, who participated in the sample collection and provided the forest management information.

Conflicts of Interest

The authors declare no conflict of interest.

References

  1. Zhang, H.; Yu, J.; Li, H.; Zhang, Y.; Pan, F.; Zhou, C.; Liu, A. Characteristics of soil phosphorus in Cunninghamia lanceolata plantations with different planting rotations. For. Res. 2021, 34, 10–18. [Google Scholar] [CrossRef]
  2. Chen, G.; Yang, Z.; Ren, G.; Xie, J.; Yang, Y. Carbon storage in a chronosequence of Chinese fir plantations in southern China. For. Ecol. Manag. 2013, 300, 68–76. [Google Scholar] [CrossRef]
  3. Tian, D.; Xiang, W.; Chen, X.; Yan, W.; Fang, X.; Kang, W.; Dan, X.; Peng, C.; Peng, Y. A long-term evaluation of biomass production in first and second rotations of Chinese fir plantations at the same site. Forestry 2011, 84, 411–418. [Google Scholar] [CrossRef]
  4. Ma, X.; Fan, S.; Chen, S.; Lin, S. Study on biomass productivity of Chinese fir plantations after successive planting. Sci. Silvae Sin. 2003, 39, 78–83. [Google Scholar]
  5. Zhou, Y.; Kang, W.; Chen, R.; Tian, D.; Xiang, W. Nutrient uptake, accumulation, and utilization efficiency comparisons in plantations containing different generations of Chinese fir. Acta Ecol. Sin. 2018, 38, 3868–3878. [Google Scholar]
  6. Wu, Z.; Li, J.; Zheng, J.; Liu, J.; Liu, S.; Lin, W.; Wu, C. Soil microbial community structure and catabolic activity are significantly degenerated in successive rotations of Chinese fir plantations. Sci. Rep. 2017, 7, 6691. [Google Scholar] [CrossRef]
  7. Farooq, T.H.; Yan, W.; Rashid, M.H.; Tigabu, M.; Gilani, M.M.; Zou, X.; Wu, P. Chinese fir (Cunninghamia lanceolata) a green gold of China with continues decline in its productivity over the successive rotations: A review. Appl. Ecol. Environ. Res. 2019, 17, 11055–11067. [Google Scholar] [CrossRef]
  8. Elser, J. Biological stoichiometry: A chemical bridge between ecosystem ecology and evolutionary biology. Am. Nat. 2006, 168, S25–S35. [Google Scholar] [CrossRef]
  9. Güsewell, S. N:P ratios in terrestrial plants: Variation and functional significance. New Phytol. 2004, 164, 243–266. [Google Scholar] [CrossRef]
  10. Han, W.; Tang, L.; Chen, Y.; Fang, J. Relationship between the relative limitation and resorption efficiency of nitrogen vs. phosphorus in woody plants. PLoS ONE 2013, 8, e83366. [Google Scholar] [CrossRef]
  11. Deng, Q.; Hui, D.; Dennis, S.; Reddy, K.C. Responses of terrestrial ecosystem phosphorus cycling to nitrogen addition: A meta-analysis. Glob. Ecol. Biogeogr. 2017, 26, 713–728. [Google Scholar] [CrossRef]
  12. Hayes, P.; Turner, B.L.; Lambers, H.; Laliberte, E. Foliar nutrient concentrations and resorption efficiency in plants of contrasting nutrient-acquisition strategies along a 2-million-year dune chronosequence. J. Ecol. 2014, 102, 396–410. [Google Scholar] [CrossRef]
  13. Tong, R.; Zhou, B.; Jiang, L.; Ge, X.; Cao, Y. The growth of Chinese fir is limited by nitrogen: Evidences from N:P ratio, N or P variability and NuRE based on a regional investigation. For. Ecol. Manag. 2020, 460, 117905. [Google Scholar] [CrossRef]
  14. Zhang, T.; Li, F.; Shi, C.; Li, Y.; Tang, S.; Baoyin, T. Enhancement of nutrient resorption efficiency increases plant production and helps maintain soil nutrients under summer grazing in a semi-arid steppe. Agric. Ecosyst. Environ. 2020, 292, 8. [Google Scholar] [CrossRef]
  15. Zheng, Y.; Guan, F.; Fan, S.; Yan, X.; Huang, L. Dynamics of leaf-litter biomass, nutrient resorption efficiency and decomposition in a moso bamboo forest after strip clearcutting. Front. Plant Sci. 2022, 12, 3297. [Google Scholar] [CrossRef]
  16. Tully, K.L.; Wood, T.E.; Schwante, A.M.; Lawrence, D. Soil nutrient availability and reproductive effort drive patterns in nutrient resorption in Pentaclethra macroloba. Ecology 2013, 94, 930–940. [Google Scholar] [CrossRef]
  17. Wu, P.; Zeng, L.; Lei, P.; Hu, D.; Li, J.; Wang, M.; Zhong, Q. Content of Leaf Nutrients and Resorption Efficiency of Major Tree Species in Tsuga chinensis Forest in Wuyi Mountain, Jiangxi Province. Sci. Silvae Sin. 2022, 58, 13–21. [Google Scholar] [CrossRef]
  18. Tong, R.; Zhou, B.; Jiang, L.; Ge, X.; Cao, Y.; Shi, J. Leaf litter carbon, nitrogen and phosphorus stoichiometry of Chinese fir (Cunninghamia lanceolata) across China. Glob. Ecol. Conserv. 2021, 27, e01542. [Google Scholar] [CrossRef]
  19. Li, J.; Liu, Y.; Hai, X.; Shangguan, Z.; Deng, L. Dynamics of soil microbial C:N:P stoichiometry and its driving mechanisms following natural vegetation restoration after farmland abandonment. Sci. Total Environ. 2019, 693, 133613. [Google Scholar] [CrossRef]
  20. Traore, O.Y.; Kiba, D.I.; Arnold, M.C.; Fliessbach, A.; Oberholzer, H.R.; Nacro, H.B.; Lompo, F.; Oberson, A.; Frossard, E.; Buenemann, E.K. Fertilization practices alter microbial nutrient limitations after alleviation of carbon limitation in a Ferric Acrisol. Biol. Fertil. Soils 2016, 52, 177–189. [Google Scholar] [CrossRef]
  21. Manzoni, S.; Trofymow, J.A.; Jackson, R.B.; Porporato, A. Stoichiometric controls on carbon, nitrogen, and phosphorus dynamics in decomposing litter. Ecol. Monogr. 2010, 80, 89–106. [Google Scholar] [CrossRef]
  22. Wild, B.; Schnecker, J.; Knoltsch, A.; Takriti, M.; Mooshammer, M.; Gentsch, N.; Mikutta, R.; Alves, R.J.; Gittel, A.; Lashchinskiy, N.; et al. Microbial nitrogen dynamics in organic and mineral soil horizons along a latitudinal transect in western Siberia. Glob. Biogeochem. Cycles 2015, 29, 567–582. [Google Scholar] [CrossRef] [PubMed]
  23. Schimel, J.P.; Weintraub, M.N. The implications of exoenzyme activity on microbial carbon and nitrogen limitation in soil: A theoretical model. Soil Biol. Biochem. 2003, 35, 549–563. [Google Scholar] [CrossRef]
  24. Liu, M.; Gan, B.; Li, Q.; Xiao, W.; Song, X. Effects of Nitrogen and Phosphorus Addition on Soil Extracellular Enzyme Activity and Stoichiometry in Chinese Fir (Cunninghamia lanceolata) Forests. Front. Plant Sci. 2022, 13, 834184. [Google Scholar] [CrossRef]
  25. Xiao, L.; Liu, G.; Li, P.; Li, Q.; Xue, S. Ecoenzymatic stoichiometry and microbial nutrient limitation during secondary succession of natural grassland on the Loess Plateau, China—ScienceDirect. Soil Tillage Res. 2020, 20, 104605. [Google Scholar] [CrossRef]
  26. Huang, Y.; Wang, Q.; Zhang, W.; Zhu, P.; Xiao, Q.; Wang, C.; Wu, L.; Tian, Y.; Xu, M.; Gunina, A. Stoichiometric imbalance of soil carbon and nutrients drives microbial community structure under long-term fertilization. Appl. Soil Ecol. 2021, 168, 9. [Google Scholar] [CrossRef]
  27. Chen, Q.; Liu, Z.; Zhou, J.; Xu, X.; Zhu, Y. Long-term straw mulching with nitrogen fertilization increases nutrient and microbial determinants of soil quality in a maize–wheat rotation on China’s Loess Plateau. Sci. Total Environ. 2021, 775, 12. [Google Scholar] [CrossRef]
  28. Selvaraj, S.; Duraisamy, V.; Huang, Z.; Guo, F.; Ma, X. Influence of long-term successive rotations and stand age of Chinese fir (Cunninghamia lanceolata) plantations on soil properties. Geoderma 2017, 306, 127–134. [Google Scholar] [CrossRef]
  29. Liu, X.; Wang, Y.; Liu, Y.; Chen, H.; Hu, Y. Response of Bacterial and Fungal Soil Communities to Chinese Fir (Cunninghamia lanceolate) Long-Term Monoculture Plantations. Front. Microbiol. 2020, 11, 181. [Google Scholar] [CrossRef]
  30. Sinsabaugh, R.L.; Hill, B.H.; Shah, J.J. Ecoenzymatic stoichiometry of microbial organic nutrient acquisition in soil and sediment. Nature 2009, 462, 795-U117. [Google Scholar] [CrossRef]
  31. Yuan, X.; Niu, D.; Gherardi, L.A.; Liu, Y.; Wang, Y.; Elser, J.J.; Fu, H. Linkages of stoichiometric imbalances to soil microbial respiration with increasing nitrogen addition: Evidence from a long-term grassland experiment. Soil Biol. Biochem. 2019, 138, 107580. [Google Scholar] [CrossRef]
  32. Hessen, D.O.; Agren, G.I.; Anderson, T.R.; Elser, J.J.; De Ruiter, P.C. Carbon, sequestration in ecosystems: The role of stoichiometry. Ecology 2004, 85, 1179–1192. [Google Scholar] [CrossRef]
  33. Cha, S.; Kim, Y.S.; Lee, A.L.; Lee, D.H.; Koo, N. Liming alters the soil microbial community and extracellular enzymatic activities in temperate coniferous forests. Forests 2021, 12, 190. [Google Scholar] [CrossRef]
  34. Nie, Y.; Wang, M.; Zhang, W.; Ni, Z.; Hashidoko, Y.; Shen, W. Ammonium nitrogen content is a dominant predictor of bacterial community composition in an acidic forest soil with exogenous nitrogen enrichment. Sci. Total Environ. 2018, 624, 407–415. [Google Scholar] [CrossRef]
  35. Jones, D.L.; Kielland, K.; Sinclair, F.L.; Dahlgren, R.A.; Newsham, K.K.; Farrar, J.F.; Murphy, D.V. Soil organic nitrogen mineralization across a global latitudinal gradient. Glob. Biogeochem. Cycles 2009, 23, GB1016. [Google Scholar] [CrossRef]
  36. Geyer, K.M.; Kyker-Snowman, E.; Grandy, A.S.; Frey, S.D. Microbial carbon use efficiency: Accounting for population, community, and ecosystem-scale controls over the fate of metabolized organic matter. Biogeochemistry 2016, 127, 173–188. [Google Scholar] [CrossRef]
  37. Sinsabaugh, R.L.; Turner, B.L.; Talbot, J.M.; Waring, B.G.; Powers, J.S.; Kuske, C.R.; Moorhead, D.L.; Follstad Shah, J.J. Stoichiometry of microbial carbon use efficiency in soils. Ecol. Monogr. 2016, 86, 18. [Google Scholar] [CrossRef]
  38. Manzoni, S.; Taylor, P.; Richter, A.; Porporato, A.; Agren, G.I. Environmental and stoichiometric controls on microbial carbon-use efficiency in soils. New Phytol. 2012, 196, 79–91. [Google Scholar] [CrossRef]
  39. Wrb, I.W.G. World reference base for soil resources 2014: International soil classification system for naming soils and creating legends for soil maps. World Soil Resour. Rep. 2014, 106, 12–21. [Google Scholar] [CrossRef]
  40. Lu, R.K. Analytical Methods of Soil Agrochemistry; China Agricultural Science and Technology Publishing House: Beijing, China, 1999; pp. 18–99. [Google Scholar]
  41. Vance, E.D.; Brookes, P.C.; Jenkinson, D.S. An extraction method for measuring soil microbial biomass C. Soil Biol. Biochem. 1987, 19, 703–707. [Google Scholar] [CrossRef]
  42. Verchot, L.V.; Borelli, T. Application of para-nitrophenol (pNP) enzyme assays in degraded tropical soils. Soil Biol. Biochem. 2005, 37, 625–633. [Google Scholar] [CrossRef]
  43. Xu, Z.; Yu, G.; Zhang, X.; He, N.; Wang, Q.; Wang, S.; Wang, R.; Zhao, N.; Jia, Y.; Wang, C. Soil enzyme activity and stoichiometry in forest ecosystems along the North-South Transect in eastern China (NSTEC). Soil Biol. Biochem. 2017, 104, 152–163. [Google Scholar] [CrossRef]
  44. Frostegard, A.; Baath, E. The use of phospholipid fatty acid analysis to estimate bacterial and fungal biomass in soil. Biol. Fertil. Soils 1996, 22, 59–65. [Google Scholar] [CrossRef]
  45. Zak, D.R.; Pregitzer, K.S.; Curtis, P.S.; Holmes, W.E. Atmospheric CO2 and the composition and function of soil microbial communities. Ecol. Appl. 2000, 10, 47–59. [Google Scholar] [CrossRef]
  46. Zelles, L. Phospholipid fatty acid profiles in selected members of soil microbial communities. Chemosphere 1997, 35, 275–294. [Google Scholar] [CrossRef]
  47. Mooshammer, M.; Wanek, W.; Zechmeister-Boltenstern, S.; Richter, A. Stoichiometric imbalances between terrestrial decomposer communities and their resources: Mechanisms and implications of microbial adaptations to their resources. Front. Microbiol. 2014, 5, 22. [Google Scholar] [CrossRef]
  48. Moorhead, D.L.; Rinkes, Z.L.; Sinsabaugh, R.L.; Weintraub, M.N. Dynamic relationships between microbial biomass, respiration, inorganic nutrients and enzyme activities: Informing enzyme-based decomposition models. Front. Microbiol. 2013, 4, 223. [Google Scholar] [CrossRef]
  49. Moorhead, D.L.; Sinsabaugh, R.L.; Hill, B.H.; Weintraub, M.N. Vector analysis of ecoenzyme activities reveal constraints on coupled C, N and P dynamics. Soil Biol. Biochem. 2016, 93, 1–7. [Google Scholar] [CrossRef]
  50. Sinsabaugh, R.L.; Manzoni, S.; Moorhead, D.L.; Richter, A. Carbon use efficiency of microbial communities: Stoichiometry, methodology and modelling. Ecol. Lett. 2013, 16, 930–939. [Google Scholar] [CrossRef]
  51. Hendricks, J.J.; Aber, J.D.; Nadelhoffer, K.J.; Hallett, R.D. Nitrogen controls on fine root substrate quality in temperate forest ecosystems. Ecosystems 2000, 3, 57–69. [Google Scholar] [CrossRef]
  52. Elser, J.J.; Fagan, W.F.; Denno, R.F.; Dobberfuhl, D.R.; Folarin, A.; Huberty, A.; Interlandi, S.; Kilham, S.S.; McCauley, E.; Schulz, K.L.; et al. Nutritional constraints in terrestrial and freshwater food webs. Nature 2000, 408, 578–580. [Google Scholar] [CrossRef]
  53. Koerselman, W.; Meuleman, A.F.M. The vegetation N:P ratio: A new tool to detect the nature of nutrient limitation. J. Appl. Ecol. 1996, 33, 1441–1450. [Google Scholar] [CrossRef]
  54. Yang, X.; Chi, X.; Ji, C.; Liu, H.; Ma, W.; Mohhammat, A.; Shi, Z.; Wang, X.; Yu, S. Variations of leaf N and P concentrations in shrubland biomes across northern China: Phylogeny, climate, and soil. Biogeosciences 2016, 13, 4429–4438. [Google Scholar] [CrossRef]
  55. Deng, M.; Liu, L.; Sun, Z.; Piao, S.; Ma, Y.; Chen, Y.; Wang, J.; Qiao, C.; Wang, X.; Li, P. Increased phosphate uptake but not resorption alleviates phosphorus deficiency induced by nitrogen deposition in temperate Larix principis-rupprechtii plantations. New Phytol. 2016, 212, 1019–1029. [Google Scholar] [CrossRef] [PubMed]
  56. Richardson, S.J.; Allen, R.B.; Doherty, J.E. Shifts in leaf N:P ratio during resorption reflect soil P in temperate rainforest. Funct. Ecol. 2008, 22, 738–745. [Google Scholar] [CrossRef]
  57. Haettenschwiler, S.; Aeschlimann, B.; Couteaux, M.M.; Roy, J.; Bonal, D. High variation in foliage and leaf litter chemistry among 45 tree species of a neotropical rainforest community. New Phytol. 2008, 179, 165–175. [Google Scholar] [CrossRef]
  58. Zeng, Z.; Wang, K.; Liu, X.; Zeng, F.; Song, T.; Peng, W.; Zhang, H.; Du, H. Stoichiometric characteristics of plants, litter and soils in karst plant communities of Northwest Guangxi. Chin. J. Plant Ecol. 2015, 39, 682–693. [Google Scholar]
  59. Zechmeister-Boltenstern, S.; Keiblinger, K.M.; Mooshammer, M.; Penuelas, J.; Richter, A.; Sardans, J.; Wanek, W. The application of ecological stoichiometry to plant-microbial-soil organic matter transformations. Ecol. Monogr. 2015, 85, 133–155. [Google Scholar] [CrossRef]
  60. Zotz, G. The resorption of phosphorus is greater than that of nitrogen in senescing leaves of vascular epiphytes from lowland Panama. J. Trop. Ecol. 2004, 20, 693–696. [Google Scholar] [CrossRef]
  61. Sterner, R.W.; Elser, J.J. Ecological Stoichiometry: The Biology of Elements from Molecules to the Biosphere; Princeton University Press: Princeton, NJ, USA, 2002; p. 1183. [Google Scholar]
  62. Kaiser, C.; Franklin, O.; Dieckmann, U.; Richter, A. Microbial community dynamics alleviate stoichiometric constraints during litter decay. Ecol. Lett. 2014, 17, 680–690. [Google Scholar] [CrossRef]
  63. Niu, Y.; Chai, R.; Jin, G.; Wang, H.; Tang, C.; Zhang, Y. Responses of root architecture development to low phosphorus availability: A review. Ann. Bot. 2013, 112, 391–408. [Google Scholar] [CrossRef] [PubMed]
  64. Cleveland, C.C.; Liptzin, D. C:N:P stoichiometry in soil: Is there a “Redfield ratio” for the microbial biomass? Biogeochemistry 2007, 85, 235–252. [Google Scholar] [CrossRef]
  65. Breuer, L.; Huisman, J.A.; Keller, T.; Frede, H.G. Impact of a conversion from cropland to grassland on C and N storage and related soil properties: Analysis of a 60-year chronosequence. Geoderma 2006, 133, 6–18. [Google Scholar] [CrossRef]
  66. Frost, P.C.; Benstead, J.P.; Cross, W.F.; Hillebrand, H.; Larson, J.H.; Xenopoulos, M.A.; Yoshida, T. Threshold elemental ratios of carbon and phosphorus in aquatic consumers. Ecol. Lett. 2006, 9, 774–779. [Google Scholar] [CrossRef]
  67. Averill, C. Divergence in plant and microbial allocation strategies explains continental patterns in microbial allocation and biogeochemical fluxes. Ecol. Lett. 2014, 17, 1202–1210. [Google Scholar] [CrossRef] [PubMed]
  68. Cui, Y. Study on the Characteristics Driving Mechanisms of Soil Microbial Nutrient Limitation. Ph.D. Thesis, University of Chinese Academy of Sciences, Beijing, China, 2020. [Google Scholar]
  69. Zou, X.; Wu, P.; Chen, N.; Wang, P.; Ma, X. Chinese fir root response to spatial and temporal heterogeneity of phosphorus availability in the soil. Can. J. For. Resesrch 2015, 45, 402–410. [Google Scholar] [CrossRef]
  70. Zhao, Y.; Liang, C.; Shao, S.; Chen, J.; Qin, H.; Xu, Q. Linkages of litter and soil C:N:P stoichiometry with soil microbial resource limitation and community structure in a subtropical broadleaf forest invaded by Moso bamboo. Plant Soil 2021, 465, 473–490. [Google Scholar] [CrossRef]
  71. Tamura, M.; Tharayil, N. Plant litter chemistry and microbial priming regulate the accrual, composition and stability of soil carbon in invaded ecosystems. New Phytol. 2014, 203, 110–124. [Google Scholar] [CrossRef]
  72. Mi, C. Effect of Litter Decomposition and Nutrient Circulation on Soil Polarization in the Planted Pure Forests of Loess Plateau. Ph.D. Thesis, Northwest Agriculture and Forestry University, Xianyang, China, 2014. [Google Scholar]
  73. Briones, M.J.I.; Ineson, P. Decomposition of eucalyptus leaves in litter mixtures. Soil Biol. Biochem. 1996, 28, 1381–1388. [Google Scholar] [CrossRef]
  74. Li, J. Ecological Stoichiomrtry Characteristics and Seasonal Variation in Continuous Planted Eucalyptus Plantations. Master’s Thesis, Guangxi University, Nanning, China, 2017. [Google Scholar]
  75. Zhou, L.; Li, J.; Luo, Y.; Liu, S.; Chen, J.; Wang, J.; Bai, Y.; Lin, W.; Wu, Z. Variation in soil fungal community structure during successive rotations of Casuarina equisetifolia plantations as determined by high-throughput sequencing analysis. Plant Growth Regul. 2019, 87, 445–453. [Google Scholar] [CrossRef]
  76. Wardle, D.A.; Bardgett, R.D.; Klironomos, J.N.; Setala, H.; Vander Putten, W.H.; Wall, D.H. Ecological linkages between aboveground and belowground biota. Science 2004, 304, 1629–1633. [Google Scholar] [CrossRef]
  77. Corneo, P.E.; Pellegrini, A.; Cappellin, L.; Roncador, M.; Chierici, M.; Gessler, C.; Pertot, I. Microbial community structure in vineyard soils across altitudinal gradients and in different seasons. Fems Microbiol. Ecol. 2013, 84, 588–602. [Google Scholar] [CrossRef]
  78. Inselsbacher, E.; Hinko-Najera Umana, N.; Stange, F.C.; Gorfer, M.; Schueller, E.; Ripka, K.; Zechmeister-Boltenstern, S.; Hood-Novotny, R.; Strauss, J.; Wanek, W. Short-term competition between crop plants and soil microbes for inorganic N fertilizer. Soil Biol. Biochem. 2010, 42, 360–372. [Google Scholar] [CrossRef]
  79. Dong, H.; Ge, J.; Sun, K.; Wang, B.; Xue, J.; Wakelin, S.A.; Wu, J.; Sheng, W.; Liang, C.; Xu, Q.; et al. Change in root-associated fungal communities affects soil enzymatic activities during Pinus massoniana forest development in subtropical China. For. Ecol. Manag. 2021, 482, 118817. [Google Scholar] [CrossRef]
  80. Marklein, A.R.; Houlton, B.Z. Nitrogen inputs accelerate phosphorus cycling rates across a wide variety of terrestrial ecosystems. New Phytol. 2012, 193, 696–704. [Google Scholar] [CrossRef]
  81. Corrales, A.; Turner, B.L.; Tedersoo, L.; Anslan, S.; Dalling, J.W. Nitrogen addition alters ectomycorrhizal fungal communities and soil enzyme activities in a tropical montane forest. Fungal Ecol. 2017, 27, 14–23. [Google Scholar] [CrossRef]
  82. Li, C.T. Relationship between Evolution of Understory Plant Functional Groups and Soil Nutrient in Eucalyptus Plantations; Guangxi University: Nanning, China, 2019. [Google Scholar]
  83. Tapia-Torres, Y.; Elser, J.J.; Souza, V.; Garcia-Oliva, F. Ecoenzymatic stoichiometry at the extremes: How microbes cope in an ultra-oligotrophic desert soil. Soil Biol. Biochem. 2015, 87, 34–42. [Google Scholar] [CrossRef]
  84. Wang, M.; Bhardwaj, G.; Webster, T.J. Antibacterial properties of PEKK for orthopedic applications. Int. J. Nanomed. 2017, 12, 6471–6476. [Google Scholar] [CrossRef]
Figure 1. The effect of continuous planting of Chinese fir on the stoichiometric imbalance between the soil microbial community and its total resource pool (A) and labile resource pool (B). (T) Stoichiometric imbalance of the total resource pool. (L) Stoichiometric imbalance of the labile resource pool. Different letters indicate significantly different means between treatments (p < 0.05).
Forests 14 00357 g001
Figure 2. The quantity of phospholipid acid (PLFA) biomarkers (A), microbial community composition redundancy analysis with leaf and litter (B), and soil characteristics (C) in the successive rotations of Chinese fir plantations. The ratios of Gram-positive to Gram-negative bacteria (G+:G−), and fungi to bacteria (F:B), respectively. C:N imb(L), C:N imbalance for the labile resource pool; N:P imb(T), N:P imbalance for the total resource pool; N:P imb(L), N:P imbalance for the labile resource pool. The red arrows with asterisks indicate significant (*, p < 0.05; **, p < 0.01) factors affecting the community structure. Different letters indicate significantly different means between treatments (p < 0.05).
Forests 14 00357 g002
Figure 3. The successive rotation of Chinese fir enzyme activities (A), and redundancy analysis of the microbial community composition with leaf and litter (B), and soil properties (C). BG, β-1,4-glucosidase; NAG, β-1,4-N-acetylglucosaminidase; LAP, leucine aminopeptidase; AP, acid phosphatase. C:N imb(T), C:N imbalance for the total resource pool; N:P imb(T), N:P imbalance for the total resource pool. The red arrows with asterisks indicate significant (*, p < 0.05; **, p < 0.01) factors affecting the enzyme activities. Different letters indicate significantly different means between treatments (p < 0.05).
Forests 14 00357 g003
Figure 4. The effect of continuous planting of Chinese fir on ecoenzymatic stoichiometry of relative proportions of C-to-N acquisition versus C-to-P acquisition (A), vector length and angle (B), and threshold elemental ratio TERC:N, and TERC:P (C) of the soil microbial community enzyme activities. Different letters indicate significantly different means between treatments (p < 0.05).
Forests 14 00357 g004
Figure 5. Effects of successive rotations of Chinese fir plantations on microbial carbon-use efficiencies (CUEC:N, (A), CUEC:P, (B), CUE, (C)) and the relationships between them (D). Different letters indicate significantly different means between treatments (p < 0.05).
Forests 14 00357 g005
Figure 6. A partial least squares pathway model (PLS-PM) of the effect of leaf chemical properties on microbial carbon-use efficiency (CUE) between successive planting generations was developed using soil physicochemical property ratios, litter stoichiometry, ecoenzymatic stoichiometry, microbial biomass ratios, stoichiometric imbalance ratios, threshold element ratios, and microbial community structure (F:B and G+:G−) (A). The PLS-PM was used to determine the standardized total effects (direct and indirect effects) (B). Arrow widths are proportional to the size of the path coefficients, which are numbered next to the arrows. Positive and negative correlations are denoted by green and orange arrows, respectively. Significant and unimportant correlations are denoted by continuous and dashed arrows, respectively. Level of significance: *, p < 0.05; **, p < 0.01.
Forests 14 00357 g006
Table 1. Stoichiometries of the leaf and litter of Chinese fir with different successive rotation generations.
G1G2G3
LeafMOC(g·kg−1)519.73 ± 2.33 a523.33 ± 5.12 a521.30 ± 1.90 a
MTN(g·kg−1)16.12 ± 0.59 b14.26 ± 0.33 c19.11 ± 0.84 a
MTP(g·kg−1)1.56 ± 0.14 b1.39 ± 0.02 b2.64 ± 0.21 a
MOC:MTN32.27 ± 1.23 b36.72 ± 1.19 a27.32 ± 1.26 c
MOC:MTP334.99 ± 30.35 b376.56 ± 7.36 a198.24 ± 14.71 c
MTN:MTP10.39 ± 1.00 a10.26 ± 0.19 a7.26 ± 0.54 b
LitterLOC(g·kg−1)577.82 ± 0.42 a573.27 ± 1.03 b562.04 ± 0.92 c
LTN(g·kg−1)12.43 ± 0.07 c13.62 ± 0.16 a13.20 ± 0.03 b
LTP(g·kg−1)0.57 ± 0.03 c0.64 ± 0.02 a0.62 ± 0.03 ab
LOC:LTN46.49 ± 0.23 a42.09 ± 0.55 b42.58 ± 0.09 b
LOC:LTP1016.16 ± 59.98 a891.89 ± 29.95 b911.85 ± 45.13 b
LTN:LTP21.86 ± 1.18 a21.19 ± 0.48 a21.42 ± 1.10 a
Leaf Nutrient Resorption EfficiencyNRE (%)22.83 ± 2.73 b4.43 ± 3.30 c30.84 ± 3.04 a
PRE (%)63.38 ± 1.45 b53.72 ± 1.63 c76.58 ± 0.69 a
NRE:PRE0.36 ± 0.05 a0.08 ± 0.05 b0.40 ± 0.04 a
G1, the first-generation Chinese fir plantations; G2, the second-generation Chinese fir plantations; G3, the third-generation Chinese fir plantations; MOC, leaf organic carbon; MTN, leaf total nitrogen; MTP, leaf total phosphorus; LOC, litter organic carbon; LTN, litter total nitrogen; LTP, litter total phosphorus; NRE, leaf N resorption efficiency (%); PRE, leaf P resorption efficiency (%). Data are means ± S.D. Different letters in a single row indicate significantly different means between treatments (p < 0.05).
Table 2. Soil properties of the continuously cultivated Chinese fir plantations.
G1G2G3
SoilpH4.02 ± 0.03 c4.10 ± 0.03 b4.19 ± 0.01 a
Moisture (%)15.15 ± 1.42 a17.75 ± 3.09 a17.30 ± 1.95 a
SOC(g·kg−1)27.07 ± 0.13 b27.94 ± 0.39 a24.41 ± 0.39 c
STN(g·kg−1)1.71 ± 0.04 b2.02 ± 0.03 a1.70 ± 0.03 b
STP(g·kg−1)0.23 ± 0.01 b0.28 ± 0.01 a0.25 ± 0.02 b
SOC: STN15.80 ± 0.33 a13.82 ± 0.25 b14.36 ± 0.47 b
SOC: STP118.85 ± 5.00 a101.15 ± 1.86 b98.48 ± 7.26 b
STN: STP7.52 ± 0.19 a7.32 ± 0.15 a6.85 ± 0.32 b
DOC(mg·kg−1)348.05 ± 2.42 b373.31 ± 5.70 a328.41 ± 5.13 c
TDN(mg·kg−1)5.79 ± 0.26 c48.91 ± 1.01 a17.29 ± 0.79 b
SAP(mg·kg−1)1.74 ± 0.19 b2.05 ± 0.09 a2.33 ± 0.16 a
DOC: TDN60.17 ± 3.00 a7.64 ± 0.28 c19.01 ± 0.76 b
DOC: SAP202.02 ± 19.97 a182.58 ± 8.36 a141.23 ± 10.24 b
TDN: SAP3.37 ± 0.45 c23.92 ± 1.11 a7.43 ± 0.39 b
MicrobeMBC(mg·kg−1)338.04 ± 8.58 b362.20 ± 12.07 a331.93 ± 12.00 b
MBN(mg·kg−1)21.21 ± 0.48 c29.08 ± 1.50 a25.84 ± 0.24 b
MBP(mg·kg−1)4.17 ± 0.05 c6.10 ± 0.16 b7.23 ± 0.13 a
MBC: MBN15.94 ± 0.35 a12.49 ± 1.02 b12.85 ± 0.57 b
MBC: MBP81.08 ± 2.75 a59.38 ± 1.54 b45.94 ± 2.45 c
MBN: MBP5.09 ± 0.18 a4.77 ± 0.28 a3.57 ± 0.05 b
SOC, soil organic carbon; STN, soil total nitrogen; STP, soil total phosphorus; DOC, dissolved organic carbon; TDN, total dissolved nitrogen; SAP, soil available phosphorus; MBC, microbial biomass carbon; MBN, microbial biomass nitrogen; MBP, microbial biomass phosphorus. Data are means ± S.D. Different letters in a single row indicate significantly different means between treatments (p < 0.05).
Disclaimer/Publisher’s Note: The statements, opinions and data contained in all publications are solely those of the individual author(s) and contributor(s) and not of MDPI and/or the editor(s). MDPI and/or the editor(s) disclaim responsibility for any injury to people or property resulting from any ideas, methods, instructions or products referred to in the content.