Abstract
This study evaluated the freshwater use of two mangrove species (R. mucronate: Rhizophora mucronata and A. marina: Avicennia marina) growing in a coastal area of Djibouti City and on Moucha Island in Djibouti. We accomplished this by comparing hydrogen and oxygen stable isotope ratios (δ2H and δ18O) in the body water with those of creek water, soil water, groundwater, and rainwater samples. Line-conditioned excess (lc-excess) was calculated for the δ2H and δ18O values of the groundwater and rainwater samples. Although two regression lines were drawn using the δ2H and δ18O values of the plant body water as well as the environmental water, no significant differences were found, suggesting that the effects of isotope fractionation due to evaporation in all the samples were almost similar. Comparison of lc-excess and δ18O suggested that the body water from the two mangrove species growing on Moucha Is. were strongly influenced by seawater, but contained some freshwater sources other than the seawater, the soil water, and the creek water. It was also found that Avicennia marina growing in the coastal area was strongly influenced by groundwater. The origin of the freshwater absorbed by the mangroves on the island was not clear, but it could be groundwater recharged in a faraway place.
1. Introduction
The pattern of water resources used by mangroves varies with the freshwater supply from rivers, because they grow in intertidal zones of tropical and subtropical regions. This diversity of water resources is also known as one of the determinants of mangrove community morphology [1,2,3]. The patterns of freshwater resource presence in complex brackish mangrove communities can be classified, to some extent, by mangrove community morphology based on hydrogeomorphic classes. There are four forms, called the fringe-type, the riverine-type, the basin-type, and the landlocked-type [4,5,6,7], and among them, the basin-type and the landlocked-type are thought to have extremely low freshwater supply from rivers. Despite this diversity of mangrove communities, little knowledge has been accumulated about the unique sources of mangrove water uptake in each community. Several previous studies have shown that mangroves may have different sources of water uptake depending on their community morphology [8,9,10]. For example, it was shown that in estuarine vegetation areas where freshwater from rainfall is abundant, mangroves mainly use river water, while in coastal vegetation areas where freshwater supply is low, mangrove preferentially use groundwater as their freshwater resource [10]. It has also been reported that not only do the water sources used by mangroves change depending on where they grow, but the proportion of freshwater resources they extract also varies with seasonal changes, such as from the dry to the rainy seasons [1]. In addition, access to groundwater may contribute to maintaining productivity and diversity in mangrove habitats [9].
Thus, the water resources available to mangroves show various patterns depending on location and seasons. If mangroves preferentially use groundwater in environments where the freshwater supply from rivers is low, mangrove can be expected to mainly use groundwater as their freshwater source in areas with low year-round precipitation and little freshwater supply from rivers. However, the specific freshwater resources used by mangroves growing in such environments are not yet known. Djibouti, our study site, is in a very arid area in which the annual rainfall is less than 150 mm and rivers are not normally formed. Even in such a natural environment, mangrove communities mainly consisting of two species (R. mucronate: Rhizophora mucronata and A. marina: Avicennia marina) have developed in the coastal area of the mainland of Djibouti and on Moucha Island in the Gulf of Tadjoura. The fringing-type of A. marina communities are found in the coastal areas, while the basin-type of R. mucronata communities and the fringe-type of A. marina communities are observed on Moucha Is. These communities are established in an environment with an extremely low freshwater supply, and while coastal areas may be supplied with wadis formed by short periods of intensive rainfall, there are no wadis or rivers on Moucha Island, and the main source of freshwater used by the mangroves is likely to be groundwater. Therefore, with respect to this hypothesis, this study aimed to scientifically obtain information on the origin of the water supplied to two mangrove species growing in the coastal areas of Djibouti City and Moucha Island. We measured the hydrogen and oxygen stable isotope ratios (δ2H and δ18O) of plant body water collected from the mangrove branches, soil water, creek water, groundwater, rainwater, and seawater in the study sites to estimate the origin of fresh water supplied to the mangrove species.
The water stable isotope ratio (i.e., hydrogen and oxygen stable isotope ratio of water) is commonly used as a very effective tool to trace the origin of freshwater uptake by plants, since after plants take up water through their roots, it is largely unaffected by isotopic enrichment due to isotope fractionation while in the conduit [11,12,13].
2. Materials and Methods
2.1. Site Description
The Republic of Djibouti (11°35′08.4″ N 43°08′36.0″ E) is located in the northeastern part of the African continent, the region known as the Horn of Africa, which is an extremely dry region, classified as semi-arid or hot desert according to the Köppen climate classification. The annual rainfall of this region is less than 150 mm, and the average annual air temperature is approximately 30 °C [14]. Due to these climatic characteristics, rivers are not normally formed, and the freshwater supplied by rarely short-term localized rainfall is likely to flow out through the ground surface into the sea before it is recharged as groundwater, forming wadis in this country. In this study, two mangrove communities in this country were selected as study sites. The first study site (Site A) was a mangrove community consisting of Avicennia marina in the estuary of the Ambouli wadi, one of the largest wadis in this country, in the western part of Djibouti City (11°34′49.0″ N, 43°06′10.4″ E). We chose one survey point in this community at which to collect plant samples (Figure 1). The second study site (Site B) was a mangrove community formed by Rhizophora mucronata along a creek in the eastern part of Moucha Is. This island is the largest in Djibouti, located in the gulf of Tadjoura (11°43′32.0″ N, 43°12′39.5″ E), with an area of 3.99 km2 and a maximum elevation of 13 m, and the surface geology mainly consists of limestone. Two species of mangrove, R. mucronata and A. marina, grow on this island, and the latter species occupies about 60% of the island mangrove community [15]. We collected plant, creek water, soil water, and seawater samples and put EC loggers into the creek water at this site (Figure 1).
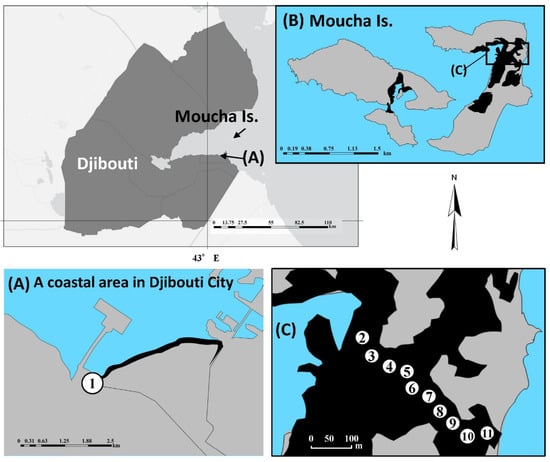
Figure 1.
Location of study sites in this study: (A) Site A: a coastal area in Djibouti City, (B) Moucha Island, and (C) an area along a creek on Moucha Island. Numbers in circles show survey points. Plant samples were collected from Points 1, 2, 5, 8, and 11; soil water samples from Points 3, 5, 7, and 9; and EC loggers were set at Points 4, 6, 8, and 10. The area in black shows the distribution of mangrove communities.
2.2. Sample Collection
2.2.1. Collection of Plant Sample
To extract plant body water samples, a part of the branch was collected from 4 individuals of A. marina in Feb 2020 at Site A. From 3 branches of an individual, a part of the branch, approximately 25 mm in length and 5 mm in diameter, was collected. In Feb 2021, at Site B, the branch samples of R. mucronata were collected from 4 points as shown in Figure 1. In addition, branch samples of A. marina were collected from Point 1. We selected three individuals and two branches from an individual, and a part of each branch was collected in the same manner above. Each branch sample was immediately put into a glass vial, closed with a cap, and sealed with Parafilm® (Bemis flexible packaging, IL, USA). All the samples were kept frozen until distillation.
2.2.2. Collection of Creek Water, Soil Water, Seawater, and Rainwater Samples
As shown in Figure 1, creek water samples were collected from 4 points in the creek of Site B. Soil water samples were collected, using a soil water sampling kit (Daiki Rika Kogyo Co., Ltd., Saitama, Japan) 100 cm in length, from 10 points in the mangrove community along the creek with a syringe, 24 h after each sampling kit was put into the ground. Seawater samples were also collected from 3 seashore points without mangrove vegetation. Rainwater samples were collected twice at our dormitory in Djibouti City (11°36′54.4″ N 43°08′53.7″ E) in July 2020 and July 2021. Each water sample was immediately placed in a glass vial, closed with a cap, sealed with Parafilm®, and refrigerated until analysis. The EC (electrical conductivity) and pH of the soil and seawater samples were directly measured using a portable instrument (MM-42DP; TOADKK, Tokyo, Japan) in the field. EC loggers (HOBO-U24; Onset, MA, USA) were placed at 4 points in the creek to continuously measure EC and water temperature of the creek water at 1 min intervals for 6 h, from the low morning tide to the high noon tide (12:15 to 16:22, 12 September in 2019).
2.3. Laboratory Experiment
2.3.1. Collection of Plant Body Water
We extracted the plant body water from the branch samples using the cryogenic vacuum distillation method [16,17]. The frozen branch samples were immersed in liquid nitrogen for about 1 h, pumped down to a pressure at 5 × 10⁻⁴ torr for 3 min using an oil vacuum pump (ULVAC), and then distilled for about 90 min with heating at 63 °C using a heat block (MiniT-C; Ningbo Hinotek Technology Co., Ltd., Ningbo, China).
2.3.2. Measurement of δ2H and δ18O
The δ2H and δ18O of all the water samples were measured using a stable isotope analyzer (Gas-bench IRMS; Thermo Fisher Scientific, MA, USA) at Tokyo University of Agriculture, Japan. The δ2H and δ18O values for each water sample were the mean of five measurements per sample, with respective measurement errors less than ±0.8‰ for δ2H and ±0.06‰ for δ18O. We also corrected the measurement values by the isotope ratio of three IAEA international standard materials (VSMOW, GRISP, and SLAP2), using formulas (1) and (2). At Site A, three repetitions were set up per individual and four repetitions per site, and at Site B, three repetitions were set up per individual and two repetitions per site. For the groundwater values, as the groundwater samples could not be collected from either Site A or B, we referenced the values measured in a previous study we conducted on deep groundwater in Djibouti [18].
2.4. Data Analysis
2.4.1. Regression and Covariance Analysis
Regression analysis was performed on the environmental water samples (rainwater, groundwater, soil water, creek water, and seawater) and the plant body water samples to evaluate the relationship between the values of δ2H and δ18O. All the samples were separated into two types in this study (i.e., the environmental water samples and the plant body water samples), and differences in regression lines between the types were evaluated by analysis of covariance (ANCOVA). Differences in the δ18O values of the environmental water and the plant body water samples were also evaluated by analysis of variance (ANOVA).
2.4.2. Line-Conditioned Excess
Line-conditioned excess (lc-excess) was used to separate the water samples for which stable isotope ratios were determined by the effects of evaporation under non-equilibrium or equilibrium conditions, i.e., those affected by dynamic fractionation and those that maintained the isotopic signature of regional precipitation [19]. We calculated lc-excess by formulas (3) and (4) [20].
where a and b are, respectively, the slope and the intercept of the regression line of the local meteoric water line (LMWL), using the δ2H and δ18O values of rainwater and groundwater in this region. S is the standard deviation of the measurement error of the values of both δ2H and δ18O. If the lc-excess value is less than 0‰, both isotope values of the sample are located below LMWL, suggesting that the water has undergone some evaporative isotope enrichment [21].
3. Results
3.1. δ2H and δ18O of Water Samples
Figure 2 shows the relationship between δ2H and δ18O of the environmental water samples and of the plant body water samples. Two regression lines in this figure were calculated using the δ2H and δ18O values, respectively, for the former and latter samples. The approximate equation of the regression line for the environmental water samples was δ2H = 5.48 × δ18O + 1.98‰, R2 = 0.96, p < 0.01, and for the plant body water samples, δ2H = 5.43 × δ18O + 0.12‰, R2 = 0.73, p < 0.01. We performed ANCOVA to estimate the differences of δ18O and δ2H between both samples and found no evidence of an interaction between the values of δ18O and the sample types (F1,47 = 0.0075, p = 0.9314).
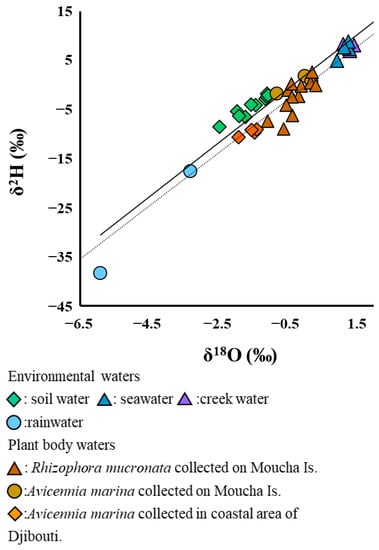
Figure 2.
Relationship between δ2H and δ18O of the environmental water samples and the plant body water samples. The strait and dotted lines show the regression lines for the former samples (Y = 5.48 × X + 1.98, R2 = 0.96, p < 0.01) and the latter samples (Y = 5.43 × X − 0.12, R2 = 0.73, p < 0.01), respectively. Rainwater samples were collected in Djibouti City, and the other environmental water samples were collected on Moucha Is., Djibouti.
The mean δ2H for body water samples of R. mucronata in Site B was −2.43 ± 3.54‰, with a maximum of 2.65 ± 1.69‰ and a minimum of −8.96 ± 0.14‰, while the mean δ18O was −0.28 ± 0.40‰, with a maximum of 0.32 ± 0.07‰ and a minimum of −1.08 ± 0.22‰ (n = 12). These values were plotted in the middle area between the creek water samples and the groundwater samples, and about the half were plotted below the regression line of the environmental water samples. The mean δ2H for body water samples of A. marina growing in the same site was 0.28 ± 1.83‰, with a maximum of −1.80 ± 0.96‰ and a minimum of −1.74 ± 0.62‰, while the mean δ18O was −0.21 ± 0.53‰, with a maximum of 0.20 ± 0.05‰ and a minimum of −0.86 ± 0.05‰. Almost all of the values were plotted just on the regression line for the environmental water samples (n = 3). On the other hand, for the plant body water samples of A. marina growing in Site A, the mean δ2H was −8.60 ± 3.13‰, with a maximum of −7.99 ± 0.90‰ and a minimum of −9.56 ± 1.70‰, while the mean δ18O was −1.57 ± 0.40‰, with a maximum of −1.39 ± 0.06‰ and a minimum of −1.92 ± 0.04‰ (n = 4).
3.2. Differences in δ18O between Environmental Water and Plant Body Water
The results of ANOVA regarding differences in the δ18O of the body water samples of R. mucronata growing in Site B (n = 12) showed that among the survey points, there were no significant differences (p < 0.05). As shown in Figure 3, we compared the δ18O values of the groundwater, the soil water, the creek water, and the seawater samples with the plant body water samples. We found no significant differences among the seawater samples, the soil water, and the creek water samples (p < 0.01); between the body water samples of R. mucronata and A. marina growing in site B; or between the samples of the groundwater and A. marina growing in site A. On the other hand, significant differences were found (p < 0.01) between the body water samples of two mangrove species growing in Site B and between the soil water, the creek water, and the seawater samples.
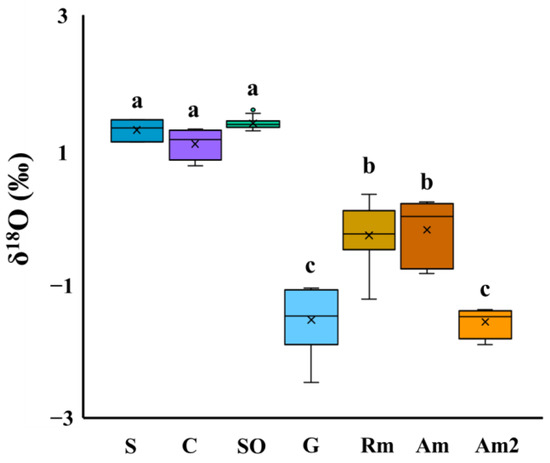
Figure 3.
Comparison on δ18O in the body water of mangroves with the environmental water in Djibouti (p < 0.01). Environmental water types: S: seawater, C: creek water, SO: soil water, G: groundwater. Plant body water types: RM: Rhizophora mucronata, collected on Moucha Is.; AM: Avicennia marina, collected on Moucha Is.; AM2: Avicennia marina, collected in the coastal area of Djibouti. The alphabet in this figure (a, b, c) shows significant differences between each of samples (p < 0.01).
3.3. Line-Conditioned Excess
We calculated the regression line as a local meteoric water line (LMWL) using the δ2H values against the δ18O values of the rainwater and the groundwater samples, and we found that the slope and the intercept were 7.39 and 6.91‰, respectively. Then, we calculated lc-excess using these values of slope and intercept (Table 1). The most negative value was found in the seawater samples (−13.65 ± 2.50‰; n = 4), and the largest standard deviation was found in the plant body water samples of A. marina growing in Site B. (−9.74 ± 5.24‰; n = 3). There were no significant differences between the seawater samples and the creek water or soil water samples collected at Site B, but there were significant differences between these water samples and the rainwater and the groundwater samples (p < 0.01). Although there were no significant differences between the plant body water samples of R. mucronata growing in Site B and the creek water, soil water, and seawater samples, a significant difference was found between the soil water samples and the plant body water samples of A. marina growing in Site B (p < 0.01).

Table 1.
The mean ± standard deviation value of δ2H, δ18O and line-conditioned excess (lc-excess) in environmental water and plant body water (units: ‰).
3.4. EC and pH of Soil Water, Creek Water, or Seawater on Moucha Is.
Table 2 shows the EC and pH of the soil water, the creek water, and the seawater samples measured in Site B. The mean EC of the soil water was 56.3 ± 1.0 dSm−1 (n = 10), the creek water was 58.6 ± 0.2 dSm−1 (n = 4), and the seawater was 56.8 ± 0.3 dSm−1 (n = 3). As indicated in Figure 4, the results of comparison between the EC values showed no significant differences (p < 0.05). The mean pH of the soil water was 7.59 ± 0.12 (n = 10), that of the creek water was 7.89 ± 0.25 (n = 4), and that of the seawater was 8.20 ± 0.02 (n = 3).
Table 2.
The mean ± standard deviation value of EC and pH in soil water, creek water and seawater on Moucha Island, Djibouti.
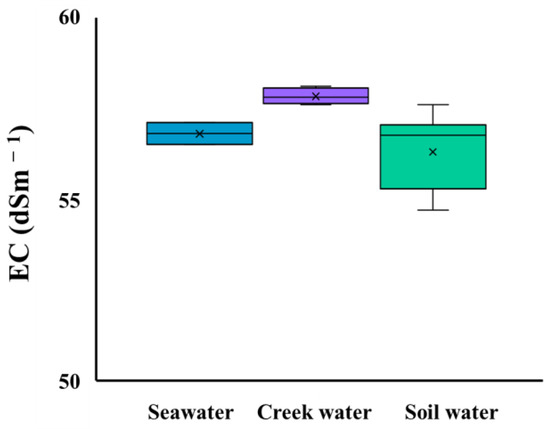
Figure 4.
Comparison of EC of seawater, creek water, and soil water in Site B on Moucha Island, Djibouti (p < 0.05).
3.5. Changes in EC and Water Temperature in Creek Water on Moucha Is.
Table 3 shows the values of EC, water temperature, and pH at the beginning and the end of data collection, and Figure 5 shows changes in the values of EC and water temperature from a low tide to a high tide at each survey point. At the beginning, the values of EC were similar to those of seawater at all the points, but we found a downward trend in EC at three survey points. At Point 4, the value of EC decreased immediately from 57.6 to 53.4 dSm−1, and then gradually decreased until the end of data collection, although the water temperature showed a general upward trend with the initial decline. At this point, we also found a rapid decline in EC to 52.3 dSm−1 as well as a decline in the water temperature to around 29.5 °C in the afternoon. At Point 6, the value of EC decreased gradually, and the water temperature was almost stable, but we found a rapid decline in temperature of about 2 °C, as well as in EC, around half past 15 o’clock. At Point 10, the value of EC initially decreased from 57.9 to 53.2 dSm−1 immediately, and then slowly decreased with the water temperature until the end of data collection. On the other hand, at Point 8, both values were almost stable from the beginning to the end.
Table 3.
The beginning and the end values of EC, water temperature and pH measured in a creek water on Moucha Island, Djibouti (12 September 2019).
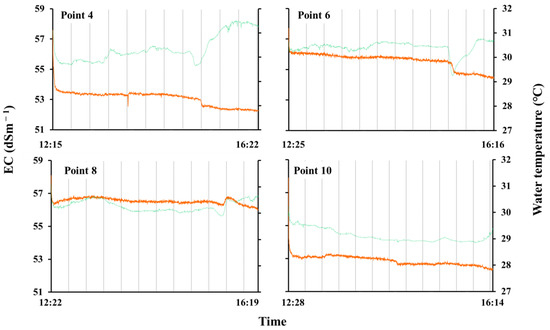
Figure 5.
Changes in EC and water temperature at 4 points of a creek water flowing in a Rhizophora mucronata community on Moucha Island, Djibouti (12 September 2019). The orange lines show EC and the green lines show water temperature.
4. Discussions
4.1. Isotopic Signature of Plant Body Water and Environmental Waters
In general, the slope of the regression line in the relationship between the δ2H and δ18O of water shows different values depending on the degree of the evaporation effect of the water sample, which is useful for estimating the origin of the water resources in the water samples [9]. As shown in Figure 2, the results of the regression analysis and ANCOVA using the δ2H and δ18O values indicated that there were no significant differences in the slopes of the regression lines for the plant body water samples or the environmental water samples (groundwater and rainwater). These results suggest that the resources of the body water in mangroves, as well as the environmental water, were similar in isotopic composition, and that the effects of evaporation on isotopic fractionation were likely to be similar [22] in this study. Therefore, it is possible that the body water in the two mangrove species may contain freshwater resources originating from rainwater in Djibouti.
4.2. Origin of Plant Body Water in Mangroves Growing on Moucha Is.
As shown in Figure 3 and Figure 4, our results regarding the comparison of δ18O and EC among the environmental water samples found no significant differences between the soil water, the seawater, and the creek water samples collected on Moucha Is. These results suggest that the soil water and the creek water collected from this island were strongly affected by seawater mixing. On the other hand, the values of δ18O in the body water samples of the two mangrove species collected from Moucha Is. were significantly low compared with the soil water, the creek water, the seawater samples collected on this island. It is generally known that the δ2H and δ18O values of water are reduced by latitude effects, altitude effects, and continental effects [23,24]. All the survey points in this study were located around 3 m elevation, and their distance from the coast was less than 0.2 km; thus, all of the effects described above were considered very small or almost negligible. Therefore, the differences in δ18O values among the samples suggests that the body water of mangroves on this island may contain freshwater other than soil water, creek water, or seawater [25,26,27]. It has been reported that if mangroves grow in saline conditions with higher than optimal salinity for their growth, they depend on the periodic freshwater supplies brought by rainfall [2,28]. In coastal areas of Australia, it has also been reported that A. marina growing in the fringe-type uses a mixture of fresh and salt water [1]. These reports support our results. In this study, no significant difference was found between the δ18O values in the body water of two mangrove species growing on Moucha Island, even though it was shown that several mangrove species growing in the same area had different δ18O values in their body waters in previous studies. Previous studies reported these variations may be attributed to differences in the water resources used by the mangroves [9]. Mangroves differ in salt tolerance among species, and A. marina is more salt-tolerant than R. mucronata, adjusting its internal salt concentrations by foliar salt secretion [29]. On the other hand, it has been reported that the growth of A. marina is dependent on access to fresh water, such as rainwater and groundwater [9]. Based on these considerations, it is possible that R. mucronata growing on this island have adapted to a low-rainfall and high-salinity environment and use a mixture of fresh and salt water, like A. marina. However, considering the extremely low annual precipitation in this area and the fact that Moucha Island does not have the potential to form a groundwater storage system such as a freshwater lens, it is possible that the freshwater contained in the body water of the mangroves is either submarine spring water that exists on the island or rainfall that occurs during a short-term intensive period. This will be clarified by measuring and comparing the δ2H and δ18O of freshwater resources collected from rainwater and other sources on Moucha Island.
4.3. Line-Conditioned Excess
Line-conditioned excess (lc-excess) is usually used as an indicator to determine whether a water sample is affected by dynamic fractionation or maintains the isotopic signature of regional precipitation [19,21,30,31]. As shown in Table 1, the values of lc-excess for the body water in R. mucronata, the soil water, and the creek water samples collected from Moucha Is. were significant negative, as they were for seawater. On the other hand, the values of lc-excess in the rainwater and the groundwater samples showed positive values in most samples. These results suggest that the body water in R. mucronata, soil water, and creek water samples on Moucha Is. may contain seawater strongly influenced by evaporation under non-equilibrium conditions. However, although there were significant differences between the values of lc-excess in the soil water and the creek water samples, we found no significant difference between those values in the body water of A. marina growing in the same site and the creek water or seawater samples. These results suggest that the ratios of water resources in the plant body waters of the two mangrove species growing on Moucha Is. may possibly be different. However, the variations in the water samples collected in this study were insufficient to estimate the contribution rate of the water resources to the body water of mangroves growing on Moucha Island. If a different water resource, other than the environmental water samples collected in this study, could be collected in the next survey, it would be possible to estimate the contribution rate.
4.4. Creek and Soil Water on Moucha Is.
As shown in Figure 5, we found a decline in EC and water temperature at three survey points in the creek flowing through the R. mucronata community on Moucha Is. These results suggested the possibility of the existence of some freshwater resources on this island. However, although precipitation on Moucha Island has not been measured, it is assumed to be extremely low, as is the case inland in Djibouti, and the shape of the island is not suitable for the formation of a subterranean freshwater lens. Therefore, some source of freshwater supply, such as a submarine spring, is assumed to exist on the island. The EC of soil water on Moucha Island showed no significant differences between the study points, and was similar to the EC of seawater. This result indicates that mangroves are normally exposed to the effects of seawater intrusion at all study points. Under such conditions, the water uptake capacity of mangrove roots may be limited by high salinity, and in areas with little groundwater recharge from precipitation and high evaporation rates, salinity concentrated in pore water may contribute to increased plant mortality rates [32,33]. On the other hand, it was reported that access to freshwater, such as freshwater lenses or groundwater, reduces their mortality [10,33]. Based on these considerations, the existence of a mangrove community of its size despite the high salinity environment on Moucha Island suggests that there may be some source of freshwater supply on the island, such as a submarine spring.
4.5. Origin of Plant Body Water in A. Marina Growing in Coastal Area
As shown in Figure 3, the δ18O values of the body water samples of A. marina growing in the coastal area of Djibouti City were not significantly different from those of the groundwater samples, and were significantly lower than those of the seawater samples. In addition, the δ18O values of the body water samples of A. marina growing in the coastal area of Djibouti City was significantly lower than those of the mangroves growing on Moucha Island. These results indicate that the coastal area may be richer than Moucha island in groundwater as freshwater sources used by A. marina. Our results were supported by a previous study in which the freshwater use of A. marina growing in areas with a high freshwater supply was higher than that of mangroves growing in saline marine environments [2]. On the other hand, it is possible that the freshwater supply in the coastal aera is provided by floods driven by short-term intensive rainfall. This freshwater supply contributes to soil salinity reduction in the coastal area and may contribute to maintaining the water uptake capacity of mangrove roots. However, creek water and soil water samples were not collected in this study, so we need to collect and measure water stable isotopes of these water samples to accumulate more scientific information about the freshwater sources of mangroves growing in this area.
5. Conclusions
According to the results of this study, body waters of two mangrove species, R. mucronata and A. marina, growing in Djibouti have different characteristics depending on their growing environment. While the plant body waters of the two mangrove species growing on Moucha Is. were strongly influenced by seawater, it was suggested that they may be accessing some freshwater sources, but we could not define the presence of freshwater on the island. Thus, we need to research potential sources of freshwater, including submarine springs, to find the freshwater source for the mangroves growing on this island. In the coastal area of Djibouti City, it was suggested that A. marina may use groundwater as a freshwater source. Considering that the annual precipitation of this region is less than 150 mm, and that the rare freshwater supplied by short-term localized rainfall flows out through the ground surface into the sea before it is recharged as groundwater, it is unlikely that groundwater which the mangroves uptake is recharged in the coastal area; Thus it is likely that mangrove is using groundwater recharged in other areas. On the other hand, as it was reported in a recent study that A. marina has a high foliar water uptake capacity [34,35], we will also need to consider this possibility. The results of this study provide several important insights into the freshwater use of mangroves growing in extremely arid regions. If more scientific findings are accumulated in the future and water use strategies of man-grove in regions with extremely low freshwater resources are clarified, it will provide important clues as to how mangrove respond to the accelerating global sea-level rise effects on coastal ecosystems.
Author Contributions
Conceptualization, Y.N. and Y.A.; methodology, Y.A.; software, Y.A.; validation, Y.A.; formal analysis, Y.A.; investigation, Y.A., K.H. and Y.N; resources, Y.A.; data curation, Y.A.; writing—original draft preparation, Y.A.; writing—review and editing, K.H. and Y.N.; visualization, Y.A.; supervision, Y.N.; project administration, Y.N.; funding acquisition, Y.N. All authors have read and agreed to the published version of the manuscript.
Funding
This study was supported by Japan Science and Technology Agency (JST) and Japan International Cooperation Agency (JICA) under the project of Science and Technology Research Partnership for Sustainable Development (SATREPS GRANT NUMBER: JPMJSA1802).
Institutional Review Board Statement
Branch samples of Avicennia marina and Rhizophora mucronata were used in this study. These branch samples were collected complying with guidelines of the Convention on Biological Diversity at 11.726332, 43.209124, 11.726201, 43.210565, 11.725452, 43.210946, 11.724415, 43.212093, 11.724484, 43.212403, 11.580279, 43.102883 (World Geodetic System; WGS84), FEB/10~12/2021.
Data Availability Statement
The data presented in this study are available upon request from the corresponding author. Due to privacy concerns, the data are not publicly available.
Conflicts of Interest
The authors declare no conflict of interest.
References
- Wei, L.; Lockington, D.A.; Poh, S.; Gasparon, M.; Lovelock, C.E. Water use patterns of estuarine vegetationin a tidal creek system. Oecologia 2012, 172, 485–494. [Google Scholar] [CrossRef]
- Santini, N.S.; Reef, R.; Lockington, D.A.; Lovelock, C.E. The use of fresh and saline water sources by the mangrove. Hydrobiogia 2015, 745, 59–68. [Google Scholar] [CrossRef]
- Sternberg, L.; Swart, P.K. Utilization of freshwater and ocean water by coastal plants of Southern Florida. Ecology 1987, 68, 1898–1905. [Google Scholar] [CrossRef] [PubMed]
- Lugo, A.E.; Snedaker, S.C. The ecology of mangroves. Annu. Rev. Ecol. Syst. 1974, 5, 39–64. [Google Scholar] [CrossRef]
- Cintron, G.; Lugo, A.E.; Pool, D.J.; Moris, G. Mangrove of arid environments in Puerto Rico and adjacent islands. Biotropica 1978, 10, 110–121. [Google Scholar] [CrossRef]
- Lugo, A.E. Mangrove ecosystems: Successional or steady state? Biotropica 1980, 12, 65–72. [Google Scholar] [CrossRef]
- Mitsch, W.J.; Gosselink, J.G. Wetland Ecosystems. In Wetlands; Mitsch, W.J., Gosselink, J.G., Eds.; John Wiley & Sons, Inc.: Hoboken, NJ, USA, 2015; pp. 259–413. [Google Scholar]
- Lin, G.; Sternberg, L. Effect of growth form, salinity, nutrient and sulfide on photosynthesis, carbon isotope discrimination and growth of red mangrove (Rhizophora mangle L.). Aust. J. Plant Physiol. 1992, 19, 509–517. [Google Scholar] [CrossRef]
- Lovelock, C.E.; Reef, R.; Ball, M.C. Isotopic signatures of stem water reveal differences in water sources accessed by mangrove tree species. Hydrobiogia 2017, 803, 133–145. [Google Scholar] [CrossRef]
- Ewe, S.; Sternberg, S.; Childers, D. Seasonal plant water uptake patterns in the saline southeast Everglades ecotone. Oecologia 2007, 152, 607–616. [Google Scholar] [CrossRef]
- Dawson, T.E.; Ehleringer, J.R. Isotopic enrichment of water in the “woody” tissues of plants: Implications for plant water sources, water uptake, and other studies which use stable isotopic composition of cellulose. Geochim. Cosmochim. Acta 1993, 57, 3487–3492. [Google Scholar] [CrossRef]
- Lin, G.; da Sternberg, L.S.L. Hydrogen isotopic fractionation by plant roots during water uptake in coastal wetland plants. In Stable Isotopes and Plant Carbon-Water Relations; Ehleringer, J.R., Hall, A.E., Farquhar, G.D., Eds.; Academic Press Inc.: New York, NY, USA, 1993; pp. 497–510. [Google Scholar]
- Ellsworth, P.Z.; Williams, D.G. Hydrogen isotope fractionation during water uptake by woody xerophytes. Plant Soil 2007, 291, 93–107. [Google Scholar] [CrossRef]
- Assowe, O.D.; Ibrahim, A.A.; Ahmed, M.M.; Osman, M.A.; Mohamed, M.W.; Camberlin, P.; Pohl, B.; Mohamed, J. Evolution and trends of meteorological drought and wet events over the Republic of Djibouti from 1961 to 2021. Climate 2022, 10, 148. [Google Scholar]
- PERSGA. The Regional Organization for the Conservation of the Environment of the Red Sea and Gulf of Aden. In Survey of Habitats in Djibouti and Plans for Their Protection: Technical Series No.5; PERSGA: Jeddah, Saudi Arabia, 2003; pp. 17–20. [Google Scholar]
- West, A.G.; Patrickson, S.J.; Ehleringer, J.R. Water extraction times for plant and soil materials used in stable isotope analysis. Rapid Commun. Mass Spectrom. 2006, 20, 1317–1321. [Google Scholar] [CrossRef]
- Koeniger, P.; Marshall, J.D.; Link, T.; Mulch, A. An inexpensive, fast, and reliable method for vacuum extraction of soil and plant water for stable isotope analyses by mass spectrometry . Rapid. Commun. Mass Spectrom. 2011, 25, 3041–3048. [Google Scholar]
- Asakura, Y.; Ofleh, B.H.; Nakanishi, Y. Values of δ D and δ18O and concentrations of 3H and 14C of deep groundwater in Djibouti. In Proceedings of the DT XIV, International Conference on Arid Land Tokyo, Tokyo, Japan, 7–10 September 2021; The Japanese Association for Arid Land Studies: Tokyo, Japan in press. [Google Scholar]
- Dansgaard, W. Stable isotopes in precipitation. Tellus 1964, 16, 436–468. [Google Scholar] [CrossRef]
- Landwehr, J.; Coplen, T. Line-conditioned excess: A new method for characterizing stable hydrogen and oxygen isotope ratios in hydrologics systems. In Isotopes in Environmental Studies Aquatic Forum 2004; IAEA, Ed.; International Atomic Energy Agency: Vienna, Austria, 2006; pp. 132–135. [Google Scholar]
- Evaristo, J.; McDonnell, J.J.; Scholl, M.A.; Bruijnzeel, L.A.; Chun, K.P. Insights into plant water uptake from xylem-water isotope measurements in two tropical catchments with contrasting moisture conditions. Hydrol. Process. 2016, 30, 3210–3227. [Google Scholar] [CrossRef]
- Craig, H. Isotopic variations in meteoric waters. Science 1961, 133, 1702–1703. [Google Scholar] [CrossRef]
- Gat, J.R. Properties of the isotopic species of water: The ‘Isotope Effect’. In Stable Isotope Hydrology-Deuterium and Oxygen-18 in the Water Cycle; Gat, J.R., Gonfiantin, R., Eds.; International Atomic Energy Agency: Vienna, Austria, 1981; pp. 7–20. [Google Scholar]
- Rozanski, K.; Araguas-Araguas, L.; Gonfiantini, R. Isotopic patterns in modern global precipitation. In Climate Change in Continental Isotopic Records; Swart, P.K., Lohmann, K.C., McKenzie, J., Savin, S., Eds.; American Geophysical Union: Washington, DC, USA, 1993; Volume 78, pp. 1–36. [Google Scholar]
- Ehileringer, J.R.; Dawson, T.E. Water uptake by plants: Perspectives from stable isotope composition. Plant Cell Environ. 1992, 15, 1073–1082. [Google Scholar] [CrossRef]
- Schwinning, S.; Davis, K.; Richardson, L.; Ehleringer, J.R. Deuterium enriched irrigation indicates different forms of rain use in shrub/grass species of the Colorado Plateau. Oecologia 2001, 130, 345–355. [Google Scholar] [CrossRef] [PubMed]
- Gat, J.R.; Yasir, D.; Goodfriend, G.; Fritz, P.; Trimborn, P.; Lipp, J.; Gev, I.; Adar, E.; Waisel, Y. Stable isotope composition of water in desert plants. Plant Soil 2007, 298, 31–45. [Google Scholar] [CrossRef]
- Lambs, L.; Muller, E.; Fromard, F. Mangrove trees growing in a very saline condition but not using seawater. Rapid Commun. Mass Spectrom. 2008, 22, 2835–2843. [Google Scholar] [CrossRef]
- Coopman, R.E.; Nguyen, H.T.; Mencuccini, M.; Oliveira, R.S.; Sack, L.; Lovelock, C.E.; Ball, M.C. Harvesting water from unsaturated atmospheres: Deliquescence of salt secreted onto leaf surfaces drives reverse sap flow in a dominant arid climate mangrove, Avicennia marina. New Phytol. 2021, 231, 1401–1414. [Google Scholar] [CrossRef]
- Zhao, L.; Wang, L.; Liu, X.; Xiao, H.; Ruan, Y.; Zhou, M. The patterns and implications of diurnal variations in the d-excess of plant water, shallow soil water and air moisture. Hydro. Earth Syst. 2014, 18, 4129–4151. [Google Scholar] [CrossRef]
- Tetzlaff, D.; Buttle, J.; Carey, S.K.; Kohn, M.J.; Laudon, H.; McNamara, J.P.; Smith, A.; Sprenger, M.; Soulsby, C. Stable isotopes of water reveal differences in plant—Soil water relationships across northern environments. Hydrol. Process. 2020, 35, e14023. [Google Scholar] [CrossRef]
- Desantis, L.R.; Bhotika, S.; Williams, K.; Putz, F.E. Sea-Level Rise and Drought Interactions Accelerate Forest Decline on the Gulf Coast of Florida, USA. Glob. Chang. Biol. 2007, 13, 2349–2360. [Google Scholar] [CrossRef]
- McDowell, N.G.; Ball, M.; Bond-Lamberty, B.; Kirwan, M.L.; Krauss, K.W.; Megonigal, J.P.; Mencuccini, M.; Ward, N.D.; Weintraub, M.N.; Bailey, V. Processes and Mechanisms of Coastal Woody-Plant Mortality. Glob. Chang. Biol. 2022, 28, 5881–5900. [Google Scholar] [CrossRef]
- dos Garcia, J.S.; Boanares, D.; Franca, M.G.C.; Sershen; Portillo, J.L. Foliar water uptake in eight mangrove species: Implications of morpho-anatomical traits. Flora 2022, 293, 152100. [Google Scholar] [CrossRef]
- Schaepdryver, K.H.D.; Goossens, W.; Naseef, A.; Ashtamoorthy, S.K.; Steppe, K. Foliar Water Uptake Capacity in Six Mangrove Species. Forests 2022, 13, 951. [Google Scholar] [CrossRef]
Disclaimer/Publisher’s Note: The statements, opinions and data contained in all publications are solely those of the individual author(s) and contributor(s) and not of MDPI and/or the editor(s). MDPI and/or the editor(s) disclaim responsibility for any injury to people or property resulting from any ideas, methods, instructions or products referred to in the content. |
© 2023 by the authors. Licensee MDPI, Basel, Switzerland. This article is an open access article distributed under the terms and conditions of the Creative Commons Attribution (CC BY) license (https://creativecommons.org/licenses/by/4.0/).