Article

Inconsistent Growth Responses of Alpine Rhododendron Shrubs to Climate Change at Two Sites on the Eastern Tibetan Plateau

1
College of Biology and the Environment, Nanjing Forestry University, Nanjing 210037, China
2
Instituto Pirenaico de Ecología (IPE-CSIC), 50059 Zaragoza, Spain
*
Author to whom correspondence should be addressed.
Forests 2023, 14(2), 331; https://doi.org/10.3390/f14020331
Submission received: 14 December 2022 / Revised: 2 February 2023 / Accepted: 3 February 2023 / Published: 7 February 2023
(This article belongs to the Section Forest Ecology and Management)

Abstract

:
Evidence is accumulating that the radial growth of high-elevation Rhododendron shrubs has high dendrochronological potential. However, it remains unclear if the growth responses of alpine Rhododendron shrubs to climate are contingent on site conditions. Herein, the climate–growth relationships of alpine Rhododendron przewalskii Maxim. shrubs were investigated at two sites (NQ, LWQ) at an elevation of 4300 m on the eastern Tibetan Plateau. We collected ring-width data from 53 Rhododendron shrubs. Well-replicated 111-year-old and 51-year-old long shrub ring-width chronologies were built for NQ and LWQ, respectively. Mean shrub growth did not differ between the two study sites. Mean maximum temperature in September of the previous year was significantly negatively correlated with shrub ring-width indices in site NQ, whereas the August minimum temperature of the current year showed a strong negative association with shrub growth indices in site LWQ. Random effects with the shrub level condition exerted a certain influence on shrub radial growth. Results of previous studies in other forest regions across the Tibetan Plateau, along with this study, revealed the diverse responses of radial growth of alpine Rhododendron shrubs to climate change. Thus, both climatic and local-scale variables should be considered when conducting shrub-based dendrochronological studies. A warmer and drier climate in the future could further reduce Rhododendron shrub growth in particular sites and threaten the survival of alpine shrub ecosystems on the eastern Tibetan Plateau.

1. Introduction

Shrublands cover ca. 13% of the Earth’s land surface area and constitute the dominant vegetation in many treeless areas with harsh environmental conditions, including alpine regions [1]. For instance, nearly 25% of terrestrial ecosystems consist of shrublands in China [2]. It is widely recognized that shrublands provide several key ecosystem services, including carbon uptake, reduction of soil erosion, provision of timber production, and biodiversity maintenance. As a foundation species in alpine ecosystems [3], shrubs play a significant role in the regulation of water cycles and the conservation of soil fertility [4,5]. Since the multiple services provided by alpine shrubs are closely associated with their productivity and growth dynamics [6], it is necessary to assess how their radial growth patterns respond to climate change.
Shrubs in alpine and arctic regions have great dendrochronological potential because their well-defined annual growth rings are sensitive to climate warming [7]. Evergreen alpine shrubs such as Rhododendron species can reach ages of more than 100 years [8,9,10]; thus, they have been frequently used to explore long-term climate–growth relationships [11,12,13,14,15,16]. For instance, a previous study found that higher minimum winter temperatures have exerted a positive effect on the radial growth of Rhododendron campanulatum since 1787 in the central Himalayas [14]. By contrast, high minimum winter temperatures have had a negative effect on alpine Rhododendron shrub growth since 1800 in the Baima Snow Mountains of southwest China [15]. Nevertheless, the growth of alpine Rhododendron ferrugineum L. in the northern Alps has mainly been governed by growing season temperature [11]. It was found that the growth-limiting factor of alpine Rhododendron ferrugineum shrub in the Alps shifted from the sum of snow-free growing degree days between 1960 and 1988 to the combination of August temperature and drought between 1989 and 2016 [16]. In addition, alpine shrub responses to climate change might be mediated by local-scale variables (e.g., site condition) [17,18]. Given these different and often conflicting results, we argue that thermal and non-thermal climate factors (e.g., drought, site condition) should be carefully considered when performing dendrochronological studies on alpine shrubs.
The Tibetan Plateau (TP), as one of the three core distribution areas of the modern Rhododendron species in the Sino-Himalaya flora region, provides an ideal place to study the growth dynamics of alpine Rhododendron shrubs under climate change [19,20]. Several studies have revealed the limiting factors for the radial growth of Rhododendron shrubs on the TP. For instance, July mean temperatures positively drove the growth of high-elevation Rhododendron aganniphum var. schizopeplum in the Sygera Mountains on the southeastern TP [12]. It was also reported that high temperatures in the previous winter and current July promoted the growth of alpine Rhododendron nivale near the Zuochupu glacier in southeastern TP [13]. By contrast, the growth of Rhododendron przewalskii in the Zhegu Mountains of the eastern margin of the TP was negatively affected by the late winter mean temperature [21]. However, it remains unclear how alpine Rhododendron shrubs in the eastern TP respond to climate variables in different sites.
This study aims to: (1) explore the growth–climate relationships of alpine Rhododendron shrubs at two sites; (2) compare the difference of Rhododendron shrub growth patterns between the two study sites; (3) evaluate the potential effect of ongoing climate warming on Rhododendron shrub growth. Given the differences in climatic conditions and inhomogeneous environments at the two sites [22,23], we hypothesize that the growth-limiting factor for alpine Rhododendron shrubs would differ between different sites.

2. Materials and Methods

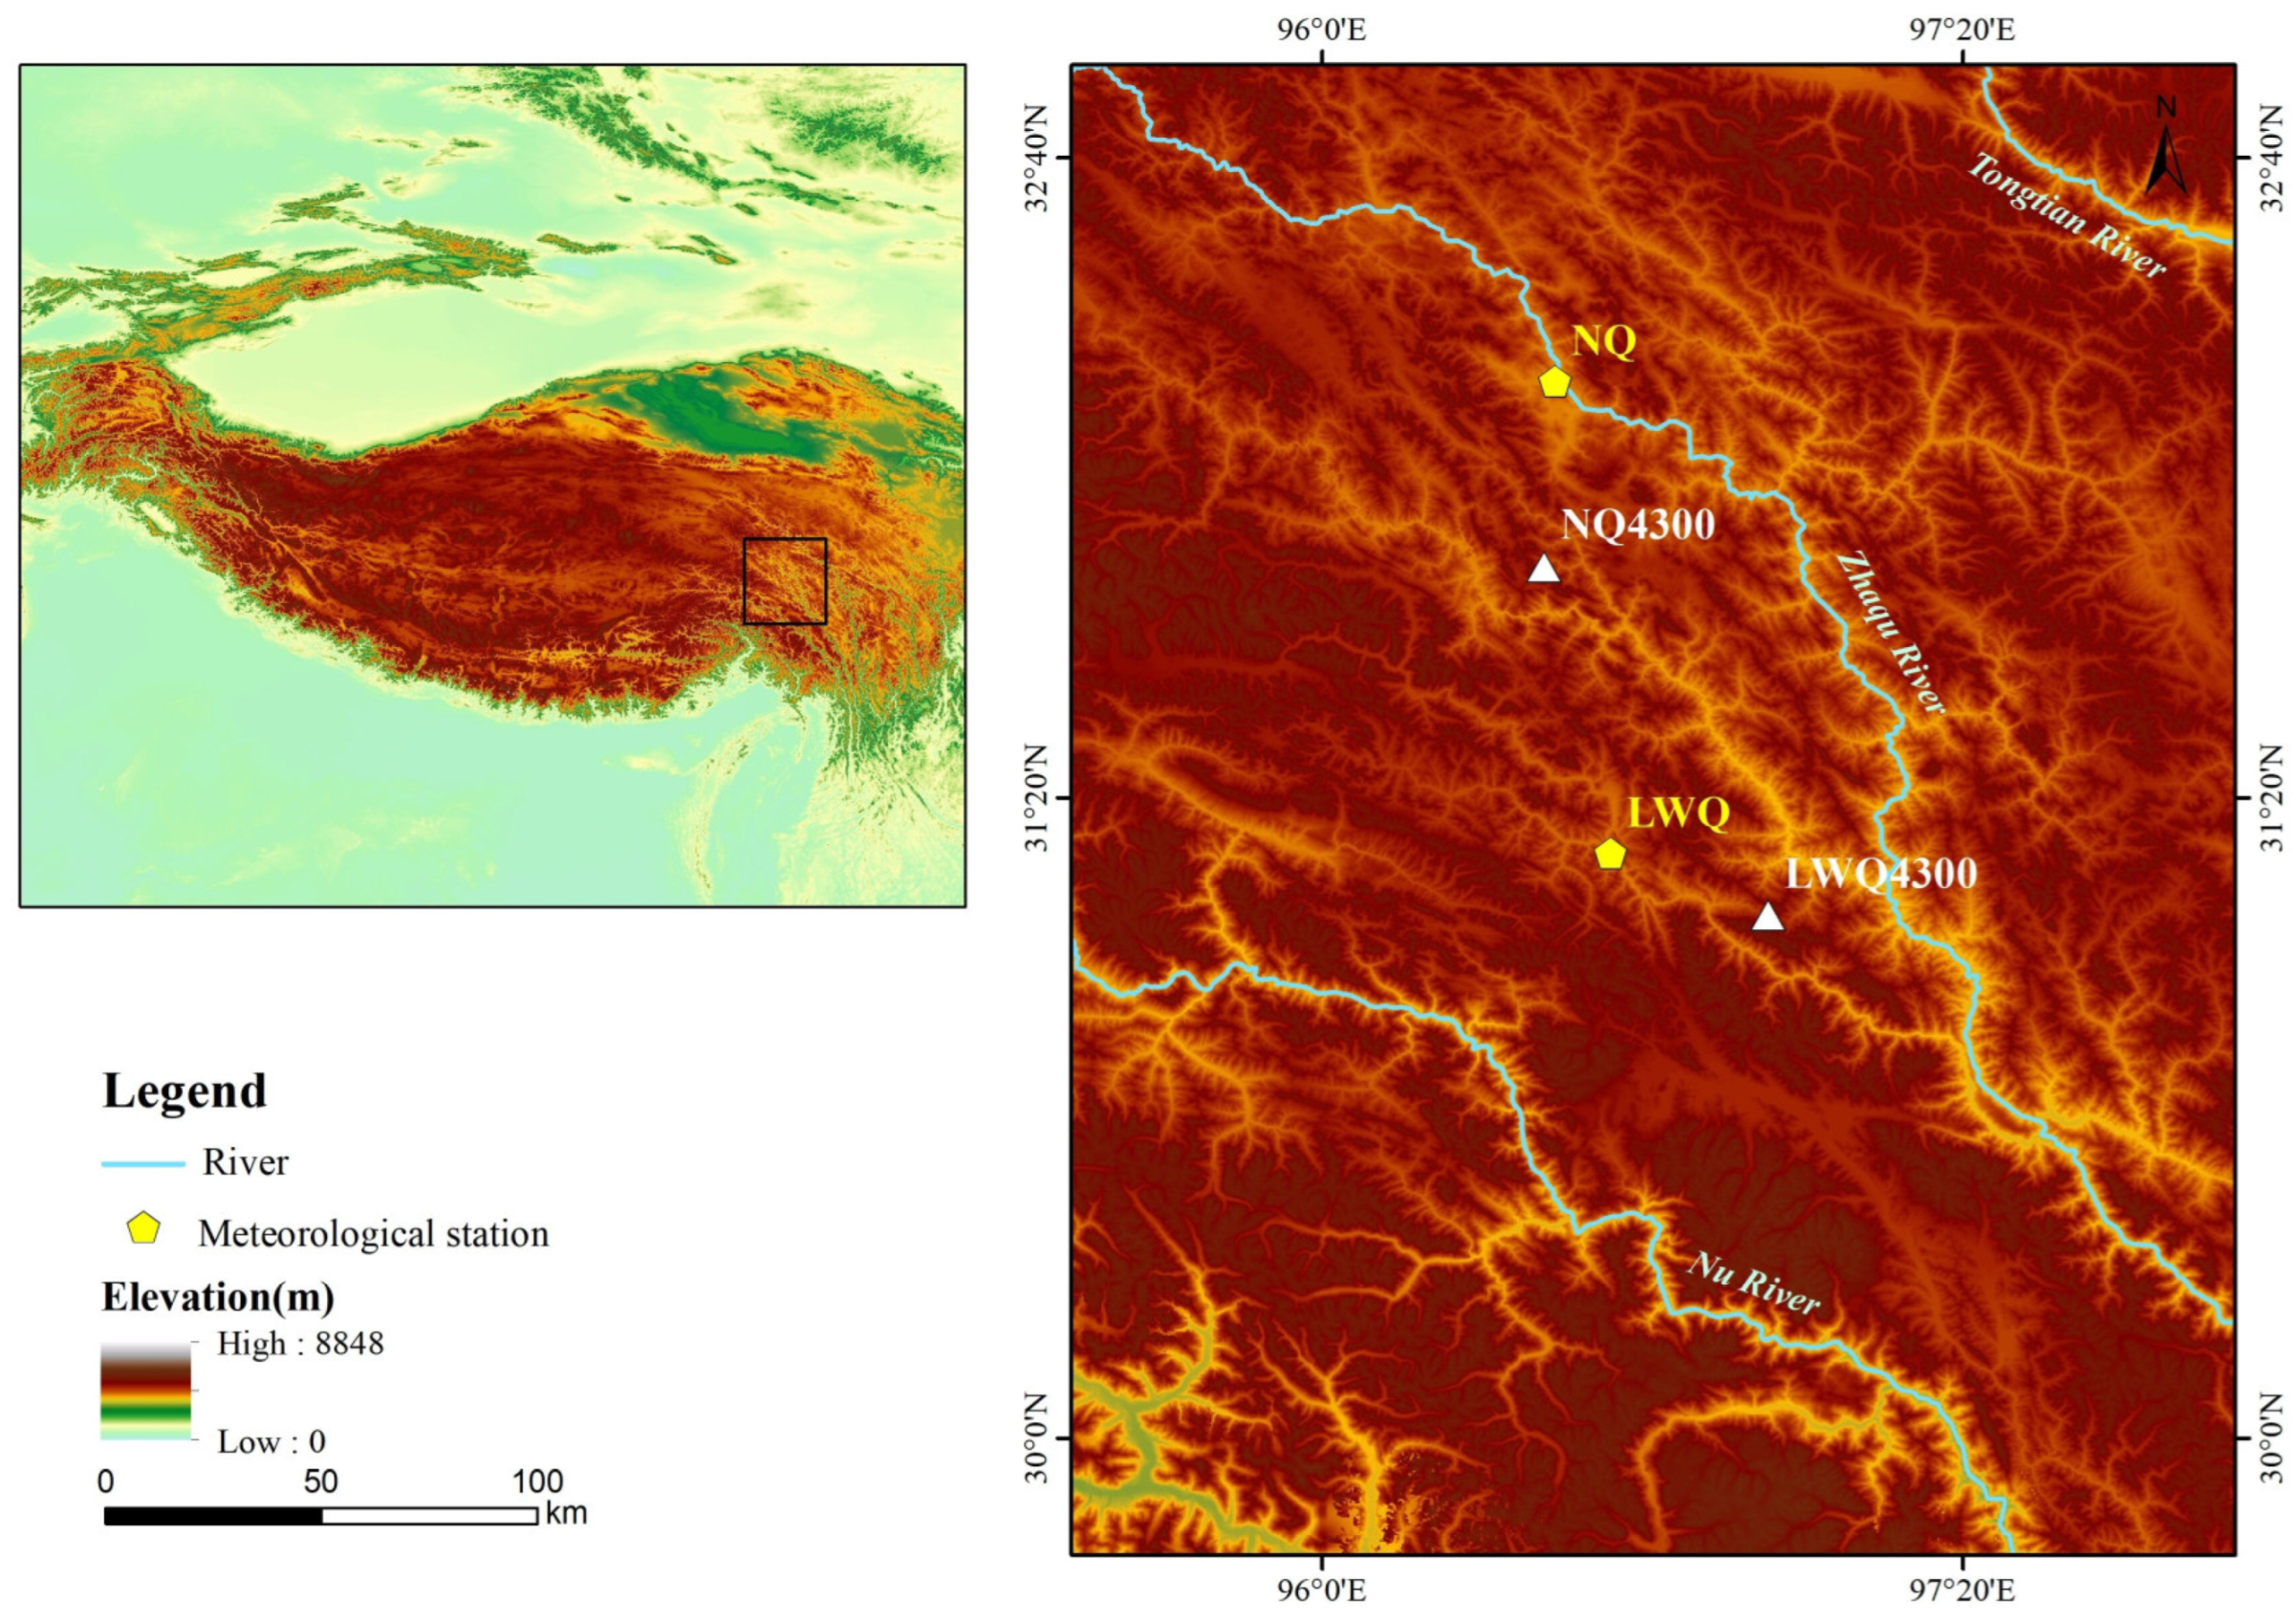
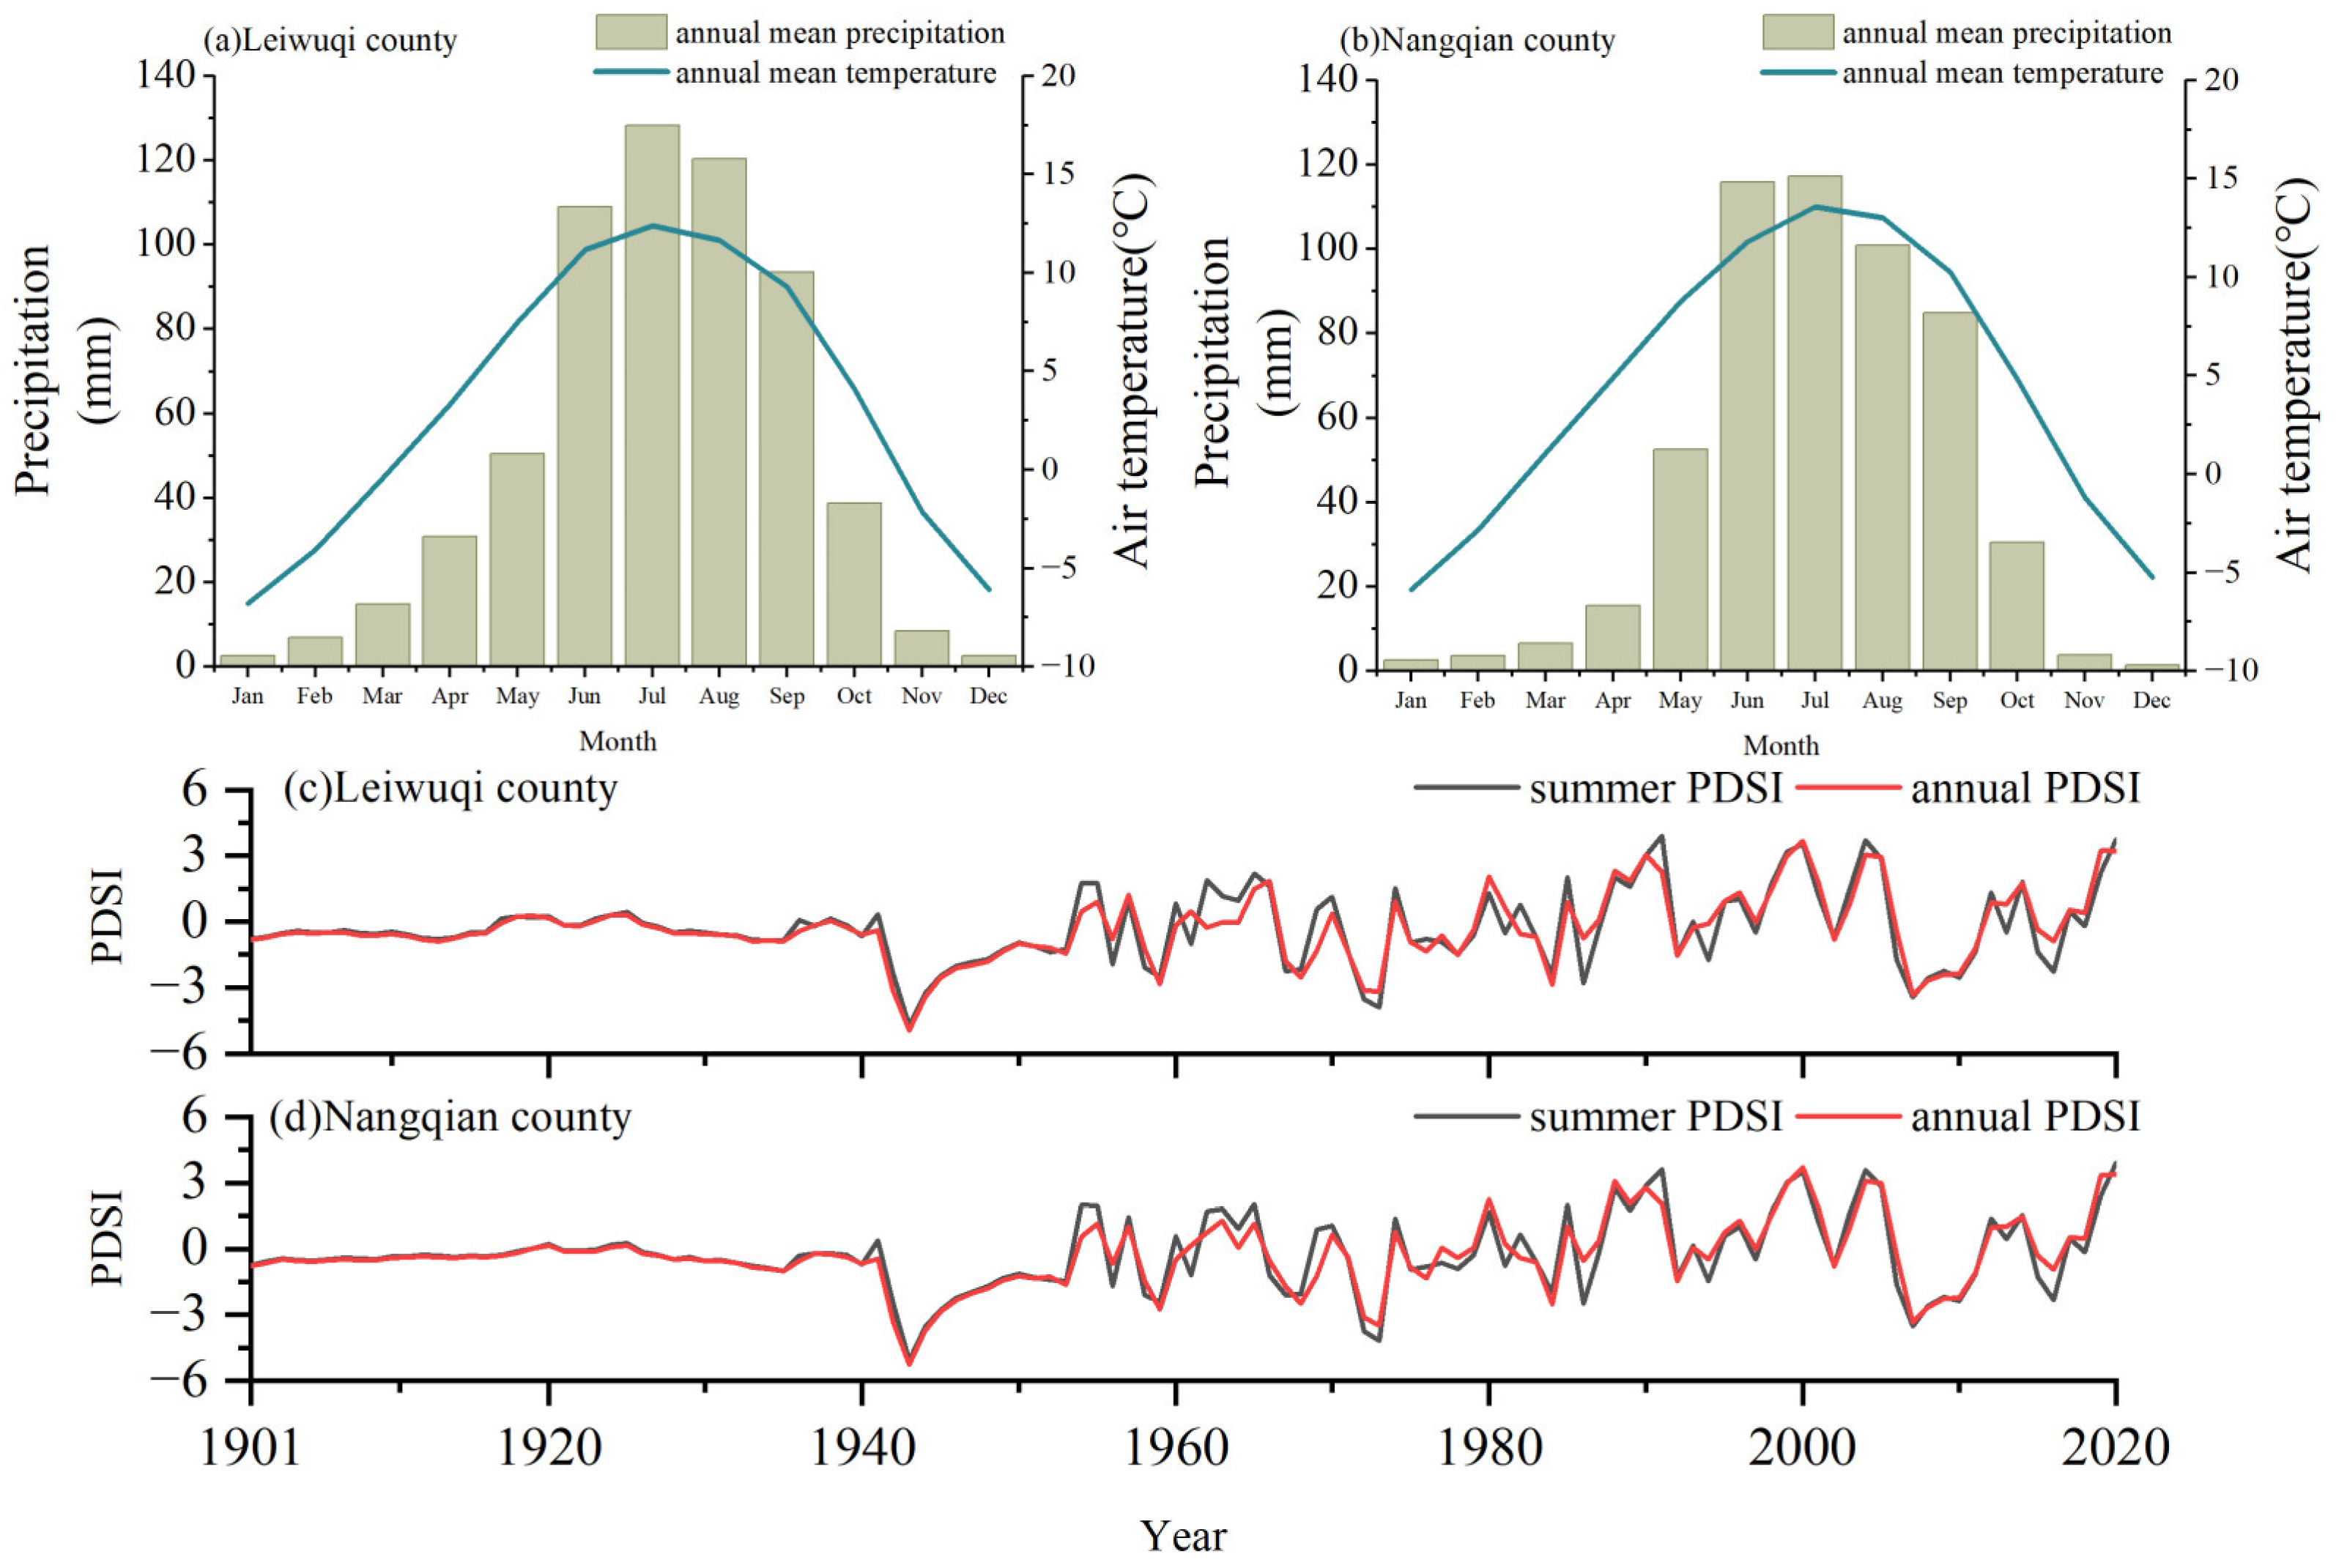
2.1. Study Area and Study Species

The two study sites were located in the Nangqian (NQ, 31°81′ N, 96°46′ E) and Leiwuqi (LWQ, 31°09′ N, 96°93′ E) counties on the eastern TP (Figure 1). The elevation of both sites is 4300 m a.s.l. According to meteorological stations located in NQ County (32°12′ N, 96°29′ E, 3643 m, time period: 1957–2019) and LWQ County (31°13′ N, 96°36′ E, 3811 m, time period: 1979–2019), the annual mean temperature in NQ and LWQ is 4.4 °C and 3.2 °C, respectively. Notably, the temperature for the sample area is markedly lower than that of the meteorological station due to their elevational differences. The annual precipitation in NQ and LWQ is 535 and 609 mm, respectively; 74% and 78% of annual precipitation in NQ and LWQ occurs during the summer monsoon season (from June to September). Both the mean annual and summer temperatures have shown significant positive trends in these two counties over the past decades (p < 0.01), with the summer warming rate being higher in LWQ than NQ. The average summer and annual Palmer Drought Severity Index (hereafter PDSI) values in LWQ (mean ± SD; summer: −0.28 ± 1.64; annual: −0.31 ± 1.52) were lower than in NQ (summer: −0.26 ± 1.65; annual: −0.28 ± 1.54) between 1901 and 2020, indicating a drier climate in LWQ than NQ (Figure 2).
Monthly minimum, maximum, and mean air temperatures, precipitation, and PDSI [24] were used to analyze climate–growth relationships. Temperature data were retrieved from local meteorological stations, whereas PDSI data (1901–2020) were downloaded from the Climatic Research Unit (CRU, resolution: 0.5° × 0.5°) gridded dataset [25]. CRU climate data showed a high correlation with meteorological station data across the TP [26]; thus, it is considered a reliable source in studies of shrub growth–climate associations.
We selected high-elevation Rhododendron przewalskii Maxim. (hereafter R. przewalskii) as the study species. The shrub species is widely distributed on the eastern TP, with the altitudinal range varying from 2900 to 4500 m a.s.l. [27].

2.2. Sample Collection and Chronology Development

In early June of 2021, a total of 53 samples were taken from the stem base of alpine R. przewalskii shrubs at two study sites (NQ: n = 27; LWQ: n = 26). In the case of multi-stemmed R. przewalskii individuals, the sample was taken from the stem with the largest basal diameter. All disks were air-dried and sanded and smoothed with sandpapers with different grains. The ring widths were measured along two radii (separated by 90°) per disk using the Lintab 6 system (accuracy: 0.001 mm). Wedging rings were not detected in our samples. The COFECHA program was used to check the quality of the cross-ring dating data [28].
Since shrub ring widths tended to decrease with increasing age, negative exponential curves were used to remove the biological growth trend in individual shrub ring-width series using ARSTAN software [29]. Ring-width values were divided by fitted values to obtain ring-width indices. Then, autoregressive models were fitted to obtain standard ring-width indices, which were averaged using bi-weight robust means to obtain two standard site chronologies. The expressed population signal (EPS) and mean series inter-correlations (Rbar) were also calculated to check the reliability and signal strength of standardized mean series or chronologies. We also calculated the mean sensitivity (MS), which is a measure of the mean relative change between adjacent ring widths.
To compare R. przewalskii shrub growth patterns between the study sites, Pearson correlations were calculated between the shrub chronology of the two sites. One-way ANOVA was employed to test if mean shrub growth differs significantly between the two study sites.

2.3. Analysis of Climate–Growth Relationships

Monthly climate data (minimum, maximum, and mean temperature, precipitation, PDSI) from September of the previous year to the current October were used in the analysis of climate–growth relationships.
Pearson correlation analysis was used to determine the potential climatic drivers of shrub growth. However, the significant factors could be correlated with each other. The inter-correlations between them were eliminated using partial correlation analysis by controlling other potentially correlated factors over the same time interval [30]. Then, a linear mixed model (LMM) was used to reveal the best predictor of individual ring-width indices. Significant (p < 0.05) factors revealed by the partial correlation analysis were used in the LMMs. Firstly, individual shrubs were set as a random effect in the LMM for each study site. Then, the data for the two sites were mixed up to explore the relationships between shrub growth and random factors (e.g., site condition or shrub age). Climatic factors were set as fixed effects in these models. The LMMs with the lowest Akaike Information Criterion (AIC) and higher R2 values were selected [31]. R software (V.4.1.2) and the nlme package were used to fit the LMMs [32]. Site conditions were described because they might disturb shrub growth–climate relationships. Despite the same elevation, the two study sites differed in slope and aspect (NQ: slope: 18°, aspect: 351°; LWQ: slope: 25°, aspect: 326°). Our results were compared to the results of previous Rhododendron shrub studies in other forest regions of the TP. These forest regions include the Sygera Mountains and the Hengduan Mountains on the southeastern margin of the TP [12,15], the Zhegu Mountains on the eastern margin of the TP [21], and the central Himalaya on the southern margin of the TP [14].

3. Results

3.1. Characteristics of Shrub Chronologies

We were able to build well-replicated 111-year-old and 51-year-old long shrub chronologies with EPS > 0.85 for the NQ and LWQ sites, respectively (Table 1, Figure 3). The mean ring widths in two sites (NQ: 1855–2020; LWQ: 1913–2020) were 0.21 mm. However, the mean ring width for NQ and LWQ during the common period (1970–2020) was 0.23 and 0.22 mm, respectively. The correlation between the two chronologies during the common period (1970–2020) was insignificant (r = 0.17, p > 0.05). An insignificant difference was detected between the two sites according to one-way ANOVA (p > 0.05).

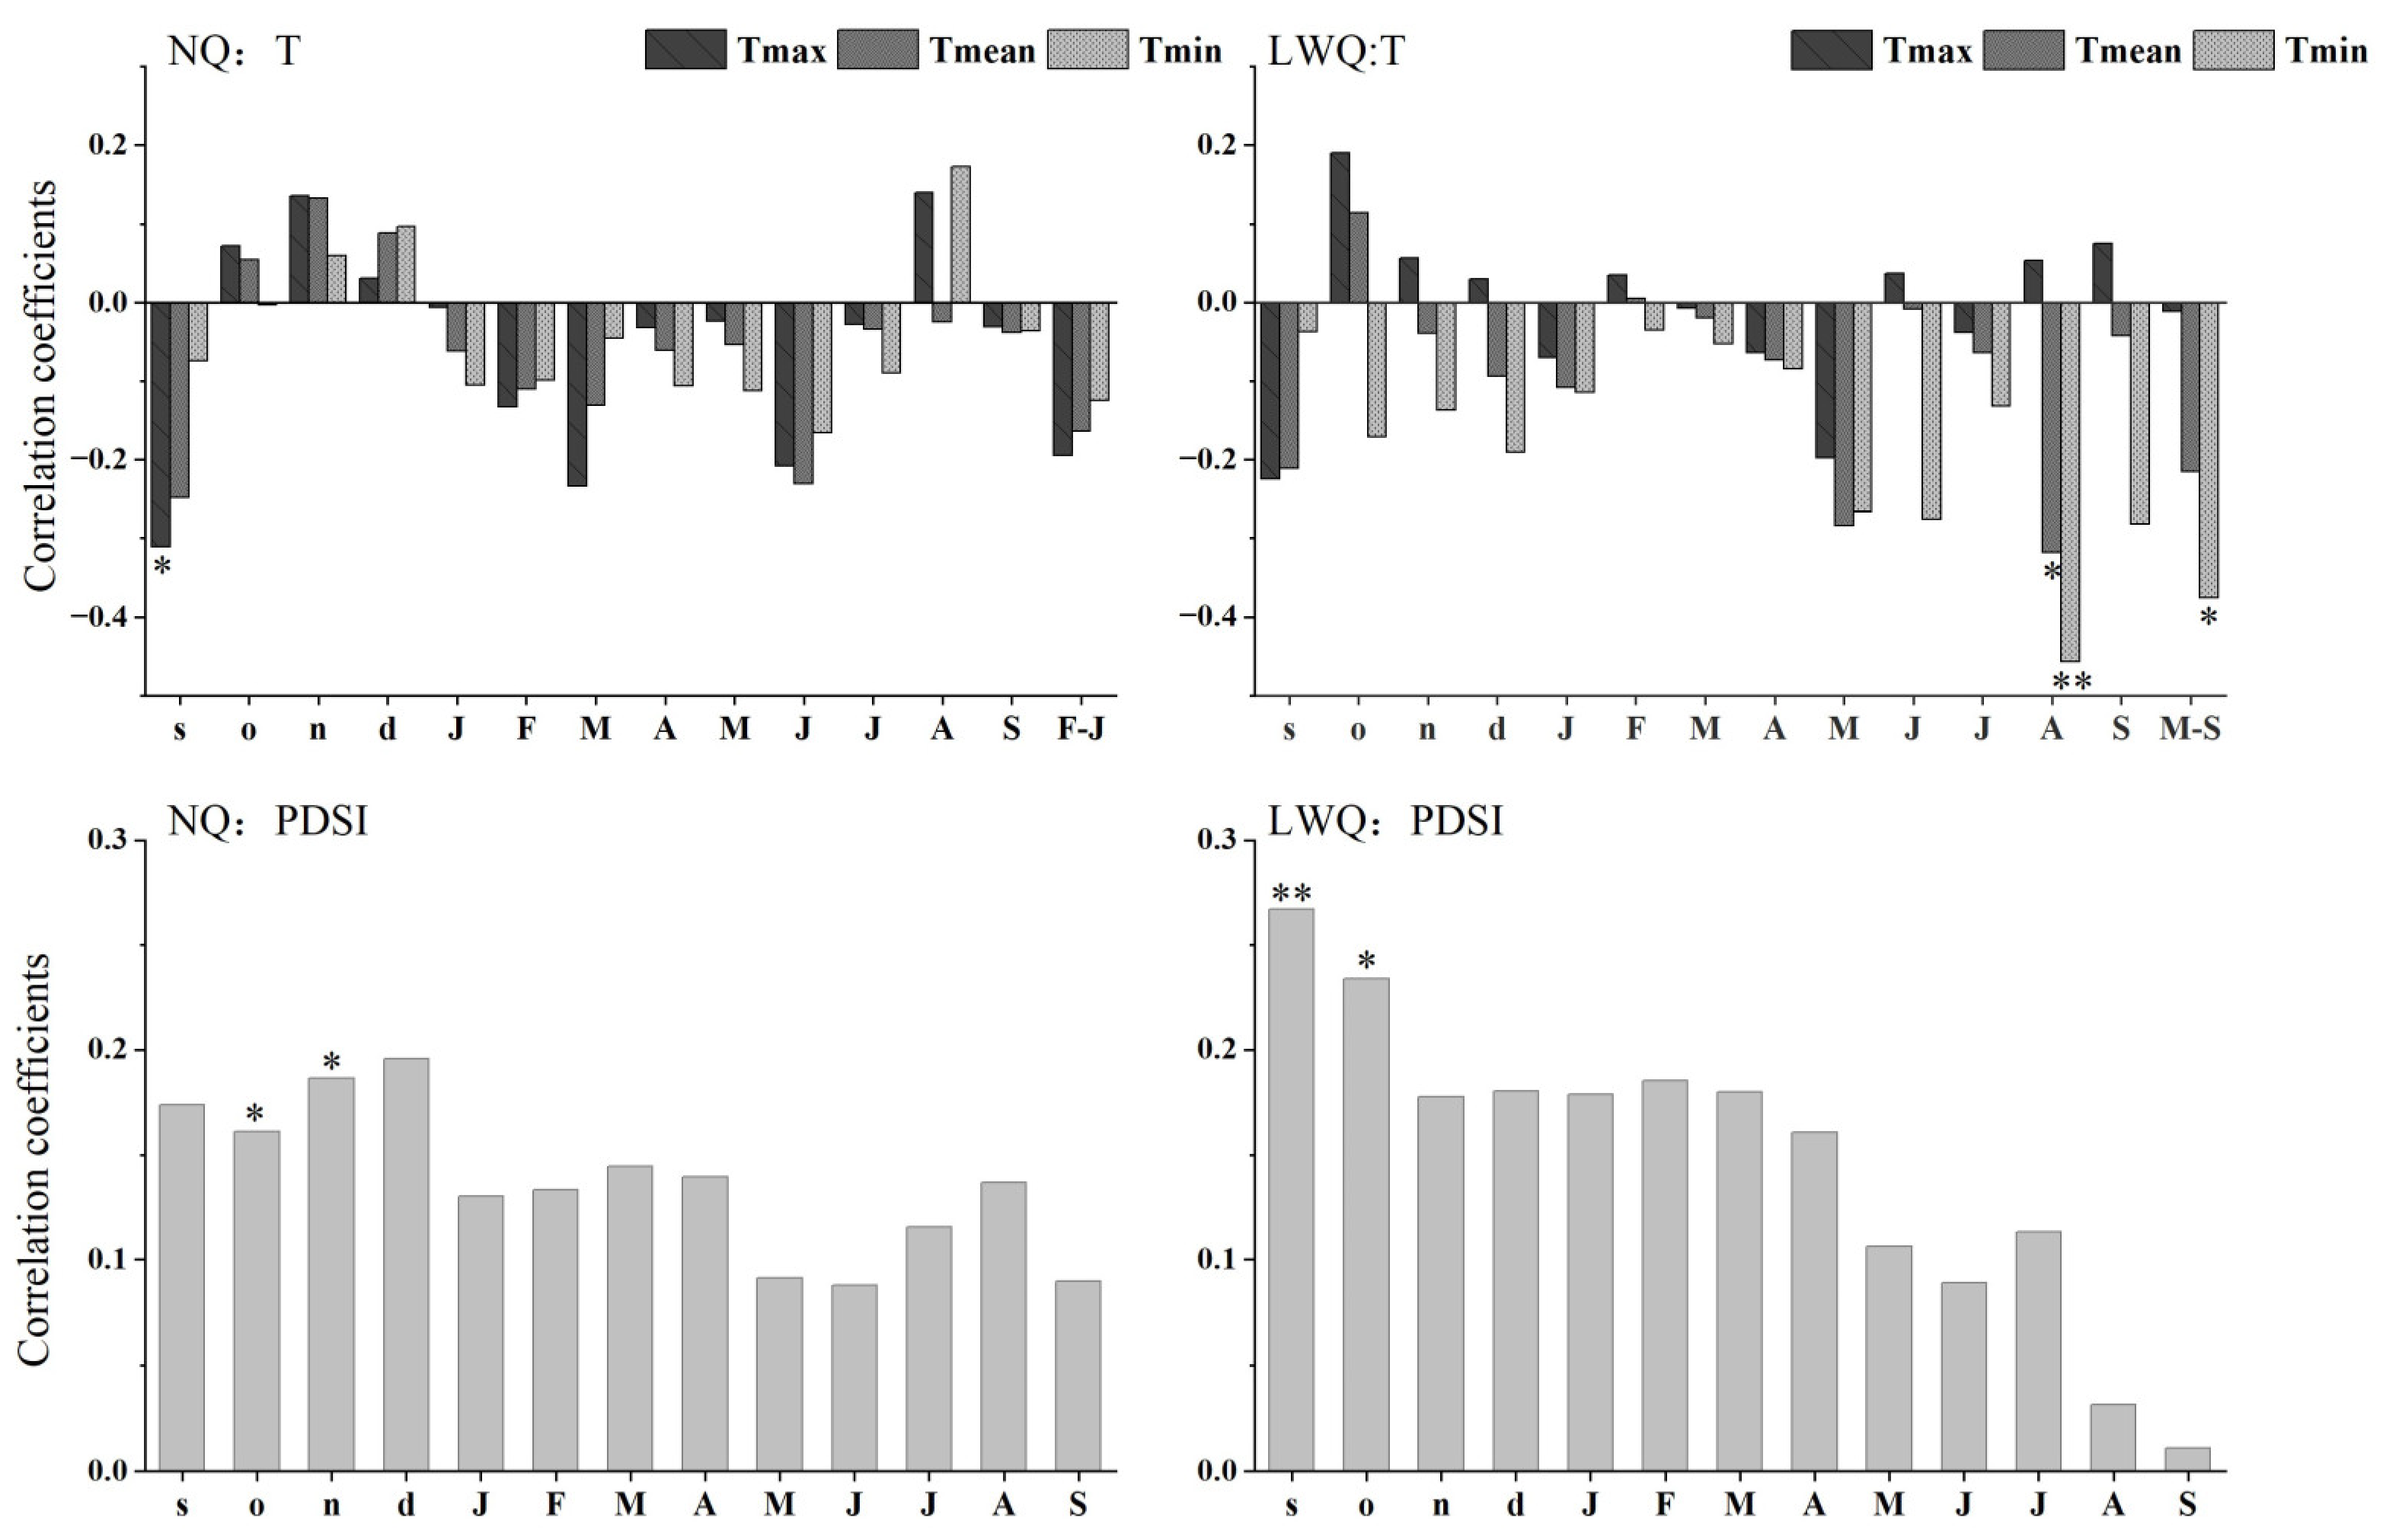
3.2. Climate–Growth Relationships

The mean maximum temperature in September of the previous year was negatively associated with standard shrub ring-width indices in NQ (r = −0.31, p < 0.05) (Figure 4). In LWQ, both mean and minimum temperatures in August showed negative correlations with shrub ring-width indices (August mean temperature: r = −0.32, p < 0.05; August minimum temperature: r = −0.46, p < 0.01). The growing-season (May to September) minimum temperature was negatively correlated with shrub ring-width indices (r = −0.38, p < 0.05). In contrast, PDSI in October and November of the previous year was positively correlated with shrub ring-width indices in site NQ (previous year’s October: r = 0.16; previous year’ November: r = 0.19; p < 0.05 in both cases). However, PDSI in September and October of the previous year was positively associated with shrub ring-width indices in site LWQ (previous year’s September: r = 0.27, p < 0.01; previous year’s October: r = 0.23, p < 0.05). To sum up, the mean maximum temperature in September of the prior year was significantly and negatively correlated with shrub ring-width indices in site NQ, while the minimum temperature in the current August was the most significant factor negatively associated with shrub growth in site LWQ. Insignificant correlations were detected between precipitation factors and shrub growth.

3.3. Partial Correlation Analysis

In NQ, the partial correlation between the mean maximum temperatures of September of the previous year and the shrub ring-width index was significant when controlling for the PDSI of September of the previous year (Table 2). The partial correlation between PDSI in November and December of the previous year and the shrub ring-width index was insignificant when controlling for the mean maximum temperature of November and December of the previous year.
In LWQ, the partial correlation between the minimum temperature and mean temperature in the current August and the shrub ring-width index was significant and increased when PDSI of the current August was controlled. However, when controlling for maximum temperature in September and October of the previous year, the partial correlation between the shrub ring-width index and PDSI in September or October of the previous year was insignificant.
Thus, the maximum temperature in September of the previous year and the current August’s minimum temperature were the most significant climatic factors relating to shrub growth for NQ and LWQ, respectively.

3.4. Predictors of Shrub Growth

Based on the results of the LMMs, the fixed effect with one variable (maximum September temperature of the previous year) explained 10% of the variance of shrub ring-width indices in the NQ site, while the explained variance for the random effect associated with individual shrubs tended to be zero (Table 3). In LWQ, the fixed effect with one variable (August minimum temperature) accounted for 18% of the variance of ring-width indices, while the random effect associated with individual shrubs accounted for 12% of the variance (Table 3). Thus, climate factors well predicted the shrub growth in both sites.
When the data of the two sites were put together, the fixed effect with seven climatic variables (PDSI in the previous September to December, mean and minimum temperature in the current August, maximum temperature in the previous September) explained 12% of the total variance of shrub ring-width indices at the two sites, while the random effect associated with shrub age only accounted for 2% of the variance (Table 3). No significant effect associated with site factors (slope, aspect) to shrub growth was observed in the model.

4. Discussion

4.1. Growth-Limiting Factor for Rhododendron przewalskii Shrubs

Mean shrub growth over the common period (1970–2020) did not differ significantly between the two study sites on the eastern TP. However, the growth-limiting factor for the radial growth of R. przewalskii differed in the two study sites.
Radial growth of R. przewalskii in site NQ was mainly limited by maximum temperature in September of the previous year. A similar result was also reported in the alpine Wilson juniper shrub study on the central TP [33]. It was observed that the end of xylogenesis for high-elevation Rhododendron shrubs appeared in late September [34], when late-season photosynthesis could influence the next year’s growth through organic storage processes [35], implying that the autumn temperature is of importance for the radial growth of alpine shrub. Nevertheless, higher temperatures during the autumn season would amplify transpiration and respiration rates and increase the evaporative water demand by rising the vapor pressure deficit, thus reducing the carbohydrates available for growth in the following year [36]. Climatic data in NQ County show warmer and drier autumn seasons in the past decades [37]. Such a warm–dry autumn climate would negatively affect the current year’s shrub growth by reducing the carbon storage in the late growing season of the following year [38,39,40]. Furthermore, the random effect associated with individual shrubs did not have a significant impact on shrub growth in NQ, suggesting that shrub-level conditions did not distort growth–climate associations.
Shrub growth in site LWQ was primarily limited by the August minimum temperature of the current year. Additionally, this negative effect could last the whole growing season. It is possible that a steady increase in summer temperature induced water stress [41] and reduced the accumulation of organic matter, thus depleting the water and nutrient available for shrubs [42]. Such a negative response of ring formation to high temperature was also founded in several timberline sites [36,43,44].
When the data from the two sited were mixed together, the insignificant effect of site conditions on shrub growth was not detected; it may be attributed to data limitation (e.g., only two levels for the site factor). Generally, LMMs with random effects with a factor of less than 5 levels may not be able to estimate the among-population variance accurately [45,46,47]. In such cases, further investigation is needed to clarify the relationships between the microsite conditions and R. przewalskii shrub growth on the eastern TP. In particular, studies on shrub-ring isotopes (i.e., 13C or 18O) are required to test if there is a stomatal adjustment depending on climate fluctuations at the microclimate level at each site [48]. Random effects associated with shrub age also partly affect shrub growth, which may be related to the strategy of plant biomass allocation. For alpine shrubs, biomass allocated to stem growth decreases with age [49], suggesting that shrub age could disturb shrub growth responses.
The negative temperature–growth correlations at the two study sites revealed the adverse influences of a warm–dry climate on alpine shrub growth in the eastern TP. In general, rapid warming would release alpine shrubs from cold stress but also induce water deficiency [50]. Random effects with individual shrub partly disturb shrub growth, while climatic factors mainly drive shrub growth dynamics, further revealing that the growth responses of alpine Rhododendron shrubs to climate could be contingent on shrub-level conditions, thus supporting our hypothesis.

4.2. Comparison between the Results of Previous Studies and this Study

The length of shrub chronology, mean shrub growth, and growth-limiting factors in existing research differ among the different forest regions on the TP (Table 4). Specifically, the length of well-replicated shrub chronologies of different Rhododendron species (EPS > 0.85) range from 61 to 342 years. The mean ring width of Rhododendron shrub species in these studies, combined with our results, varies between 0.18 and 0.50 mm.
A consistent growth-limiting factor for alpine Rhododendron shrubs was not found across the different forest regions of the TP (Table 4). In the Sygera Mountains of the southeastern TP, characterized by a mild, moist climate, cold July mean temperatures limited the radial growth of alpine Rhododendron shrubs [12]. By contrast, the winter minimum temperature showed a strong negative correlation with Rhododendron shrub growth in the Hengduan mountains of the southeastern TP, indicating that rapid winter warming may exert detrimental effects on growth due to reduced snow cover under climate warming [15]. The contrasting results in these two studies also suggest that site conditions may play a major role in driving shrub growth, in addition to regional climate [12,15]. In the Zhegu Mountains of the eastern margin of the TP, the late winter mean temperature negatively drove Rhododendron shrub growth, also implying the adverse effects of a warm winter on the growth processes of alpine shrubs [21]. In central Himalaya, characterized by a warm climate, the winter minimum temperature positively drove Rhododendron shrub growth, suggesting that winter warming contributed to an increase in soil moisture availability through enhanced snowmelt and soil thawing, therefore promoting shrub radial growth in the next year [51,52]. In strong contrast to the results of the aforementioned studies, we found negative temperature–growth correlations during the growing season, dominating Rhododendron shrub growth on the eastern TP, where climate is relatively dry. Collectively, the growth-limiting factors for Rhododendron shrubs on the TP are highly dependent on regional climates but partly affected by local-scale factors (e.g., site conditions).

4.3. Potential Influence of Climate Warming on Alpine Shrubs

According to the sixth IPCC report, increases of +1.5 and +2.5 °C in global temperature are forecasted for the mid and late 21st century, respectively [53]. Such accelerated warming in the future may increase the mortality rate of temperature-sensitive tree and shrub species [54,55]. Given that the TP is likely to face significantly reduced rainfall and enhanced drought in the future [56], the radial growth of alpine shrubs may experience increased drought stress, as found in the growth of Juniperus indica shrub in central Himalaya [57]. In this study, negative temperature–growth correlations were detected for R. przewalskii on the eastern TP, indicating the negative impacts of climate warming on the radial growth of R. przewalskii. Therefore, a warmer and drier climate could threaten the survival and stability of alpine shrub ecosystems on the eastern TP [50,58].

5. Conclusions

We explored the radial growth dynamics of alpine R. przewalskii and their responses to climate change on the eastern TP. Mean shrub growth differed insignificantly between the two study sites. Based on the Pearson and partial correlations, the most important predictors of shrub radial growth in the NQ and LWQ sites were the maximum temperature in September of the previous year and the minimum temperature in the current August, respectively. However, linear mixed-effect models indicate that shrub-level conditions could exert a certain influence on shrub growth. Results of previous studies in other TP regions, combined with this study, indicated that growth-limiting factors for Rhododendron shrubs are highly dependent on regional climates but mediated by local-scale variables (e.g., site conditions). Thus, climatic and other environmental conditions should be considered with caution when performing shrub-based dendrochronological studies at multi-sites. Cambial phenology and microenvironmental conditions (e.g., soil properties and moisture, understory vegetation) for alpine shrubs are required to clarify the driving mechanism for the growth–climate linkages of Rhododendron shrub.

Author Contributions

Conceptualization: Y.-F.W.; methodology: Y.-L.W., Y.-F.W. and J.J.C.; formal analysis: Y.-L.W.; writing—original draft preparation: Y.-L.W.; writing—review and editing: Y.-F.W. and J.J.C.; funding acquisition: Y.-F.W. All authors have read and agreed to the published version of the manuscript.

Funding

This study was funded by the Second Tibetan Plateau Scientific Expedition and Research Program (2019QZKK0301) and the Co-Innovation Center for Sustainable Forestry in Southern China, Nanjing Forestry University.

Data Availability Statement

The data presented in this study are available upon reasonable request from the corresponding author.

Acknowledgments

We thank Qing Mao and Daihan Li for field assistance on the eastern TP.

Conflicts of Interest

The authors declare no conflict of interest.

References

  1. Peng, D.; Wang, Y.; Xian, G.; Huete, A.R.; Huang, W.; Shen, M.; Wang, F.; Yu, L.; Liu, L.; Xie, Q.; et al. Investigation of land surface phenology detections in shrublands using multiple scale satellite data. Remote Sens. Environ. 2021, 252, 112133. [Google Scholar] [CrossRef]
  2. National Forestry and Grassland Administration. The Ninth National Forest Resources Inventory Report. Available online: http://www.forestry.gov.cn/gjslzyqc.html (accessed on 2 October 2022).
  3. Cáceres, Y.; Llambí, L.D.; Rada, F. Shrubs as foundation species in a high tropical alpine ecosystem: A multi-scale analysis of plant spatial interactions. Plant Ecol. Divers. 2015, 8, 147–161. [Google Scholar] [CrossRef]
  4. Wezel, A.; Rajot, J.-L.; Herbrig, C. Influence of shrubs on soil characteristics and their function in Sahelian agro-ecosystems in semi-arid Niger. J. Arid Environ. 2000, 44, 383–398. [Google Scholar] [CrossRef]
  5. Musa, A.; Deming, J.; Cunyang, N. The applicable density of sand-fixing shrub plantation in Horqin Sand Land of Northeastern China. Ecol. Eng. 2014, 64, 250–254. [Google Scholar] [CrossRef]
  6. Xiao, S.; Peng, X.; Tian, Q.; Zhu, G. Stem radial growth indicate the options of species, topography and stand management for artificial forests in the western Loess Plateau, China. Sci. Cold Arid Reg. 2019, 11, 226–238. [Google Scholar] [CrossRef]
  7. Myers-Smith, I.H.; Hallinger, M.; Blok, D.; Sass-Klaassen, U.; Rayback, S.A.; Weijers, S.; Trant, A.J.; Tape, K.D.; Naito, A.T.; Wipf, S.; et al. Methods for measuring arctic and alpine shrub growth: A review. Earth-Sci. Rev. 2015, 140, 1–13. [Google Scholar] [CrossRef]
  8. Escaravage, N.; Questiau, S.; Pornon, A.; Doche, B.; Taberlet, P. Clonal diversity in a Rhododendron ferrugineum L. (Ericaceae) population inferred from AFLP markers. Mol. Ecol. 1998, 7, 975–982. [Google Scholar] [CrossRef]
  9. Schweingruber, F.H.; Poschlod, P. Growth Rings in Herbs and Shrubs: Life Span, Age Determination and Stem Anatomy; Swiss Federal Research Institute WSL Birmensdorf: Birmensdorf, Switzerland, 2005; Volume 79. [Google Scholar]
  10. Kumar, P. Assessment of impact of climate change on Rhododendrons in Sikkim Himalayas using Maxent modelling: Limitations and challenges. Biodivers. Conserv. 2012, 21, 1251–1266. [Google Scholar] [CrossRef]
  11. Francon, L.; Corona, C.; Roussel, E.; Saez, J.L.; Stoffel, M. Warm summers and moderate winter precipitation boost Rhododendron ferrugineum L. growth in the Taillefer massif (French Alps). Sci. Total Environ. 2017, 586, 1020–1031. [Google Scholar] [CrossRef]
  12. Lu, X.; Camarero, J.J.; Wang, Y.; Liang, E.; Eckstein, D. Up to 400-year-old Rhododendron shrubs on the southeastern Tibetan Plateau: Prospects for shrub-based dendrochronology. Boreas 2015, 44, 760–768. [Google Scholar] [CrossRef]
  13. Liang, E.; Eckstein, D. Dendrochronological potential of the alpine shrub Rhododendron nivale on the south-eastern Tibetan Plateau. Ann. Bot. 2009, 104, 665–670. [Google Scholar] [CrossRef]
  14. Panthi, S.; Fan, Z.-X.; Bräuning, A. Ring widths of Rhododendron shrubs reveal a persistent winter warming in the central Himalaya. Dendrochronologia 2021, 65, 125799. [Google Scholar] [CrossRef]
  15. Bi, Y.; Xu, J.; Yang, J.; Li, Z.; Gebrekirstos, A.; Liang, E.; Zhang, S.; Yang, Y.; Yang, Y.; Yang, X. Ring-widths of the above tree-line shrub Rhododendron reveal the change of minimum winter temperature over the past 211 years in Southwestern China. Clim. Dyn. 2017, 48, 3919–3933. [Google Scholar] [CrossRef]
  16. Francon, L.; Corona, C.; Till-Bottraud, I.; Carlson, B.Z.; Stoffel, M. Some (do not) like it hot: Shrub growth is hampered by heat and drought at the alpine treeline in recent decades. Am. J. Bot. 2020, 107, 607–617. [Google Scholar] [CrossRef]
  17. Young, A.B.; Watts, D.A.; Taylor, A.H.; Post, E. Species and site differences influence climate-shrub growth responses in West Greenland. Dendrochronologia 2016, 37, 69–78. [Google Scholar] [CrossRef]
  18. Hallinger, M.; Manthey, M.; Wilmking, M. Establishing a missing link: Warm summers and winter snow cover promote shrub expansion into alpine tundra in Scandinavia. New Phytol. 2010, 186, 890–899. [Google Scholar] [CrossRef]
  19. Su, K.; Chen, Y.; Yang, H. Advances in the rhododendron and rhododendron shrub communities. J. Trop. Subtrop. Bot. 2020, 28, 527–536. (In Chinese) [Google Scholar]
  20. Zhuang, P.; Wang, F.; Shao, H. Comparative study on Rhododendron and its distribution in W-Sichuan and SE-Tibet. Guihaia 2013, 33, 791–797. (In Chinese) [Google Scholar]
  21. Li, Z.; Liu, G.; Fu, B.; Zhang, Q.; Ma, K.; Pederson, N. The growth-ring variations of alpine shrub Rhododendron przewalskii reflect regional climate signals in the alpine environment of Miyaluo Town in Western Sichuan Province, China. Acta Ecol. Sin. 2013, 33, 23–31. [Google Scholar] [CrossRef]
  22. Liang, E.; Shao, X.; Qin, N. Tree-ring based summer temperature reconstruction for the source region of the Yangtze River on the Tibetan Plateau. Glob. Planet. Chang. 2008, 61, 313–320. [Google Scholar] [CrossRef]
  23. Wang, Y.; Li, D.; Ren, P.; Ram Sigdel, S.; Camarero, J.J. Heterogeneous Responses of alpine treelines to climate warming across the Tibetan Plateau. Forests 2022, 13, 788. [Google Scholar] [CrossRef]
  24. Alley, W.M. The Palmer drought severity index: Limitations and assumptions. J. Appl. Meteorol. Climatol. 1984, 23, 1100–1109. [Google Scholar] [CrossRef]
  25. Harris, I.; Osborn, T.J.; Jones, P.; Lister, D. Version 4 of the CRU TS monthly high-resolution gridded multivariate climate dataset. Sci. Data 2020, 7, 109. [Google Scholar] [CrossRef] [PubMed]
  26. Wen, X. An overview of China climate change over the 20th century using UK UEA/CRU high resolution grid data. Chin. J. Atmos. Sci. 2006, 5, 894–904. (In Chinese) [Google Scholar]
  27. Geng, Y. The Genus Rhododendron of China; Shanghai Scientific & Technical Publishers: Shanghai, China, 2014. [Google Scholar]
  28. Holmes, R.L. Computer-assisted quality control in tree-ring dating and measurement. Tree-Ring Bull. 1983, 43, 51–67. [Google Scholar]
  29. Cook, E.R.; Krusic, P.J.; Peters, K.; Holmes, R.L. Program ARSTAN (Version 4.4), Autoregressive Tree–Ring Standardization Program; Tree–Ring Laboratory of Lamont–Doherty Earth Observatory: Columbia, IN, USA, 2017. [Google Scholar]
  30. Meko, D.; Touchan, R.; Anchukaitis, K. Seascorr: A MATLAB program for identifying the seasonal climate signal in an annual tree-ring time series. Comput. Geosci. 2011, 37, 1234–1241. [Google Scholar] [CrossRef]
  31. Anderson, D.; Burnham, K. Model Selection and Multi-Model Inference; Springer: Berlin/Heidelberg, Germany, 2004. [Google Scholar]
  32. Pinheiro, J.; Bates, D.; Deb Roy, S.; Sarkar, D.; Team, R.C. Linear and Nonlinear Mixed Effects Models. Available online: https://www.yumpu.com/ (accessed on 12 October 2022).
  33. Liang, E.; Lu, X.; Ren, P.; Li, X.; Zhu, L.; Eckstein, D. Annual increments of juniper dwarf shrubs above the tree line on the central Tibetan Plateau: A useful climatic proxy. Ann. Bot. 2011, 109, 721–728. [Google Scholar] [CrossRef]
  34. Li, X.; Rossi, S.; Liang, E.; Camarero, J.J. Temperature thresholds for the onset of xylogenesis in alpine shrubs on the Tibetan Plateau. Trees 2016, 30, 2091–2099. [Google Scholar] [CrossRef]
  35. Harlod, C. Tree Rings and Climate; Academic Press: London, UK, 1976. [Google Scholar]
  36. Guo, B.; Zhang, Y.; Wang, X. Response of Picea purpurea and Abies faxoniana tree rings at different slope aspects to rapid warming in western Sichuan. Chin. J. Appl. Ecol. 2016, 27, 354–364. (In Chinese) [Google Scholar]
  37. Li, H.; Ma, Y.; Bai, Y. An analysis of the impact of climate change on vegetation succession in qinghai province. J. Glaciol. Geocryol. 2010, 32, 414–421. (In Chinese) [Google Scholar]
  38. Kagawa, A.; Sugimoto, A.; Maximov, T.C. Seasonal course of translocation, storage and remobilization of 13 C pulse-labeled photoassimilate in naturally growing Larix gmelinii saplings. New Phytol. 2006, 171, 793–804. [Google Scholar] [CrossRef]
  39. McDowell, N.; Pockman, W.T.; Allen, C.D.; Breshears, D.D.; Cobb, N.; Kolb, T.; Plaut, J.; Sperry, J.; West, A.; Williams, D.G.; et al. Mechanisms of plant survival and mortality during drought: Why do some plants survive while others succumb to drought? New Phytol. 2008, 178, 719–739. [Google Scholar] [CrossRef]
  40. Chapin, E.S.F.S.; Schulze, E.; Mooney, H.A. The Ecology and Economics of Storage in Plants. Annu. Rev. Ecol. Syst. 1990, 21, 423–447. [Google Scholar] [CrossRef]
  41. Han, Y.; Wang, Y.; Liu, B.; Huang, R.; Camarero, J.J. Moisture mediates temperature-growth couplings of high-elevation shrubs in the Tibetan plateau. Trees 2022, 36, 273–281. [Google Scholar] [CrossRef]
  42. Mu, H.-X.; Han, F.; Zhang, B.-P.; Liang, T.; Wang, Z.-Y.; Wang, Z. Characteristics of timberline and treeline altitudinal distribution in Mt. Namjagbarwa and their geographical interpretation. J. Mt. Sci. 2022, 19, 2846–2860. [Google Scholar] [CrossRef]
  43. Yang, R.-Q.; Zhao, F.; Fan, Z.-X.; Panthi, S.; Fu, P.-L.; Bräuning, A.; Grießinger, J.; Li, Z.-S. Long-term growth trends of Abies delavayi and its physiological responses to a warming climate in the Cangshan Mountains, southwestern China. For. Ecol. Manag. 2022, 505, 119943. [Google Scholar] [CrossRef]
  44. Porter, T.J.; Pisaric, M.F.J. Temperature-growth divergence in white spruce forests of Old Crow Flats, Yukon Territory, and adjacent regions of northwestern North America. Glob. Chang. Biol. 2011, 17, 3418–3430. [Google Scholar] [CrossRef]
  45. Harrison, X.A.; Donaldson, L.; Correa-Cano, M.E.; Evans, J.; Fisher, D.N.; Goodwin, C.E.D.; Robinson, B.S.; Hodgson, D.J.; Inger, R. A brief introduction to mixed effects modelling and multi-model inference in ecology. PeerJ 2018, 6, e4794. [Google Scholar] [CrossRef]
  46. Arnqvist, G. Mixed Models Offer No Freedom from Degrees of Freedom. Trends Ecol. Evol. 2020, 35, 329–335. [Google Scholar] [CrossRef]
  47. Gelman, A. Data Analysis Using Regression and Multilevel/Hierarchical Models; Cambridge University Press: Cambridge, UK, 2006. [Google Scholar]
  48. Gessler, A.; Ferrio, J.P.; Hommel, R.; Treydte, K.; Werner, R.A.; Monson, R.K. Stable isotopes in tree rings: Towards a mechanistic understanding of isotope fractionation and mixing processes from the leaves to the wood. Tree Physiol. 2014, 34, 796–818. [Google Scholar] [CrossRef]
  49. Dolezal, J.; Jandova, V.; Macek, M.; Liancourt, P. Contrasting biomass allocation responses across ontogeny and stress gradients reveal plant adaptations to drought and cold. Funct. Ecol. 2021, 35, 32–42. [Google Scholar] [CrossRef]
  50. Wang, Y.; Liang, E.; Lu, X.; Camarero, J.J.; Babst, F.; Shen, M.; Peñuelas, J. Warming-induced shrubline advance stalled by moisture limitation on the Tibetan Plateau. Ecography 2021, 44, 1631–1641. [Google Scholar] [CrossRef]
  51. Ranjitkar, S.; Luedeling, E.; Shrestha, K.K.; Guan, K.; Xu, J. Flowering phenology of tree rhododendron along an elevation gradient in two sites in the Eastern Himalayas. Int. J. Biometeorol. 2013, 57, 225–240. [Google Scholar] [CrossRef] [PubMed]
  52. Körner, C. Alpine Plant Life: Functional Plant Ecology of High Mountain Ecosystems, 2nd ed.; Springer: New York, NY, USA, 2003. [Google Scholar]
  53. The Intergovernmental Panel on Climate Change. Climate Change 2022: Mitigation of Climate Change. Available online: https://www.ipcc.ch/report/ar6/wg3/. (accessed on 15 October 2022).
  54. Liang, E.; Leuschner, C.; Dulamsuren, C.; Wagner, B.; Hauck, M. Global warming-related tree growth decline and mortality on the north-eastern Tibetan plateau. Clim. Chang. 2016, 134, 163–176. [Google Scholar] [CrossRef]
  55. Mou, Y.-M.; Fang, O.; Cheng, X.; Qiu, H. Recent tree growth decline unprecedented over the last four centuries in a Tibetan juniper forest. J. For. Res. 2019, 30, 1429–1436. [Google Scholar] [CrossRef]
  56. Wang, L.; Chen, W. A CMIP5 multimodel projection of future temperature, precipitation, and climatological drought in China. Int. J. Clim. 2014, 34, 2059–2078. [Google Scholar] [CrossRef]
  57. Pandey, J.; Sigdel, S.R.; Lu, X.; Salerno, F.; Dawadi, B.; Liang, E.; Camarero, J.J. Early growing-season precipitation drives radial growth of alpine juniper shrubs in the central Himalayas. Geogr. Ann. Ser. A Phys. Geogr. 2020, 102, 317–330. [Google Scholar] [CrossRef]
  58. Lu, X.; Liang, E.; Babst, F.; Camarero, J.J.; Büntgen, U. Warming-induced tipping points of Arctic and alpine shrub recruitment. Proc. Natl. Acad. Sci. USA 2022, 119, e2118120119. [Google Scholar] [CrossRef]
Figure 1. Location of the two study sites (white triangles in the right map) and the meteorological stations (yellow pentagons in the right map) situated on the eastern TP (upper left).
Forests 14 00331 g001
Figure 2. Variations of mean monthly precipitation, mean monthly temperature (a,b), average summer, and annual PDSI (c,d) in the study area on the eastern TP based on data from meteorological stations and the CRU TS gridded data.
Forests 14 00331 g002
Figure 3. Variations of the standard ring-width index (solid lines) of R. przewalskii shrubs at the two study sites ((a) NQ; (b) LWQ). The sampled depth (dashed lines) is shown in the right y-axis. Vertical dashed lines denote the year with EPS > 0.85.
Forests 14 00331 g003
Figure 4. Correlation coefficients of shrub chronologies and climatic variables (T, temperature variables, PDSI, drought index) from September of the previous year (lowercase letters: e.g., s, o, n, d) to September of the current year (uppercase letters: e.g., J, F, M). Abbreviations: FJ, February to June; MS, May to September; Tmax, mean maximum monthly temperature; Tmean, mean monthly temperature; Tmin mean minimum monthly temperature; PDSI, Palmer Drought Severity Index. Significance levels: *, p < 0.05; **, p < 0.01.
Forests 14 00331 g004
Table 1. Statistics of ring-width chronologies for the R. przewalskii shrub on the eastern TP. Abbreviations: Rbar (mean inter-series correlation), MS (mean sensitivity), EPS (expressed population signal).
SiteTime SpanNo. Individuals
(No. Radii)
Mean Ring Width in the Total Time Span
(mm)
Mean Ring Width since 1970
(mm)
RbarMSEPS > 0.85 since
NQ1855–202027 (54)0.21 ± 0.070.23 ± 0.040.610.421910
LWQ1913–202026 (52)0.21 ± 0.060.22 ± 0.050.280.331970
Table 2. Partial correlations between shrub ring-width indices and climatic factors at the two sites. Abbreviations: Tmax, mean maximum temperature; PDSI, Palmer Drought Severity Index; p9 (p10, etc.), previous September (October, etc.); c8, current August. Significance levels: *, p < 0.05; **, p < 0.01.
SiteClimatic Variables/MonthControlled Climatic VariablePartial Correlation
NQTmax/p9PDSI_p9−0.27 *
PDSI/p11Tmax_p110.18
PDSI/p12Tmax_p120.20
LWQTmin/c8PDSI_c8−0.53 **
Tmean/c8PDSI_c8−0.32 *
PDSI/p9Tmax_p90.20
PDSI/p10Tmax_p100.31
Table 3. Summary of the linear mixed-effects models (LMMs) fitted to shrub ring-width indices at the two sites. Abbreviations: LWQ + NQ (LN), LMM model for the mixed data of two sites; Tmean, mean temperature; Tmin, mean minimum temperature; Tmax, mean maximum temperature; PDSI, Palmer Drought Severity Index; c8 (c9), current August (September); p9 (p10, etc.), previous September (October etc.); SV, seven variables (PDSI in previous September to December, mean and minimum temperature in current August, maximum temperature in previous September); R2m, marginal R2; R2c, conditional R2; AIC, Akaike Information Criterion.
NameClimate Variable/MonthR²mR²cpAIC
LNSV0.120.14<0.0172.21
LWQTmean/c80.090.22<0.0512.03
Tmin/c80.180.30<0.018.19
PDSI/p90.120.24<0.0512.56
PDSI/p100.090.22<0.0514.35
NQTmax/p90.100.10<0.0536.40
PDSI/p110.030.03>0.0541.90
PDSI/p120.030.03>0.0541.68
Table 4. Information for the existing Rhododendron shrub chronologies in previous studies on the TP. Rhododendron shrub species included Rhododendron aganniphum var. schizopeplum (A), Rhododendron phaeochrysum (B), Rhododendron. traillianum (C), Rhododendron przewalskii (D), Rhododendron alutace (E), and Rhododendron campanulatum (F). The sign “/” indicates no data. Abbreviations: shrub species (Species), length of chronology with EPS > 0.85 (Length), ring width (RW), growth-limiting factor (GLF).
Forest RegionSpeciesLength
(years)
RW
(mm)
GLF
Sygera Mts, southeastern TP, China [12]A3420.20Low July mean temperature
2720.20
2820.21
1170.18
Hengduan Mts, southeastern TP [15]B196/High December–February mean minimum temperature
C212/
D67/
E77/
C142/
Zhegu Mts, eastern margin of the TP [21]D610.5High January–February mean temperature
Central Himalaya, southern margin of the TP [14]F227/Low December–February minimum temperature
Disclaimer/Publisher’s Note: The statements, opinions and data contained in all publications are solely those of the individual author(s) and contributor(s) and not of MDPI and/or the editor(s). MDPI and/or the editor(s) disclaim responsibility for any injury to people or property resulting from any ideas, methods, instructions or products referred to in the content.

