Article

Genetic Monitoring of Alnus glutinosa Natural Populations Using Two Generation Cohorts

by
Rita Verbylaitė
1,*,
Filippos A. Aravanopoulos
1,2,
Virgilijus Baliuckas
1 and
Aušra Juškauskaitė
1
1
Institute of Forestry, Lithuanian Research Centre for Agriculture and Forestry, Akademija, LT-58344 Kėdainiai District, Lithuania
2
Faculty of Agriculture, Forestry and Natural Environment, Aristotle University of Thessaloniki, P.O. Box 238, GR 541 24 Thessaloniki, Greece
*
Author to whom correspondence should be addressed.
Forests 2023, 14(2), 330; https://doi.org/10.3390/f14020330
Submission received: 13 January 2023 / Revised: 30 January 2023 / Accepted: 4 February 2023 / Published: 7 February 2023
(This article belongs to the Section Genetics and Molecular Biology)

Abstract

:
The genetic diversity of populations is the ultimate source for adaptation and survival under changing environmental conditions. Genetic monitoring of temporal genetic diversity changes in autochthonous forest tree populations of key ecosystems species allows us to predict and mitigate potentially harmful changes of forests adaptability. The aim of the present study was to assess the genetic diversity of autochthonous protected A. glutinosa populations, to compare the genetic diversity between maternal and progeny generations, in a distribution area that is known to harbour extensive genetic diversity, and to assess if there is an impact on genetic diversity when forest management practices to promote natural regeneration of mature stands are introduced. The genetic diversity of ten A. glutinosa populations from Lithuania was studied using 20 nuclear SSR primers. In total, 597 individuals (300 juvenile and 297 mature trees) were investigated. In half of the studied black alder GCUs, forest management to promote natural regeneration was carried out. The present study revealed high genetic diversity (average population Ar was 5.77, Ho and He–0.70) and low, but a significant population differentiation of studied A. glutinosa populations. The lack of significant genetic differences among different generations (population cohorts), is a strong indication that the black alder GCUs in Lithuania form an excellent platform for the protection of the species’ genetic diversity in the country.

1. Introduction

The current rate of climate change will affect terrestrial ecosystems more significantly than any other biome [1]; therefore, the keystone tree species of ecosystems and their natural populations are a priority of conservation initiatives. Forest tree species present considerable adaptability to climate change due to long generation times and high standing genetic variation; however, the rapidly changing climate, habitat loss, and fragmentation can adversely affect keystone species’ populations and their genetic diversity [2,3,4,5]. Maintaining population genetic diversity over time is crucial for preserving long-term adaptive evolutionary potential [6,7]. Therefore, it is important to monitor temporal genetic diversity to unmask any unwanted changes in forest tree populations, especially in those that serve as genetic conservation units.
Alnus glutinosa (L.) Gaertn. (black alder) is an important forest tree species in Europe. It is a monoecious, self-incompatible, wind pollinated, and wind dispersed over short distances and water dispersed over long distances keystone species of riparian ecosystems [8,9]. It is known for its rapid growth up to 20 years of age, and for its nitrogen fixing abilities due to symbiotic actinomycetes found on the root nodules [10]. A. glutinosa can withstand long periods of flooding and is one of the few forest tree species in Europe to have a very high flooding tolerance [11], while being draught sensitive as well. A. glutinosa is a pioneer tree species that successfully colonises disturbed habitats [12]. However, its seedlings are light demanding and it regenerates poorly under the canopy of other trees [8,13]. Black alder harbours extensive genetic diversity [14,15,16,17,18,19] and its populations are known to be locally adapted [15,20]. As A. glutinosa is a keystone species of threatened riparian habitats, it is of utmost importance to preserve the genetic diversity of autochthonous populations. A. glutinosa grows in most of Europe and its native distribution ranges from Scandinavia to the Mediterranean countries and parts of North Africa [21]. Lithuania is in the middle part of the black alder distribution area and the environmental conditions here are very suitable for this species [12]. Black alder stands prevail in the central and southwestern parts of Lithuania, which is assigned to the first provenance region (Figure 1). The species grows in 163,800 ha, which constitutes 7.9% of the country’s total forested area [22]. The area occupied by black alder stands in Lithuania has increased by 44,000 ha over the last 18 years [22]. The genetic diversity of autochthonous black alder populations in Lithuania is expected to be high, due to the admixture of several different glacial refugium lineages [14].
The aim of the present study was to assess the genetic diversity of autochthonous protected A. glutinous populations, which have been present in Lithuania since the end of the last glacial period, and to compare the genetic diversity between maternal and progeny generations in a distribution area that is known to harbour extensive genetic diversity [14]. In addition, our aim was to assess if there is an impact on genetic diversity when forest management practices to promote natural regeneration of mature stands are introduced.

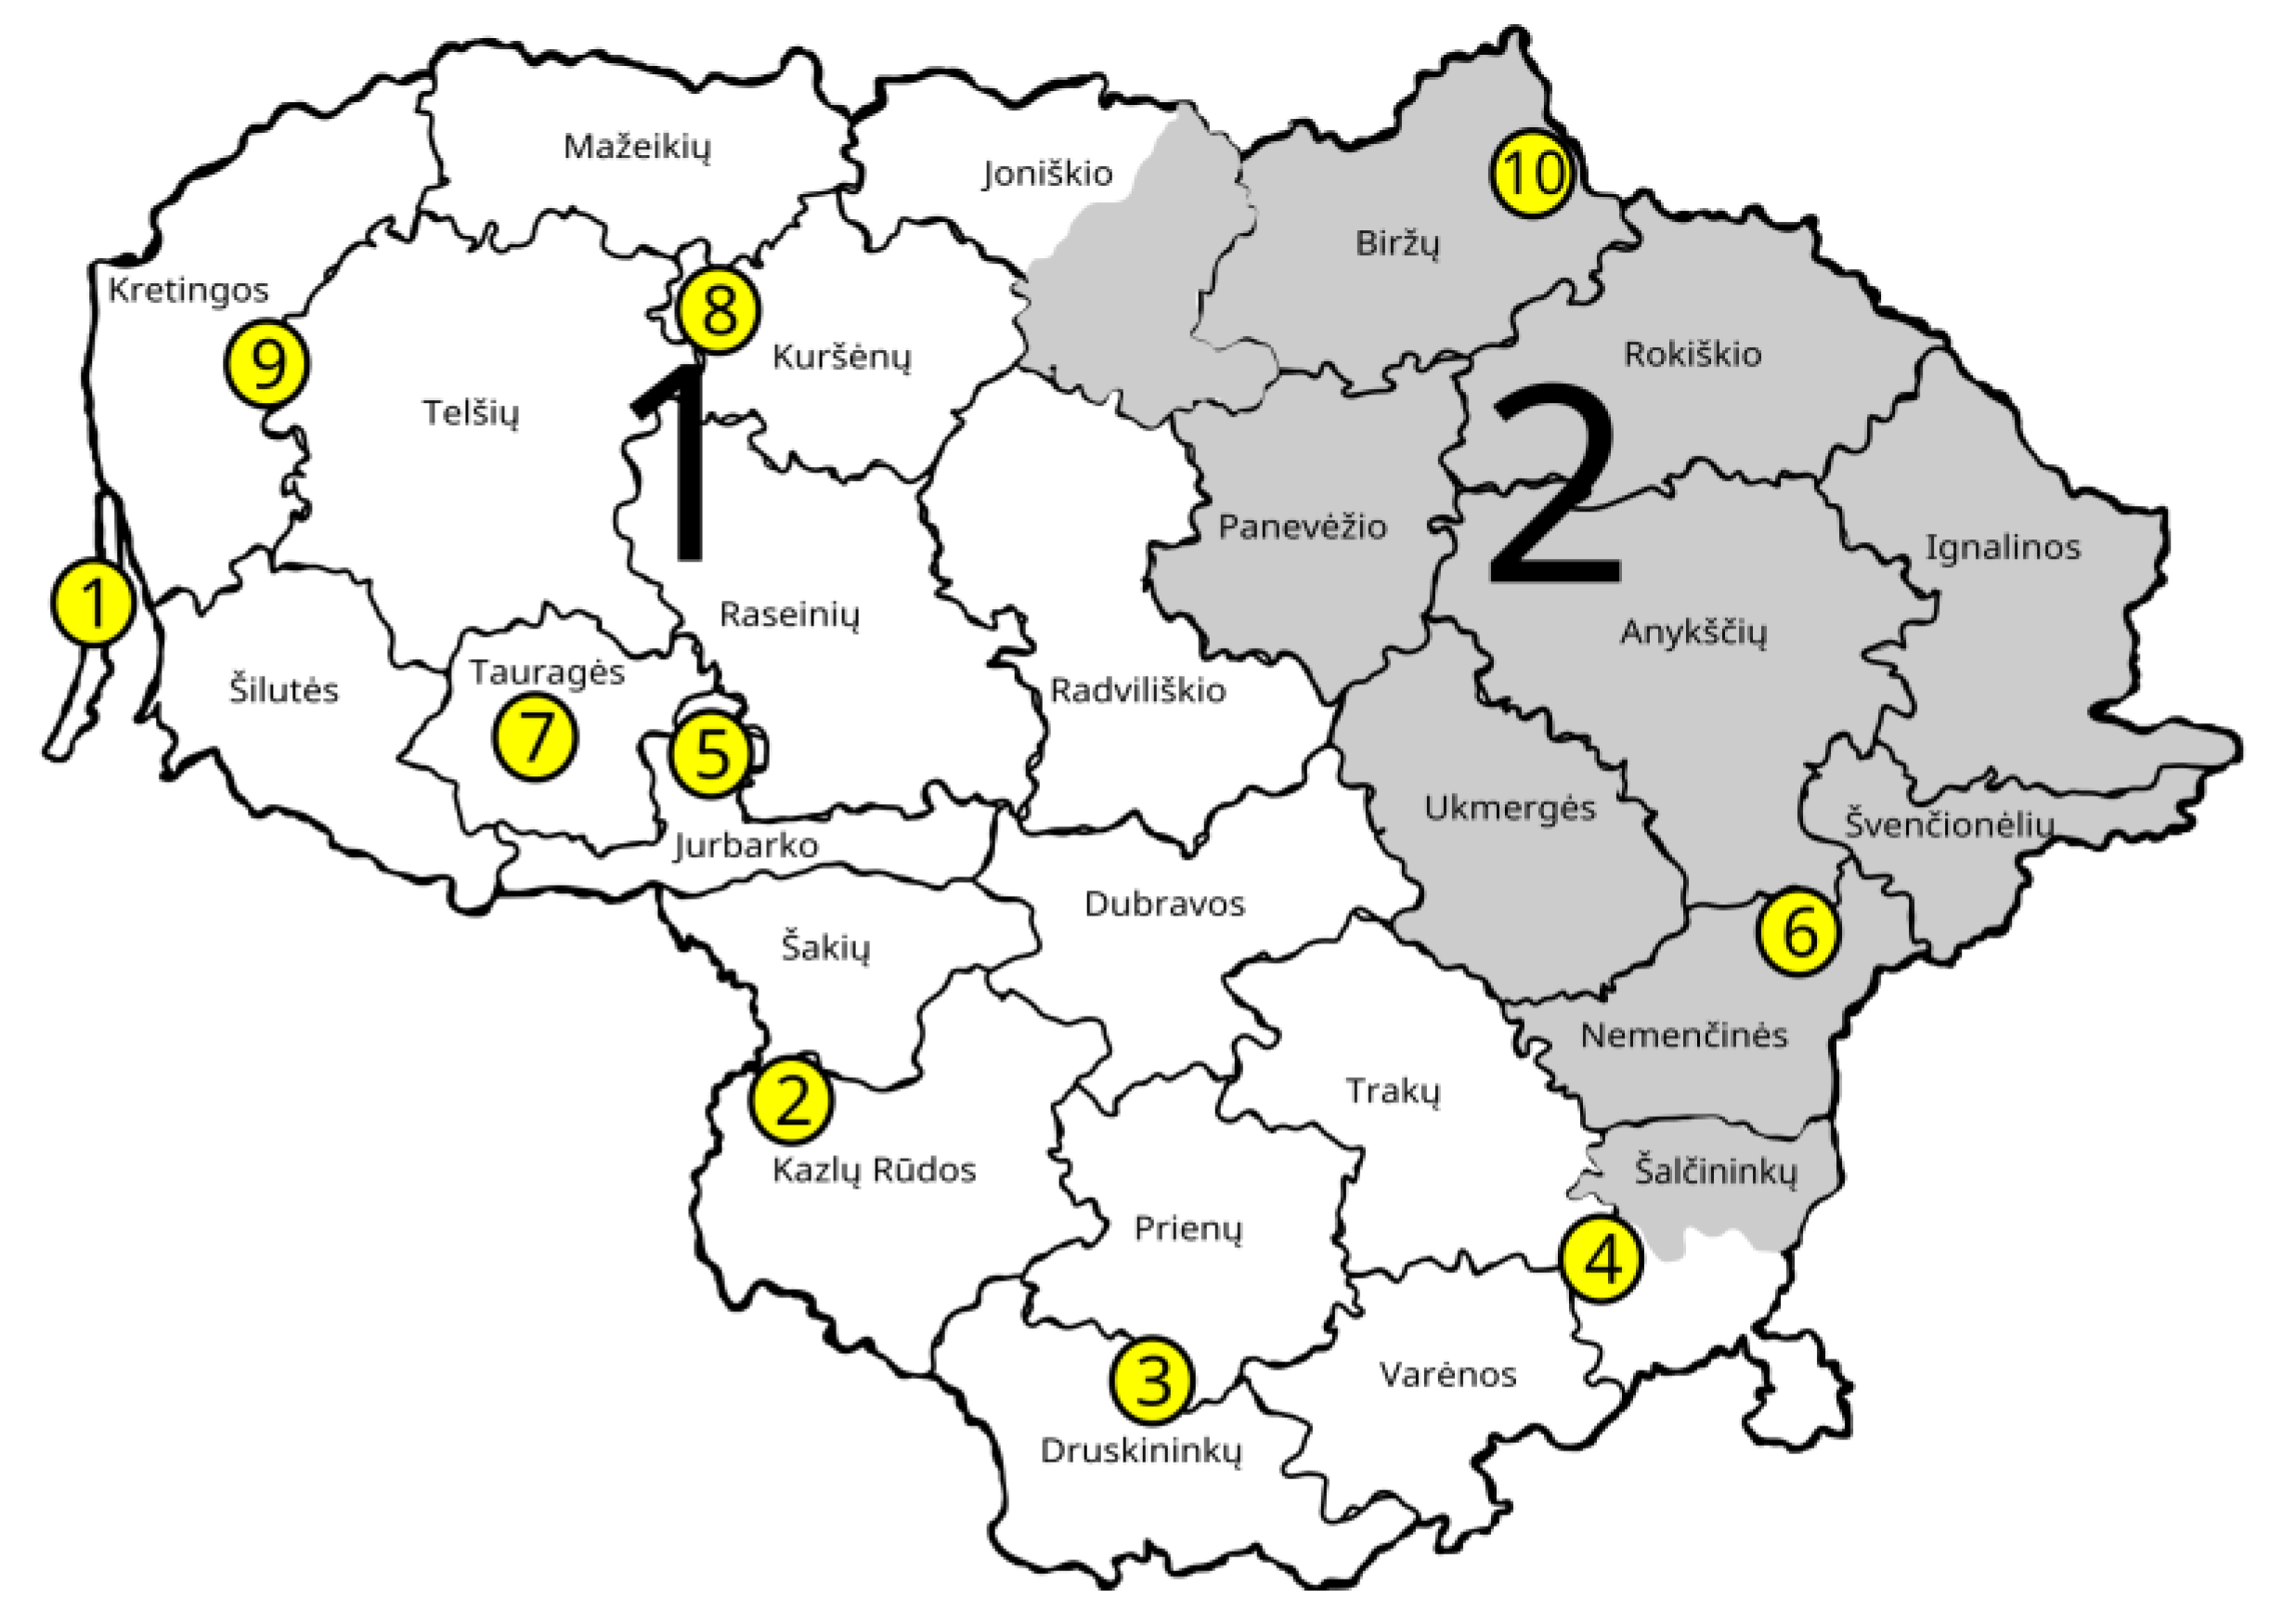
2. Materials and Methods

In this study, ten Genetic Conservation Units (GCUs) of black alder (Alnus glutinosa (L.) Gaertn. from the central native distribution range of the species in Lithuania were investigated. The studied GCUs represent naturally regenerated, mature stands, dominated by A. glutinosa. Half of the GCUs sampled for this study are seed stands (GCU type, where seeds for artificial regeneration and seedling production are gathered) and the rest are State Forest Genetic Reserves (GCU, where target forest species is conserved) (Table 1; Figure 1). There are two black alder provenance regions in Lithuania, and in this study the first is represented by eight populations, while the second is represented by two. The uneven sampling scheme reflects the distribution of A. glutinosa stands in Lithuania, which are mostly found in the central and southwestern parts of the country (first provenance region). Sampling of A. glutinosa was made in late summer–early autumn 2020.
The sample size per GCU was N = 30 mature trees (trees forming the canopy layer and of seed baring age) of the parental generation and N = 30 juveniles (naturally regenerated seedlings or young trees up to 15 years of age representing the progeny generation). The distance between two mature trees was at least 30 m in order to avoid sampling clones and to capture as much genetic diversity as possible. Juvenile trees were sampled in proximity (5–10 m radius) to mature trees (one juvenile tree close to one mature tree if present) (Supplementary File S1). Five of the sampled GCUs (VIL, GIR, SIM, BAT, SPA) had some parts of the stand selectively cut to promote natural regeneration. The management for natural regeneration promotion involved selective logging, creating narrow strips (approx. 30 m wide) of well-lit and scarified soil for easier regeneration of the target species. Selective logging was performed during mast years for black alder. The other five GCUs had no forest management practices promoting natural regeneration.
Cambium samples using an electric drill were collected from mature black alder trees. To cause as little damage as possible to the sampled tree, drillings of only up to 1 cm in depth on the tree trunk were made. The sawdust was collected to a marked 2 mL Eppendorf tube. For juvenile trees, three to four healthy leaves were collected in a plastic bag. The cambium samples for mature trees were collected, as sampling of leaves was difficult due to the tree height. The samples were transported to the laboratory on the same day of sampling, and samples were kept at −20 °C until DNA extraction.
Before DNA extraction, 100 ng of sawdust or 50 ng of leaf material was homogenized in liquid nitrogen using a mortar and pestle. The resulting powder was immediately transferred to a 1.5 mL microcentrifuge tube with a preheated to 55 °C extraction buffer. DNA extraction was made using a modified ATMAB extraction procedure [23]. A total of 1 mL of extraction buffer (2% (w/v) ATMAB, 1% (w/v) PVP 40.000, 100 mM Tris pH 8.0, 1.4 M NaCl, 20 mM EDTA) was used. Additionally, 50 µL of DTT (1 M) and 2 µL RNazeA (ThermoFisher Scientific, Waltham, MA, USA) was added. The sample was vortexed until homogeneous and incubated at 55 °C for 1 h, inverting the tube several times every 15 min. Samples were kept at 55 °C for another 15 h. After incubation, the samples were cooled down to room temperature and 400 µL of dichloromethane was added. The sample was vortexed and centrifuged at 13,000 rpm for 10 min at 4 °C in a tabletop centrifuge. The supernatant was transferred to a new 1.5 mL microcentrifuge tube and the dichloromethane cleaning step was repeated. The supernatant was again transferred to a new microcentrifuge tube and 400 µL of cold isopropanol was added. The samples were mixed by inverting the tube several times and kept at −20 °C for 12 h (overnight). Samples were centrifuged at 13,000 rpm at 4 °C for 10 min. The liquid was removed, and the DNA pellet was left to dry at room temperature for 5 min, inverting the tubes on the paper towel. The DNA pellet was washed with 1 mL of cold ethanol (76%), releasing the pellet from the bottom of the tube to the liquid and centrifuged at 13,000 rpm at 4 °C for 10 min. Ethanol was removed, the DNA was left to dry, and latter dissolved in 50 µL of 1×TE buffer. The concentration of extracted DNA was measured with a NanoDrop (Thermo Fisher Scientific) and adjusted to 50 ng/µL.
For this study, we used 20 polymorphic microsatellite loci that were amplified in two multiplex reactions, as described in Lepais and Balces [24] and Drašnarova et al. [25]. For PCR 2µL of template DNA, 7.5 µL of DreamTaq PCR MasterMix (Thermo Fisher Scientific) and 5 pmol of each primer was used. The final volume of the PCR mix was 15 µL. To check if the PCR was successful, 5µL of amplified PCR product was run on 1.5% 0.5 TAE agarose gel for 30 min. Amplified fragment sizes were compared to an MassRuller DNA ladder mix (Thermo Fisher Scientific). Microsatellite sizing was done using an ABI 3730XL sequencer made by Genoscreen Innovative Genomics (Lille, France). Scoring was done using Geneious Prime® version 2022.1.1 computer software (https://www.geneious.com, accessed on 15 August 2022).
The null alleles’ presence and scoring errors were evaluated using Microchecker software [26]. Genetic diversity parameters for A. glutinosa populations were calculated using the GenAlEx version 6.51b2 [27,28,29] and FSTAT [30] software packages. The effective population size was calculated with NeEstimator v 2.1. computer software [31], employing the Linkage disequilibrium method [32]. A Bayesian clustering approach was implemented using STRUCTURE version 2.3.4 [33,34,35,36] for inferring the most probable number of A. glutinosa populations. An admixture model with correlated allele frequencies was assumed and the maximum number of K tested was 21 (10 groups of mature and 10 groups of juvenile samples +1) with 10 replications for each K. The length of the burn-in period and the Monte Carlo Markov Chain (MCMC) was 100,000 iterations. The most likely number of populations was identified by the delta K (ΔK) criterion using STRUCTURE Harvester software [37]. Statistical differences of genetic parameters between different generations and managed and unmanaged black alder stands were calculated using a TTEST. The TTEST procedure for pairwise comparisons of the target groups was performed using SAS software (Version 9.4, Cary, NC, USA, 2012).

3. Results

3.1. DNA and Selected Marker Quality

The quality of extracted DNA from cambium and leaf samples were of comparable quality (on average, the A260/280 wavelength absorbance ratio was 1.71 and 1.93 for cambium and the leaf tissue samples, respectively). The difference between two sample types was in DNA concentration (DNA concentration of cambium samples varied from 15 ng/µL to 100 ng/µL (average 45 ng/µL, while the DNA concentration of leaf samples varied from 50 ng/µL to 850 ng/µL, 260 ng/µL on average).
All 20 microsatellite loci used for this study were polymorphic and amplified on average A = 16.55 alleles. The main characteristics of the loci investigated are given in Table 2. The number of amplified alleles among the loci varied from seven (locus A2) to 31 (locus Ag14). Most of the loci showed no signs of null allele presence (frequency ˂ 0.1), however the A7, Ag14 and Ag20 loci showed a possible presence of null alleles. The frequency of the null alleles in these loci is low to moderate (Table 2), and should not significantly influence the differentiation among investigated black alder populations [38]. The presence of null alleles has been reported in many population genetic studies [39], and is expected to be found in wide-spread tree species with large effective population sizes [38].

3.2. Genetic Diversity of Different Age Cohorts in A. glutinosa Populations

Genetic diversity coefficients, calculated for different A. glutinosa loci for mature and juvenile age cohorts used in this study, are given in Supplementary File S2. The number of different alleles per locus varied from 3.4 (Ag23 locus) to 13.3 (locus Ag14), and from 3.3 (A2 locus) to 13.9 (Ag35 locus) for juvenile and mature cohorts, respectively. The effective number of alleles in the juvenile cohort varied from 1.44 to 7.61 in Ag23 and Ag14 loci, and in the mature cohort from 1.41 to 7.36 in Ag20 and Ag13 loci, respectively. The observed heterozygosity was found to vary from 0.32 (locus A2) to 0.92 (locus Ag30) in juveniles and from 0.27 (locus Ag20) to 0.94 (locus Ag30) in the mature generation, while the expected heterozygosity varied from 0.30 (locus A2) to 0.85 (loci Ag13 and Ag14) and from 0.27 (locus Ag20) to 0.86 (loci Ag35 and Ag13) in juvenile and mature generations, respectively. The highest heterozygote deficiency (inbreeding coefficient) was found at locus Ag14 and was equal to 0.24 in juveniles and 0.30 in mature trees, while the highest homozygote deficiency was found in locus Ag25 and was −0.20 for juveniles and −0.56 in locus A2 in the mature cohort.
The effective number of alleles (Ne) and the allelic richness (based on 7 or 16 diploid individuals) calculated for mature and juvenile cohorts for each studied population were found to be higher in juvenile than in mature cohorts. The exception is the effective number of alleles in the Juodkrantė juvenile cohort, where Ne is slightly smaller. The observed and expected heterozygosity were found to be similar and varied in juveniles from 0.58 (JUO-J) to 0.81 (VIL-J) and from 0.68 (JUO-J) to 0.75 (SIM-J) for Ho and He, respectively. In the mature cohort, Ho and He varied from 0.63 (JUO-M) to 0.76 (SPA-M) and from 0.66 (JUO-M and PUR-M) to 0.71 (SPA-M) respectively. On average, observed and expected heterozygosity presented no statistically significant differences. In both juvenile and mature cohorts there were a high number of rare alleles (alleles with a frequency ≤ 0.05) observed. The general tendency (in eight out of ten populations) (Table 3) showed that there were more rare alleles in the juvenile cohort (on average 82.3 rare alleles vs. 304 alleles in total, or 27%) than in the mature (on average 72.7 alleles, or 24%) one. The exception concerns the PUR, SPA and JUO populations. There were also some unique (or private for the cohort) alleles observed. There was only one unique allele present in the PUR population that was found in both the juvenile and mature cohorts. The inbreeding coefficient for all cohorts was found to be close to zero (−0.001 on average), hence it can be concluded that the individuals within populations are mating randomly and that there is no excess or shortage of heterozygotes. Overall genetic diversity parameters, calculated for different generations (Ne, Ar, Ho, He, Rare alleles, Private alleles and F), presented no statistically significant differences between cohorts. Such differences were found only in the JUO population regarding the rare and private allele frequencies, as well as the number of alleles and in the VIL population regarding the observed heterozygosity.

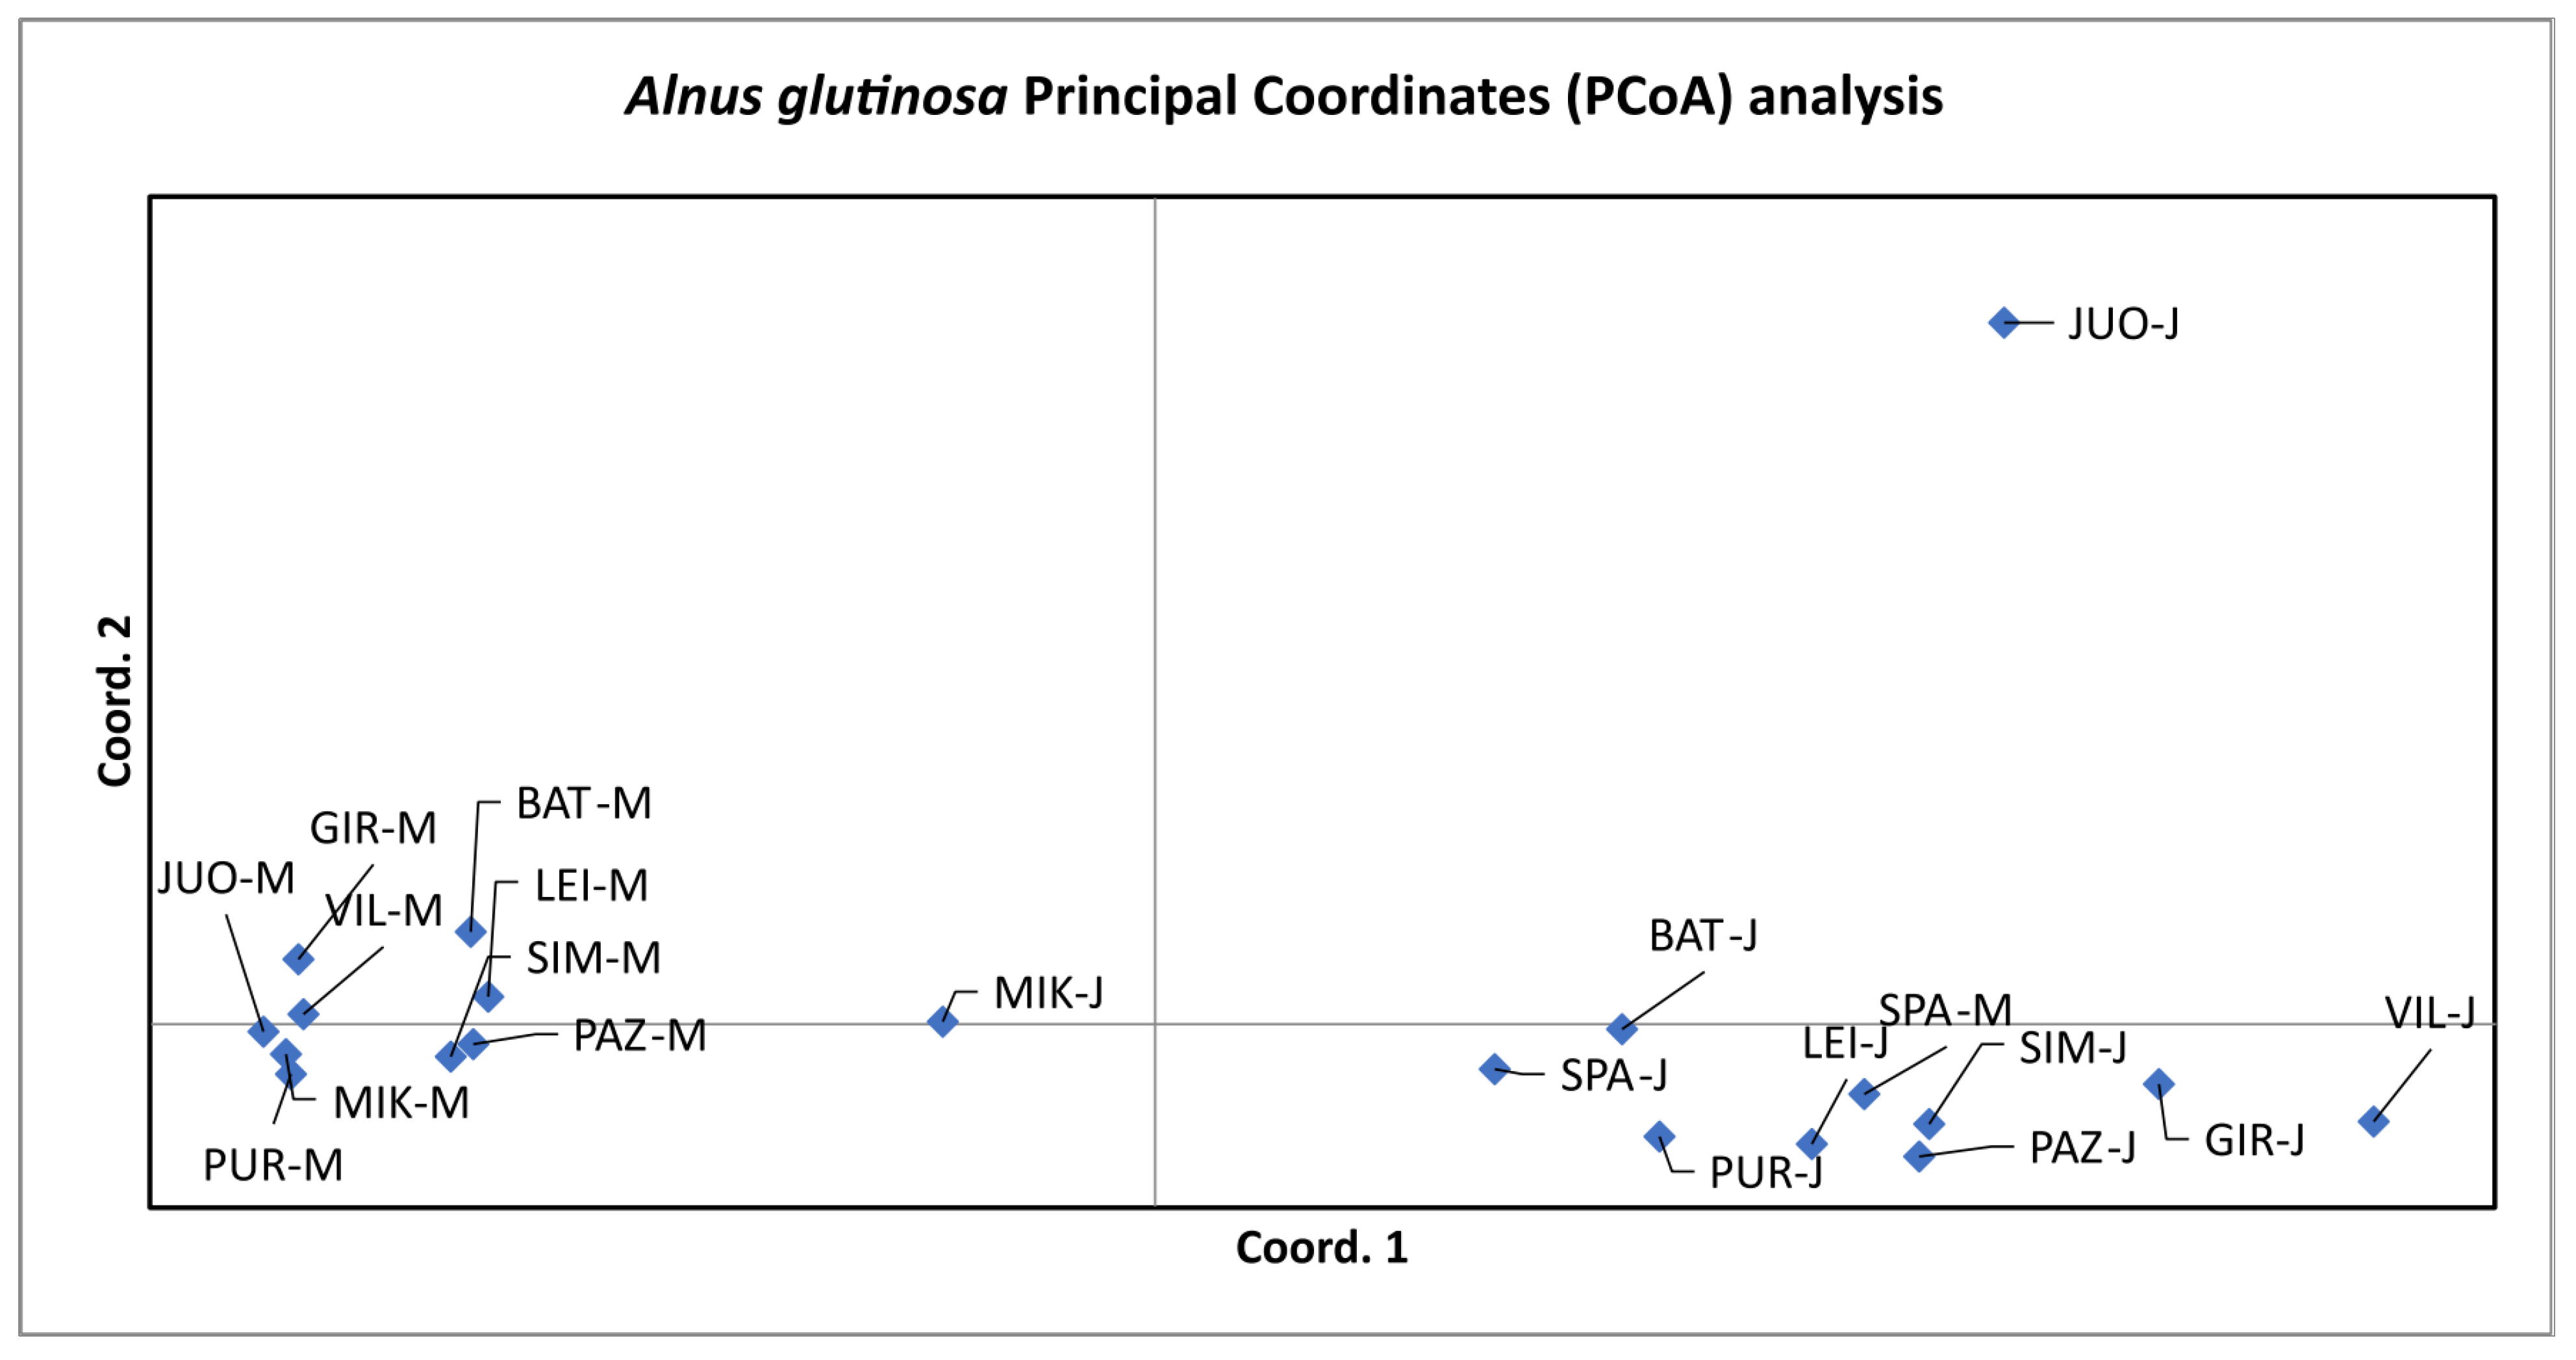
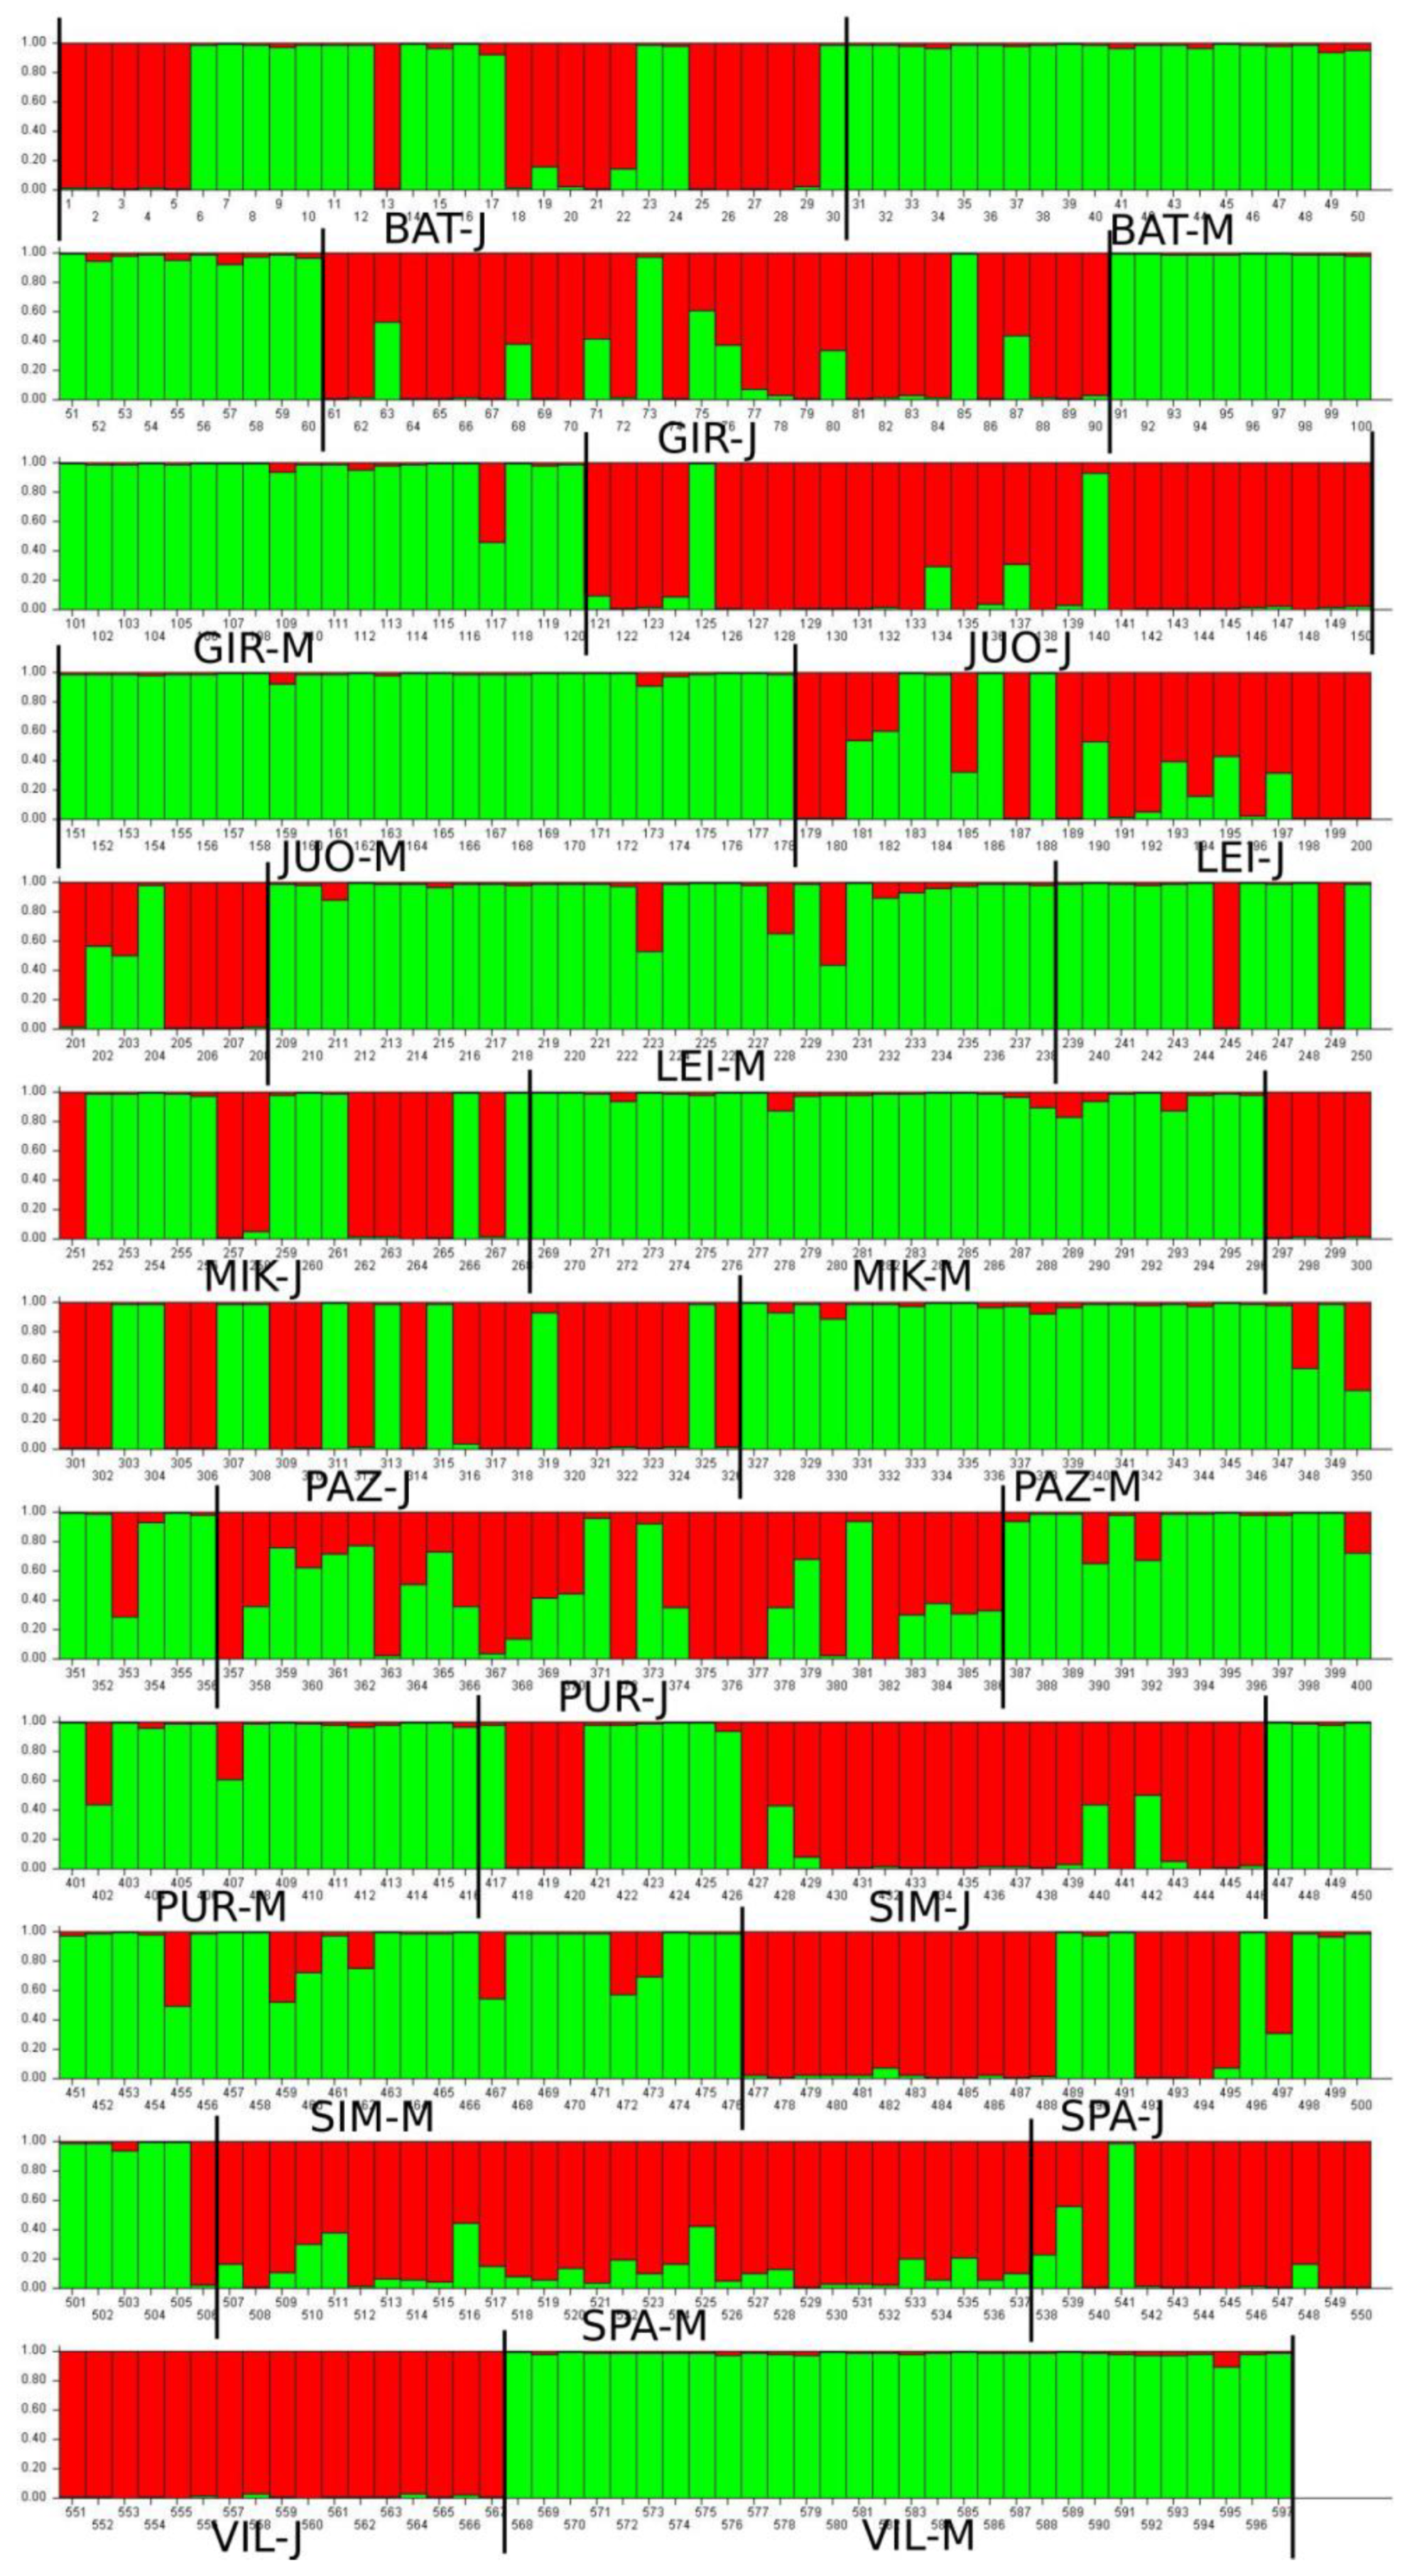
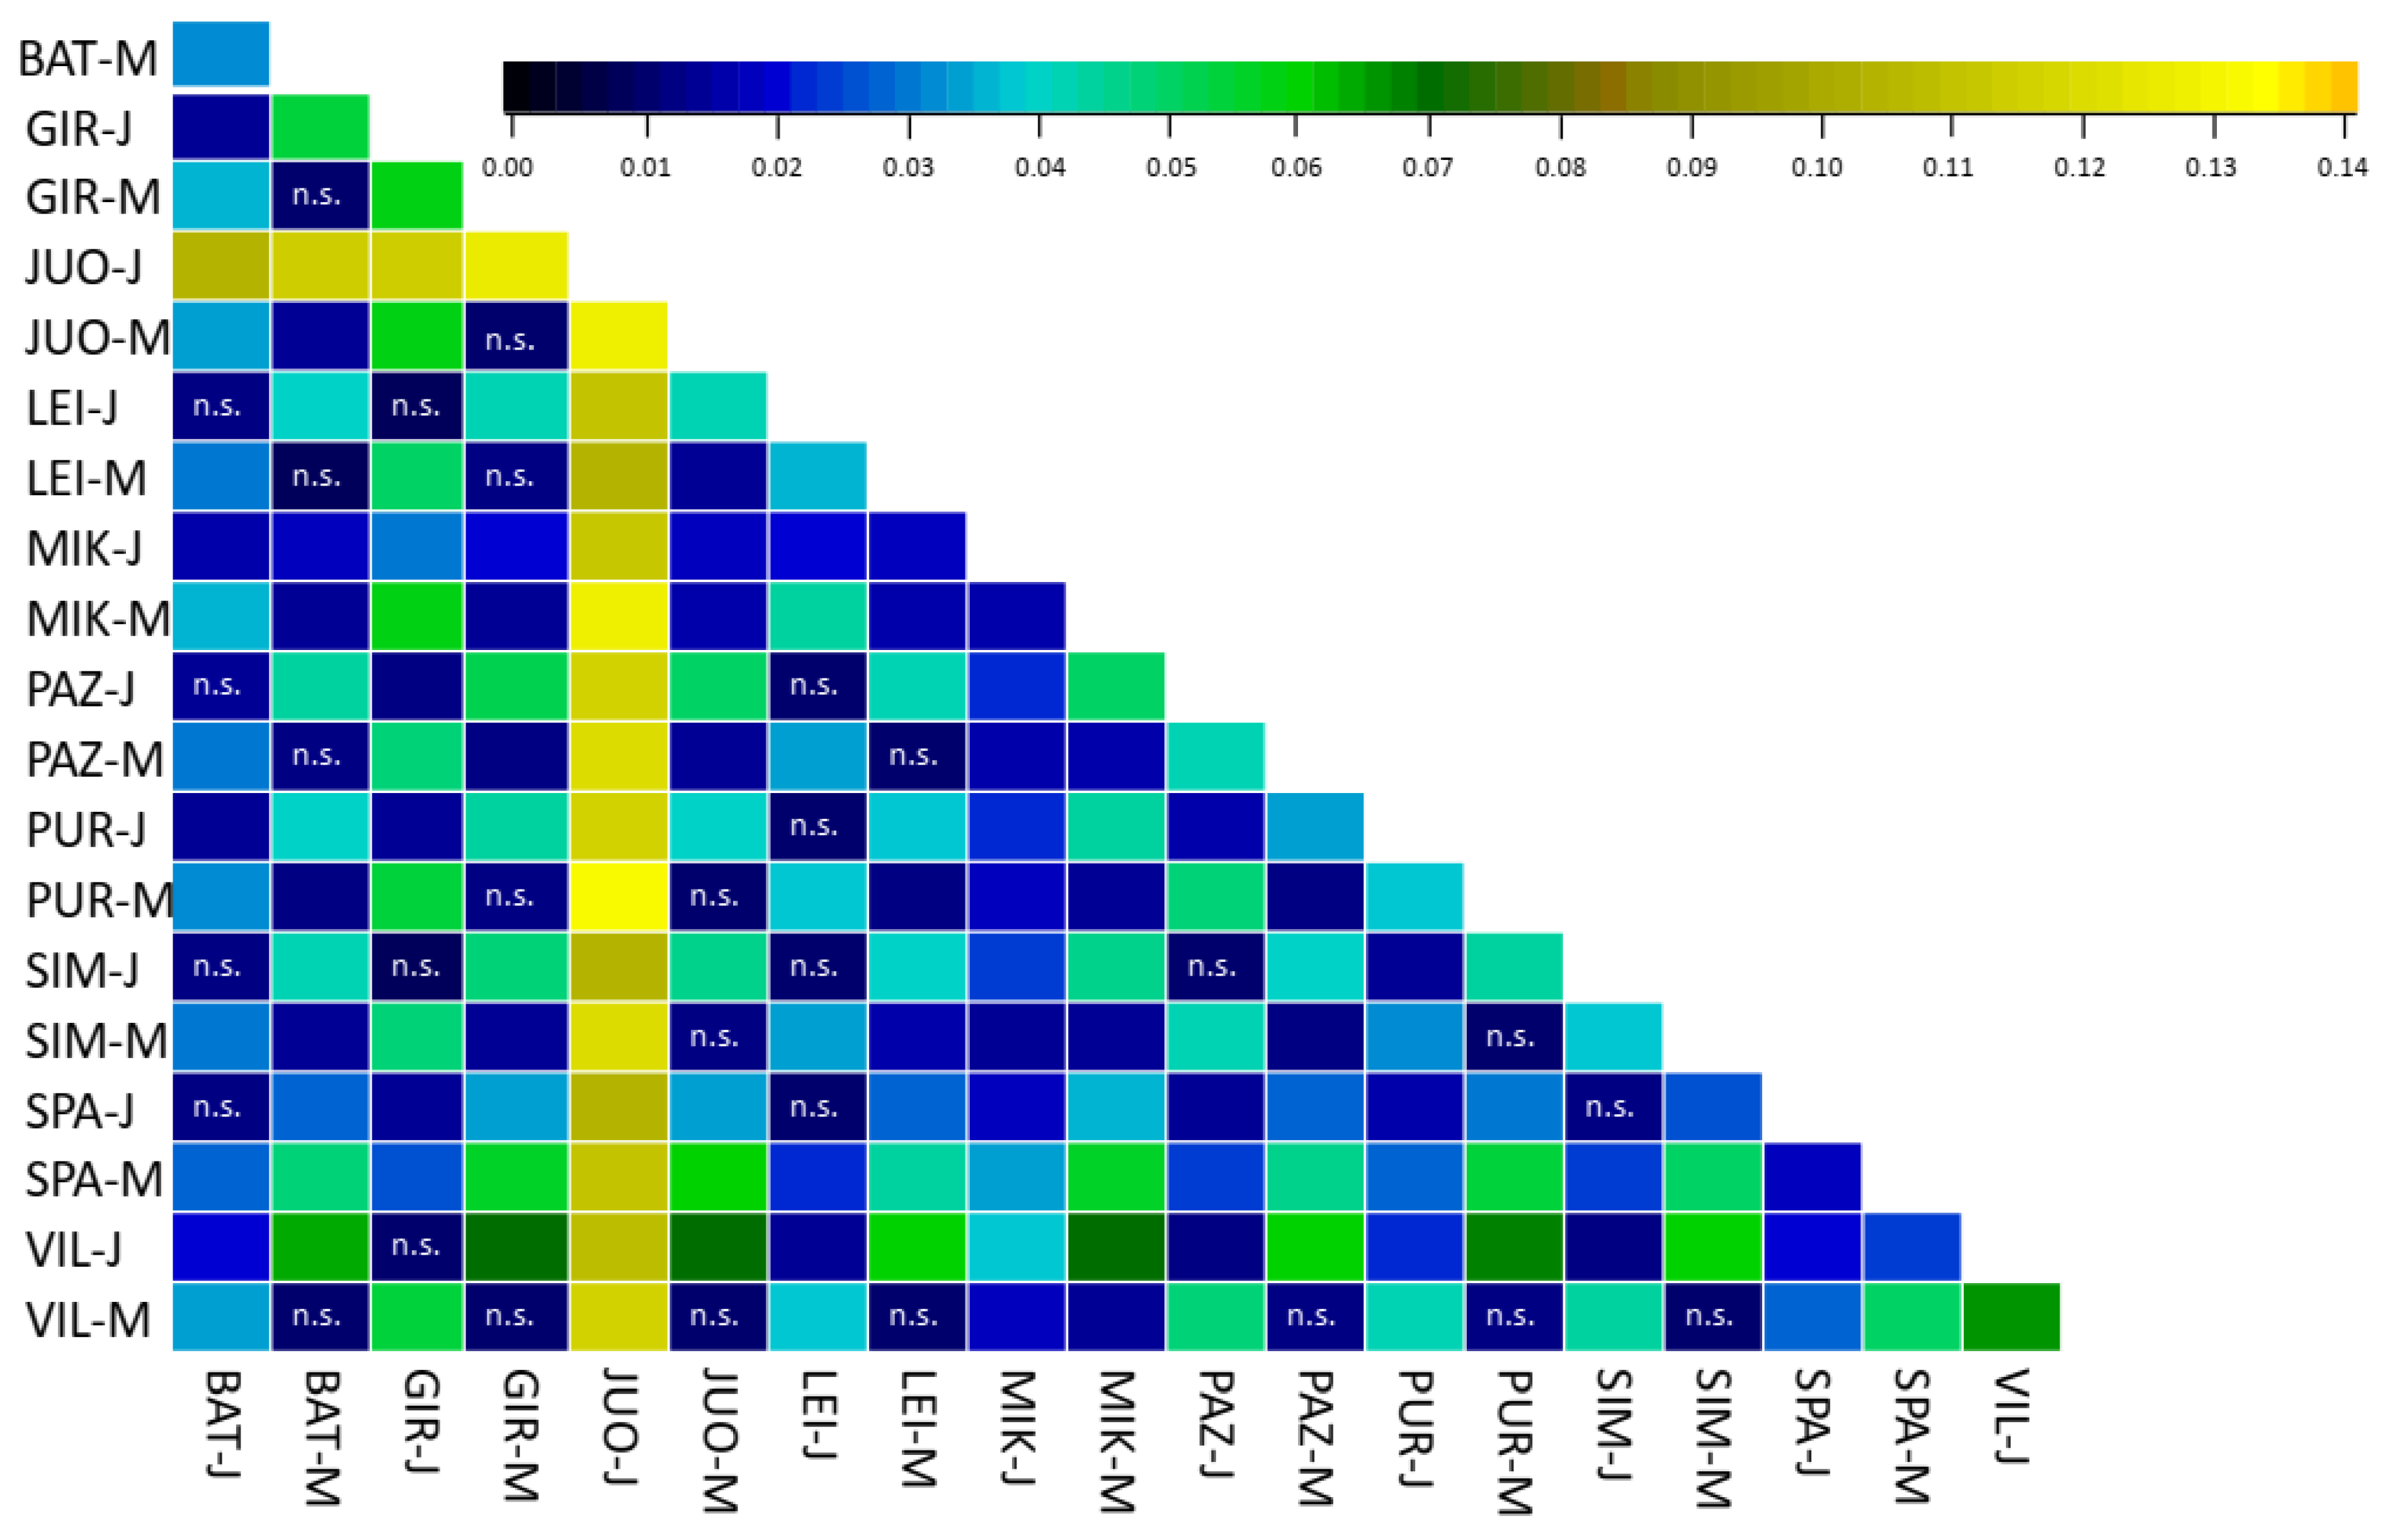
3.3. Population Differentiation

A principal coordinate analysis revealed that the mature cohorts of A. glutinosa are more similar among themselves than juvenile cohorts of the same population (Figure 2), forming a tight separate cluster. The only exception is SPA-M, which is clustered close to SPA-J in the vicinity of the juvenile cohorts. The JUO-J differs from all the other analysed populations, as well as from the JUO-M.
Very similar results were obtained after the STRUCTURE analysis (Figure 3). It revealed that two clusters of individuals are most likely to exist (K = 2; Supplement File S3), as determined by DeltaK [46]. Mature and juvenile cohorts in the STRUCTURE analysis histogram are grouped into different clusters, with only some admixed individuals (Figure 3).
Genetic differentiation between different age cohorts and populations are small but significant (Figure 4). The most distinctive concerns the Juodkrantė juvenile cohort
To check if GCU management practices to promote natural regeneration for black alder affects genetic diversity parameters, we compared juvenile cohorts’ genetic diversity parameters in managed (VIL, GIR, SIM, BAT, SPA) and unmanaged (JUO, LEI, PUR, PAZ, MIK) GCUs. Statistically significant differences were found for the inbreeding coefficient (0.0 and 0.12 for managed and unmanaged, respectively) and private alleles frequency (average frequency of private alleles for managed populations was 0.009 and for unmanaged it was 0.022).

4. Discussion

The present study confirmed the results of previous studies, where a high genetic diversity of North-Eastern black alder populations was discovered [14,19]. This study is in agreement with a trend observed for different plant species, according to which genetic diversity is lower and population differentiation increases towards the periphery of the species range [47]. Population differentiation is usually lower at the central distribution range, where the growth conditions for the species is optimal and where species density is expected to be high [47]. For some forest tree species it was shown that populations with high genetic diversity occur at intermediate latitudes in Central Europe [48], as species survived the last glacial maximum (LGM) in several refugia [14,49,50,51,52,53], and during the expansion different lineages met in secondary contact zones where extensive admixture occurred. For A. glutinosa it was found that it survived LGM in the Iberian, Apennine, Balkan and Anatolian peninsulas, in Corsica, and in north Africa [16,54]; furthermore there is strong evidence of a Carpathian [14] and a north-eastern Europe (possibly in Belarus and western Russia) refugium [55]. The post glacial migration reconstruction revealed three main migration routes and two secondary contact zones: lineages from western Europe and the Carpathians met in central Europe, and western and eastern European populations formed the second admixture zone, from where Scandinavia was colonized [14]. Therefore, black alder populations in Lithuania were expected to be genetically diverse, and to exhibit low but significant differentiation. The obtained results by Bayesian analysis (Figure 3) of A. glutinosa populations here are concordant with the results of multivariate analysis (Figure 2). The identified null allele presence in moderate frequencies in three out of 20 investigated loci for A. glutinosa populations (Table 2) should not have led to the overestimation of population differentiation, as simulations on empirical data sets showed that it occurs only when the investigated populations are significantly differentiated or when gene flow among populations is low [38]. The results of the present study confirm the expectations, as Lithuanian black alder populations exhibit a high level of heterozygosity (on average 0.70), an allelic richness of 5.77 (for full data set) or 7.33 (using 19 loci data), and the mean number of rare alleles per age cohort is 55 (Table 3). The population differentiation in Lithuania varies from 0.008 to 0.131, while the lowest statistically significant difference was found to be 0.11 (between BAT-M–PUR-M, GIR-M–PAZ-M and SIM-J–VIL-J) (Figure 4). The mean differentiation among populations and different generations was found to be 0.37. A similar but somewhat lower black alder population differentiation was found among 24 Central European populations (from Belgium, France, Denmark and Italy) studied using SNP markers [20]. A slightly higher A. glutinosa population differentiation (0.089 on average) was found in Poland, where 11 populations were studied using isozyme markers [56]. The AFLP analysis of 35 A. glutinosa populations from 10 European countries revealed a mean population differentiation of 0.057, which the FST values varied from 0.115 to 0.571 [15]. Moreover, the A. glutinosa population differentiation found in Ireland varied from 0.034 to 0.078 for nuclear microsatellite loci [18].
The main aim of the present study was to compare the genetic diversity of the mature cohort with the genetic diversity of the juvenile cohort (progeny generation) of autochthonous protected black alder populations. Our results show that genetic diversity parameters are not significantly different between the mature and juvenile cohorts. The latent genetic potential calculated is higher in the juvenile cohort for most (80%) of the investigated populations (excluding SPA and BAT) (Table 3). The effective population size calculated for mature and juvenile cohorts is of sufficient magnitude to ensure sufficient genetic diversity transfer to future generations [57]. This result, as well as the absence of statistically significant differences in genetic diversity parameters, clearly shows that, at least for the time being, black alder populations in Lithuania are not under threat. The inbreeding coefficient F in the juvenile cohort is lower when compared to the mature cohort and shows no inbreeding (Table 3). The only exception is the Juodkrantė (JUO) population, where a higher but statistically not significant inbreeding coefficient difference was found, and where the effective population size of the juvenile generation causes concern. The Juodkrantė population differs the most from the others, probably due to the geographical location. This population is situated in the Kuršių Nerija peninsula, is of small size, and has a limited ability to exchange genes with the A. glutinosa populations from the mainland. This A. glutinosa GCU still complies with the minimum requirements for dynamic conservation units of forest tree genetic diversity [58,59]. However, natural regeneration in the JUO population is sparse, and some management measures should be taken to promote it. Habitat fragmentation and on-going climate change is known to be a threat for even highly adaptable forest tree species that can’t cope with the synergistic effects of habitat reduction and climate change [2,3,4,5]. Nevertheless, it seems that up-to-date climate change has not affected population genetic diversity per se in the black alder populations of Lithuania.
By comparing the genetic diversity parameters in the mature and juvenile cohorts of black alder populations that were left to regenerate naturally and populations where natural regeneration was promoted by forest management actions, we have shown that such specific forest management practices had no effect on genetic diversity. This shows that careful planning and the timely execution of small-scale logging to promote natural regeneration helps to conserve A. glutinosa populations and the genetic diversity harbored therein. The only statistically significant differences found between managed and unmanaged stands were the difference in inbreeding coefficient (0.000 for managed and 0.115 for unmanaged populations) and private alleles frequency (average frequency of private alleles for managed populations was 0.009, and for unmanaged populations was 0.022). As the inbreeding is lower in managed populations, more progenies from a higher number of individuals can be expected. The private alleles’ frequency differences most likely occurred due to chance alone. The number of rare alleles found in managed populations was higher than in unmanaged ones (27% vs. 24%, respectively).
Lithuania presents a highly suitable area for black alder [12], where this typically scattered species is not only found along the streams and rivers, but it forms pure stands as well. In contrast to Pinus sylvestris and Picea abies, the main commercial timber species that are mostly artificially regenerated, a high proportion of black alder stands in Lithuania (60%) is left to be naturally regenerated [60]. Our results show that natural regeneration with or without human intervention by forest management is enough to maintain genetic diversity across generations. Besides Lithuania, there are several natural black alder populations in Europe that have not been subjected to intensive forest management and are therefore of great interest for population differentiation and conservation genetics studies, especially since the future of the riparian ecosystems that harbour black alder is uncertain [61].

5. Conclusions

The black alder populations that have been used in this study largely present significant genetic diversity and are genetically diverse, therefore they should be protected and conserved. The above results in conjunction to the lack of significant genetic differences among different generations (population cohorts), show that the black alder GCUs in Lithuania generally form an excellent platform for the protection of the species’ genetic diversity. Low but significant differentiation among black alder populations shows the need to maintain and not reduce the existing network of black alder GCUs. The populations of particular conservation priority should be:
(1) Leipalingis (LEI), where both the mature and the juvenile cohorts present a relatively high effective population size coupled with a considerable value for LGP.
(2) The Juodkrantė (JUO) population, where juvenile generation exhibits the most unique genetic diversity, and the juvenile cohort was found to have more private and rare alleles and higher latent genetic potential than the mature generation. It should be set as a conservation priority to maintain genetic diversity of the mature cohort and to restore genetic diversity in the juvenile cohort where the effective population size estimate is alarmingly low.
(3) Mikoliškės (MIK), with a priority to restore genetic diversity in the juvenile cohort where the effective population size estimate is low.
Forest management practices where A. glutinosa natural regeneration is promoted does not show a negative effect on genetic diversity parameters. Such management practices should be employed in the future when black alder GCUs’ natural regeneration is poor. Selective logging should be carried out during the mast years, when a large amount of A. glutinosa seeds is available.

Supplementary Materials

The following supporting information can be downloaded at: https://www.mdpi.com/article/10.3390/f14020330/s1, File S1: Sampling schemes of Alnus glutinosa populations; File S2: Genetic diversity coefficients, calculated for different Alnus glutinosa age cohorts; File S3: ΔK calculations of the second order rate of change of likelihood.

Author Contributions

Conceptualization, R.V., F.A.A. and V.B.; methodology, R.V., F.A.A. and V.B.; validation, R.V. and V.B.; analysis, R.V., V.B. and A.J.; investigation R.V., V.B. and A.J.; data curation, A.J.; writing—original draft preparation, R.V. and V.B.; writing—review and editing, R.V., F.A.A. and V.B.; visualization, R.V.; supervision, F.A.A.; project administration, R.V.; funding acquisition, R.V. and F.A.A. All authors have read and agreed to the published version of the manuscript.

Funding

This project has received funding from European Social Fund project No. 09.3.3-LMT-K-712-19-0093 under Grant Agreement with the Research Council of Lithuania (LMTLT), and supports a post-doctoral program for R. Verbylaitė under the supervision of F. A. Aravanopoulos.

Data Availability Statement

The datasets generated and analysed during the current study are available from the corresponding author on reasonable request.

Conflicts of Interest

The authors declare no conflict of interest.

References

  1. Kremer, A.; Potts, B.M.; Delzon, S. Genetic divergence in forest trees: Understanding the consequences of climate change. Funct. Ecol. 2014, 28, 22–36. [Google Scholar] [CrossRef]
  2. Barry, W.; Brook, B.W.; Sodhi, N.S.; Bradshaw, C.J.A. Synergies among extinction drivers under global change. Trends Ecol. Evol. 2008, 23, 453–460. [Google Scholar] [CrossRef]
  3. Hof, C.; Levinsky, I.; Araújo, M.B.; Rahbek, C. Rethinking species’ ability to cope with rapid climate change. Glob. Chang. Biol. 2011, 17, 2987–2990. [Google Scholar] [CrossRef]
  4. Meier, E.S.; Lischke, H.; Schmatz, D.R.; Zimmermann, N. Climate, competition and connectivity affect future migration and ranges of European trees. Glob. Ecol. Biogeogr. 2012, 21, 164–178. [Google Scholar] [CrossRef]
  5. Vranckx, G.; Jacquemyn, H.; Muys, B.; Honnay, O. Meta-analysis of susceptibility of woody plants to loss of genetic diversity through habitat fragmentation. Conserv. Biol. 2012, 26, 228–237. [Google Scholar] [CrossRef] [PubMed]
  6. Aravanopoulos, F.A.; Bajc, M.; Fussi, B.; Kraigher, H. Introduction. In Manual for Forest Genetic Monitoring; Bajc, M., Aravanopoulos, F., Westergren, M., Fussi, B., Kavaliauskas, D., Alizoti, P., Kiourtsis, F., Kraigher, H., Eds.; Slovenian Forestry Institute, Silva Slovenica Publishing Centre: Ljubljana, Slovenia, 2020; pp. 11–14. [Google Scholar]
  7. Aravanopoulos, F.A. Genetic monitoring in natural perennial plant populations. Botany, 2011, 89, 75–81. [Google Scholar] [CrossRef]
  8. McVean, D.N. Alnus glutinosa (L.) Gaertn. J. Ecol. 1953, 41, 4472466. [Google Scholar] [CrossRef]
  9. Chambers, F.M.; Elliott, L. Spread and Expansion of Alnus Mill. In the British Isles: Timing, Agencies and Possible Vectors. J. Biogeogr. 1989, 16, 541–550. [Google Scholar] [CrossRef]
  10. Kajba, D.; Gračan, J. EUFORGEN Technical Guidelines for Genetic Conservation and Use for Black Alder (Alnus glutinosa); International Plant Genetic Resources Institute: Rome, Italy, 2003; pp. 1–4. [Google Scholar]
  11. Glenz, C.; Schlaepfer, R.; Iorgulescu, I.; Kienast, F. Flooding tolerance of Central European tree and shrub species. For. Ecol. Manag. 2006, 235, 1–13. [Google Scholar] [CrossRef]
  12. Houston Durrant, T.; de Rigo, D.; Caudullo, G. Alnus glutinosa in Europe: Distribution, habitat, usage and threats. In European Atlas of Forest Tree Species; San-Miguel-Ayanz, J., de Rigo, D., Caudullo, G., Houston Durrant, T., Mauri, A., Eds.; Public Office EU: Luxembourg, 2016; p. e01f3c0+. [Google Scholar]
  13. Ozolinčius, R. Alnus gentis. Alnus glutinosa. [Genus Alnus. Alnus glutinosa]. In Lietuvos Dendroflora [Dendroflora of Lithuania]; Navasaitis, M., Ozolinčius, R., Smaliukas, D., Balevičienė, J., Eds.; Lututė: Vilnius, Lithuania, 2003; p. 576. [Google Scholar]
  14. Havrdová, A.; Douda, J.; Krak, K.; Vít, P.; Hadincová, V.; Zákravský, P.; Mandák, B. Higher genetic diversity in recolonized areas than in refugia of Alnus glutinosa triggered by continent-wide lineage admixture. Mol. Ecol. 2015, 24, 4759–4777. [Google Scholar] [CrossRef]
  15. Cox, K.; Vanden Broeck, A.; Van Calster, H.; Mergeay, J. Temperature-related natural selection in a wind-pollinated tree across regional and continental scales. Mol. Ecol. 2011, 20, 2724–2738. [Google Scholar] [CrossRef] [PubMed]
  16. Lepais, O.; Muller, S.D.; Ben Saad-Limam, S.; Benslama, M.; Rhazi, L.; Belouahem-Abed, D.; Daoud-Bouattour, A.; Gammar, A.M.; Ghrabi-Gammar, Z.; Bacles, C.F.E. High genetic diversity and distinctiveness of rear-edge climate relicts maintained by ancient tetraploidisation for Alnus glutinosa. PLoS ONE 2013, 8, 75029. [Google Scholar] [CrossRef] [PubMed]
  17. Mingeot, D.; Husson, C.; Mertens, P.; Watillon, B.; Bertin, P.; Druart, P. Genetic diversity and genetic structure of black alder(Alnus glutinosa [L.] Gaertn) in the Belgium-Luxembourg-Francecross-border area. Tree Genet. Genomes 2016, 12, 24. [Google Scholar] [CrossRef]
  18. Beatty, G.E.; Montgomery, W.I.; Tosh, D.G.; Provan, J. Genetic provenance and best practice woodland management: A case study in native alder (Alnus glutinosa). Tree Genet. Genomes 2015, 11, 1–7. [Google Scholar] [CrossRef]
  19. Mandák, B.; Vít, P.; Krak, K.; Trávníček, P.; Havrdová, A.; Hadincová, V.; Zákravský, P.; Jarolímová, V.; Bacles, C.F.; Douda, J. Flow cytometry, microsatellites and niche models reveal the origins and geographical structure of Alnus glutinosa populations in Europe. Ann. Bot. 2016, 117, 107–120. [Google Scholar] [CrossRef] [PubMed]
  20. De Kort, H.; Vandepitte, K.; Bruun, H.H.; Closset-Kopp, D.; Honnay, O.; Mergeay, J. Landscape genomics and a common garden trial reveal adaptive differentiation to temperature across Europe in the tree species Alnus glutinosa. Mol. Ecol. 2014, 23, 4709–4721. [Google Scholar] [CrossRef]
  21. Caudullo, G.; Welk, E.; San-Miguel-Ayanz, J. Chorological maps for the main European woody species. Data Brief 2017, 12, 662–666. [Google Scholar] [CrossRef]
  22. Forest resources. In Lithuanian Statistical Yearbook of Forestry; State Forestry Srvice: Kaunas, Lithuania, 2021; pp. 12–25.
  23. Dumolin, S.; Demesure, B.; Petit, R.J. Inheritance of chloroplast and mitochondrial genomes in pedunculated oak investigated with an efficient PCR method. Ther. Appl. Genet. 1995, 91, 1253–1256. [Google Scholar] [CrossRef]
  24. Lepais, O.; Bacles, C.F.E. De novo discovery and multiplexed amplification of microsatellite markers for black alder (Alnus glutinosa) and related species using SSR-enriched shotgun pyrosequencing. J. Hered. 2011, 102, 627–632. [Google Scholar] [CrossRef]
  25. Drašnarová, A.; Krak, K.; Vít, P.; Doudová, J.; Douda, J.; Hadincová, V.; Zákravský, P.; Mandák, B. Cross-amplification and multiplexing of SSR markers for Alnus glutinosa and A. incana. Tree Genet. Genomes 2014, 10, 865–873. [Google Scholar] [CrossRef]
  26. Van Oosterhout, C.; Hutchison, W.F.; Wills, D.P.M.; Shipley, P. Micro-checker: Software for identifying and correcting genotyping errors in microsatellite data. Mol. Ecol. Notes 2004, 4, 535–538. [Google Scholar] [CrossRef]
  27. Peakall, R.; Smouse, P.E. GENALEX 6: Genetic analysis in Excel. Population genetic software for teaching and research. Mol. Ecol. Notes 2006, 6, 288–295. [Google Scholar] [CrossRef]
  28. Peakall, R.; Smouse, P.E. GenAlEx 6.5: Genetic analysis in Excel. Population genetic software for teaching and research-an update. Bioinformatics 2012, 28, 2537–2539. [Google Scholar] [CrossRef] [PubMed]
  29. Smouse, P.E.; Banks, S.C.; Peakall, R. Converting quadratic entropy to diversity: Both animals and alleles are diverse, but some are more diverse than others. PLoS ONE 2017, 12, e0185499. [Google Scholar] [CrossRef]
  30. Goudet, J. FSTAT (Version 1.2): A Computer Program to Calculate F-Statistics. J. Hered. 1995, 86, 485–486. [Google Scholar] [CrossRef]
  31. Do, C.; Waples, R.S.; Peel, D.; Macbeth, G.M.; Tillett, B.J.; Ovenden, J.R. NeEstimator v2: Re-implementation of software for the estimation of contemporary effective population size (Ne) from genetic data. Mol. Ecol. Resour. 2014, 14, 209–214. [Google Scholar] [CrossRef]
  32. Waples, R.S.; Do, C. Linkage disequilibrium estimates of contemporary N e using highly variable genetic markers: A largely untapped resource for applied conservation and evolution. Evol. Appl. 2010, 3, 244–262. [Google Scholar] [CrossRef]
  33. Pritchard, J.K.; Stephens, M.; Donnelly, P. Inference of population structure using multilocus genotype data. Genetics 2000, 155, 945–959. [Google Scholar] [CrossRef]
  34. Falush, D.; Stephens, M.; Pritchard, J.K. Inference of Population Structure Using Multilocus Genotype data: Linked Loci and Correlated Allele Frequencies. Genetics 2003, 164, 1567–1587. [Google Scholar] [CrossRef]
  35. Falush, D.; Stephens, M.; Pritchard, J.K. Inference of population structure using multilocus genotype data: Dominant markers and null alleles. Mol. Ecol. Notes 2007, 7, 574–578. [Google Scholar] [CrossRef]
  36. Hubisz, M.J.; Falush, D.; Stephens, M.; Pritchard, J.K. Inferring weak population structure with the assistance of sample group information. Mol. Ecol. Res. 2009, 9, 1322–1332. [Google Scholar] [CrossRef] [PubMed]
  37. Earl, D.A.; vonHoldt, B.M. STRUCTURE HARVESTER: A website and program for visualizing STRUCTURE output and implementing the Evanno method. Conserv. Genet. Resour. 2012, 4, 359–361. [Google Scholar] [CrossRef]
  38. Chapuis, M.P.; Estoup, A. Microsatellite null alleles and estimation of population differentiation. Mol. Biol. Evol. 2007, 24, 621–631. [Google Scholar] [CrossRef] [PubMed]
  39. Dakin, E.E.; Avise, J.C. Microsatellite null alleles in parentage analysis. Heredity 2004, 93, 504–509. [Google Scholar] [CrossRef] [PubMed]
  40. Wu, B.; Lian, C.; Hogetsu, T. Development of microsatellite markers in white birch (Betula platyphylla var. japonica). Mol. Ecol. 2002, 3, 413–415. [Google Scholar] [CrossRef]
  41. Gürcan, K.; Mehlenbacher, S.A.; Botta, R.; Boccacci, P. Development, characterization, segregation, and mapping of microsatellite markers for European hazelnut (Corylus avellana L.) from enriched genomic libraries and usefulness in genetic diversity studies. Tree Genet. Genomes 2010, 6, 513–531. [Google Scholar] [CrossRef]
  42. Kulju, K.K.M.; Pekkinen, M.; Varvio, S. Twenty-three microsatellite primer pairs for Betula pendula (Betulaceae). Mol. Ecol. Notes 2004, 4, 471–473. [Google Scholar] [CrossRef]
  43. Tsuda, Y.; Ueno, S.; Ide, Y.; Tsumura, Y. Development of 14 ESTSSRs for Betula maximowicziana and their applicability to related species. Conserv. Genet. 2009, 10, 661–664. [Google Scholar] [CrossRef]
  44. Ogyu, K.; Tsuda, Y.; Sugaya, T.; Yoshimaru, H.; Ide, Y. Identification and characterization of microsatellite loci in Betula maximowicziana Regel. Mol. Ecol. Notes 2003, 3, 268–269. [Google Scholar] [CrossRef]
  45. Tsuda, Y.; Ueno, S.; Ranta, J.; Salminen, K.; Ide, Y.; Shinohara, K.; Tsumura, Y. Development of 11 EST-SSRs for Japanese white birch, Betula platyphylla var. japonica and their transferability to related species. Conserv. Genet. 2009, 10, 1385–1388. [Google Scholar] [CrossRef]
  46. Evanno, G.; Regnaut, S.; Goudet, J. Detecting the number of clusters of individuals using the software STRUCTURE: A simulation study. Mol. Ecol. 2005, 14, 2611–2620. [Google Scholar] [CrossRef] [PubMed]
  47. Eckert, C.G.; Samis, K.E.; Lougheed, S.C. Genetic variation across species’ geographical ranges: The central-marginal hypothesis and beyond. Mol. Ecol. 2008, 17, 1170–1188. [Google Scholar] [CrossRef] [PubMed]
  48. Petit, R.J.; Aguinagalde, I.; de Beaulieu, J.L.; Bittkau, C.; Brewer, S.; Cheddadi, R.; Ennos, R.; Fineschi, S.; Grivet, D.; Lascoux, M.; et al. Glacial refugia: Hotspots but not melting pots of genetic diversity. Science 2003, 300, 1563–1565. [Google Scholar] [CrossRef] [PubMed]
  49. Petit, R.J.; Brewer, S.; Bordács, S.; Burg, K.; Cheddadi, R.; Coart, E.; Cottrell, J.; Csaikl, U.M.; van Dam, B.; Deans, J.D.; et al. Identification of refugia and post-glacial colonisation routes of European white oaks based on chloroplast DNA and fossil pollen evidence. For. Ecol. Manag. 2002, 156, 49–74. [Google Scholar] [CrossRef]
  50. Heuertz, M.; Fineschi, S.; Anzidei, M.; Pastorelli, R.; Salvini, D.; Paule, L.; Frascaria-Lacoste, N.; Hardy, O.J.; Vekemans, X.; Vendramin, G.G. Chloroplast DNA variation and postglacial recolonization of common ash (Fraxinus excelsior L.) in Europe. Mol. Ecol. 2004, 13, 3437–3452. [Google Scholar] [CrossRef]
  51. Liepelt, S.; Cheddadi, R.; de Beaulieu, J.L.; Fady, B.; Gömöry, D.; Hussendörfer, E.; Konnert, M.; Litt, T.; Longauer, R.; Terhürne-Berson, R.; et al. Postglacial range expansion and its genetic imprints in Abies alba (Mill.)—A synthesis from palaeobotanic and genetic data. Rev. Palaeobot. Palynol. 2009, 153, 139–149. [Google Scholar] [CrossRef]
  52. Ganopoulos, I.; Aravanopoulos, F.A.; Argiriou, A.; Kalivas, A.; Tsaftaris, A. Is the genetic diversity of small scattered forest tree populations at the southern limits of their range more prone to stochastic events? A wild cherry case study by microsatellite-based markers. Tree Genet. Genomes 2011, 7, 1299–1313. [Google Scholar] [CrossRef]
  53. Cornille, A.; Giraud, T.; Bellard, C.; Tellier, A.; Le Cam, B.; Smulders, M.J.M.; Kleinschmit, J.; Roldan-Ruiz, I.; Gladieux, P. Postglacial recolonization history of the European crabapple (Malus sylvestris Mill.), a wild contributor to the domesticated apple. Mol. Ecol. 2013, 22, 2249–2263. [Google Scholar] [CrossRef]
  54. King, A.; Ferris, C. Chloroplast DNA phylogeography of Alnus glutinosa (L.) Gaertn. Mol. Ecol. 1998, 7, 1151–1161. [Google Scholar] [CrossRef]
  55. Douda, J.; Doudova, J.; Drašnarová, A.; Kuneš, P.; Hadincová, V.; Krak, K.; Zákravský, P.; Mandak, B. Migration patterns of subgenus Alnus in Europe since the Last Glacial Maximum: A systematic review. PLoS ONE 2014, 9, 88709. [Google Scholar] [CrossRef]
  56. Mejnartowicz, L. Genetic variation within and among naturally regenerating populations of alder (Alnus glutinosa). Acta Soc. Bot. Ploniae 2008, 77, 105–110. [Google Scholar] [CrossRef]
  57. Palstra, F.P.; Ruzzante, D.E. Genetic estimates of contemporary effective population size: What can they tell us about the importance of genetic stochasticity for wild population persistence? Mol. Ecol. 2008, 17, 3428–3447. [Google Scholar] [CrossRef] [PubMed]
  58. Koskela, J.; Lefèvre, F.; Schueler, S.; Kraigher, H.; Olrik, D.C.; Hubert, J.; Longauer, R.; Bozzano, M.; Yrjänä, L.; Alizoti, P.; et al. Translating conservation genetics into management: Pan-European minimum requirements for dynamic conservation units of forest tree genetic diversity. Biol Conserv, 2013, 157, 39–49. [Google Scholar] [CrossRef]
  59. De Vries, S.M.G.; Alan, M.; Bozzano, M.; Burianek, V.; Collin, E.; Cottrell, J.; Ivankovic, M.; Kelleher, C.T.; Koskela, J.; Rotach, P.; et al. Pan-European Strategy for Genetic Conservation of Forest Trees and Establishment of a Core Network of Dynamic Conservation Units; European Forest Genetic Resources Programme (EUFORGEN), Bioversity International: Rome, Italy, 2015; p. xii + 40. [Google Scholar]
  60. Silviculture. In Lithuanian Statistical Yearbook of Forestry; State Forestry Srvice: Kaunas, Lithuania, 2021; pp. 105–115.
  61. Capon, S.J.; Chambers, L.E.; Mac Nally, R.; Naiman, R.J.; Davies, P.; Marshall, N.; Pittock, J.; Reid, M.; Capon, T.; Douglas, M.; et al. Riparian ecosystems in the 21st century: Hotspots for climate change adaptation? Ecosystems 2013, 16, 359–381. [Google Scholar] [CrossRef]
Figure 1. Sampling locations of natural A. glutinosa populations (GCUs) used in this study. Population names 1–JUO, 2–VIL, 3–LEI, 4–GIR, 5–SIM, 6–PUR, 7–BAT, 8–PAZ; 9–MIK; 10–SPA. White and grey areas represent different provenance regions for black alder in Lithuania.
Forests 14 00330 g001
Figure 2. Principal coordinate analysis of mature and juvenile cohorts of 10 A. glutinosa populations. The first axis explains 47.63% of the total variation, while the second explains 31.98%.
Forests 14 00330 g002
Figure 3. Genetic structure of A. glutinosa populations as identified by STRUCTURE. Each sampled tree is identified as a vertical bar, where a color denotes the part of the genome that belongs to each of the most probable clusters (K = 2).
Forests 14 00330 g003
Figure 4. Heat map of pairwise FST values among all A. glutinosa populations and age cohorts. n.s.: no statistical significance.
Forests 14 00330 g004
Table 1. A. glutinosa GCUs sampled for this study.
Population Abbrev.GCU CodeFull Name of GCUNo of Trees Sampled; Total (Mature, Juvenile)Regional Division of State Forest Enterprise and Forest DistrictSpecies Composition in the GCU *Coordinates
Latitude and Longitude
JUO35JSM037Juodkrantė seed stand58 (28, 30)Kretinga r.d., Juodkrantė100% A. glutinosa55°36′30.8988″ 21°7′54.8004″
VIL33JGD008Žalioji forest black alder genetic reserve60 (30, 30)Kazlų Rūda r.d., Vilkaviškis100% A. glutinosa54°43′7.284″ 22°57′25.0914″
LEI03JSM049Leipalingis seed stand60 (30, 30)Veisiejai r.d., Leipalingis90% A. glutinosa, 10% B. pendula54°10′37.704″ 23°48′10.0074″
GIR32JSM040Giria seed stand60 (30, 30)Šalčininkai r.d., Girios100% A. glutinosa54°24′44.17142″ 5°3′15.552″
SIM17JGD019Šimkaičiai forest black alder genetic reserve60 (30, 30)Raseiniai r.d., Šimkaičiai80% A. glutinosa, 10% B. pendula, 10% P. abies55°11′40.416″
22°50′9.672″
PUR31JSM030Purviniškės seed stand60 (30, 30)Nemenčinės r.d., Purviniškės100% A. glutinosa55°0′55.224″ 25°37′39.108″
BAT18JGD018Bijotai forest black alder genetic reserve60 (30, 30)Tauragė r.d., Batakiai100% A. glutinosa55°20′9.564″ 22°28′23.232″
PAZ53JGD005/006Tryškiai forest black alder genetic reserve60 (30, 30)Kuršėnai r.d., Pažiužmėliai100% A. glutinosa56°3′28.9434″ 22°43′11.8914″
MIK60JSM044Mikoliškės seed stand58(28, 30)Kretinga r.d., Mikoliškės100% A. glutinosa55°47′57.804″ 21°29′43.8354″
SPA01JGD001Biržai Forest black alder genetic reserve61 (31, 30)Biržai r.d., Spalviškės90% A. glutinosa, 10% B. pendula56°15′38.1594″ 24°58′55.308″
* Names of the regional divisions and forest districts are given as of 31 December 2022.
Table 2. Characteristics of A. glutinosa loci used in this study. Na–average allele number; Ne–effective number of alleles; Ho–observed heterozygosity; He–expected heterozygosity, F–inbreeding coefficient.
LocusRepeat Motif Size in bpNo of AllelesNaNeAllele Interval in bpMost Common Allele and Its FrequencyThe Frequency of Null Alleles HoHeFPrimer Source Reference
A2273.50 ± 0.201.67 ± 0.08132–148144 (0.70)−0.11690.53 ± 0.060.36 ± 0.030.00 ± 0.07[40]
A222158.55 ± 0.255.24 ± 0.22151–181165 (0.23)0.03780.78 ± 0.030.80 ± 0.020.03 ± 0.03[41]
A102126.60 ± 0.373.96 ± 0.23107–133119 (0.29)0.02560.75 ± 0.030.73 ± 0.02−0.02 ± 0.02[42]
A352169.95 ± 0.305.19 ± 0.25216–242228 (0.33)0.09430.67 ± 0.020.80 ± 0.010.16 ± 0.02[43]
A383158.95 ± 0.332.86 ± 0.1597–151121 (0.54)−0.05340.72 ± 0.030.63 ± 0.02−0.13 ± 0.02[43]
A72136.10 ± 0.292.49 ± 0.22168–200174 (0.54)0.12760.52 ± 0.050.53 ± 0.04−0.01 ± 0.06[44]
A372179.30 ± 0.284.81 ± 0.22239–275257 (0.29)0.06970.71 ± 0.030.78 ± 0.010.10 ± 0.04[45]
A2621911.60 ± 0.276.14 ± 0.21341–377353 (0.26)0.05550.75 ± 0.020.83 ± 0.010.10 ± 0.02[41]
Ag302159.20 ± 0.315.00 ± 0.1876–114100 (0.20)−0.04150.93 ± 0.010.80 ± 0.01−0.17 ± 0.02[24]
Ag052169.55 ± 0.256.45 ± 0.23136–168154 (0.17)0.03240.81 ± 0.030.84 ± 0.010.04 ± 0.03[24]
Ag102166.60 ± 0.371.75 ± 0.16205–249217 (0.76)0.01540.40 ± 0.030.38 ± 0.03−0.04 ± 0.02[24]
Ag1423112.45 ± 0.456.18 ± 0.36271–341289 (0.26)0.15040.60 ± 0.030.83 ± 0.010.27 ± 0.03[24]
Ag272157.10 ± 0.323.10 ± 0.1474–112102 (0.47)−0.00970.72 ± 0.040.66 ± 0.02−0.07 ± 0.04[24]
Ag3522313.25 ± 0.426.83 ± 0.34164–214174 (0.19)0.01410.86 ± 0.010.84 ± 0.01−0.02 ± 0.02[24]
Ag1321711.50 ± 0.427.48 ± 0.36243–283273 (0.17)0.01330.87 ± 0.020.85 ± 0.02−0.02 ± 0.02[24]
Ag252239.10 ± 0.363.82 ± 0.2173–131103 (0.24)0.0170.80 ± 0.030.73 ± 0.01−0.10 ± 0.05[24]
Ag092218.35 ± 0.265.32 ± 0.17200–264244 (0.26)0.00420.81 ± 0.020.81 ± 0.01−0.01 ± 0.02[24]
Ag202196.75 ± 0.632.94 ± 0.39283–333305 (0.56)0.18250.45 ± 0.050.52 ± 0.060.09 ± 0.04[24]
Ag012127.30 ± 0.183.90 ± 0.16126–188130 (0.36)−0.01280.80 ± 0.030.73 ± 0.02−0.09 ± 0.03[24]
Ag23293.50 ± 0.122.31 ± 0.06336–370356 (0.54)0.10420.45 ± 0.030.56 ± 0.010.20 ± 0.05[24]
Table 3. Genetic diversity parameters calculated for A. glutinosa populations and for different generations. Ne–effective number of alleles; Ar–allelic richness, based on seven diploid individuals and all 20 loci (Ar based on 16 individuals and 19 loci (Ag23 loci removed); Ho–observed heterozygosity; He–expected heterozygosity; F–inbreeding coefficient; LGP–latent genetic potential, calculated as multilocus average.
Population
Cohort
NeArHoHeRare Alleles
No/Freq.
Private Alleles
No/Freq.
FEffective Pop Size (95% CI)LGP
JUO-J3.89 ± 0.415.68 ± 0.36 (7.27 ± 0.45)0.58 ± 0.050.68 ± 0.0387/4.50 ± 0.3314/0.75 ± 0.190.15 ± 0.059.6 (8.8)4.56 ± 0.37
JUO-M4.00 ± 0.425.09 ± 0.37 (6.76 ± 0.54)0.63 ± 0.050.66 ± 0.0557/4.85 ± 0.453/0.15 ± 0.080.03 ± 0.05740.3 (176.8)3.70 ± 0.41
VIL-J4.83 ± 0.495.51 ± 0.36 (7.85 ± 0.51)0.81 ± 0.040.74 ± 0.0390/5.25 ± 0.446/0.30 ± 0.13−0.11 ± 0.04583.9 (206.5)4.42 ± 0.40
VIL-M4.01 ± 0.444.84 ± 0.35 (6.88 ± 0.55)0.65 ± 0.050.67 ± 0.0476/4.85 ± 0.422/0.10 ± 0.070.01 ± 0.051515 (243.3)3.99 ± 0.44
LEI-J4.81 ± 0.485.09 ± 0.32 (8.15 ± 0.52)0.74 ± 0.040.74 ± 0.04106/5.10 ± 0.434/0.20 ± 0.09−0.02 ± 0.0497.4 (73.8)4.89 ± 0.47
LEI-M4.34 ± 0.504.95 ± 0.38 (7.41 ± 0.56)0.68 ± 0.050.70 ± 0.0494/4.80 ± 0.433/0.15 ± 0.080.01 ± 0.06174.7 (110.2)4.61 ± 0.40
GIR-J4.69 ± 0.445.68 ± 0.36 (7.66 ± 0.50)0.75 ± 0.050.73 ± 0.0476/5.40 ± 0.453/0.15 ± 0.08−0.04 ± 0.05248.6 (133.8)4.16 ± 0.53
GIR-M3.88 ± 0.405.22 ± 0.39 (6.46 ± 0.49)0.67 ± 0.050.67 ± 0.0457/5.00 ± 0.390−0.02 ± 0.065731.9 (241.8)3.47 ± 0.36
SIM-J4.86 ± 0.445.39 ± 0.31 (7.81 ± 0.48)0.75 ± 0.040.75 ± 0.0382/5.60 ± 0.402/0.10 ± 0.07−0.01 ± 0.03190.1 (116.0)4.19 ± 0.37
SIM-M4.39 ± 0.535.10 ± 0.36 (7.45 ± 0.57)0.67 ± 0.050.68 ± 0.0476/5.35 ± 0.4600.01 ± 0.03221.3 (122.9)4.06 ± 0.39
PUR-J4.30 ± 0.415.25 ± 0.35 (7.41 ± 0.43)0.75 ± 0.050.71 ± 0.0478/5.45 ± 0.393/0.15 ± 0.08−0.06 ± 0.04109.7 (77.0)4.05 ± 0.40
PUR-M4.11 ± 0.464.92 ± 0.34 (7.01 ± 0.51)0.65 ± 0.050.66 ± 0.0582/4.80 ± 0.501/0.05 ± 0.050.01 ± 0.04184.0 (107.9)4.04 ± 0.39
BAT-J4.98 ± 0.485.34 ± 0.33 (7.81 ± 0.49)0.70 ± 0.040.74 ± 0.0476/5.95 ± 0.461/0.05 ± 0.050.05 ± 0.0393.4 (68.2)3.77 ± 0.40
BAT-M4.18 ± 0.465.04 ± 0.38 (7.02 ± 0.51)0.71 ± 0.040.69 ± 0.0468/5.05 ± 0.500−0.05 ± 0.04760.7 (200.1)3.87 ± 0.43
PAZ-J4.40 ± 0.395.64 ± 0.34 (7.13 ± 0.51)0.72 ± 0.050.71 ± 0.0472/5.10 ± 0.362/0.10 ± 0.07−0.02 ± 0.0383.5 (62.4)3.85 ± 0.41
PAZ-M3.93 ± 0.405.34 ± 0.40 (6.75 ± 0.46)0.66 ± 0.050.68 ± 0.0470/4.85 ± 0.433/0.15 ± 0.080.02 ± 0.06720.8 (194.4)3.87 ± 0.33
MIK-J4.29 ± 0.385.62 ± 0.36 (7.56 ± 0.47)0.65 ± 0.040.72 ± 0.0386/5.05 ± 0.301/0.05 ± 0.050.08 ± 0.0448.1 (39.6)4.41 ± 0.42
MIK-M4.02 ± 0.405.43 ± 0.42 (7.07 ± 0.50)0.66 ± 0.050.68 ± 0.0471/4.65 ± 0.373/0.15 ± 0.110.002 ± 0.05400.7 (155.9)4.18 ± 0.33
SPA-J4.89 ± 0.495.61 ± 0.35 (7.71 ± 0.47)0.71 ± 0.050.73 ± 0.0470/5.40 ± 0.442/0.10 ± 0.070.02 ± 0.0475.8 (57.4)3.71 ± 0.44
SPA-M4.66 ± 0.514.98 ± 0.38 (7.46 ± 0.63)0.76 ± 0.050.71 ± 0.0476/4.80 ± 0.402/0.10 ± 07−0.09 ± 0.05355.6 (170.8)3.93 ± 0.47
Mean/total4.37 ± 0.105.77 ± 0.33 (7.33 ± 0.12)0.70 ± 0.010.70 ± 0.011550 (77.5)55 (2.75)−0.001 ± 0.01--
Disclaimer/Publisher’s Note: The statements, opinions and data contained in all publications are solely those of the individual author(s) and contributor(s) and not of MDPI and/or the editor(s). MDPI and/or the editor(s) disclaim responsibility for any injury to people or property resulting from any ideas, methods, instructions or products referred to in the content.

