Abstract
Fanjing Mountain, China, is a World Man and Biosphere Reserve, a World Natural Heritage Property, and a Nature Reserve in China. Mites communities have been reported from the Fanjing Mountain. Wetland moss microhabitats provide a unique habitat for mites, and our objective is to document moss mites communities in the subalpine wetlands of Fanjing Mountain (Jiulongchi), with a particular focus on trends in moss mites at different stages of vegetation succession in the wetlands, which have rarely been described, and the research will provide fundamental data for biodiversity conservation in the face of global climate change. The succession sequence from bryophyte (hygrophyte) to shrub (mesophyte or xerophyte) in the open area of Jiulongchi wetland successively includes Polytrichum commune Hedw. (PC), Eleocharis yokoscensis (Franch. et Sav.) Tang et-Cypers sp. (EY-C), Senecio faberii Hemsl (SF), and Indocalamus longiauritus Hand.-Mazz. (IL) four typical communities. In April 2016, we collected moss samples under the four typical communities mentioned above, and analyzed the difference of moss mite communities using PCA, Kruskal–Wallis nonparametric test, and ANOVA. The results showed the following: (1) A total of 9058 moss mites belonging to 49 genera in 3 orders and 69 families were captured in the four plant communities, with the moss mites Parachipteria, Fuscozetes, and Tectocepheus being the dominant taxa of moss mites in Jiulongchi wetland. The core taxa of moss mites at different successional stages were 12 genera, with IL having the largest number of exclusive taxa (20 genera). (2) The abundance of moss mites showed an overall increasing trend from PC to IL habitats, with the number of families and genera showing a pattern of IL > EY-C > SF > PC. The diversity index SF habitat possessed the maximum value, followed by IL, both of which were significantly different from PC. (3) The results of PCA analysis of moss mites showed that the mite community composition of PC habitats differed more from SF and IL, respectively, and less from EY-C. (4) There existed differences in the ecological taxa of predatory moss mites at different successional stages, with the Poronota group dominating the ecological taxa of oribatida. The research indicated that moss mites communities in subalpine wetlands were rich in species composition, and with the succession of vegetation from hygrophyte to mesophyte or xerophyte, the moss mites group as a whole develops in a direction favorable to its diversity, and the differences in moss mites ecological taxa also demonstrated the variability and complexity of the Jiulongchi wetland environment. This research presents the distribution pattern of moss mites in different vegetation succession stages in subtropical subalpine herbaceous wetlands. The moss mites evolution trend in response to climate-change-induced plant community succession needs further investigation.
1. Introduction
The most critical value of ecosystems is their ability to provide multiple functions and services simultaneously, but this value is affected by changes in biodiversity [1]. Relevant studies show that protecting the natural ecological environment is the most effective way to maintain biodiversity and corresponding ecological functions and services [2]. The Fanjing Mountain World Natural Heritage Property exhibits and preserves the unique biological and ecological evolutionary features of isolated mountains in the central subtropics; it is the most biodiversity-rich terrestrial unit on Earth, and is one of the global hotspots for biodiversity conservation. Its unique natural geography and relatively low human disturbance intensity provide habitats and refuges for many rare and endangered plants and animals [3]. Six Class I habitat types within the Heritage Property meet the IUCN/SSC criteria, including forests, scrub, grasslands, wetlands, bare rock areas, and caves. The Jiulongchi wetland was once the largest cirque lake in Fanjing Mountain and has evolved over a long history of geological change into a typical alpine wetland ecosystem in the region, providing an ideal place to research the succession of plant and animal communities and the maintenance of biodiversity in a subtropical wetland environment. Additionally, the research on the biodiversity of the Jiulongchi wetland will contribute to a better understanding of the evolution of critical ecological environments within the Heritage Property and enrich the research on the different wetlands.
Moss plants, which prefer to grow in shady, moist forests, bogs, or on exposed rocks, are widespread worldwide, providing essential habitats for mites and are capable of hosting abundant and quite diverse mite fauna [4,5,6,7,8]. As one of the most abundant microhabitats for mites [9], mosses are also an important component of global biodiversity as the second largest group of higher plants, and play important ecological functions in soil and water conservation, soil moisture regulation, forest regeneration, and global carbon and nitrogen cycles [10,11,12]. Moss mites, on the other hand, perform functions such as the decomposition of organic matter in the food chain, soil activation, and assisting in the dispersal of other organisms [13,14,15]. It is universally recognized that climate change is seriously affecting global biodiversity and changing the distribution range of plants [16,17], especially in the climate transition zone, to produce rich species diversity [18]. Bryophytes represent the transition from aquatic to terrestrial in the evolution of plants; they are sensitive to changes in the environment and are used as bioindicators. The changes in bryophyte communities and the faunal and bacterial communities within them have received much scholarly attention [19,20,21,22,23,24,25].
According to the 1982 revised definition (The Ramsar Convention) and the hierarchical classification of the Chinese wetland classification system, the Jiulongchi wetland in Fanjing Mountain is a herbaceous marsh with seasonal intermittent characteristics [26,27]. Wetlands are one of the world’s three major ecosystems and have multiple functions in ecology and the environment. They provide essential habitats for many organisms and resources for human production and livelihood. Their sediments and extant organisms record a range of processes of environmental change and biological succession. Studies of wetland soil seed banks have shown that high soil seed bank diversity and compositional similarity between the vegetation and soil seed bank may provide a potentially crucial functional buffer against the impact of ongoing moisture changes on plant communities in wetlands [28]. Other studies have shown that anthropogenic disturbances, global climate change, and wetland drying indirectly influence plant community and seed bank diversity through soil pH [29]. Wetland moss plants keep soil temperature and moisture relatively stable, which is crucial for the survival of wetland soil animals [30]. Flora and fauna of wetlands vary in different climatic zones, from the northern subarctic frozen palsa mires to the lush swamp forests of the tropics, each with their characteristic range of fauna and flora [31]. In adjacent habitat patches, the mites communities structure also exhibits individual characteristics, such as mite fauna of patches of high Arctic moss–grass tundra of Svalbard in Petuniabukta, Billefjord (moss, grasses, Salix polaris, bare soil), and adjacent to Vestpynten, Adventfjord (moss, moss mixed with grasses, Cassiope tetragona, S. polaris) [32]. The pollen, sporopollen, and 14C contents of sediments from the Jiulongchi wetland in Fanjin Mountain recorded climate change and vegetation succession in Fanjin Mountain around 10,000 years ago [33,34]. At present, the plant communities of Polytrichum commune Hedw. (PC), Eleocharis yokoscensis (Franch. et Sav.) Tang et-Cypers sp. (EY-C), Senecio faberii Hemsl (SF), and Indocalamus longiauritus Hand.-Mazz. (IL) are developed in the low part from south to north, which reflects the modern vegetation succession process in the area [27].
The response of belowground biodiversity to the natural succession of surface vegetation communities and its feedbacks help us to understand the multifunctionality and sustainability of ecosystems. In 2018, the Fanjing Mountain was established as a World Natural Heritage Property as it meets World Heritage Criterion (x): to contain the most important and significant natural habitats for in situ conservation of biological diversity, including those containing threatened species of outstanding universal value from the point of view of science or conservation (https://whc.unesco.org/en/list/1559 (accessed on 26 January 2023)). Soil mites communities and plant epiphytic moss mites communities have been investigated in the Fanjing Mountain [7,35,36,37,38,39,40]. The moss mites of the Jiulongchi wetland in the Fanjing Mountain have not been studied. Based on the ecological importance of the Jiulongchi wetland in Fanjing Mountain, we tentatively hypothesized in this research that (1) the Jiulongchi wetland moss mites communities should be differentiated under different vegetation environments. (2) The difference or regularity of moss mites community can reflect the succession stage or process of regional vegetation from moist to mesogenic or xerotic. For this purpose, we investigated these issues by collecting, isolating, and identifying moss mites, using the Shannon–Wiener diversity index (H’) and the Pielou evenness index (J), moss mites ecological taxon analysis, and mathematical and statistical methods such as PCA, Kruskal–Wallis nonparametric tests, and ANOVA. The research will show the distribution pattern of moss mites under different plant communities in subtropical subalpine herb wetlands, and will also provide basic comparative data for further studies on the relationship between environmental change and moss mites communities.
2. Materials and Methods
2.1. Overview of the Study Area
The Fanjing Mountain World Natural Heritage Property (27°45′6′′–28°3′10′′ N, 108°30′41′′–108°47′51′′ E) is located at the junction of Yinjiang, Jiangkou, and Songtao counties in Guizhou Province (Figure 1a), in the transition zone from the Yunnan-Guizhou Plateau to the hills of western Hunan Province. The total area of Fanjing Mountain Heritage Property is 775 km2, with the highest peak elevation of 2570.5 m and the relative height difference of the mountain body of more than 2000 m. The area belongs to the subtropical monsoon climate zone, with prominent characteristics of a humid central subtropical monsoon mountain climate, with an annual average temperature of 9.2–16.9 °C [41], an annual average relative humidity of 78%–79%, and an annual average precipitation of 1080–2500 mm, with precipitation mainly concentrated in April–October [42]. The vegetation has significant vertical differentiation, and the vegetation in the area is well-preserved and native [7]. It can be divided into five vertical zones from the foothills (500 m) to the summit, with about 3724 existing plants; among them, there exist 791 species of bryophytes belonging to 74 families (https://whc.unesco.org/en/list/1559 (accessed on 26 January 2023)).
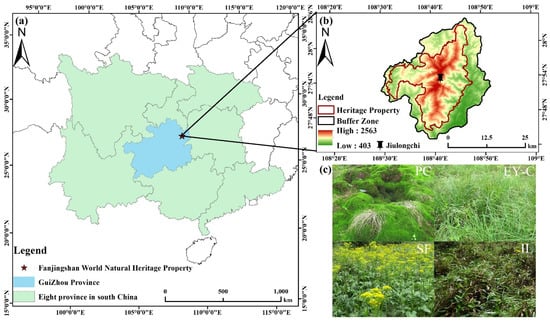
Figure 1.
Geographical location of Fanjing Mountain (a), geographical location of Jiulongchi Wetland (b), and four different vegetation succession habitats (c). Notes: PC: Polytrichum commune Hedw., EY-C: Eleocharis yokoscensis (Franch. et Sav.) Tang et-Cypers sp., SF: Senecio faberii Hemsl, IL: Indocalamus longiauritus Hand.-Mazz.
The sampling site is mainly located in the Jiulongchi wetland (2030 m above sea level) of Fanjing Mountain, at the saddle between the back-sloping dome of Fanjing Mountain and Fenghuang Mountain (Figure 1b), and was once one of the highest and largest cirque lakes in Fanjing Mountain area with uninterrupted water accumulation [27]. The Jiulongchi Wetland is an intermittent bog that is waterlogged in summer and autumn and partially waterlogged in winter and spring. Swampy meadow soils dominated by Polytrichum commune Hedw. are mainly developed in the region. The Jiulongchi subalpine wetland is constrained by moisture and special geomorphological conditions, with a narrow distribution range, about 150 m long from east to west and 30 m wide from north to south, showing an overall high north to low south topography, with a slope of about 2–3°, sloping due south [27]. The open area of the Jiulongchi wetland as a whole forms a series of four distinctly different vegetation successions from south to north, adjacent to each other, in the order of the Polytrichum commune Hedw. (PC) community in the center of the wetland, the Eleocharis yokoscensis (Franch. et Sav.) Tang et-Cypers sp. (EY-C) community adjacent to the PC community, the Senecio faberii Hemsl (SF) community located behind the EY-C community, and the northern edge of the Indocalamus longiauritus Hand.-Mazz. (IL) community on the northern edge (Figure 1c and Figure 2). The ground surface of each vegetation community is lush with mosses, and the main dominant moss taxa are shown in Table 1.
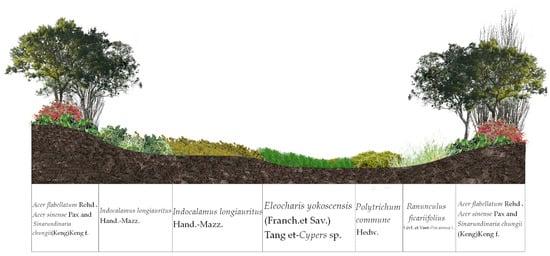
Figure 2.
Distribution of ecological succession of different vegetation in Jiulongchi Wetland, Fanjing Mountain.

Table 1.
The main bryophyte species on the ground surface in different vegetation succession habitats.
2.2. Sample Selection and Settings
On 22 April 2016, we sampled surface mosses in four vegetation succession habitats in the Jiulongchi Wetland. Nine sampling sites were randomly set up in each habitat, and moss samples were collected using a 15 × 15 cm homemade metal frame with a sampling height of 10 cm. A total of 36 moss organisms were obtained. All samples were collected and stored in well-ventilated cotton bags and then transferred to the laboratory for mites isolation and identification.
We did not set up sampling points in the interlacing zone between neighboring plant communities, to avoid edge effects. Furthermore, in addition to the moss mound formed by the moss community dominated by Polytrichum commune Hedw. in the swamp habitat, the maximum thickness of the moss mound can reach 35 cm. In other habitats, due to the relatively flat terrain, the moss thickness at each sampling point is relatively uniform, with an average thickness of 10–20 cm.
2.3. Isolation and Identification of Moss Mites
Moss fauna samples were collected in the laboratory using a modified Berles–Tullgren funnel, in which temperature and humidity gradients forced active moss fauna to move downwards and fall directly into a beaker containing a 75% ethanol solution [43]. The temperature inside the funnel was controlled at about 35 °C and baked continuously for 48 h until all moss samples were completely dry. The collected moss fauna samples were transferred to Petri dishes, and the moss mites were separated from the rest of the fauna using a somatotrope (Olympus SZX2-FOF). The separated mites specimens were fixed and cleaned with 75% alcohol and stored in a solution containing 95% lactic acid for 15 days at room temperature and transparent.
The moss mites samples were made into temporary pieces, and all adult moss mites specimens were morphologically identified using a microscope (Olympus CX41RF). The sources used for identification were A Manual of Acarology (Third Edition) [44], Pictorial Keys to Soil Animals of China [45], Soil Gamasid Mites in Northeast China [46], and Acarology [47]. All moss mites were identified to taxonomic units at the genus level, except for juvenile moss mites and incomplete specimens, which were difficult to identify reliably. The moss mites specimens were kept in the laboratory of the School of Karst Science, Guizhou Normal University, China.
2.4. Data Collation and Analysis
The moss mites communities were characterized using a combination of abundance (A), species richness (S), and dominance index (D). In addition, the Shannon–Wiener diversity index (H′) and the Pielou evenness index (J) were used to jointly characterize moss mites’ communities diversity. All the above data collation was performed in Office Excel 2016 (the index formulae involved and their determination thresholds are shown in Appendix A).
We compared the variability of moss mites communities A, S, H′, and J in different habitats. Before analysis, the data were first subjected to the Levene chi-square test and the Kolmogorov–Smirnov normality test. A log (x + 1) transformation was performed for data that did not satisfy the statistical test, and Kruskal–Wallis nonparametric tests were performed for biological data that still did not satisfy the test. One-way ANOVA was performed for data that met the data conforming to a normal distribution, and multiple comparisons were performed using the LSD method. Significance levels were set at p = 0.05, and data were presented as mean ± standard error. All of the above analyses were completed in SPSS 24.0, and Origin 2021 was used to visualize the data.
Additionally, we divided the mites into the core, common, and exclusive taxa, following the division method referencing Kamczy et al. [48]. Where core genera occur in all habitats surveyed, exclusive genera are present in only one habitat, and common genera inhabit at least two habitat types. Data collation was completed in Office Excel 2016, and UpSet and Venn diagrams were plotted in TBtools software [49].
We used moss mites abundance data to calculate variability between habitats. Principal component analysis (PCA) based on Bray–Curtis distances was used to visualize correlations between moss mites communities and habitat types and show moss mites’ habitats preferences. To reduce the influence of rare taxa on the two-dimensional ordination map, we selected species with a dominance index greater than 1%, representing 90.67% of the total abundance, for a total of 13 genera, namely, Gamasellus, Hypochthonius, Camisia, Brachioppiella, Ramusella, Tectocepheus, Eupelops, Acipteria, Parachipteria, Haplozetes, Fuscozetes, Melanozetes, and Trichogalumna. All of the above analyses were completed in Canoco 5.0 [50], and the names of moss mites genera were added to the ordination charts using Office PowerPoint 2016 software. In addition, we further calculated the similarity of moss mites communities in different habitats using the Sorensen and Morisita–Horn community similarity indices [51,52] (the index formulae involved and their determination thresholds are shown in Appendix A).
Considering that the mites communities were mainly composed of Oribatida and Mesostigmata, we calculated the maturity index (MI) of moss mites in different habitats by referring to the division of predatory mites into K-selective and r-selective (i.e., K-strategists and r-strategists in the life history of the species) taxa as proposed by Ruf [53]. In addition, referring to Aoki [54], Xie et al. [55], and Li [47], the moss mites taxa were divided into the Macropyline group, Gymnonota group, and Poronota group, and the analysis of the percentage of genera (MGP I) and the percentage of individuals (MGP Ⅱ) of Oribatida ecotypes were carried out, respectively. The above data were collated in Office Excel 2016 (the index formulae involved and their determination thresholds are shown in Appendix A).
3. Results and Analysis
3.1. Abundance and Dominance of Moss Mites
A total of 9058 moss mites were identified during the research period, belonging to 3 orders and 49 families and 69 genera, with Oribatida being the most abundant order, accounting for 95.31% of the total abundance. Specifically, there were 15 genera in 14 families of Mesostigmata, 5 genera in 5 families of Trombidiformes, and 49 genera in 30 families of Oribatida. Overall, Parachipteria, Fuscozetes, and Tectocepheus were the three most abundant genera, accounting for 29.92%, 17.33%, and 11.81% of the total abundance, respectively. In terms of the total dominance index, there were three dominant genera (59.06% of total abundance), ten common genera (31.61%), five rare genera (3.84%), and 51 extremely rare genera (5.49%) (see Appendix B for details of the data analyzed above).
The abundance of moss mites gradually increased with the ecological succession of the vegetation, and the dominant genus composition of mites was only partially consistent in different habitats. Specifically, in Polytrichum commune Hedw. (PC) habitats, 828 mites were recorded, belonging to 3 orders, 11 families, and 20 genera, with the dominant moss mites groups being Fuscozetes (34.66% of the mite abundance captured in PC habitat) and Tectocepheus (34.32%). In the Eleocharis yokoscensis (Franch. et Sav.) Tang et-Cypers sp. (EY-C) habitat, a total of 2219 moss mites were recorded, belonging to 3 orders, 29 families, and 40 genera, with the dominant groups being Eupelops (26.09% of the moss mites abundance captured in EY-C habitat), Fuscozetes (25.91%), Parachipteria (15.32%), and Tectocepheus (14.02%). In the Senecio faberii Hemsl (SF) habitat, a total of 2975 moss mites were recorded, belonging to 3 orders, 25 families, and 34 genera, with the dominant groups being Parachipteria (34.89% of the moss mites abundance captured in the SF habitat) and Fuscozetes (20.24%). In the Indocalamus longiauritus Hand.-Mazz. (IL) habitat, a total of 3036 mites belonging to 50 genera in 39 families in 3 orders were recorded, with the dominant groups being Parachipteria (43.58% of the moss mites abundance captured in IL habitat) and Haplozetes (12.05%) (see Appendix B for details of the data analyzed above. Appendix C shows photos of the dominant genus).
Among the different plant communities, Sarcoptiformes had a much higher number of individuals, families, and genera than Mesostigmata and Trombidiformes (Figure 3). IL had the highest number of families, genera, and abundance, while EY-C had a higher number of families and genera than SF, but a lower number of individuals. In terms of total mite abundance, 14 genera (Gamasellus, Neogamasus, Asca, Hypochthonius, Atropacarus, Camisia, Nanhermannia, Suctobelbila, Eupelops, Parachipteria Neoribates, Haplozetes, Fuscozetes, and Trichogalumna) differed significantly (p < 0.05) in the number of individuals in the different plant communities (Appendix B). Of the three dominant taxa, only Tectocepheus was not significantly different in any of the different plant communities.
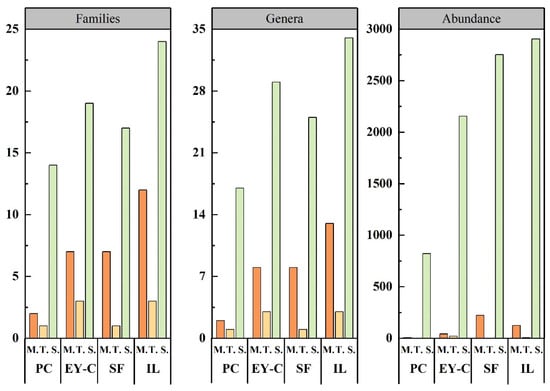
Figure 3.
Differences in the number of families, genera, and abundance of moss mites at the order level in different vegetation succession habitats. Notes: PC: Polytrichum commune Hedw., EY-C: Eleocharis yokoscensis (Franch. et Sav.) Tang et-Cypers sp., SF: Senecio faberii Hemsl, IL: Indocalamus longiauritus Hand.-Mazz., M: Mesostigmata, T: Trombidiformes, S: Sarcoptiformes.
3.2. Moss Mites Community Diversity
The abundance, species richness, and diversity indices of moss mites differed between plant successional habitats, but not the evenness index. Specifically, in terms of mean values of mite abundance in the different plant communities (Figure 4a), IL was the most abundant, followed by SF > EY-C > PC, with no significant differences in the number of individuals in IL, EY-C, and SF. However, they were all significantly higher than PC (p < 0.05). In terms of mean values of species abundance (Figure 4b), IL had the highest number of genera, followed by EY-C > SF > PC, and PC was significantly different from all other habitats in terms of species abundance (p < 0.05). In terms of the mean value of the diversity index (Figure 4c), SF possessed the highest diversity, followed by IL > EY-C > PC, and the diversity index of PC was significantly different to both SF and IL (p < 0.05). In terms of mean values of evenness indices (Figure 4d), SF had the highest evenness index, followed by PC > EY-C > IL, and there was no significant difference between the evenness indices of different plant communities (p > 0.05).
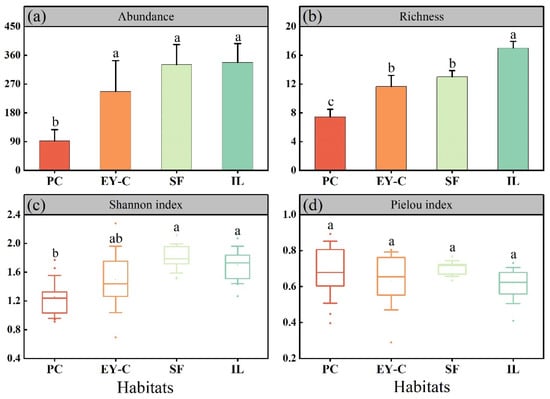
Figure 4.
Abundance (a), richness (b), Shannon diversity (c), and Pielou index (d) of moss mites communities in different vegetation successional habitats. Notes: PC: Polytrichum commune Hedw., EY-C: Eleocharis yokoscensis (Franch. et Sav.) Tang et-Cypers sp., SF: Senecio faberii Hemsl, IL: Indocalamus longiauritus Hand.-Mazz. The different lowercase letters indicate significant differences at the p = 0.05 level.
3.3. Moss Mites Community Similarity
A total of 13 moss mites species with relative abundance greater than 1% were selected for PCA analysis (Figure 5, Appendix D), accounting for 90.67% of the total number of individuals, with Axis 1 and Axis 2 explaining 35.9% and 21.56% of the total variance, respectively, cumulatively explaining 57.46% of the variance, with significant differences in moss mite community composition among the four plant communities. The mites community composition of the PC habitat differed from that of the SF and IL habitats, respectively, and there was a clear separation. The Parachipteria, Trichogalumna, Gamasellus, Hypochthonius, and Eupelop taxa were the main taxa separated from the PC1 axis, and the Melanozetes, Acipteria, Fuscozetes, Haplozetes, and Brachioppiella taxa were the main taxa separated from the PC2 axis. Meanwhile, moss mites with relative abundance greater than 1% were mainly concentrated in IL and SF habitats, while PC was the least distributed habitat.
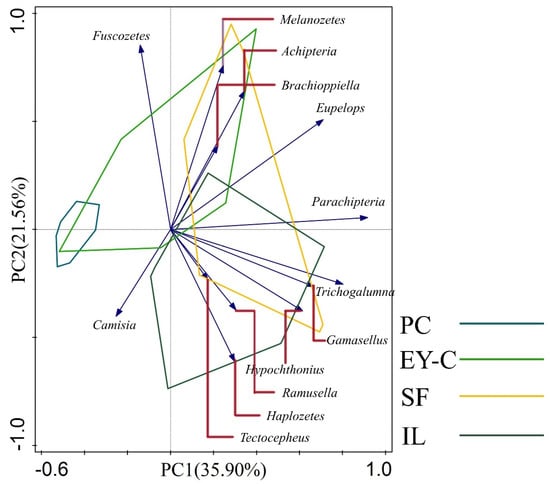
Figure 5.
Two-dimensional ordination diagram for principal component analysis of moss mites communities in different vegetation succession habitats. Notes: PC: Polytrichum commune Hedw., EY-C: Eleocharis yokoscensis (Franch. et Sav.) Tang et-Cypers sp., SF: Senecio faberii Hemsl, IL: Indocalamus longiauritus Hand.-Mazz. Only the 13 moss mites species with relative abundance greater than 1% are shown. Blue arrows of different lengths indicate the moss mites score for the genus. Polygonal boxes of different colors indicate the distribution range of the nine sampling sites. The red dash is an auxiliary line pointing to a particular genus of mite and has no meaning in the analysis.
The mean Sorenson similarity coefficient for moss mites communities of different vegetation succession stages was 0.58, varying from 0.4 to 0.76, and the mean Morisita–Horn similarity coefficient was 0.53, varying from 0.24 to 0.86 (Table 2). The two similarity indices consistently indicated that mites communities were the least similar in PC and IL habitats, the Sorenson similarity coefficient indicated the highest similarity in EY-C and SF habitats, and the Morisita–Horn similarity coefficient showed the highest similarity in SF and IL habitats.
Table 2.
Similarities in the community composition of moss mites species in different vegetation succession habitats.
According to the investigation, a total of 12 core taxa (Uropoda, Hypochthonius, Trimalaconothrus, Suctobelbella, Amerioppia, Ramusella, Tectocepheus, Eupelops, Parachipteria Haplozetes, Incabates, and Fuscozetes) occurred in all four plant communities. The exclusive taxa of PC, EY-C, SF, and IL were three, seven, two, and 20 species, respectively, with 25 common taxa occurring in at least two habitats. Of the 13 common taxa (>1% dominance), seven were core taxa (Hypochthonius, Ramusella, Tectocepheus, Eupelops, Parachipteria, Haplozetes, and Fuscozetes), and the remaining six were common taxa (Figure 6).
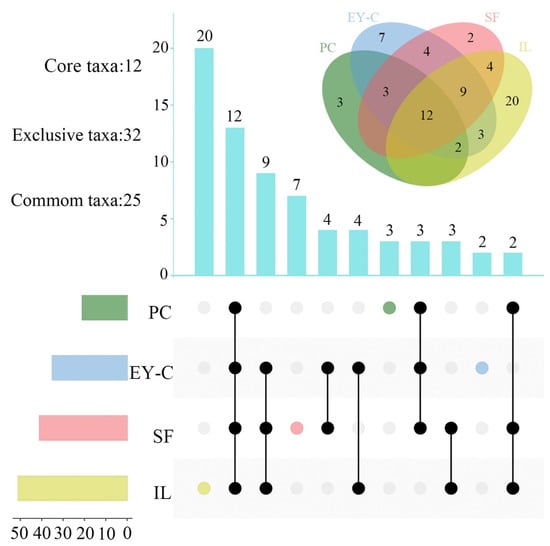
Figure 6.
Core, exclusively common, genera of moss mites in different vegetation succession habitats. Notes: PC: Polytrichum commune Hedw., EY-C: Eleocharis yokoscensis (Franch. et Sav.) Tang et-Cypers sp., SF: Senecio faberii Hemsl, IL: Indocalamus longiauritus Hand.-Mazz. Above is a Venn diagram of the moss mites communities’ composition; the different colored circles indicated the different plant communities of moss mites. Below is the UpSet diagram. The different colored circles indicate the number of exclusive genera of mites in that flora. Black circles with connecting lines indicate the presence of the same genera between flora and the rest of the flora, and the bar graph above shows the number of the same genera.
3.4. Ecological Taxa of Predatory Moss Mites
A total of 12 families and 13 genera of predatory moss mites were recorded in four successional habitats, including two families and two genera in PC, 7 families and 8 genera in EY-C, 7 families and eight 8 in SE, and 10 families and 11 genera in IL. The K or r values of the family are shown in Appendix A, and the results of calculating the maturity index MI of predatory moss mites in each habitat are shown in Table 3. Specific criteria for K and r values for the predatory mites were given in the relevant references [53,56,57]. Criteria for classifying predatory moss mites ecological taxa: 0 ≦ MI ≦ 1. MI = 0, r-selective; MI < 0.5, r-selective dominant; MI = 0.5, K-selective or r-selective; MI > 0.5, K-selective dominant; MI = 1, K-selective. The results showed that PC had the highest MI index for K-selected taxa, EY-C and IL for r-selected taxa, and SF for K- or r-selected taxa.
Table 3.
Number of predatory moss mites families, species richness, abundance, MI and ecological taxa in different vegetation succession habitats.
3.5. Ecological Taxa of Moss Mites (Acari: Oribatida)
We found an increasing trend in community abundance and species richness of Oribatid mites with the ecological succession series of wetland vegetation. The community structure of Oribatid mites is analyzed in Table 4. Specifically, 8 families and 17 genera of 821 mites were found in PC habitat, 15 families and 29 genera and 2155 mites in EY-C, 14 families and 25 genera and 2752 mites in SF, and 18 families and 34 genera and 2905 mites in IL. The results of the MGP analysis of Oribatid mites ecotypes showed that in terms of percentage of taxon genera, all habitats were P-type, except for the moss Oribatid mites community in the IL habitat, which was O-type. In percentage abundance, all were P-type except for the PC Oribatid mites community, which was G-type. The Poronota group generally dominates the ecological taxa of Oribatid mites in the Jiulongchi wetland.
Table 4.
Ecological taxa of moss mites (Acari: Oribatida) in different vegetation succession habitats.
4. Discussion
In the subalpine wetlands of Jiulongchi, Fanjing Mountain, a total of 9058 moss mites were recorded in four different vegetation succession habitats, belonging to three orders and 49 families and 69 genera, with the main dominant taxa being Parachipteria, Fuscozetes, and Tectocepheus. This differs from the results of studies on other types of wetlands in China. For instance, the dominant taxa in the Hani Peatland were Nothrus anauniensis and Suctobelbella singularis [58], the dominant taxa of moss mites in the swamp wetlands of the Sanjiang Plain were Malaconothrus and Zetomimus furcatus [59], the dominant taxa of moss mites in island forests and wetlands in three different permafrost zones in the peatlands of the Daxing’an Mountain range were SuctobeIbella singularis [60], while the dominant taxa of degraded small epibenthic arthropod communities in the Zoige alpine wetlands were Rhagidiidae [61]. The community composition of moss mites varies in wetland ecosystems on other continents. For example, in Russian karst sedge wetlands, mite-dominant taxa were dominated by Thienemanni and Monodactylus [62]. In swampy wetlands of varying degrees of degradation in southern Poland, mite-dominant taxa were dominated by Hydrozetes lacustris and Trimalaconothrus maior dominate [63], while in eastern peatland peat moss habitats in North America, the dominant taxon was Eniochthonius [64]. In the Colchic Lowland bogs of the Georgian Caucasus, dominant species include Platynothrus peltifer, Nothrus pratensis, Parachipteria punctata, and others [65], and among the different mosses of six mires in the marine part of western Norway, moss mites were dominated by Nothrus [66]. The dominant taxa of moss mites in different types of wetland ecosystems also differ significantly due to differences in climate and geographical location, as well as differences in the reproductive patterns, environmental adaptation mechanisms, and colonization potential of different groups of mites. The community composition of moss mites in the subalpine wetland vegetation successional series had unique geographical characteristics. The abundant mites’ dominant taxa and core genera were successfully adapted to the subalpine wetland vegetation ecological successional environment within Fanjing Mountain. They can be used as key indicator mites species in the subalpine wetland ecosystem.
The structure of mites communities in bryophytes is closely related to their habitat conditions and vegetation types. Factors affecting the development of mite communities include the quantity and quality of food resources and the environmental conditions of the habitat [67,68]. The research demonstrated that the abundance and taxon number of moss mites gradually increased as the vegetation succession series changed from PC to IL habitats, with Sarcoptiformes being much more abundant and with higher taxon number in the different plant communities than Mesostigmata and Trombidiformes. Other habitat studies conducted in Fanjing Mountain (soil mite studies in evergreen broadleaf forests and tree epiphytic moss mites in mixed evergreen deciduous broadleaf forest belts) also obtained similar conclusions [7,69]. Seniczak et al. found a significantly high diversity of Oribatida by surveying mites communities in diverse peat mosses in a western Norwegian swamp [66]. This may be because Mesostigmata and Trombidiformes are mainly predatory mites, feeding on nematodes, larval mites, and insect larvae [70], and therefore tend to be more flexible. However, Sarcoptiformes depend more on vegetation type, mainly on fixed food resources, and move slowly [71]. This demonstrated the higher diversity of the Sarcoptiformes community studied in the vegetation succession series of the Jiulongchi subalpine wetland, where the plant community more influenced species richness in the wetland.
The number of individuals, taxa, and diversity indices of moss mites differed significantly between vegetation succession habitats in the Jiulongchi subalpine wetland. However, the differences in evenness indices were more minor. Some relevant studies show that the community structure of mites often differs to some extent under different vegetation communities [72,73], and in degraded red soil areas, there are differences in soil mite community composition under different vegetation restoration patterns, and the number of mite taxa and individuals increases to different degrees [74]. There were significant differences in mite abundance and richness between three moss habitats in 15 forest ecosystems in Romania [9]. In Irish forests, mite communities of trunk-attached mosses differed significantly between tree species structures [73]. Under the four vegetation succession series in the study area, the number of individuals and taxa of moss mites in the PC habitat was the lowest, which is similar to the seasonal distribution of mites under the degradation of the alpine meadows of Zoige alpine wetlands [75], probably because the Jiulongchi subalpine marsh wetland is an intermittent wetland with seasonal waterlogging. The accumulation of surface moisture is not suitable for mite survival [76]. IL habitat had the highest number of individuals and taxa in the genus, which was similar to the mites survey conducted by Seniczak et al. [77] on scrub in the Crimean steppe. This may be due to the greater abundance of higher plant species in this environment and the fact that the dead leaves of the scrub provide more available resources for the mites [58,78,79].
The dominant taxa are essential indicators of the extent to which organisms have adapted to their environment and are indicative of environmental change [80]. The dominant mite genus is one indicator of ecological change in organisms [81]. Tectocepheus is the dominant genus shared by PC and EY-C and was also distributed in all four vegetation succession series in SF and IL habitats. Tectocepheus was no longer the dominant genus, although it is distributed in SF and IL habitats. Relevant information revealed that species of Tectocepheus are common in all distributed or early successional habitats, regardless of where these habitats occur or whether the disturbance is natural (e.g., forest boils in the high arctic) or anthropogenic (cultivated sites, demolition sites, mine tailings, etc.) [44]; however, based on current conditions, the Jiulongchi wetland at Fanjing Mountain is a less disturbed environment by nature and man, and the latter does not exist. In the results of the Shen study [82], the element contents of soil and plant (moss and grass) showed that the current environmental quality of the high-altitude alpine ecosystem in Jiulongchi wetland is still good, which also illustrates the point. Parachipteria was the most abundant genus in the wetland vegetation succession series. The number of individuals could indicate the suitability of different habitats for the mites’ survival, with Parachipteria increasing in abundance as the succession progressed. The species of this genus in mainland China is Parachipteria distincta Aoki, which mainly inhabits montane scrub meadows [83]. Its distribution in Jiulongchi wetland may be due to the increasing complexity of the environment as the vegetation succession progresses or to changes in the taxonomic composition or gradient of the mosses at different stages of vegetation succession, resulting in a preference for mites of this genus. At Spruce Hole Bog, New Hampshire, USA, the distribution of Limnozetes correlated with different gradients of variation in the three-peat mosses Sphagnum, possibly showing evidence of a preference for one of the mosses [84]. Meanwhile, Related research found that Oribatid mites low in the food web were primary decomposers such as Platynothrus peltifer and Nothrus pratensis, whereas Oppiella spp. had high 15N signatures pointing to fungal feeding or predation/scavenging [85]. Regarding trophic structure, Tectocepheus spp. Are primary decomposers [86], species of Fuscozetes are considered saprophages and mycophages [87], and Fuscozetes spp. eat dead Collembola and other arthropods [88]. The fact that the dominant species occupy a corresponding functional position in each of the different vegetation stages of the Jiulongchi wetland environment is further evidence of their success.
The predatory mite ecotype and the ecological structure of the Oribatid mites communities reflect the disturbance of the habitat. The less the environment is disturbed, the greater the MI index, i.e., the higher the proportion of K-selected taxa [53]. In this research, the PC habitat was more affected by seasonal waterlogging in low relief. However, the MI index was higher than in other habitats, probably because of the number of taxa and individuals of predatory mites in the PC habitat. The MI indices of SF and IL were relatively close and have values close to or equal to the 0.5 thresholds, and were dominated by r-selected groups, with predatory mites of r-selected taxa tending to be less competitive and more reproductive [40,53], indicating a trend towards higher diversity of predatory mite species at all stages. The MGP research showed that the Poronota group was the mainstay of the epiphytic moss mite community in the vegetation succession series of Jiulongchi wetland. It can be seen that the moss Oribatid mites community type responded more significantly to vegetation succession relative to the number of individuals. Some studies show that mite communities in environmentally complex habitats tend to be dominated by Poronota taxa [89,90]. This may be because the vegetation succession in the Jiulongchi wetland is in the process of changing from wet to xerophyte, and the environment of each plant community is complex. Taking both analyses together, the vegetation succession series in the subalpine wetlands is complex regarding the environmental change, and the overall wetland environment is moving in a direction favorable to mites diversity.
5. Conclusions
In the research, we investigated the composition and distribution of moss mites in four different vegetation succession habitats in the subalpine wetland of Jiulongchi, Fanjing Mountain, Guizhou. We described the changes in community structure and community composition of moss mites at different succession stages. The research demonstrated the following: (1) In the vegetation succession series of subalpine wetlands, moss mites with Parachipteria, Fuscozetes, and Tectocepheus as the dominant taxa, and the composition of the dominant taxa, varied in different plant communities; in general, the abundance and species richness of mites gradually increased with the vegetation succession. (2) During the succession of wetland vegetation, the environment is developing in a direction favorable to the diversity of moss mites. This research enriches the study of the biodiversity of Fanjing Mountain and its subalpine wetlands, further deepens the understanding of the value of biodiversity in the Fanjing Mountain World Natural Heritage Property, and is of great significance for the conservation of biodiversity in the Heritage Property. Global climate change is a central theme of research in today’s society. Determining how climate change will affect subalpine wetland ecosystems and continuing to track the relationship between biological indicators and environmental change will be the next major task of our research.
Author Contributions
Data curation, H.C.; formal analysis, Y.Z. and Y.F.; funding acquisition, H.C.; investigation, Y.F. and Q.W.; software, Y.F.; writing—original draft, H.C.; writing—review and editing, Y.F. and Y.Z. All authors have read and agreed to the published version of the manuscript.
Funding
This research was funded by Doctoral Research Project of Guizhou Normal University (GZNUD (2018) No. 31), National Key R&D Program of China (2016YFC0502601).
Institutional Review Board Statement
Not applicable.
Informed Consent Statement
Not applicable.
Data Availability Statement
The data presented in this study are available on request from the corresponding author.
Acknowledgments
We are grateful to the staff of the Guizhou Fanjing Mountain National Nature Reserve Administration for their great support to the environmental survey, and to Yuanyuan Zhou, Qiang Wei, Yifan Fei, Dandan Lin, Xiangqin Gao, Meiling You and Zheng Shi for their help in the collection and processing of experimental samples.
Conflicts of Interest
The authors declare no conflict of interest.
Appendix A. The Calculation Formula Used in the Article and Its Determination Threshold
- Abundance (A): expressed as the number of individual moss mites. We did not use density to express abundance because the number of surface mosses sampled (9) and the area sampled (15 × 15 cm) were consistent across vegetation succession stages.
- Species abundance (S): indicates the number of the lowest level taxonomic unit (genus) of moss mites
- Dominance index (D) [56]: mites abundance as a percentage of total community abundance. Judgment threshold: genera with D >10% are dominant taxa (genera), 1% < D ≤ 10% are common genera, 0.5% < D ≤ 1% are rare taxa, and D ≤ 0.5% are extremely rare taxa.
- Shannon-Wiener diversity index (H′) [91]. The formula is as follows.where Pi is the ratio of the abundance of mites of genus i to the total abundance, and S is the number of taxa (genera).
- The Pielou evenness index (J) [92]. The formula is as follows.where H′ is the diversity index and S is the number of taxa (genera).
- Sorensen similarity index [45]: qualitative analysis of community similarity using genus numbers, taking into account differences in species composition. The formula is as follows.where a and b are the number of genera in communities A and B respectively, and c is the number of genera common to communities A and B.
- Morisita-Horn similarity index (CMH) [93]: the number of genera and their individual numbers were used to quantify community similarity, taking into account the abundance of each species. The formula is as follows.where S is the total number of genera, ai and bi are the number of individuals of genus i in communities A and B respectively, and Na and Nb are the total number of individuals of all genera in communities A and B respectively.
- Ecological taxa of predatory moss mites (Mesostigmata: Gamasina) [53,68] The maturity index (MI) of predatory moss mites is analysed using a threshold value of MI < 0.5 for r-selection, MI = 0.5 for K- or r-selection, and MI > 0.5 for K-selection. The formula is as follows.where S is the number of genera of tracheal mites in the mite class; Ki is the K-value of the family in which genus i is located and ri is the r-value of the family in which genus i is located, see Table A1.
- Ecological taxa of moss Oribatid Mites (Acari:Oribatid). MGP analysis is carried out on the percentage of moss mite genera and the percentage of moss mite individuals corresponding to each group, based on the classification of Oribatida taxa by Li et al. (1988) [47], and the taxon discrimination thresholds are shown in Table A2.
Table A1.
K and r values of predatory Gamasina mites.
Table A1.
K and r values of predatory Gamasina mites.
| Family | K-Value | Family | r-Value |
|---|---|---|---|
| Pachylaelapidae | 1 | Ologamasidae | 1 |
| Veigaiidae | 2 | Ascidae | 1 |
| Rhodacaridae | 2 | Podocinidae | 1 |
| Veigaiidae | 2 | Blattisociidae | 2 |
| Parholaspididae | 2 | Parasitidae | 4 |
| Uropodidae | 3 | ||
| Ameroseiidae | 3 | ||
| Zerconidae | 3 |
Table A2.
Ecological types assigned to moss mites (Oribatida) community.
Table A2.
Ecological types assigned to moss mites (Oribatida) community.
| Community Types | Abbreviation | Value Ranges of Mites (Oribatida) Group |
|---|---|---|
| Macropylina type | M | M > 50% |
| Gymnonota type | G | G > 50% |
| Poronota type | P | P > 50% |
| Overall type | O | 20% < M, G, P < 50% |
| Macropylina-Gymnonota type | MG | M, G = 20–50%, P < 20% |
| Gymnonota-Poronota type | GP | G, P = 20–50%, M < 20% |
| Macropylina-Poronota type | MP | M, P = 20–50%, G < 20% |
Appendix B
Table A3.
Moss mite species in four different habitats.
Table A3.
Moss mite species in four different habitats.
| Family | Species | PC | EY-C | SF | IL | p Value | Total | |||||
| A | D | A | D | A | D | A | D | A | D | |||
| Mesostigmata | ||||||||||||
| Uropodidae | Uropoda | 3 | 0.36 | 6 | 0.27 | 18 | 0.61 | 8 | 0.26 | ns | 35 | 0.39 |
| Trematuridae | Nenteria | 0 | 0 | 0 | 0 | 0 | 0 | 1 | 0.03 | ns | 1 | 0.01 |
| Parasitidae | Parasitus | 0 | 0 | 3 | 0.14 | 2 | 0.07 | 3 | 0.1 | ns | 8 | 0.09 |
| Neogamasus | 0 | 0 | 11 | 0.5 | 1 | 0.03 | 9 | 0.3 | 0.012 | 21 | 0.23 | |
| Zerconidae | Zercon | 0 | 0 | 0 | 0 | 0 | 0 | 1 | 0.03 | ns | 1 | 0.01 |
| Veigaiidae | Veigaia | 0 | 0 | 0 | 0 | 2 | 0.07 | 4 | 0.13 | ns | 6 | 0.07 |
| Rhodacaridae | Gamasellus | 0 | 0 | 13 | 0.59 | 175 | 5.88 | 44 | 1.45 | 0.026 | 232 | 2.56 |
| Ologamasidae | Gamasiphis | 0 | 0 | 0 | 0 | 1 | 0.03 | 3 | 0.1 | ns | 4 | 0.04 |
| Macrochelidae | Macrocheles | 0 | 0 | 0 | 0 | 0 | 0 | 1 | 0.03 | ns | 1 | 0.01 |
| Parholaspididae | Gamasholaspis | 0 | 0 | 0 | 0 | 0 | 0 | 2 | 0.07 | ns | 2 | 0.02 |
| Pachylaelapidae | Pachylaelaps | 0 | 0 | 1 | 0.05 | 0 | 0 | 0 | 0 | ns | 1 | 0.01 |
| Ascidae | Asca | 0 | 0 | 4 | 0.18 | 19 | 0.64 | 47 | 1.55 | 0.022 | 70 | 0.77 |
| Ameroseiidae | Ameroseius | 0 | 0 | 2 | 0.09 | 4 | 0.13 | 0 | 0 | ns | 6 | 0.07 |
| Podocinidae | Podocinum | 0 | 0 | 0 | 0 | 0 | 0 | 1 | 0.03 | ns | 1 | 0.01 |
| Blattisociidae | Cheiroseius | 3 | 0.36 | 3 | 0.14 | 0 | 0 | 1 | 0.03 | ns | 7 | 0.08 |
| Trombidiformes | ||||||||||||
| Bdellidae | Bdella | 0 | 0 | 3 | 0.14 | 0 | 0 | 0 | 0 | ns | 3 | 0.03 |
| Penthaleidae | Penthaleus | 0 | 0 | 17 | 0.77 | 0 | 0 | 4 | 0.13 | ns | 21 | 0.23 |
| Tanaupodidae | Eothrombium | 0 | 0 | 0 | 0 | 0 | 0 | 1 | 0.03 | ns | 1 | 0.01 |
| Microtrombidiidae | Microtrombidium | 0 | 0 | 1 | 0.05 | 1 | 0.03 | 1 | 0.03 | ns | 3 | 0.03 |
| Johnstonianidae | Diplothrombium | 1 | 0.12 | 0 | 0 | 0 | 0 | 0 | 0 | ns | 1 | 0.01 |
| Sarcoptiformes | ||||||||||||
| Mesoplophoridae | Archoplophora | 0 | 0 | 0 | 0 | 0 | 0 | 1 | 0.03 | ns | 1 | 0.01 |
| Hypochthoniidae | Hypochthonius | 2 | 0.24 | 1 | 0.05 | 135 | 4.54 | 21 | 0.69 | 0.022 | 159 | 1.76 |
| Eniochthoniidae | Eniochthonius | 0 | 0 | 0 | 0 | 37 | 1.24 | 7 | 0.23 | ns | 44 | 0.49 |
| Liochthonius | 0 | 0 | 6 | 0.27 | 4 | 0.13 | 0 | 0 | ns | 10 | 0.11 | |
| Phthiracaeidae | Atropacarus | 2 | 0.24 | 13 | 0.59 | 1 | 0.03 | 0 | 0 | 0.021 | 16 | 0.18 |
| Steganacarus | 0 | 0 | 3 | 0.14 | 0 | 0 | 0 | 0 | ns | 3 | 0.03 | |
| Oribotritiidae | Protoribotritia | 0 | 0 | 1 | 0.05 | 0 | 0 | 2 | 0.07 | ns | 3 | 0.03 |
| Camisiidae | Camisia | 63 | 7.61 | 2 | 0.09 | 0 | 0 | 89 | 2.93 | 0.028 | 154 | 1.7 |
| Platynothrus | 0 | 0 | 0 | 0 | 0 | 0 | 86 | 2.83 | ns | 86 | 0.95 | |
| Nothridae | Nothrus | 0 | 0 | 0 | 0 | 22 | 0.74 | 0 | 0 | ns | 22 | 0.24 |
| Nanhermanniidae | Nanhermannia | 0 | 0 | 0 | 0 | 0 | 0 | 6 | 0.2 | 0.004 | 6 | 0.07 |
| Malaconothridae | Malaconothrus | 0 | 0 | 9 | 0.41 | 0 | 0 | 0 | 0 | ns | 9 | 0.1 |
| Trimalaconothrus | 23 | 2.78 | 8 | 0.36 | 3 | 0.1 | 11 | 0.36 | ns | 45 | 0.5 | |
| Hermanniellidae | Hermanniella | 0 | 0 | 0 | 0 | 0 | 0 | 8 | 0.26 | ns | 8 | 0.09 |
| Issaniella | 0 | 0 | 0 | 0 | 0 | 0 | 2 | 0.07 | ns | 2 | 0.02 | |
| Anderemaeidae | Cristeremaeus | 0 | 0 | 0 | 0 | 0 | 0 | 2 | 0.07 | ns | 2 | 0.02 |
| Arceremaeidae | Tecteremaeus | 0 | 0 | 3 | 0.14 | 0 | 0 | 0 | 0 | ns | 3 | 0.03 |
| Carabodidae | Hardybodes | 0 | 0 | 0 | 0 | 0 | 0 | 38 | 1.25 | ns | 38 | 0.42 |
| Suctobelbidae | Suctobelbella | 3 | 0.36 | 3 | 0.14 | 15 | 0.5 | 19 | 0.63 | ns | 40 | 0.44 |
| Suctobelbila | 0 | 0 | 0 | 0 | 0 | 0 | 12 | 0.4 | 0.023 | 12 | 0.13 | |
| Oppiidae | Amerioppia | 2 | 0.24 | 10 | 0.45 | 6 | 0.2 | 7 | 0.23 | ns | 25 | 0.28 |
| Brachioppiella | 0 | 0 | 1 | 0.05 | 85 | 2.86 | 109 | 3.59 | ns | 195 | 2.15 | |
| Multioppia | 0 | 0 | 4 | 0.18 | 0 | 0 | 0 | 0 | ns | 4 | 0.04 | |
| Oxyoppia | 0 | 0 | 1 | 0.05 | 0 | 0 | 0 | 0 | ns | 1 | 0.01 | |
| Ramusella | 9 | 1.09 | 13 | 0.59 | 45 | 1.51 | 42 | 1.38 | ns | 109 | 1.2 | |
| Stachyoppia | 0 | 0 | 0 | 0 | 0 | 0 | 4 | 0.13 | ns | 4 | 0.04 | |
| Striatoppia | 0 | 0 | 0 | 0 | 0 | 0 | 5 | 0.16 | ns | 5 | 0.06 | |
| Tectocepheidae | Tectocepheus | 309 | 37.32 | 311 | 14.02 | 165 | 5.55 | 285 | 9.39 | ns | 1070 | 11.81 |
| Scutoverticidae | Scutovertex | 0 | 0 | 1 | 0.05 | 1 | 0.03 | 0 | 0 | ns | 2 | 0.02 |
| Phenopelopidae | Eupelops | 12 | 1.45 | 579 | 26.09 | 203 | 6.82 | 61 | 2.01 | 0.001 | 855 | 9.44 |
| Achipteriidae | Achipteria | 0 | 0 | 66 | 2.97 | 82 | 2.76 | 32 | 1.05 | ns | 180 | 1.99 |
| Parachipteria | 9 | 1.09 | 340 | 15.32 | 1038 | 34.89 | 1323 | 43.58 | 0.001 | 2710 | 29.92 | |
| Tegeocranellidae | Tegeocranellus | 0 | 0 | 15 | 0.68 | 0 | 0 | 43 | 1.42 | ns | 58 | 0.64 |
| Oribatellidae | Oribatella | 0 | 0 | 0 | 0 | 0 | 0 | 5 | 0.16 | ns | 5 | 0.06 |
| Parakalummidae | Neoribates | 74 | 8.94 | 2 | 0.09 | 6 | 0.2 | 0 | 0 | 0.01 | 82 | 0.91 |
| Protokalumna | 0 | 0 | 4 | 0.18 | 5 | 0.17 | 7 | 0.23 | ns | 16 | 0.18 | |
| Oribatulidae | Eporibatula | 0 | 0 | 0 | 0 | 0 | 0 | 2 | 0.07 | ns | 2 | 0.02 |
| Geminozetes | 0 | 0 | 0 | 0 | 0 | 0 | 1 | 0.03 | ns | 1 | 0.01 | |
| Annerlia | 1 | 0.12 | 0 | 0 | 0 | 0 | 0 | 0 | ns | 1 | 0.01 | |
| Scheloribatidae | Scheloribates | 0 | 0 | 33 | 1.49 | 19 | 0.64 | 0 | 0 | ns | 52 | 0.57 |
| Haplozetidae | Haplozetes | 16 | 1.93 | 127 | 5.72 | 40 | 1.34 | 366 | 12.06 | 0 | 549 | 6.06 |
| Incabates | 5 | 0.6 | 6 | 0.27 | 6 | 0.2 | 17 | 0.56 | ns | 34 | 0.38 | |
| Ceratozetidae | Ceratobates | 0 | 0 | 0 | 0 | 2 | 0.07 | 0 | 0 | ns | 2 | 0.02 |
| Fuscozetes | 287 | 34.66 | 575 | 25.91 | 602 | 20.24 | 106 | 3.49 | 0.022 | 1570 | 17.33 | |
| Melanozetes | 3 | 0.36 | 11 | 0.5 | 81 | 2.72 | 0 | 0 | ns | 95 | 1.05 | |
| Mycobatidae | Mycobates | 0 | 0 | 0 | 0 | 2 | 0.07 | 3 | 0.1 | ns | 5 | 0.06 |
| Humerobatidae | Humerobates | 0 | 0 | 0 | 0 | 0 | 0 | 2 | 0.07 | ns | 2 | 0.02 |
| Galumannidae | Trichogalumna | 0 | 0 | 7 | 0.32 | 147 | 4.94 | 181 | 5.96 | 0 | 335 | 3.7 |
| Acaridae | Verschthonius | 1 | 0.12 | 0 | 0 | 0 | 0 | 0 | 0 | ns | 1 | 0.01 |
| Total abundance | 828 | 2219 | 2975 | 3036 | 9058 | |||||||
| Total species abundance | 20 | 40 | 34 | 50 | 69 | |||||||
| Total number of family | 11 | 29 | 25 | 39 | 49 | |||||||
Notes: PC: Polytrichum commune Hedw., EY-C: Eleocharis yokoscensis (Franch. et Sav.) Tang et-Cypers sp., SF: Senecio faberii Hemsl, IL: Indocalamus longiauritus Hand.-Mazz. A:Abundance, D: Dominance index.
Appendix C. Photos s of the Dominant Genus of Moss Mites

Figure A1.
Photographs of dominant genera of moss mites in the Jiulongchi wetland, Fanjing Mountain.
Appendix D
Table A4.
Table of factor loadings for PCA analysis of moss mite communities.
Table A4.
Table of factor loadings for PCA analysis of moss mite communities.
| Genus | PCA1 | PCA2 |
| Gamasellus | 0.667 | −0.265 |
| Hypochthonius | 0.614 | −0.377 |
| Camisia | −0.253 | −0.402 |
| Brachioppiella | 0.22 | 0.388 |
| Ramusella | 0.305 | −0.372 |
| Tectocepheus | 0.175 | −0.234 |
| Eupelops | 0.711 | 0.509 |
| Achipteria | 0.346 | 0.642 |
| Parachipteria | 0.917 | 0.055 |
| Haplozetes | 0.299 | −0.611 |
| Fuscozetes | −0.141 | 0.854 |
| Melanozetes | 0.246 | 0.76 |
| Trichogalumna | 0.803 | −0.253 |
References
- Wang, K.; Wang, C.; Feng, X.M.; Wu, X.; Fu, B.J. Research progress on the relationship between biodiversity and ecosystem multifunctionality. Acta Ecol. Sin. 2022, 42, 11–23. (In Chinese) [Google Scholar]
- Wang, H.; Zhang, X.L.; Shan, H.; Lv, C.C.; Ren, W.J.; Wen, Z.H.; Tian, Y.Q.; Weige, B.; Ni, L.Y.; Cao, T. Biodiversity buffers the impact of eutrophication on ecosystem functioning of submerged macrophytes on the Yunnan-Guizhou Plateau, Southwest China. Environ. Pollut. 2022, 314, 120210. [Google Scholar] [CrossRef] [PubMed]
- Tsai, Y.H.; Stow, D.; An, L.; Chen, H.L.; Lewison, R.; Shi, L. Monitoring land-cover and land-use dynamics in Fanjingshan National Nature Reserve. Appl. Geogr. 2019, 111, 102077. [Google Scholar] [CrossRef]
- Jacot, A.P. Biological Notes on the Moss-Mites. Am. Nat. 1930, 64, 285–288. [Google Scholar] [CrossRef]
- Niedbała, W. Moss mites (Acari, Oribatida) from the Slonsk nature reserve. Biol. Bulletln PoznaŃ 2000, 37, 299–302. [Google Scholar]
- Kagainis, U.; Spungis, V. Moss mite (Acari, Oribatida) communities in the Apšuciems calcareous fen, Latvia. Acta Biol. Univ. Daugavp. 2013, 13, 39–53. [Google Scholar]
- Zhou, Z.; Chen, H.; Lin, D.D.; Wang, P.J. Mite community of epihytic bryophytes in evergreen and deciduous broad-leaved mixed forest of Fanjingshan. J. Beijing Norm. Univ. (Nat. Sci.) 2017, 53, 713–721. (In Chinese) [Google Scholar]
- Liu, W.J.; Yin, X.M.; Gong, T.; Liu, Y.; Chen, H. Community Structure of Epilithic Moss Mites and Their Response to Environmental Factors in Different Grades of Rocky Desertification Habitats. Sustainability 2022, 14, 14860. [Google Scholar] [CrossRef]
- Manu, M.; Bancila, R.I.; Onete, M. Importance of moss habitats for mesostigmatid mites (Acari: Mesostigmata) in Romania. Turk. J. Zool. 2018, 42, 673–683. [Google Scholar] [CrossRef]
- Patiño, J.; Vanderpoorten, A. Bryophyte biogeography. Crit. Rev. Plant Sci. 2018, 37, 175–209. [Google Scholar] [CrossRef]
- Gundale, M.J.; Deluca, T.H.; Nordin, A. Bryophytes attenuate anthropogenic nitrogen inputs in boreal forests. Glob. Change Biol. 2011, 17, 2743–2753. [Google Scholar] [CrossRef]
- Turetsky, M.R. The role of bryophytes in carbon and nitrogen cycling. Bryologist 2003, 106, 395–409. [Google Scholar] [CrossRef]
- Kuriki, G. A review of ecological studies on oribatid mites in Sphagnum mires. Jpn. J. Ecol. 2000, 50, 141–153. [Google Scholar]
- Klimek, A.; Rolbiecki, S. Moss mites (Acari: Oribatida) in soil revitalizing: A chance for practical application in silviculture. Biol. Lett. 2014, 51, 71–82. [Google Scholar] [CrossRef]
- Jacot, A.P. Moss-Mites as Spore-Bearers. Mycologia 1930, 22, 94–96. [Google Scholar] [CrossRef]
- Pereira, H.M.; Leadley, P.W.; Proenca, V.; Alkemade, R.; Scharlemann, J.P.W.; Fernandez-Manjarres, J.F.; Araujo, M.B.; Balvanera, P.; Biggs, R.; Cheung, W.W.L. Scenarios for global biodiversity in the 21st century. Science 2010, 330, 1496–1501. [Google Scholar] [CrossRef]
- Thomas, C.D.; Cameron, A.; Green, R.E.; Bakkenes, M.; Beaumont, L.J.; Collingham, Y.C.; Erasmus, B.F.N.; Siqueira, M.F.D.; Grainger, A.; Hannah, L.; et al. Extinction risk from climate change. Nature 2004, 427, 145–148. [Google Scholar] [CrossRef]
- Chen, S.; Milne, R.I.; Zhou, R.; Meng, K.; Yin, Q.; Guo, W.; Ma, Y.; Mao, K.; Xu, K.; Kim, Y.D.; et al. When tropical and subtropical congeners met: Multiple ancient hybridization events within Eriobotrya were detected in the Yunnan-Guizhou Plateau, a tropical-subtropical transition area in China. Mol. Ecol. 2021, 31, 1543–1561. [Google Scholar] [CrossRef]
- Cameron, A.J.; Nickless, G. Use of mosses as collectors of airborne heavy metals near a smelting complex. Water Air Soil Pollut. 1977, 7, 117–125. [Google Scholar] [CrossRef]
- Wu, Y.; Gao, C.; Cheng, G.; Yu, X.; Cao, T. Response of bryophytes to global change and its bioindicatortation. Chin. J. Appl. Ecol. 2002, 13, 895–900. [Google Scholar]
- Borcard, D.; Matthey, W. Effect of a controlled trampling of Sphagnum mosses on their oribatid mite assemblages (Acari, Oribatei). Pedobiologia 1995, 39, 219–230. [Google Scholar]
- Liu, P.; Tang, K.X.; Chen, H.; Liang, J.; Cai, X.L. Species Diversity on Moss Soil Microhabitat in Heilongjiang Province. Sci. Technol. Rev. 2012, 30, 69–72. (In Chinese) [Google Scholar]
- Daniel, B. Typology of the Oribatid mite species assemblages of the peat-bog Le Cachot (Swiss Jura mountains): Indicator species or characteristic species groups? Bull. Soc. Neuchatel. Sci. Nat. 1996, 119, 63–73. [Google Scholar]
- Wang, Q.T.; Zhao, C.; Zheng, Y.; Ashiq, M.W.; Xu, M. Moss coverage improves the microclimates of subalpine forests: Implications of Qinghai spruce recruitment in Qilian Mountains, northwest China. Pak. J. Bot. 2019, 51, 1719–1735. [Google Scholar] [CrossRef] [PubMed]
- Liu, Q.; Wang, H.M.; Gong, L.F.; Xing, X.; Huang, X.Y.; Qin, Y.M. Symbiotic Bacterial Community of Sphagnum palustre in Dajiuhu Peatland, Hubei, P.R. China. Quat. Sci. 2013, 33, 79–87. (In Chinese) [Google Scholar]
- Tang, X.P.; Huang, G.L. Study on Classification System for Wetland Types in China. For. Res. 2003, 16, 531–539. (In Chinese) [Google Scholar]
- Editorial Board of the Scientific Survey of the Fanjingshan Mountain Preserve Guizhou Province, China. Scientific Survey of The Fanjingshan Mountain Preserve Guizhou Province, China; China Environmental Science Press: Beijing, China, 1986; pp. 120–121. (In Chinese) [Google Scholar]
- Ren, A.; Hu, D.Y.; Qi, P.X.; Zhang, S.C.; Gao, H.M.; Mickan, B.S.; Xiong, Y.C.; Yuan, L.Y. Buffering effects of soil seed bank on annual plant community composition after wetland drying. Land Degrad. Dev. 2022, 1–11. [Google Scholar] [CrossRef]
- Ma, M.; Baskin, C.C.; Yu, K.; Ma, Z.; Du, G.Z. Wetland drying indirectly influences plant community and seed bank diversity through soil pH. Ecol. Indic. 2017, 80, 186–195. [Google Scholar] [CrossRef]
- Pan, L.; Jiao, D.Z.; Wang, W.F.; Guo, J.X. Soil Fauna Distribution and Diversity in Moss Communities in Zhalong National Nature Reserve Wetland. Soils 2010, 42, 536–540. [Google Scholar]
- Page, S.E.; Baird, A.J. Peatlands and Global Change: Response and Resilience. Annu. Rev. Environ. Resour. 2016, 41, 35–57. (In Chinese) [Google Scholar] [CrossRef]
- Seniczak, S.; Seniczak, A.; Gwiazdowicz, D.J.; Coulson, S.J. Community Structure of Oribatid and Gamasid Mites (Acari) in Moss-Grass Tundra in Svalbard (Spitsbergen, Norway). Arct. Antarct. Alp. Res. 2014, 46, 591–599. [Google Scholar] [CrossRef]
- Chen, P.Y.; Zhou, Q.Y.; Lin, S.J.; Qiao, Y.L.; Sun, Y.M. The changes of vegetation and climate of Jiulongchi Section of Fanjingshan Mountain in Guizhou since 10,000 years ago. Geol. Guizhou 1992, 9, 167–175. (In Chinese) [Google Scholar]
- Gao, Y.; Xiong, K.N.; Quan, M.Y.; Song, B.; Peng, H.J.; Peng, H.R.; Shen, W.D.; Bao, K.S. Holocene climate dynamics derived from pollen record of Jiulongchi wetland in Fanjing Mountain, southwest China. Quat. Int. 2019, 513, 1–7. [Google Scholar] [CrossRef]
- Liu, G.F.; Yang, M.F. Preliminary research on community structure and diversity of soil Oribatid mites in Fanjing Mountain Nature Reserve. J. Mt. Agric. Biol. 2003, 22, 27–33. (In Chinese) [Google Scholar]
- Liu, G.F.; Yang, M.F. Research on community structure and diversity of soil oribatid mites in Fanjing mountain. J. Anhui Agric. Sci. 2011, 39, 142–144, 197. (In Chinese) [Google Scholar]
- Liu, G.F.; Yang, M.F. Preliminary Research on the Soil Oribatid Fauna of Fanjing Mountain in the Genus Level. Life Sci. Res. 2012, 16, 149–152. (In Chinese) [Google Scholar]
- Liu, G.F.; Yang, M.F. Seasonal Dynamics of Soil Oribatid Mite Community in Fanjing Mountain National Nature Reserve, Guizhou Province. Chin. J. Zool. 2013, 48, 58–64. (In Chinese) [Google Scholar]
- Lin, D.D.; Chen, H.; Chen, H.; Liu, P.P.; Liu, Q.S. Soil mite community structure in the evergreen, broad-leaved forest of Fanjing mountain, China. Chin. J. Appl. Environ. Biol. 2018, 24, 1185–1194. (In Chinese) [Google Scholar]
- Wang, P.J.; Chen, H.; Zhou, Z.; Lin, D.D.; Wu, R.X.; Zhu, J.Y. Soil Mite Community Structure in Mixed Evergreen and Deciduous Broad-leaved Forest of Fanjingshan. Soils 2018, 50, 687–695. (In Chinese) [Google Scholar]
- Zhong, Y.P.; Shu, G.Y.; Yan, L.H. Analysis of the impact of the Fanjian Mountains on local climate. J. Guizhou Meteorol. 2011, 35, 25–28. (In Chinese) [Google Scholar]
- Xie, R.B.; Mao, J.; Bai, Q.Q. Preliminary Analysis on the Climatic Characteristics and Tourism Climate of Fanjingshan. J. Guizhou Meteorol. 2015, 39, 34–36. (In Chinese) [Google Scholar]
- Chen, P. Collection and investigation methods of soil animals. Chin. J. Ecol. 1983, 03, 46–51. (In Chinese) [Google Scholar]
- Krantz, G.W.; Walter, D.E. A Manual of Acarology, 3rd ed.; Texas Tech University Press: Lubbock, TX, USA, 2009; pp. 1–794. [Google Scholar]
- Ying, W.Y. Pictorical Keys to Soil Animals of China; Science Press: Beijing, China, 1998; pp. 163–242, 527–562. (In Chinese) [Google Scholar]
- Yin, S.G.; Bei, N.X.; Chen, W.P. Soil Gamasid Mites in Northeast China; China Agriculture Press: Beijing, China, 2013; pp. 8–340. (In Chinese) [Google Scholar]
- Li, L.S.; Li, Y.R. Acarology; Chongqing Press: Chongqing, China, 1989; pp. 264–419. (In Chinese) [Google Scholar]
- Kamczyc, J.; Urbanowski, C.; Pers-Kamczyc, E. Mite communities (Acari: Mesostigmata) in young and mature coniferous forests after surface wildfire. Exp. Appl. Acarol. 2017, 72, 145–160. [Google Scholar] [CrossRef] [PubMed]
- Chen, C.C.; Chen, H.; Zhang, Y.; Thomas, H.R.; Frank, M.H.; He, Y.H.; Xia, R. TBtools: An Integrative Toolkit Developed for Interactive Analyses of Big Biological Data. Mol. Plant 2020, 13, 1194–1202. [Google Scholar] [CrossRef] [PubMed]
- Ter Braak, C.J.F.; Smilauer, P. Canoco Reference Manual and User’s Guide: Software for Ordination, Version 5.0; Microcomputer Power: Ithaca, NY, USA, 2012. [Google Scholar]
- Magurran, A.E. Measuring biological diversity. Curr. Biol. 2021, 31, R1174–R1177. [Google Scholar] [CrossRef] [PubMed]
- Doblas-Miranda, E.; Sánchez-Piñero, F.; González-Megías, A. Soil macroinvertebrate fauna of a Mediterranean arid system: Composition and temporal changes in the assemblage. Soil Biol. Biochem. 2007, 39, 1916–1925. [Google Scholar] [CrossRef]
- Ruf, A. A maturity index for predatory soil mites (Mesostigmata: Gamasina) as an indicator of environmental impacts of pollution on forest soils. Appl. Soil Ecol. 1998, 9, 447–452. [Google Scholar] [CrossRef]
- Aoki, J. Analysis of Oribatid Communities by relative abundance in the species and individual numbers of the three major groups (MGP-analysis). Bull. Inst. Environ. Sci. Technol. Yokohama Nat. Univ. 1983, 10, 171–176. [Google Scholar]
- Xie, G.L.; Fu, X.R.; Liu, J.L.; Wang, C.R.; Zheng, J.J. The community distribution of soil oribatida in Heze Peony Garden. Acta Ecol.Sin. 2004, 24, 693–699. (In Chinese) [Google Scholar]
- Chen, H.; Jin, D.C.; Wen, Z.H. Differences in soil mite communities in Karst Areas with different degrees of rocky desertification. Chin. J. Appl. Entomol. 2018, 55, 711–724. (In Chinese) [Google Scholar]
- Chen, H. Study on community structure of soil mites in the rocky desertification areas without and with ecological management. Ph.D. Thesis, Institute of Entomology, Guizhou University, Guiyang, China, 2018. (In Chinese). [Google Scholar]
- Lin, Y.L.; Sun, X.; Liu, D.; Dai, G.H.; Liu, J.P.; Wu, H.T. Habitat Variations of Typical Soil Arthropods Community Structure in Hani Peatland. Chin. J. Ecol. 2023, 1–14. (In Chinese) [Google Scholar]
- Zhang, H. Response Characteristics of Soil Microarthropod Community Structure in Marsh of Northeast China to Warming. Master’s Thesis, Northeast Institute of Geography and Agroecology Chinese Academy of Science, Changchun, China, 2020. (In Chinese). [Google Scholar]
- Dou, Y.J. Effects of Warming on Macro- and Meso- Soil Fauna Community and Greenhouse Gas Emissions in the Peatland, Great Hing’ an Mountains. Ph.D. Thesis, Northeast Institute of Geography and Agroecology Chinese Academy of Science, Changchun, China, 2019. (In Chinese). [Google Scholar]
- Shao, Z.Z.; Wu, P.F. Responses of epigeic microarthropods to alpine wetland degradation. Acta Ecol. Sin. 2019, 39, 6990–7001. (In Chinese) [Google Scholar]
- Melekhina, E.N.; Kanev, V.A.; Deneva, S.V. Karst Ecosystems of Middle Timan, Russia: Soils, Plant Communities, and Soil Oribatid Mites. Diversity 2022, 14, 718. [Google Scholar] [CrossRef]
- Seniczak, A.; Seniczak, S.; Kowalski, J.; Graczyk, R.; Mistrzak, M. Mites (Acari) at the edges of bog pools in Orawa–Nowy-Targ Basin (S Poland), with particular reference to the Oribatida. Biol. Lett. 2014, 51, 93–106. [Google Scholar] [CrossRef]
- Norton, R.A.; Behan-Pelletier, V.M. Eniochthonius mahunkai sp. n.(Acari: Oribatida: Eniochthoniidae), from North American peatlands, with a redescription of Eniochthonius and a key to North American species. Acta Zool. Acad. Sci. Hung. 2007, 53, 295–333. [Google Scholar]
- Murvanidze, M.; Kvavadze, E. An Inventory of Oribatid Mites, the Main Decomposers in Bogs of Colchic Lowland (Caucasus, Georgia). In Trends in Acarology; Springer: Dordrecht, The Netherlands, 2010; pp. 175–178. [Google Scholar]
- Seniczak, A.; Seniczak, S.; Iturrondobeitia, J.C.; Solhøy, T.; Flatberg, K.I. Diverse Sphagnum mosses support rich moss mite communities (Acari, Oribatida) in mires of western Norway. Wetlands 2020, 40, 1339–1351. [Google Scholar] [CrossRef]
- Gormsen, D.; Hedlund, K.; Huifu, W. Diversity of soil mite communities when managing plant communities on set-aside arable land. Appl. Soil Ecol. 2006, 31, 147–158. [Google Scholar] [CrossRef]
- Wu, D.H.; Zhang, B.; Bu, Z.Y.; Chen, P. The characteristics of community structure of soil mites from different habitats in Changchun area. Acta Ecol. Sin. 2006, 1, 16–25. (In Chinese) [Google Scholar] [CrossRef]
- Lin, D.D. Study on the Structures and Values of Soil Mites in Fanjingshan World Natural Heritage Nomination. Master’s Thesis, Guizhou Normal University, Guiyang, China, 2018. (In Chinese). [Google Scholar]
- Seniczak, A.; Seniczak, S.; Graczyk, R.; Kaczmarek, S.; Jordal, B.H.; Kowalski, J.; Djursvoll, P.; Roth, S.; Bolger, T. A Forest Pool as a Habitat Island for Mites in a Limestone Forest in Southern Norway. Diversity 2021, 13, 578. [Google Scholar] [CrossRef]
- Seniczak, S.; Graczyk, R.; Seniczak, A.; Faleńczyk-Koziróg, K.; Kaczmarek, S.; Marquardt, K. Microhabitat preferences of Oribatida and Mesostigmata (Acari) inhabiting lowland beech forest in Poland and the trophic interactions between these mites. Eur. J. Soil Biol. 2018, 87, 25–32. [Google Scholar] [CrossRef]
- Wu, D.H.; Yin, W.Y.; Yang, Z.M. Difference in soil mite community characteristics among different vegetation restoration practices in the moderatly degraded pasture of Songnen grassland. Acta Zool. Sin. 2007, 4, 607–615. (In Chinese) [Google Scholar]
- Arroyo, J.; Kenny, J.; Bolger, T. Variation between mite communities in Irish forest types–importance of bark and moss cover in canopy. Pedobiologia 2013, 56, 241–250. [Google Scholar] [CrossRef]
- Ding, C.C.; Dai, Z.K.; Xue, X.F.; Li, H.X.; Liu, M.Q.; Chen, X.Y.; Zhou, J.; Zhang, B.; Hu, F. Effects of vegetations restoration on soil mite community in degraded red soil, Subtropical China. Acta Ecol. Sin. 2008, 28, 4771–4781. (In Chinese) [Google Scholar]
- Long, W.; Gao, Y.M.; Wu, P.F. Effects of alpine meadow degradation on epigeic arthropod communities in Zoigê. Chin. J. Ecol. 2018, 37, 128–138. (In Chinese) [Google Scholar]
- Staley, J.T.; Hodgson, C.J.; Mortimer, S.R.; Morecroft, M.D.; Masters, G.; Brown, V.K.; Taylor, M.E. Effects of summer rainfall manipulations on the abundance and vertical distribution of herbivorous soil macro-invertebrates. Eur. J. Soil Biol. 2007, 43, 189–198. [Google Scholar] [CrossRef]
- Seniczak, S.; Kaczmarek, S.; Seniczak, A. Oribatid mites (Acari, Oribatida) of bushy patches in steppe vegetation of cape Tarkhankut in Crimea (Ukraine). Biol. Lett. 2011, 48, 177–183. [Google Scholar] [CrossRef]
- Borcard, D.; Ballmoos, V.C. Oribatid mites (Acari, Oribatida) of a primary peat bog-pasture transition in the Swiss Jura mountains. Ecoscience 1997, 4, 470–479. [Google Scholar] [CrossRef]
- Minor, M.A.; Ermilov, S.G.; Philippov, D.A. Hydrology-driven environmental variability determines abiotic characteristics and Oribatida diversity patterns in a Sphagnum peatland system. Exp. Appl. Acarol. 2019, 77, 43–58. [Google Scholar] [CrossRef]
- Ning, J.; Liu, S.; Chang, S.; Chen, X.J.; Charles, P.W.; Hou, F.J. Dominant species as biological indicators to predict the changes of trace element in different types of rangeland. Ecol. Indic. 2022, 137, 108735. [Google Scholar] [CrossRef]
- Manu, M. Diversity of soil mites (Acari: Mesostigmata: Gamasina) in various deciduous forest ecosystems of Muntenia region (southern Romania). Biol. Lett. 2013, 50, 3–16. [Google Scholar] [CrossRef]
- Shen, W.D.; Xiong, K.N.; Gao, Y.; Quan, M.Y.; Peng, H.J.; Yang, T.; He, L.F.; Bao, K.S. Distribution of Potential Harmful Trace Elements and Potential Ecological Risk in the Jiulongchi Wetland of Fanjing Mountain, Southwest China. Int. J. Environ. Res. Public Health 2020, 17, 1731. [Google Scholar] [CrossRef] [PubMed]
- Chen, G.D.; Li, M.D.; Wen, Z.G. An investigation on the distribution habitat of oribatid mites and their altitude in Huangshan Mountain. J. Nanjing Railw. Med. Coll. 1992, 11, 17–23. (In Chinese) [Google Scholar]
- Donaldson, G.M. Oribatida (Acari) associated with three species of Sphagnum at Spruce Hole Bog, New Hampshire, U.S.A. Can. J. Zool. 1996, 74, 1706–1712. [Google Scholar] [CrossRef]
- Lehmitz, R.; Maraun, M. Small-scale spatial heterogeneity of stable isotopes signatures (δ 15 N, δ 13 C) in Sphagnum sp. transfers to all trophic levels in oribatid mites. Soil Biol. Biochem. 2016, 100, 242–251. [Google Scholar] [CrossRef]
- Norton, R.A. Suborder oribatida. A Manual of Acarology; Texas Tech University Press: Lubbock, TX, USA, 2009; pp. 430–564. [Google Scholar]
- Luxton, M. Studies on the oribatid mites of a Danish beech wood soil. 1, Nutritional biology. Pedobiologia 1972, 12, 434–463. [Google Scholar]
- Wallork, J.A. Notes on the feeding-behaviour of some forest soil Acarina. Oikos 1958, 9, 260–271. [Google Scholar] [CrossRef]
- Mumladze, L.; Murvanidze, M.; Maraun, M.; Salakaia, M. Oribatid mite communities along an elevational gradient in Sairme gorge (Caucasus). Exp. Appl. Acarol. 2015, 66, 41–51. [Google Scholar] [CrossRef]
- Fischer, B.M.; Schatz, H. Biodiversity of oribatid mites (Acari: Oribatida) along an altitudinal gradient in the Central Alps. Zootaxa 2013, 3626, 429–454. [Google Scholar] [CrossRef]
- Peet, R.K. The Measurement of Species Diversity. Annu. Rev. Ecol. Syst. 1974, 5, 285–307. [Google Scholar] [CrossRef]
- Yeates, G.W. Abundance, diversity, and resilience of nematode assemblages in forest soils. Can. J. For. Res. 2007, 37, 216–225. [Google Scholar] [CrossRef]
- Wu, P.F.; Liu, S.R.; Liu, X.L. Composition and spatio-temporal changes of soil macroinvertebrates in the biodiversity hotspot of northern Hengduanshan Mountains, China. Plant Soil 2012, 357, 321–338. [Google Scholar] [CrossRef]
Disclaimer/Publisher’s Note: The statements, opinions and data contained in all publications are solely those of the individual author(s) and contributor(s) and not of MDPI and/or the editor(s). MDPI and/or the editor(s) disclaim responsibility for any injury to people or property resulting from any ideas, methods, instructions or products referred to in the content. |
© 2023 by the authors. Licensee MDPI, Basel, Switzerland. This article is an open access article distributed under the terms and conditions of the Creative Commons Attribution (CC BY) license (https://creativecommons.org/licenses/by/4.0/).