Article

Tropical Forest Microclimatic Changes: Hurricane, Drought, and 15–20 Year Climate Trend Effects on Elevational Gradient Temperature and Moisture

by
Ashley E. Van Beusekom
*,
Grizelle González
and
María M. Rivera
USDA Forest Service International Institute of Tropical Forestry, 1201 Calle Ceiba Jardín Botánico Sur, San Juan, PR 00926-119, USA
*
Author to whom correspondence should be addressed.
Forests 2023, 14(2), 325; https://doi.org/10.3390/f14020325
Submission received: 14 November 2022 / Revised: 2 February 2023 / Accepted: 4 February 2023 / Published: 6 February 2023
(This article belongs to the Section Forest Meteorology and Climate Change)

Abstract

:
The effects of hurricanes Irma and Maria and a severe drought on the temperature, precipitation, and soil moisture (under canopy and in the open) were calculated at 22 sites from 0–1045 m in northeastern Puerto Rico from 2001–2021, against the background short-term trend. Median and minimum air temperatures increased uniformly across the elevational gradient, 1.6 times as fast in the air under the canopy (+0.08 °C/yr) and 2.2 times as fast in the soil under the canopy (+0.11 °C/yr) as for air temperature in the open. There were no substantial moisture trends (average decrease <0.01 mm/yr). The peak effect of the hurricanes on under-canopy air temperature was the same as under-canopy soil temperature at 1000 m (+3, 0.7, 0.4 °C for maximum, median, minimum) but air maximum and minimum temperature peak effects were twice as high at 0 m (and soil temperatures stayed constant). Soil temperature hurricane recovery took longer at higher elevations. The peak effect of the hurricanes and the drought on the soil moisture was the same (but in opposite directions, ±0%), except for the wettest months where drought peak effect was larger and increasing with elevation. Differing patterns with elevation indicate different ecosystem stresses.

1. Introduction

Against the long-term trend of climate warming, tropical forests exhibit a cycle of non-equilibrium, as hurricanes defoliate canopies and expose the ecosystem below to large step-changes [1,2,3]. Severe droughts disturb ecosystems over months instead of days, but still make relatively quick changes to available moisture, causing foliage loss and raising maximum soil temperature (due to heat capacity of drier soils; [4,5]). Yet, microclimates are buffered from the climate by the structure of tropical forests, forests that are often in mountainous terrain. It is not well understood how climatic changes, long-term to short-term, behave across an elevation gradient, and it is often assumed the spatial pattern of the microclimatic variables has continued to stay the same with climatic shifts occurring in a uniform proportional manner (precipitation and moisture) or uniform scalar manner (temperature) across elevation gradients [6,7,8].
Whether droughts or hurricanes cause more disturbance to the biota depends on (but is not limited to) differences in the vegetation and the elevation, as well as the adaptations of that species and the past event history [9,10]. Observationally, the canopies of the highest forests recover from hurricane disturbance much slower than their lower elevation counterparts [11,12]. However, ecosystem structure (root mass, canopy cover) in tropical forests has been shown to recover from disturbances of hurricanes and droughts more slowly than ecosystem function (decomposition, productivity) [13], so hypothesizing recovery paths of temperature and moisture along an elevational gradient is not straightforward. Moreover, long-term climatic changes will continue to accumulate and should not be discounted; any future hurricane and drought changes will act upon a microclimate that has experienced long-term change [14].
Recently, large disturbances have affected the tropical montane forests of northeastern Puerto Rico, an area heavily studied for wide distribution of tropical microbe and animal characteristics [15,16,17,18], soil dynamics [19,20,21], and vegetation properties [22,23,24]. These distributions are attributed to the microclimatic differences along the elevation gradient. In these studies, it was found that the relationships between the microbe and animal characteristics, soil dynamics, and vegetation properties depend on abiotic climate drivers to varying degrees and hypothesized that climatic changes will not affect all biota the same through time or space [9]. A need was identified to understand the microclimatic abiotic changes that are happening currently inside tropical forests in response to climatic changes, to provide a basis for observed biota trajectories. The disturbances provided an opportunity to study the regional patterns of different kinds of climatic changes. A drought started in May 2015, and the region was still experiencing drought conditions until March 2016 (https://droughtmonitor.unl.edu, accessed on 10 August 2022). In September 2017, two hurricanes impacted the region in quick succession: category 5 hurricane Irma passed 100 km to the north on 7 September, and category 4 hurricane Maria hit directly on September 20.
Due to the importance of tropical forest ecosystems, several previous studies have focused on the microclimate changes in northeastern Puerto Rico from these same large disturbances. After the hurricanes in Puerto Rico, one study found that satellite vegetation indices, “greenness”, recovered slower in upland evergreen forests with increasing elevation, but recovered faster in mangroves and riparian areas with increasing elevation [25]. LiDAR data showed different results on the effect of the hurricanes, specifically that the taller trees in the lower elevation forests had more damage than the shorter trees in the higher elevation forests [26]. These hurricane studies were done with remote sensing, which is spatially complete and cost-effective when the resulting data are primarily needed for relatively rapid assessment in forest dynamics, not microclimate abiotic variable measurement. With the severe drought, it was found that greenness recovered faster in areas that were more affected by the drought, with a possible connection to a drought-induced canopy opening allowing fast new growth with post-drought moisture [27]. Field studies found that hydraulic traits of 46 different forest species could not be used to predict the magnitudes of growth decline from the drought, and concluded that further microclimate study was needed [28,29].
The objective of this study was to evaluate how drought, hurricane, and 15–20 years of climatic changes were manifesting across the microclimates of an elevational gradient, with emphasis on the differences or lack of differences seen across the gradient and hypothesizing that some types of disturbances will be more varying across the gradient than other types. By measuring air and soil temperature, precipitation, and soil moisture along an elevational gradient in northeastern Puerto Rico, in the open, and under the canopy, abiotic markers were measured that will be useful for translating ecosystem response to microclimate change, including forest changes seen in biotic and remote sensing data. The short-term trends and the effects of each event on the abiotic data were calculated along the elevational gradient at 22 sites. This study is the first synthesis of what will become a long-term record that serves to interpret tropical ecosystem microclimate responses to climatic changes.
The climate changes analyzed are relatively short-term. However, this is an area of ongoing data collection. Elevational gradient climate changes have been studied on records of 18–100 years around the globe; the data collected here are now becoming a long enough record to add more tropical data to the conglomeration [30]. Any mathematical trend line in the data were calculated over 2–3 periods to underscore the instability of short-term trend calculations in comparison to long-term calculations. It is important to identify the nature of the gradual changes to properly analyze the hurricane and drought changes that are happening on top of the gradual changes, while recognizing that longer-term climatic changes may present differently moving into the future. Results from this study highlight the possibility of differing patterns of microclimate change across elevation gradients in tropical ecosystems, meaning different aspects of climate change pressure in high, low, and mid-range elevational areas.

2. Materials and Methods
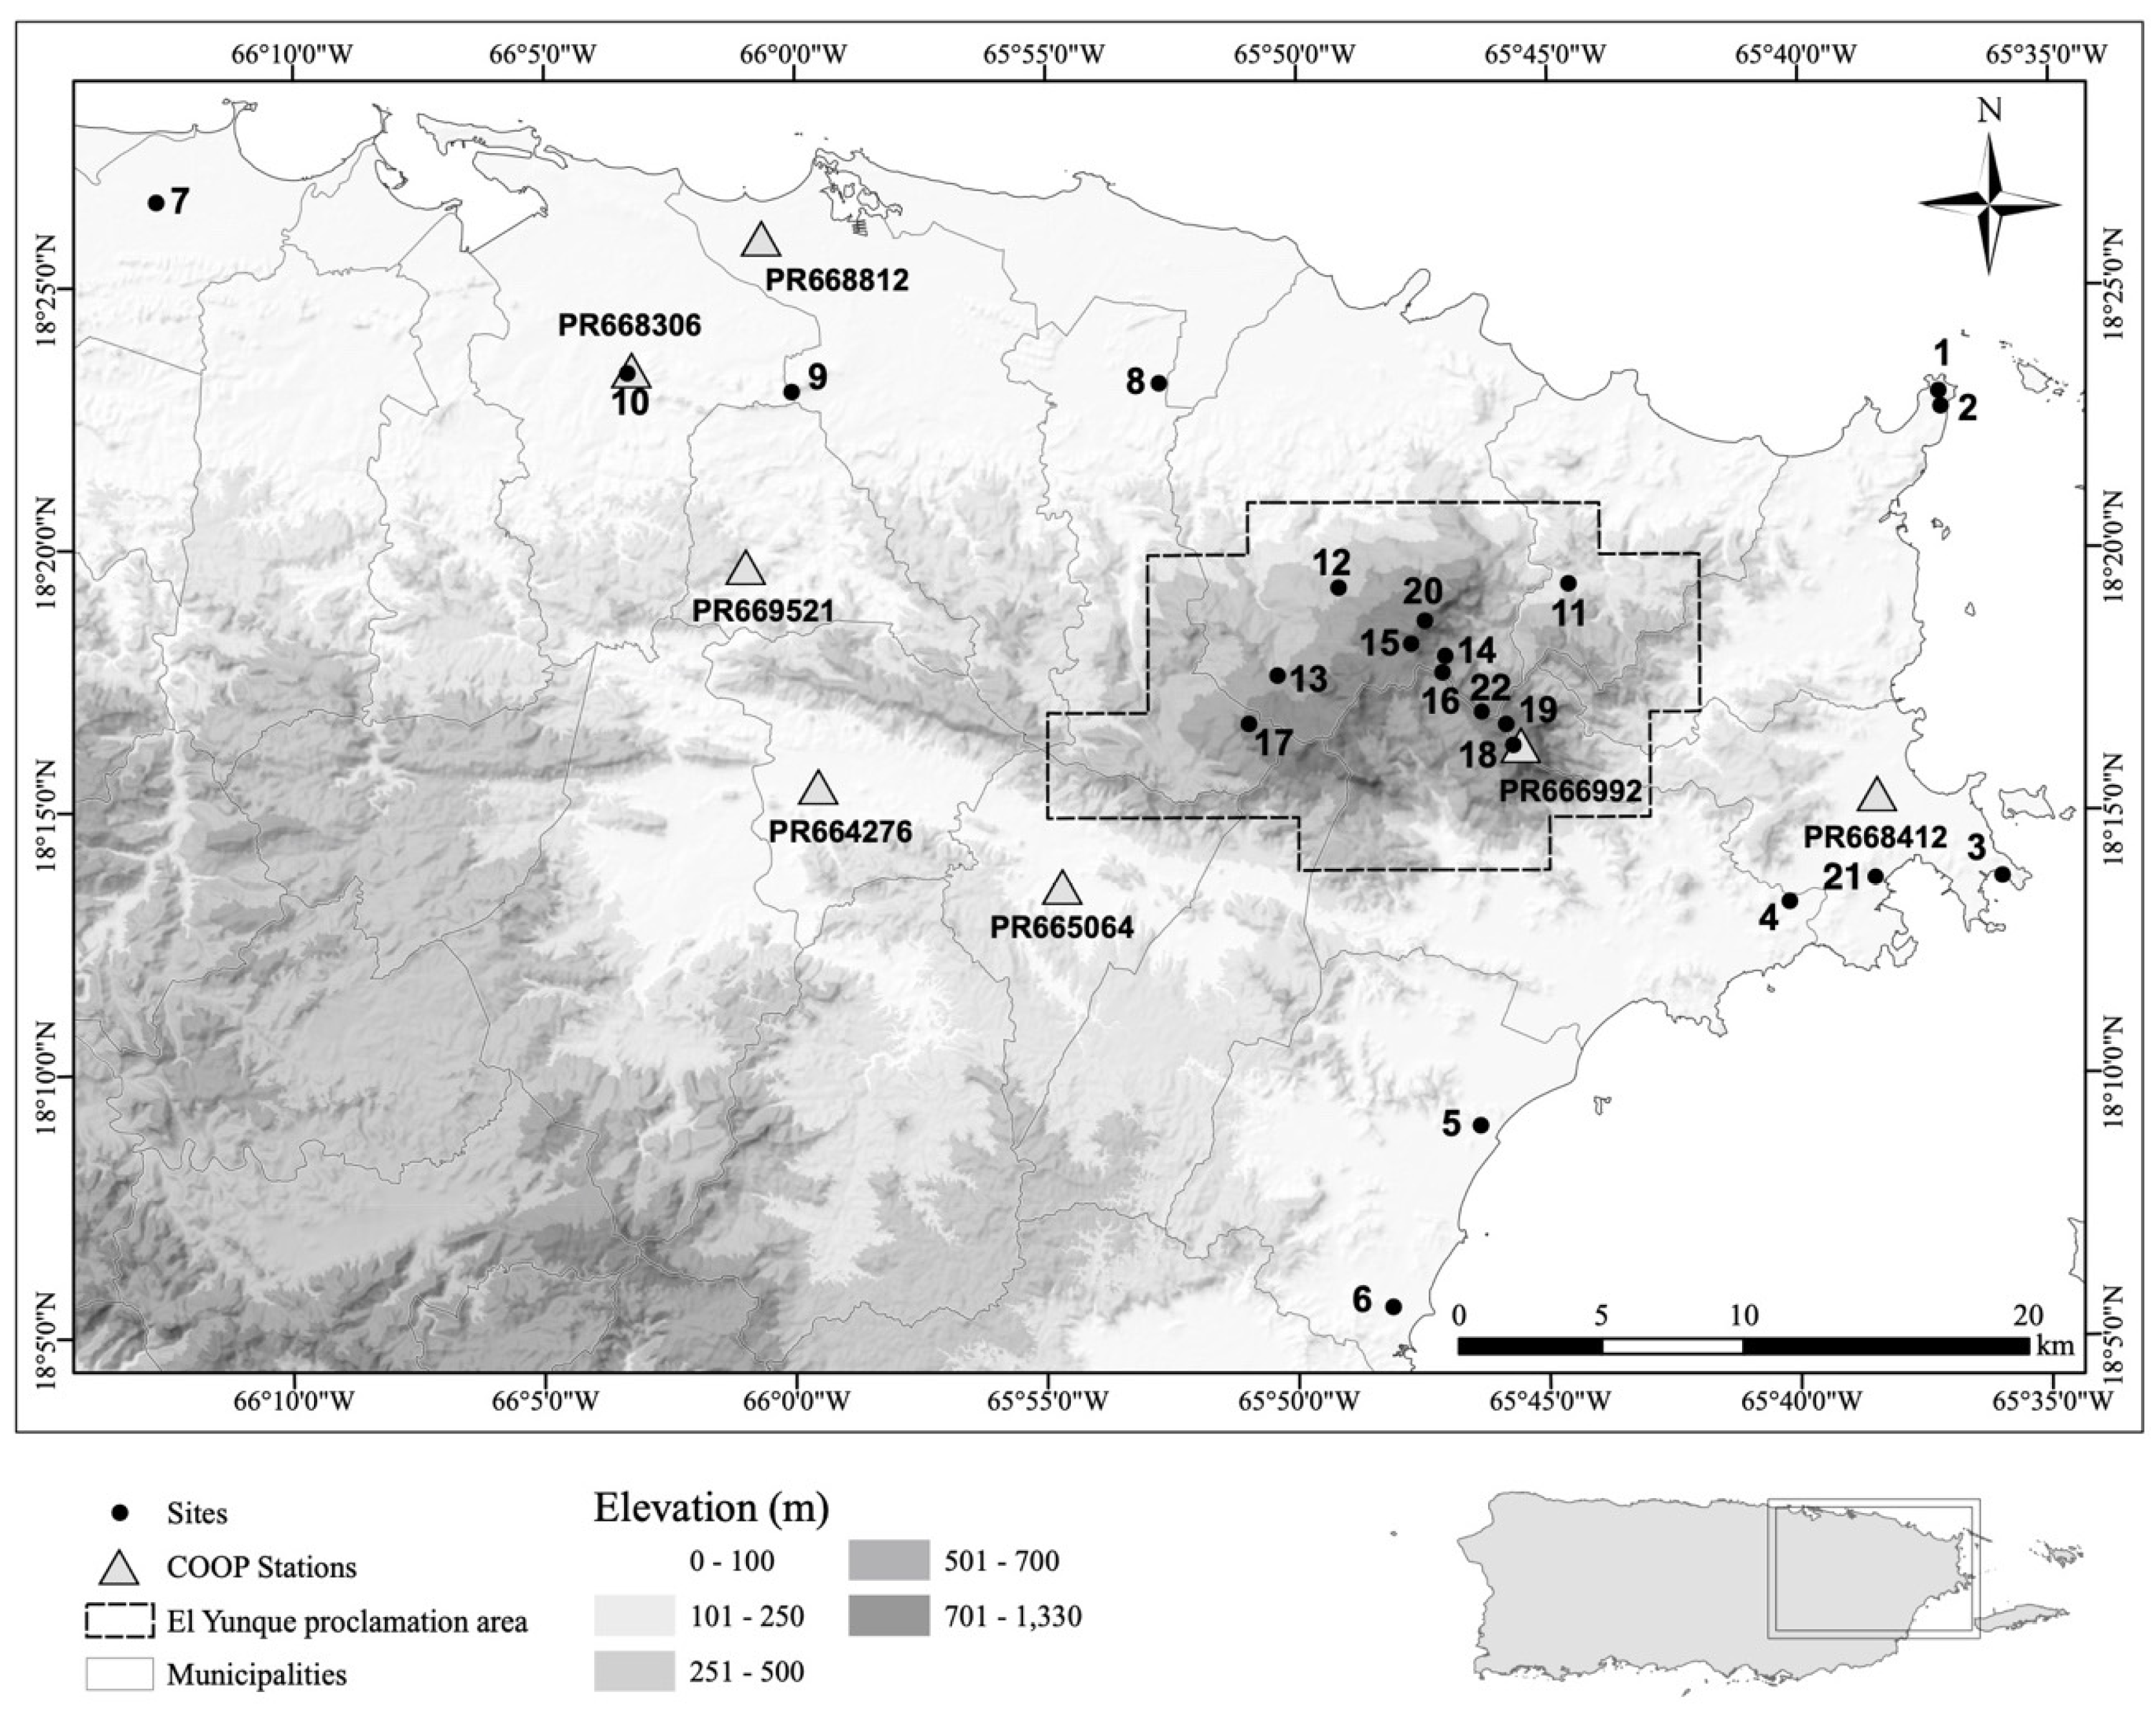
2.1. Study Area

The main island of Puerto Rico is approximately 8900 km2 with a thin strip of coastal plains, 8–16 km wide, surrounding steep igneous upland. In the northeastern part of the island are the Luquillo Mountains which dominate the geomorphology. Elevational gradient analysis within northeast Puerto Rico, down from the high point (1077 m) of the Luquillo Mountains peaks to the coast and inland to San Juan, and shows microclimate and soil influence with different vegetation types [31,32,33]. Temperature and precipitation are dominated by orographic influences and thus have approximately monotonic relationships with elevation across the gradient [34]. In the forest, productivity also varies strongly with elevation-dependent solar isolation, in comparison to other abiotic influences [8]. The vegetation in the upper reaches of the Luquillo Mountains is in a cloud forest (above 750 m [35]).
The weather in northeastern Puerto Rico is dominated by the easterly trade winds, like much of the Caribbean [36,37]. Annual trade winds are driven by an interplay of the North Atlantic Subtropical High (NASH) and the Inter-Tropical Convergence Zone (ITCZ) position [38], creating a cooler winter dry season and two wet seasons separated by a mid-summer drought [39].
The 22 observation sites for this study were selected to be along an elevation gradient from sea level to the top of the Luquillo Mountains (see Figure 1 and Table 1). They are spatially inclusive of the entire northeastern area and thus represent the different Holdridge Life Zones in northeastern Puerto Rico, and the further divisions from soil and atmospheric properties [40,41]. These are the subtropical dry, subtropical moist, subtropical wet, subtropical lower montane, subtropical lower montane rain, and subtropical rain forest life zones [24]. Vegetation varies from mangroves and riparian forests, lowland semi-evergreen and deciduous dry and moist forests, and wetter upland evergreen and palm forests. The upland forests have trees ranging from as tall as 30 m (tabonuco), to 15 m (colorado), to 6 m (elfin) [24]. The sites also represent the three mesoclimates distinguished in the area: the urban heat island around San Juan, the Luquillo Mountains, and the area to the southeast of the mountains [42]. Almost all of these sites were analyzed for short-term temperature and precipitation trends away from canopy vegetation (open air) from August 2001 to July 2013, in a previous study [34].

2.2. Methods

This study builds on the methods developed in a previous study [34], using seasonal non-parametric trend tests on temperature and precipitation in open areas along the elevational gradient, and extends the methods to analyze new data types of temperature and moisture beneath the canopy. Trends were analyzed for the period before the drought, before the 2017 hurricanes, and the data in the open were also analyzed for the entire period of record. The four periods of data were used to aid in analyzing the hurricane and drought climatic changes but also highlight the different trends that can be observed when looking at only short-term climate records. The trends and median seasonal cycle before the drought were used to define a peak effect from the drought in the soil variables and the precipitation, as well as the length of time the drought affected each variable. Similarly, the trends and median seasonal cycle before the hurricanes were used to define a peak effect from the hurricane disturbance in each variable observed under the canopy, as well as a length of time the hurricanes affected each variable (hurricane recovery).
Temperature data beneath the canopy (air and soil) were collected over the 22 sites from August 2006 through September 2021. Temperature data, as well as precipitation data in the open were collected for 20 of these sites starting in August 2001. Soil moisture data were only collected at 4 of the sites, starting later in April 2009. The trend, peak effects, and effect lengths at each site were analyzed for a linear relationship with elevation for each variable using linear regression. All statistical tests were performed at the 0.10 level of significance (90% level of confidence bounds), to agree with the previous study on these data [34].

2.2.1. Data Collection

All temperature data underneath the canopy, as well as in the open were collected at each site by Thermochron iButtons recording at 30 min intervals, in the air or in the soil (only under the canopy). Daily median, daily minimum, and daily maximum values were derived from the 30 min data. A daily value was considered missing if a quarter or more of the 30 min data were missing (sequentially) on that day (Table 1). The percentage of missing 30 min observations gave a measure of the accuracy of calculated daily temperature statistics (i.e., daily median, maximum, and minimum).
Table 1. Summary of Type and Completeness of Daily Value Data Collected at each Site.
Elev (m)Map IDSite NameVegetation aOpen Air Temp
DV b %
Missing c,d
Air Temp
DV b %
Missing c,d
Soil Temp
DV b %
Missing c,d
Precip DV b
from Obs with
Interval ≥ 3 wks d
Soil Moist
DV b %
Missing c,d
06Palmas del Marfreshw riparian20242110-
27Sabana Secamangrove19334117-
freshw riparian3444-
25Humacaofreshw riparian12545911-
421Ceiba Wetmangrove-2028--
42Las Cabezas Wetmangrove14212518-
113Ceiba Dry Northsemi-evg dry1611171526
124Ceiba Dry Southsemi-evg dry14192114-
138Fordsemi-evg moist15212313-
3410Jardin Botánicosemi-evg moist12231911-
351Las Cabezas Drysemi-evg dry12312119-
959Saint Justsemi-evg moist18212420-
26511Sabana 4/Bisleytabonuco evg12202420-
40112El Verdetabonuco evg1217271228
52013Rio Grandetabonuco evg13182610-
64414UPR Nidopalm brake13181732-
76516Pico del Este Lowercolorado evg15191816-
78417El Torocolorado evg1318231127
8011616-
84322Pico del Este Midpalm brake-1724--
91215Mount Brittonpalm brake20232315-
99119Pico del Oestecloud elfin14161423-
99618Pico del Este Uppercloud elfin14181815-
104520El Yunquecloud elfin1523191837
a Vegetation abbreviation of freshw is freshwater, evg is evergreen. b DV = Daily Values, derived mean-daily in case of precipitation, derived daily in case of temperature. c A daily value is considered missing if a quarter or more of the 30 min observations is missing sequentially in that day in the period August 2006–September 2021. d A dash (-) signifies no data were collected, and the site was not used in the analysis.
Precipitation data were collected in the open (not under canopy cover) at each site with a rain gage. The gages were observed every 2–3 weeks. The mean-daily precipitation was determined between observations, resulting in two to three mean-daily estimates per month. See study [43] for more information about the gage design. If a gage had an operational failure, the mean-daily values were considered missing. Rainfall events in northeastern Puerto Rico are generally small in magnitude but numerous (median daily rainfall of 3 mm and 267 rain days per year; [44]). Thus, assuming every day contributes to the total rain observed during an observation interval is not an extreme assumption. Data derived from observation intervals of over 3 weeks were not considered accurate; the percentage of these data are listed in Table 1.
Soil moisture under the canopy was collected at a subset of four sites spread along the elevational gradient. Water content reflectometers (Campbell Scientific CS616) measured volumetric water content (VWC) data to 30 cm depth, recording every hour. Daily mean VWC values were derived from these data, with a daily value considered missing if more than a quarter of the data were missing in that day (Table 1). Ideally, this data would have been collected at more sites and be the same form as the open canopy data (all precipitation or all soil moisture). This study uses the limited soil moisture data despite these shortcomings as it is the only data available under the canopy, and it is spread evenly in the elevational gradient.
Data in this study were not bias corrected, instead, questionable data were omitted. In the previous study, the open air temperature sensors overheated and saturated above 38 °C; temperatures greater than this were censored to 38 °C [34]. Data had to be corrected to National Weather Service (NWS) Cooperative Observer Program (COOP) stations and statistics on the censored data were complex with the censored values. However, this issue was fixed December 2006, so the current study excludes the daily maximum before then which allowed the statistics to be straightforward.

2.2.2. Statistical Analysis

Daily data were separated into seasonal, or periodic, components of a cycle before trend analysis, to avoid data reduction methods such as trend analysis on cyclic averages of data (e.g., yearly averages of data). In the previous study [34], the cycle and the frequency of the periodic component was determined with power spectral densities [45,46,47,48,49]. Daily temperature data were shown to have a periodic component of 1 month in a yearly cycle. This is the same as saying the January microclimate one year is comparable to the January microclimate another year, but not to February microclimate another year. This 1 month periodic component was used with trend analysis of the 3 statistics of daily maximum, median, and minimum temperatures. Daily precipitation data were shown to have a periodic component of 1 month in a yearly cycle, but also a periodic component of 4 months in a yearly cycle. These 4 month periods were taken to be the approximate dry season of December–March, early rain season of April–July, and late rain season of August–November. In each 4 month season or periodic component of each yearly cycle, the minimum rainfall month and maximum rainfall month was used for trend analysis of the wettest and driest months. Individual days of months were not analyzed, instead, the wettest (or driest) month in each period of 4 months was included in the analysis, for 3 periods of data a year in the trend analysis. For more explanation, see study [34]; for a visual representation of the data, see the figures in the results of this study. The 1 month periodic component was used with trend analysis of the statistic called hereafter ‘all-months’ whereas the 4 month period component was used with the trend analysis of the 2 statistics called hereafter ‘wettest months’ and ‘driest months’. Seasonal trend analysis was performed on each of the 22 sites with the 5 data variables and 3 statistics (per variable) separately with the Seasonal Mann–Kendall (SMK) test and the Sen’s Slope Estimator [50,51,52,53] of linear trend for several data periods.
After site trend analysis, linear regression was performed for relations between site trend and site elevation across northeastern Puerto Rico, using the site values of significant Sen’s Slopes, or zero site slope if no significance was found, for the 3 longer periods of 8 years (before the droughts), 11 years (before the hurricane), and 20 years (entire record, only for observations in the open). The site values of the Sen’s Slope from the shorter period of 4 years (after the hurricanes, only for observations under the canopy), significant or not, were only used to define the site hurricane disturbance peak effect and the recovery time from the hurricanes.
The drought disturbance peak effect was estimated on each of the 22 sites with beneath-canopy soil moisture and maximum temperature and precipitation in the open where data were available. The drought statistics could only be reported for maximum daily temperature on soil, not every statistic on soil temperature, because the signal in median and minimum soil temperature was not strong enough to yield any results in the analysis. For each site, variable, and statistic, the fitted line of the significant Sen’s Slope and intercept before the drought, September 2014 (or 0 slope if not significant), was extended to the month before the hurricanes. Then, the median seasonal cycle of the pre-drought data was added to it with 90% confidence interval bounds. The maximum magnitude of the difference between the data and the trending median seasonal cycle between September 2014 and August 2016 was designated the drought peak effect. Comparing the drought season to the median seasonal cycle with 90% confidence interval bounds (and possible trend) is equivalent to using a non-parametric t-test to see if the drought season is significantly different than the non-drought seasons, at the 90% confidence level.
The length of the drought effect at each site on each variable and each statistic was calculated next. First, the 90% lower confidence bounds for a cycle (a year) of the trending median seasonal cycle pre-drought were calculated as an envelope for the expected “normal seasonal cycle.” Then, looking forward from the time of drought peak effect, if the post data were inside the envelope for a cycle (a year) of the trending median seasonal cycle, the closest periodic component to the time of that cycle was considered an end point of the drought. The same procedure was followed for the start of the drought, looking backwards in time from the peak of the drought. For the soil temperature, the envelope used the 90% upper confidence bounds as the drought increased temperature. The Standardized Precipitation–Evapotranspiration Index (SPEI [54]) was also calculated on every month of the open-canopy data at each site for comparison to commonly presented drought indices. The SPEI has been used in the entirety of Puerto Rico in previous research, calculating evapotranspiration from extraterrestrial radiation and mean, maximum, and minimum temperatures [55]. The index is computed by subtracting evapotranspiration from precipitation, with values < 0 considered drought and <−2 severe drought [55].
The hurricane disturbance peak effect was estimated similarly on each of the 22 sites with beneath-canopy data; no open canopy data were used. For each set of data, the fitted line of the significant Sen’s Slope and intercept before the hurricanes (or 0 slope if not significant) was extended to the month after the hurricanes (November). Then, the fitted line of the Sen’s Slope and intercept after the hurricanes, significant or not, was used to calculate a November value after the hurricanes. The peak effect was estimated as the November linear-fit value after the hurricanes minus the November linear-fit value before the hurricanes.
The recovery time to pre-hurricane conditions after the disturbance at each site on each variable and each statistic was calculated next, like the drought length calculations. For all variables, the hurricane effect was an increase, so, the 90% upper confidence bounds on the trending median seasonal cycle pre-hurricane were used to create the expected “normal seasonal cycle” envelope. If the post-hurricane data were inside the envelope for a cycle (a year), the first periodic component of that cycle was considered the recovery point. If this point was not found a year before the end of the data (in 3 years), the intersection point of the trend line before the hurricanes and the trend line after the hurricanes was used as the recovery point. Values of unreasonably long (20 years or more) were excluded. This combination method was used to acknowledge that recovery is not expected to be linear, but an estimate (necessarily less accurate) longer than the current data record might be needed for some sites/variables.

3. Results

The temperature results are shown in Figure 2, Figure 3 and Figure 4 for the variables of open-canopy air temperature, under-canopy air temperature, and under-canopy soil temperature, respectively. Similarly, the precipitation and soil moisture results are visually shown in Figure 5 and Figure 6 for the variables of open-canopy precipitation and under-canopy soil moisture. The realization of the 4 month periodic component of ‘wettest months’ and ‘driest months’ can be seen in the (b) plots, where each 4 month wettest or driest month is included in those time series.
The figures serve as a visual representation of the results of this study. The (a) plots of each of these figures show the average value of each site over the period of record, and the linear regression result. The distribution of the site elevations can be seen in these plots. The (b) plots of each of these figures show the average value of the monthly data and the results of the various calculations over the period of record for all the sites. The region-wide time trend regression lines (with specific equation values is given in Table 2 and Table 3) are plotted until 2023, using the average site elevation as listed in the plot title. The hurricane and drought peak effect results are not specifically labeled in the figures but can be seen in the low precipitation and soil moisture values in 2015 and the data jump in September 2017, respectively. The effect length results of each event are plotted in Figure 3, Figure 4, Figure 5 and Figure 6; no event effects were calculated for air temperatures in the open as the signal in the air temperatures was not strong enough to yield any results in the analysis.
Note, since in the (b) plots of the figures (Figure 2, Figure 3, Figure 4, Figure 5 and Figure 6) the sites’ monthly values are averaged for each month of the time series, and some months may have fewer sites with data, the visual representations of the time series have noise (e.g., winter 2021 in Figure 2). The region-wide trend lines are not calculated using average monthly data, but instead by using the sites’ trends and then plotted at the average site elevation (Figure 2, Figure 3, Figure 4, Figure 5 and Figure 6; Table 2 and Table 3). The Sen’s Slope calculation at each site considers missing data in a statistical manner.

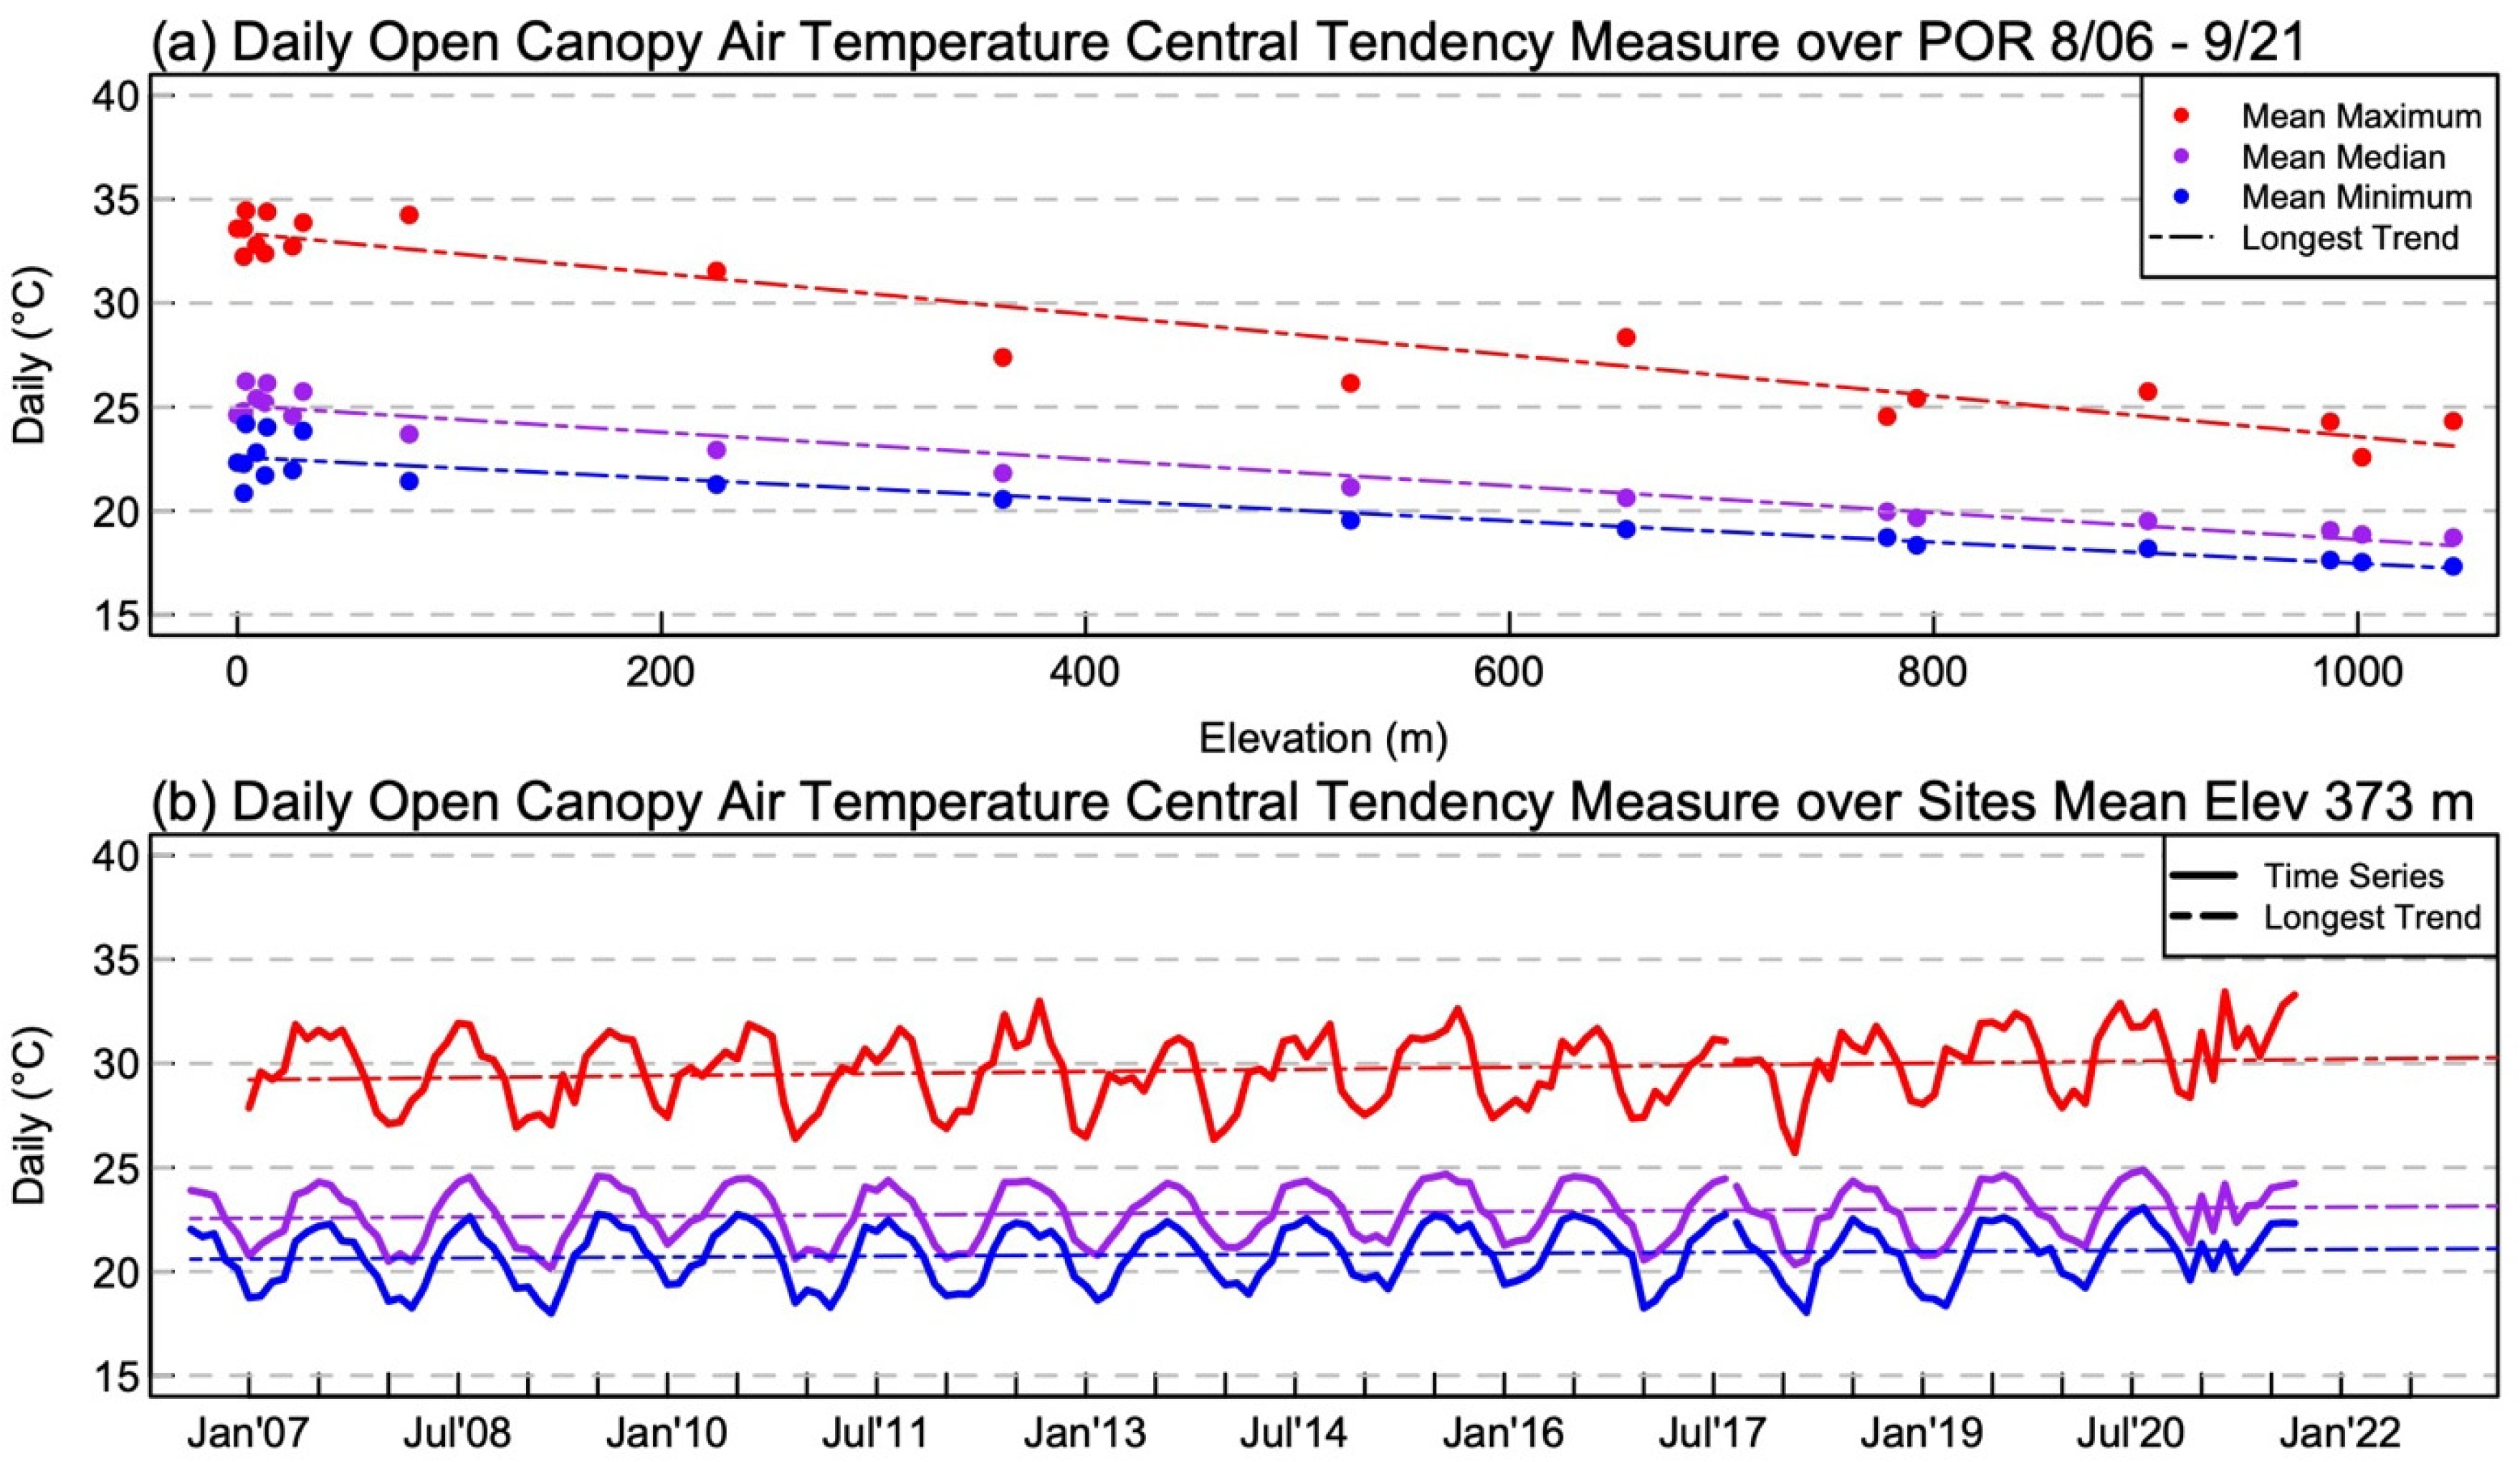
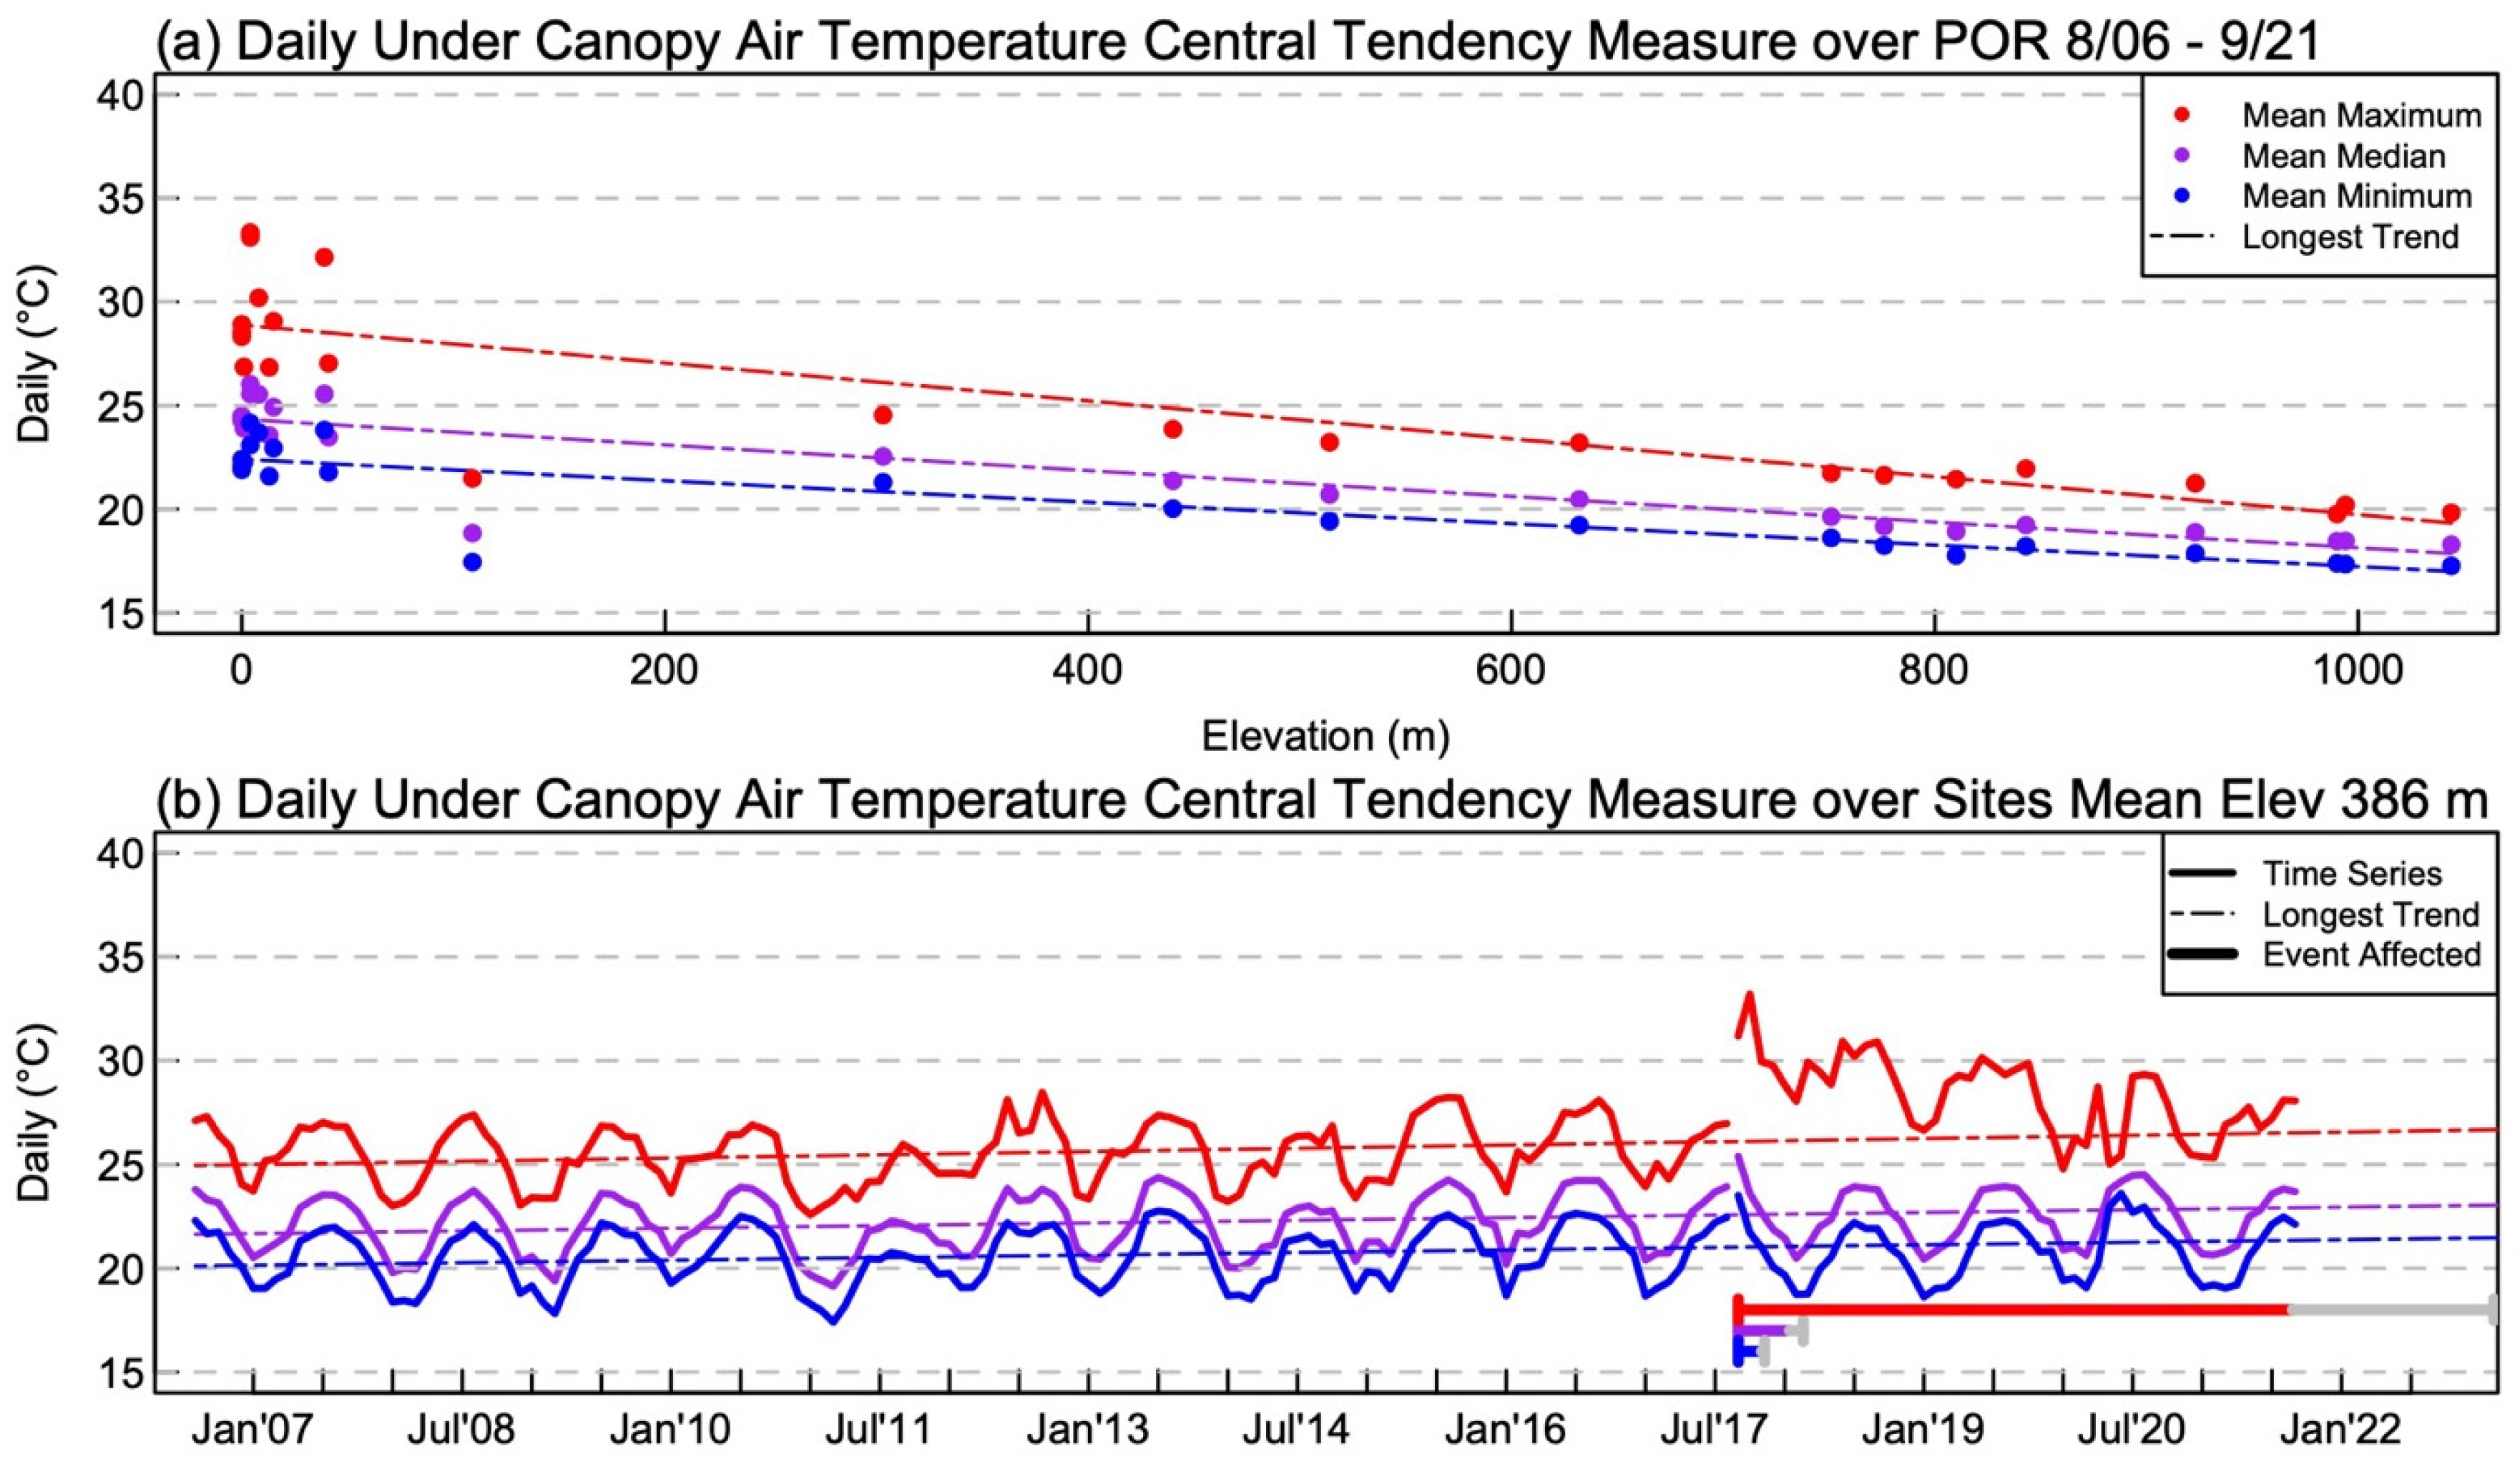
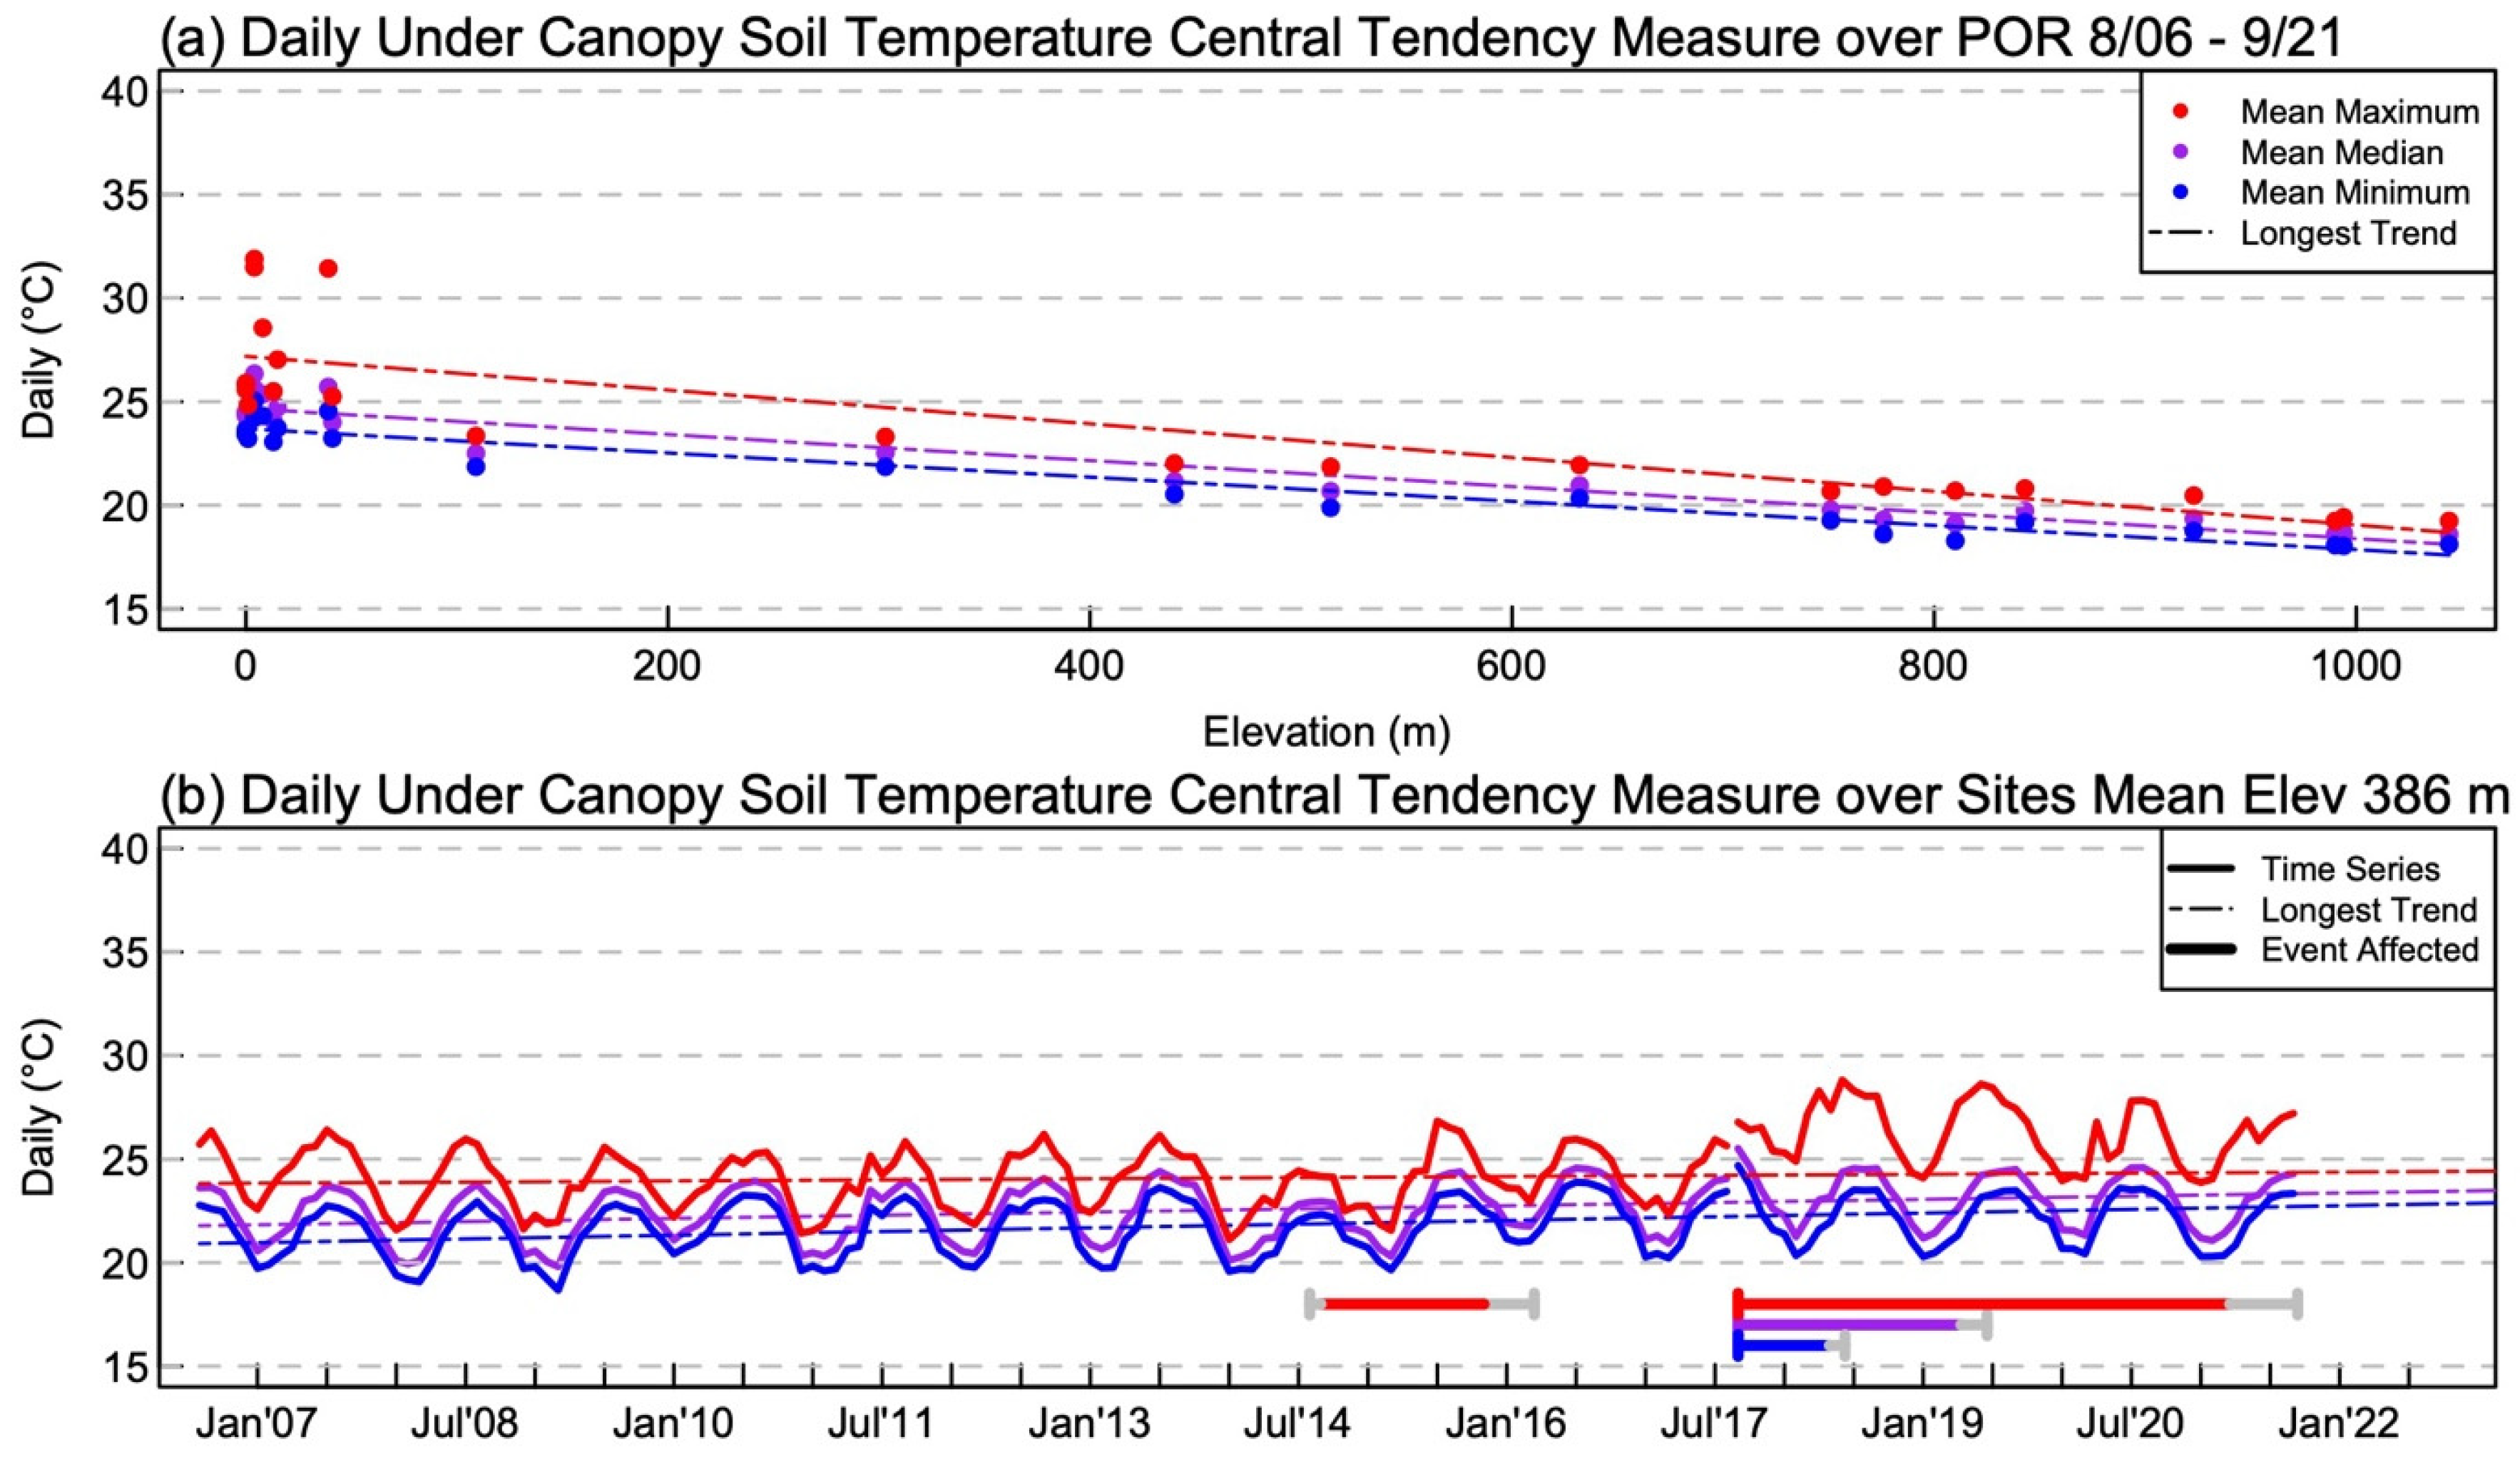
3.1. Temperature Results

The specific equations for all region-wide temperature regressions with elevation are given in Table 2. Among the statistics (daily maximum, median, and minimum), the maximum temperature showed the most difference in the magnitude between the variables (open-canopy air, under-canopy air, and under-canopy soil; Table 2, row 1). Using the data from before the hurricane, median and minimum air temperatures were increasing 1.5 as fast per year under the canopy versus in the open, and median and minimum temperatures in the soil under the canopy were increasing 2.2 times as fast as air temperature in the open (+0.08 °C/yr versus +0.05 °C/yr and +0.11 °C/yr versus +0.05 °C/yr, respectively; Table 2, row 3 open columns versus canopy columns). These changes were uniform across the elevational gradient except for maximum temperature. Maximum temperatures were increasing similarly at high elevations in the open air and under the canopy (soil and air), but at low elevation, the maximum temperature was only increasing in the air under the canopy.
The peak effect of the hurricanes on under-canopy air temperature was the same as under-canopy soil temperature at the top of the mountains, but air maximum and minimum temperatures were twice as high at sea level while soil temperatures stayed constant (+3, +0.7, +0.4 °C for maximum, median, minimum at 1000 m; Table 2, row 7). The percentage increase in maximum air temperature with the hurricanes went down with elevation, but since temperature decreases with elevation, the percentage increase in maximum soil temperature went up (21% at 0 m to 16% at 1000 m, and 11% at 0 m to 15% at 1000 m, respectively; Table 2, row 7 divided by row 1).
Comparing Figure 3b and Figure 4b after the 2017 hurricanes, the average peak effect on maximum air temperature was larger and lasted longer than with soil temperature, but the median and minimum soil temperatures were raised for a longer time in soil temperatures than the air temperatures. Post-hurricane return to baseline was longest for daily maximum temperatures followed by median and then minimum temperatures (>3 years and <1 year, respectively; Table 2, row 8). Soil recovery took longer at higher elevation. Hurricane recovery lengths for the three soil temperature statistics (daily maximum, median, and minimum) were more homogeneous than the lengths of the three air temperature statistics.
Figure 2. Average of the statistical calculations on the open-canopy air temperature for daily maximum, median, and minimum. Plot (a) shows the site period of record average values as points with the trend lines of magnitude with elevation. Plot (b) shows the periodic component timeseries (each 1 month) averaged over the sites as thick lines, with thin dashed trend lines of magnitude with time at the average site elevation (373 m). The colors signify the same variable across the plots. Only the longest trend calculated is shown, from the entire record.
Forests 14 00325 g002
Figure 3. Average of the statistical calculations on the under-canopy air temperature for daily maximum, median, and minimum. Plot (a) shows the site period of record average values as points with the trend lines of magnitude with elevation. Plot (b) shows the periodic component timeseries (each 1 month) averaged over the sites as thick lines, with thin dashed trend lines of magnitude with time at the average site elevation (386 m). The colors signify the same variable across the plots. Only the longest trend calculated is shown, from the pre-hurricane data. The estimated event-affected (hurricane) periods are shown in thick bars on the bottom of plot with the gray part of the bars as the 90% confidence intervals around the end points.
Forests 14 00325 g003
Figure 4. Average of the statistical calculations on the under-canopy soil temperature for daily maximum, median, and minimum. Plot (a) shows the site period of record average values as points with the trend lines of magnitude with elevation. Plot (b) shows the periodic component timeseries (each 1 month or 4 months) averaged over the sites as thick lines, with thin dashed trend lines of magnitude with time at the average site elevation (386 m). The colors signify the same variable across the plots. Only the longest trend calculated is shown, from the pre-hurricane data. The estimated event-affected (drought then hurricane) periods are shown in thick bars on the bottom of plot with the gray part of the bars as the 90% confidence intervals around the end points.
Forests 14 00325 g004
Table 2. Region-Wide Linear Least Squares Relationships of Temperature with Elevation (x, in km).
Type of Statistic aOpen Air Temp Daily MaxCanopy Air Temp Daily MaxCanopy Soil Temp Daily MaxOpen Air Temp Daily MedianCanopy Air Temp Daily MedianCanopy Soil Temp Daily MedianOpen Air Temp Daily MinCanopy Air Temp Daily Min Canopy Soil Temp Daily Min
Annual averages (°C)−9.83x + 33.39−9.15x + 28.88−8.15x + 27.19−6.45x + 25.07−6.21x + 24.33−6.29x + 24.68−5.12x + 22.59−5.18x + 22.41−5.84x + 23.69
Trend b before drought (°C/yr)−0.120.05−0.020.030.060.070.030.070.09
Trend b before hurricanes (°C/yr)−0.010.100.10x + 0.000.050.080.100.050.080.12
Trend b whole record (°C/yr)0.13x + 0.02 0.03 0.03
Drought peak effect (°C) −2.31x + 4.40
Drought effect length (yr) 1.64
Hurricane peak effect (°C) −2.97x + 6.082.91 0.770.69 −0.56x + 0.840.43
Hurricane effect length (yr) 4.733.90x + 3.20 0.421.70 0.180.71
a Linear least-squares regression between this statistic at each site and elevation. If the regression line has only a significant intercept, then the mean is reported, else the regression line equation is reported with variable x as the elevation of the site is in km (0–1.045). b Trend is from Sen’s Slopes.

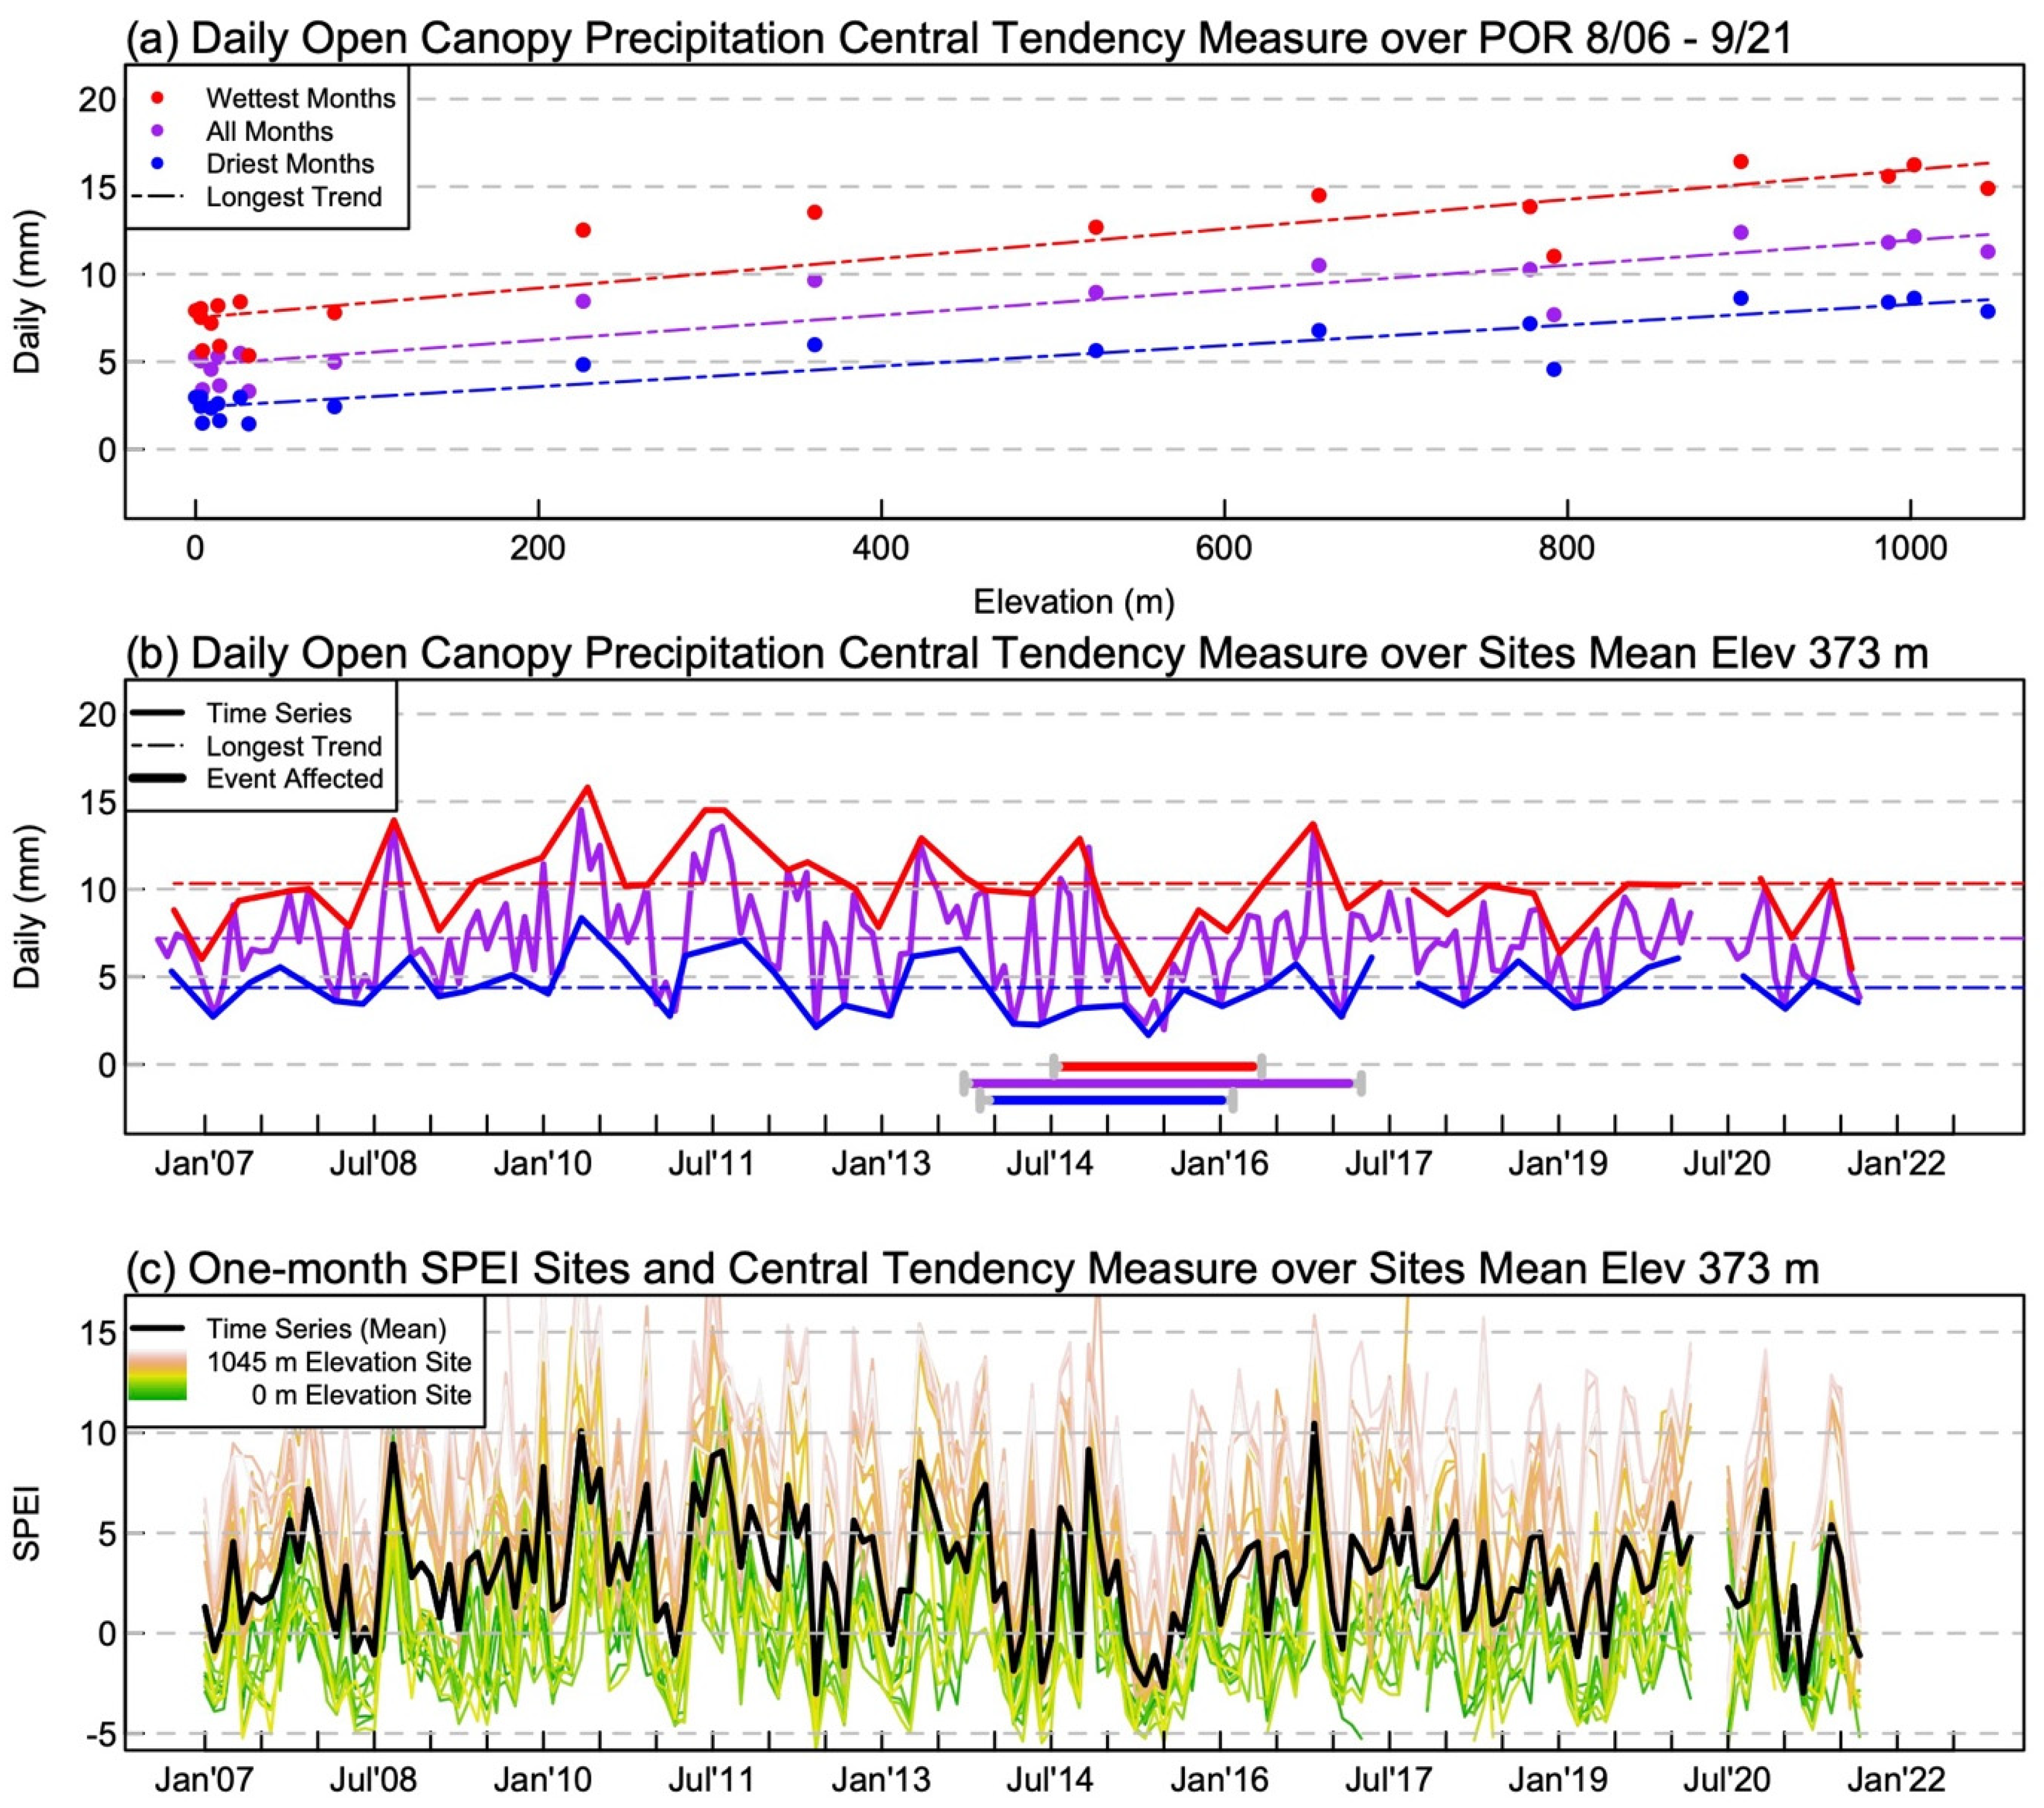
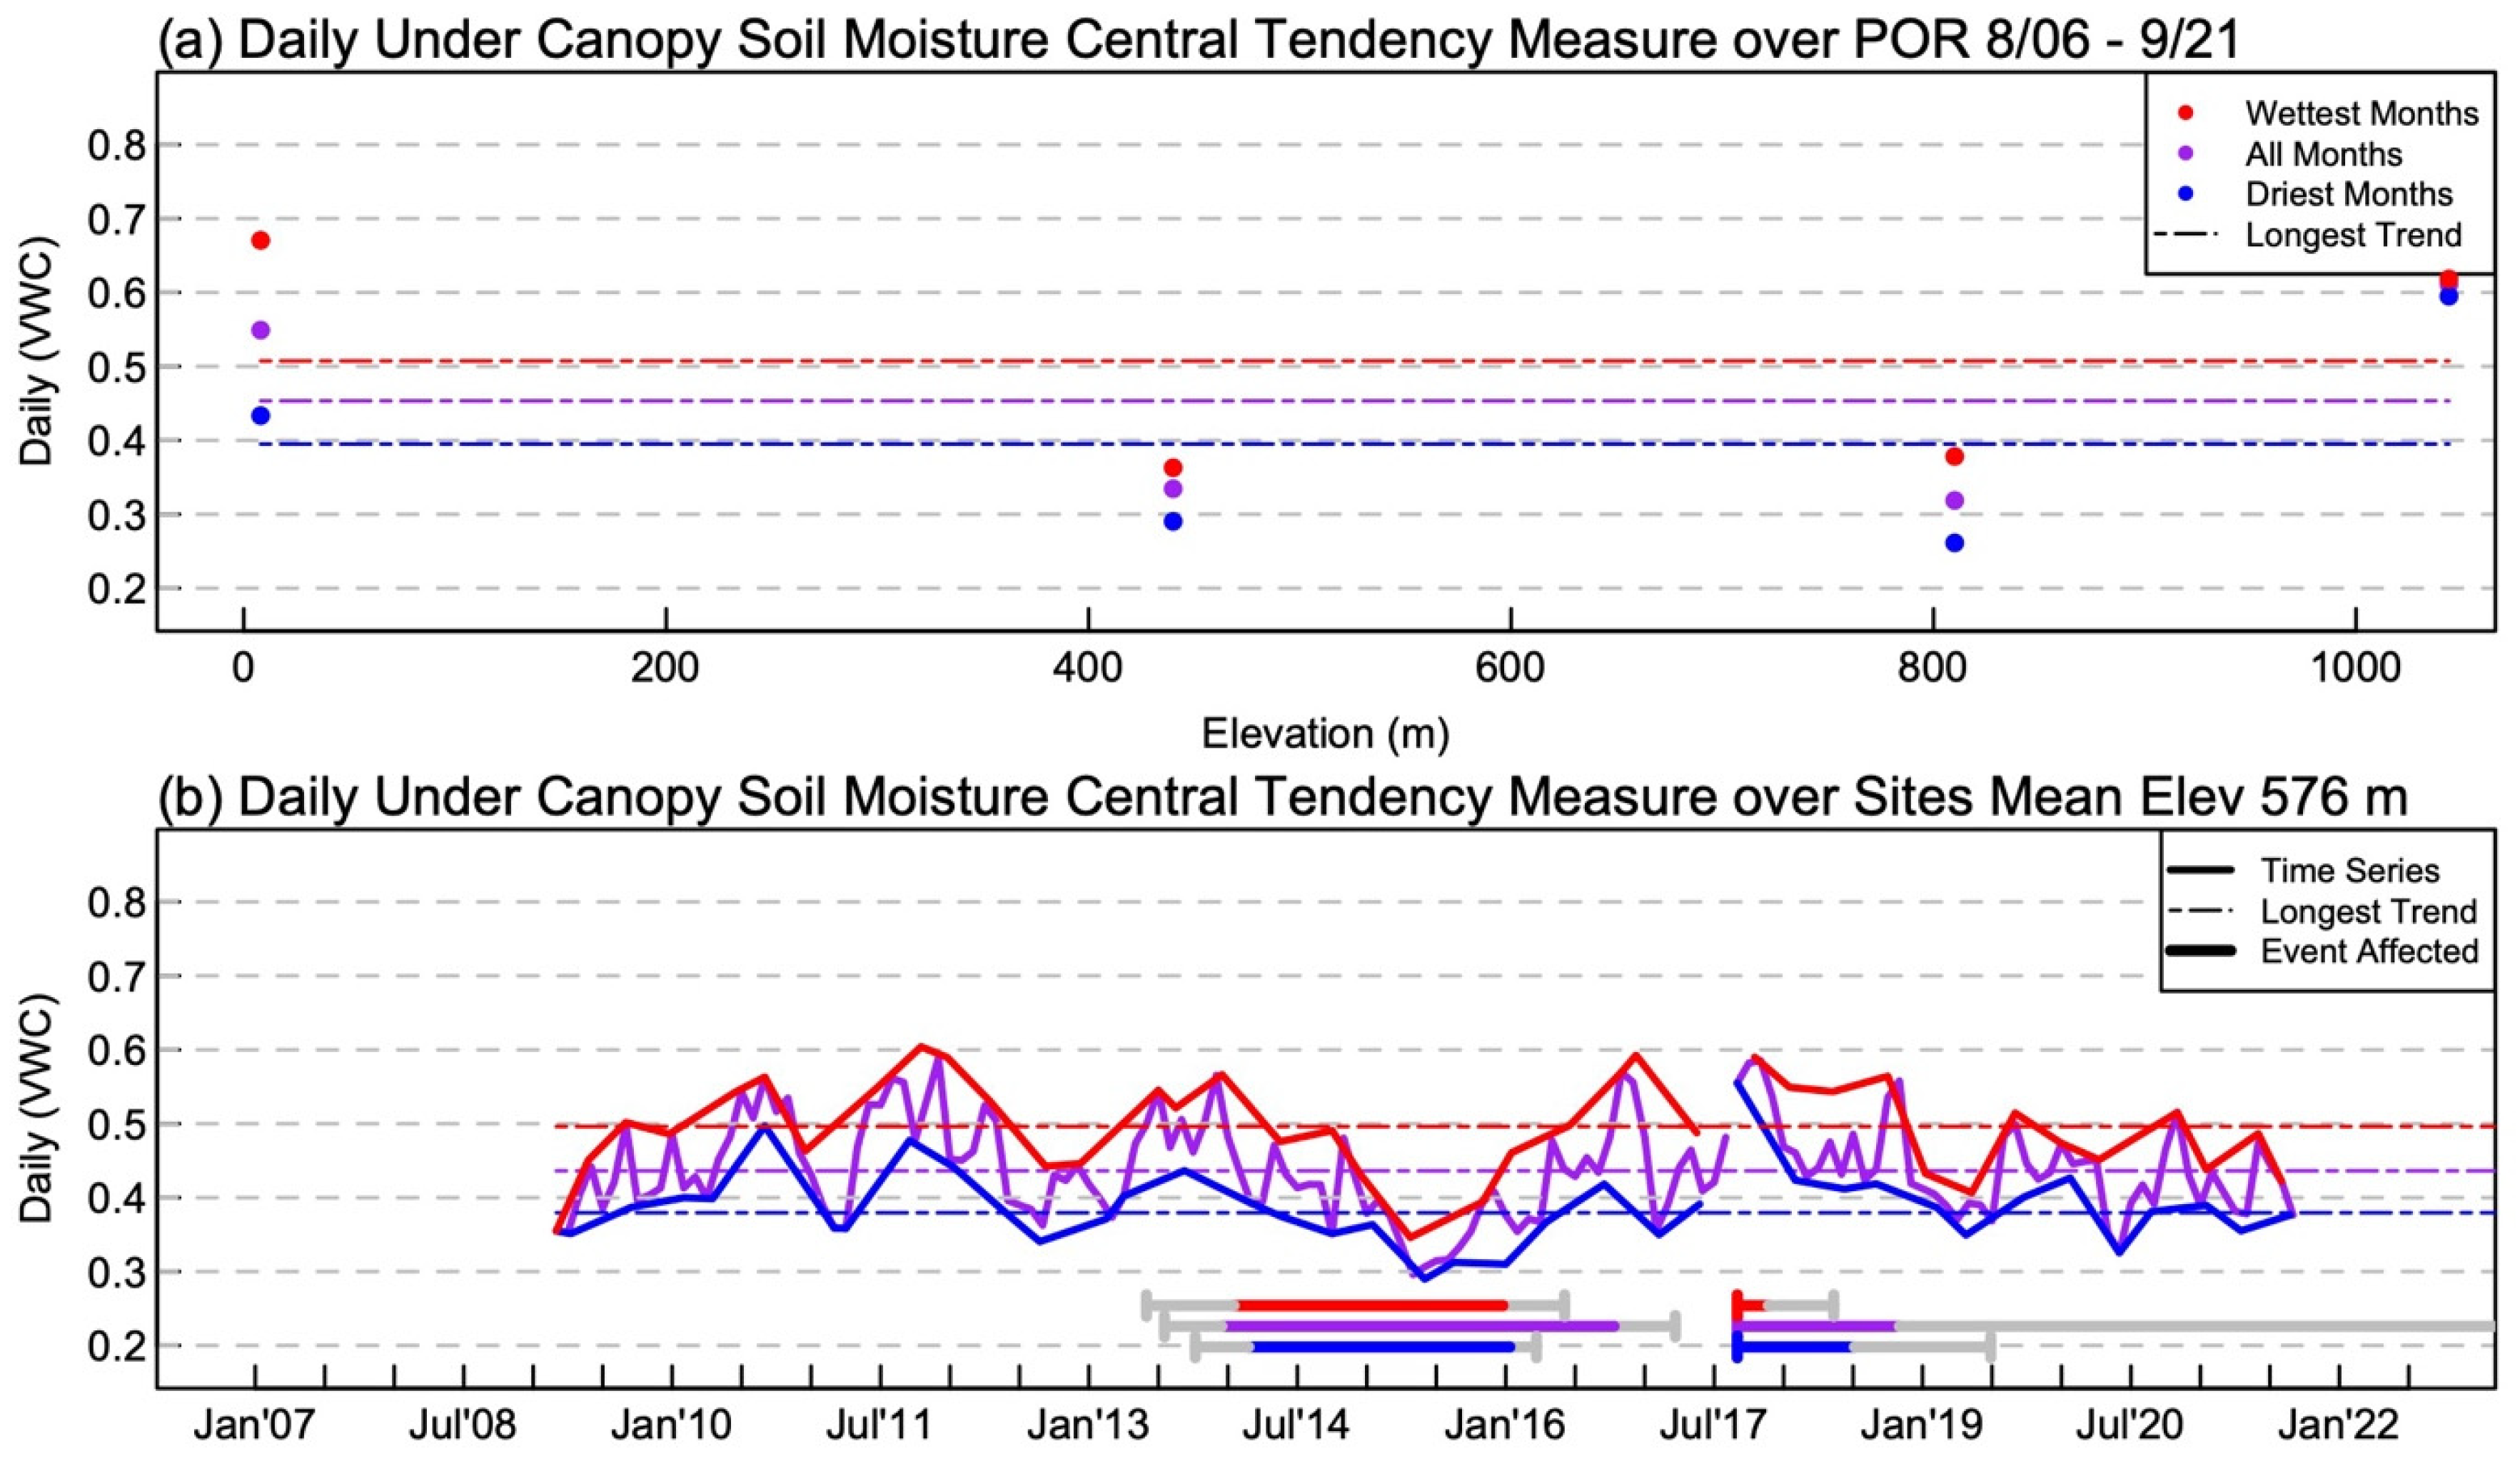
3.2. Precipitation and Soil Moisture Results

Table 3 gives the specific equations for all region-wide precipitation and soil moisture regressions with elevation. Direct comparison is difficult with open-canopy and under-canopy data, as the first were measured as precipitation and the second were measured as VWC. There were little to no time trends in the longest records (Table 3, row 3, 4). A break in data collection can be seen in the precipitation data in Figure 5 during 2020; this was due to global pandemic data collection complications and not an ecosystem event.
The drought effect on the precipitation in the open was calculated, but hurricane effects could not be calculated since the sites are not under canopy and hurricanes do not change rainfall amounts on the monthly timescale. The magnitude of the peak drought effect was a 1.75 to 3.5 times larger absolute precipitation decrease at 1000 m versus sea level, but because of the increasing precipitation with elevation, the percentage lost was about −70% of the total uniformly across the gradient (regardless of month column; Table 3, row 7 divided by row 1). The length of the drought effect on the precipitation in the open was similar to the length of the drought effect on the soil moisture, given the small number of collection sites for soil moisture (around 2 years; Table 3, row 5). The wettest months were affected by the drought about 6 months later than the driest months. The timing of the drought effect on the soil temperature (Figure 4b) lines up with the effect on the precipitation wettest months.
The SPEI at over the region shows that the region was only considered to be in a drought March 2015 until September 2015 (black line SPEI < 0; Figure 5c), mirroring the shape of the time series of daily precipitation in Figure 5b. Lower than average elevation sites showed a longer official drought (green lines; Figure 5c). Although the SPEI calculation considers temperature data, an analysis of the drought effect using the SPEI using the 90% confidence envelope on the trending median seasonal cycle does not lead to different results on site drought peak effect or length, because the shape of the SPEI and the precipitation curves are very similar. However, the SPEI calculation can be used to show that many of the sites would not have been considered to be in a drought (SPEI > 0), even though the drought is still affecting the precipitation statistics.
Bearing in mind the calculation reliability with only 4 sites for under-canopy soil moisture (but spread across the gradient), the drought peak effect was, of similar magnitude and in opposite direction to the hurricane peak effect on all months and driest months at low elevation with effects lasting more than twice as long as the hurricane effects (a drought decrease of ~0.2 VWC or half of the average VWC; Table 3, comparing rows 5, 7 to row 1). The drought effect length over the region estimate is around 2 years and the hurricane effect around 1 year with large 90% confidence bounds (horizontal bars; Figure 6b). For the driest months, it is possible that the drought effect on the soil moisture lasted longer at higher elevation; the elevational slope was significant (Table 3, row 6). For wettest months, the magnitude of the drought peak effect percentage of the average soil VWC was estimated to be larger than the hurricane peak effect but both effects decrease to zero with elevation (at sea level −70% versus +30%; Table 3, rows 5 and 7 divided by row 1). The drought calculations showed no effect above 700 m.
Figure 5. Average of the statistical calculations on the open-canopy precipitation for wettest months, all months, and driest months. Plot (a) shows the site period of record average values as points with the trend lines of magnitude with elevation. Plot (b) shows the periodic component timeseries (“all months” have period 1 month and “wettest” and “driest” have period 4 months) averaged over the sites as thick lines, with thin dashed trend lines of magnitude with time at the average site elevation (373 m). The colors signify the same variable across the plots (a,b). Only the longest trend calculated is shown, from the entire record. The estimated event-affected (drought) periods are shown in thick bars on the bottom of plot with the gray part of the bars as the 90% confidence intervals around the end points. Plot (c) shows the 1 month Standardized Precipitation–Evapotranspiration Index (SPEI) calculated at each site (colored lines) and the average of these sites (black line).
Forests 14 00325 g005
Figure 6. Average of the statistical calculations on the under-canopy soil moisture for wettest months, all months, and driest months. Plot (a) shows the site period of record average values as points with the trend lines of magnitude with elevation. Plot (b) shows the periodic component timeseries (“all months” have period 1-month and “wettest” and “driest” have period 4-months) averaged over the sites as thick lines, with thin dashed trend lines of magnitude with time at the average site elevation (576 m). The colors signify the same variable across the plots. Only the longest trend calculated is shown, from the pre-hurricane data. The estimated event-affected (drought then hurricane) periods are shown in thick bars on the bottom of plot with the gray part of the bars as the 90% confidence intervals around the end points.
Forests 14 00325 g006
Table 3. Region-Wide Linear Least Squares Relationships of Precipitation and Soil Moisture with Elevation (x, in km).
Type of Statistic aOpen Precip Wettest MonthsCanopy Soil Moist Wettest MonthsOpen Precip All MonthsCanopy Soil Moist All MonthsOpen Precip Driest MonthsCanopy Soil Moist Driest Months
Annual averages (water b)8.62x + 7.410.507.27x + 4.860.456.16x + 2.580.40
Trend c before drought (water b/yr)0.000.010.060.000.000.01
Trend c before hurricanes (water b/yr)−0.010.00−0.010.00−0.010.00
Trend c whole record (water b/yr)−0.04 0.00 0.00
Drought peak effect (water b)−4.53x − 6.140.24x − 0.35−5.82x − 5.84−0.22−4.53x − 1.82−0.16
Drought effect length (yr)1.782.473.453.252.150.56x + 1.84
Hurricane peak effect (water b) −0.14x + 0.15 −0.18x + 0.21 0.16
Hurricane effect length (yr) 0.33 3.89 1.33
a Linear least-squares regression between this statistic at each site and elevation. If the regression line has only a significant intercept, then the mean is reported, else the regression line equation is reported with variable x as the elevation of the site in km (0–1.045). b Units of ‘water’ are defined as mm/day for columns 1, 3, 5 and VWC/day for columns 2, 4, 6. c Trend is from Sen’s Slopes.

4. Discussion

Differences between the current results and the previous study on the same elevational gradient (as well as the difference when looking across the trends on shorter periods; Table 1, 2, rows 2–4) highlight the difficulties of looking for trends in 10–20 years of data in a climate with many interannual drivers. Notable differences were that the previous study [34] found a large negative trend in open-canopy daily maximum air temperature (−0.2 to −0.3 °C/yr) from 2001–2013 uniformly across the gradient, in comparison to this study which found the opposite with smaller positive trends in the open-canopy daily maximum air temperature (+0.13 °C/yr/km, Table 2). The previous study [34] also found positive trends in the open-canopy precipitation in all months and dry months with an elevational difference, calculating with trends of ~0.1 mm/yr at sea-level and 0.3 mm/yr at the tops of the mountains (1000 m altitude) in the driest months and similar trends but a more muted elevational difference in all months. Looking at Figure 5b, while the drought of 2015 is in obvious disagreement to superimposing an increasing trend on these data, it also appears that any rise in precipitation stops in year 2012.
In the current study, hurricane and drought climatic changes had many more elevational differences than 15–20 year climatic changes especially in event peak effect magnitude, suggesting that any increase in large drought and hurricane events would greatly alter the ecosystem distribution along the elevational gradient. In general, temperature changes were larger at higher elevation and precipitation and soil moisture changes were larger at lower elevation (in both cases, if there was an elevational pattern). Among the variables measured, the most substantial elevational differences were seen in maximum temperatures in the soil where at higher elevations soil temperatures were: (1) trending upwards faster; (2) hurricane-induced increases lasted longer, and (3) hurricane-induced increases were a higher percentage of the average maximum soil temperature. These results mean these climatic changes are causing high elevation temperatures to move closer to low elevation temperature, warming and narrowing the range of the microclimatic distribution. In contrast, the entire elevational gradient lost 70% of the precipitation in the severe drought in all months, and the soil moisture measurements reflected this uniformly across the gradient, except in the wettest months. At the high elevation in the wettest months the effect was almost zero. There was also almost no effect at high elevation on soil moisture after the hurricanes in the wettest months. Thus, during the wetter months, the high elevation forest structure may be able to buffer the microclimate from climatic moisture disturbances better than the lower elevation forest structure. However, more sites should be analyzed to add validity to this result.
The climate warming from 2006–2017 (11 years) increased the median air and soil temperatures under the canopy more than the peak effect of the 2017 hurricanes; however, potentially there will be no recovery from this kind of change. In this study, high elevation hurricane temperature effects lasted longer than at low elevation; high elevation forests are hypothesized to have canopies stunted by wind disturbance and vulnerable to storm-induced nutrient loss [11]. This is in agreement with satellite “greenness” measurements showing slow recovering high elevation forests [25]. Longer-lasting hurricane effects on top of a more gradual temperature increase have been evidenced to create reduction in ecosystem fertility and lowered long-term resilience [56]. Warming soils at high elevation may release sequestered carbon [21]. Furthermore, high elevation forests depend on moisture from low clouds that may be rising with increasing temperature [35].
Yet, arguments could be made that the results of this study imply ecosystems at mid or low elevations have had to respond and adapt to more climatic changes than high elevation ecosystems in northeastern Puerto Rico. With the elevational slope of the magnitudes of many of the microclimatic changes opposing each other, mid-range elevations have seen the most changes. Additionally, the effects of drought (found here to be increasing as the elevation decreases with similar time length at all elevations) may affect critical functionality of ecosystems more than hurricanes [10,57]. There is evidence to suggest that certain plant species have pre-existed drought tolerance and that community composition changes in response to previous disturbance events [9,58]. In other tropical elevational gradients around the world, higher elevations that get warmer and drier are being repopulated with plants from lower elevations [59]. However, the lowest elevations may be moving into a new regime not previously experienced in the forest. Observational data suggest that trees within the Luquillo mountains are already operating above their optimum temperature for photosynthesis [60].

5. Conclusions

Differing microclimatic change patterns with elevation indicate that ecosystem stresses vary across tropical elevational gradients. Although there are ecosystems with signs of the effects of long-term climatic changes in Puerto Rico, these are still small (average increase <0.1 °C/yr and decrease <0.01 mm/yr). Hurricane and drought climatic changes and recovery from these events continue to drive the ecosystems to change in a step-like manner. Ongoing monitoring of temperature and moisture changes is needed to provide basis for forest biotic observations. It cannot be over-emphasized that continuing abiotic data collection along an elevational gradient will be necessary to build a temporally detailed record that can interpret microclimate ecosystem responses to climatic changes in temperature and moisture. This response measures the ability and the manner in which the tropical forest buffers its ecosystems from the long-term and short-term climatic changes. This abiotic data will place in context biotic changes reflecting the health of tropical forests.

Author Contributions

Conceptualization, A.E.V.B. and G.G.; methodology, A.E.V.B., G.G. and M.M.R.; software, A.E.V.B.; data curation, G.G. and M.M.R.; writing—original draft preparation, A.E.V.B.; writing—review and editing, A.E.V.B. and G.G.; supervision, G.G.; funding acquisition, G.G.; project administration, G.G. All authors have read and agreed to the published version of the manuscript.

Funding

This research was funded by the Luquillo Critical Zone Observatory (National Science Foundation grant EAR-1331841) and the Luquillo Long-Term Ecological Research Site (National Science Foundation grant DEB-1239764).

Data Availability Statement

All data collected by the authors are hosted on the USDA Forest Service Research Data Archive at https://www.fs.usda.gov/rds/archive/Catalog, accessed on 1 January 2023, and given in the citations [61].

Acknowledgments

The authors thank Carlos Estrada, Samuel Moya, Humberto Robles, and Carlos Torrens for assisting with field data, and Ariel E. Lugo for comments on an earlier version of the manuscript. All research at the USDA Forest Service International Institute of Tropical Forestry is performed in collaboration with the University of Puerto Rico. Any use of trade, product, or firms’ names is for descriptive purposes only and does not imply endorsement by the U.S. Government.

Conflicts of Interest

The authors declare no conflict of interest.

References

  1. Shiels, A.B.; González, G.; Lodge, D.J.; Willig, M.R.; Zimmerman, J.K. Cascading Effects of Canopy Opening and Debris Deposition from a Large-Scale Hurricane Experiment in a Tropical Rain Forest. Bioscience 2015, 65, 871–881. [Google Scholar] [CrossRef]
  2. Van Beusekom, A.E.; González, G.; Stankavich, S.; Zimmerman, J.K.; Ramírez, A. Understanding Tropical Forest Abiotic Response to Hurricanes Using Experimental Manipulations, Field Observations, and Satellite Data. Biogeosciences 2020, 17, 3149–3163. [Google Scholar] [CrossRef]
  3. Burslem, D.F.R.P.; Whitmore, T.C.; Brown, G.C. Short-Term Effects of Cyclone Impact and Long-Term Recovery of Tropical Rain Forest on Kolombangara, Solomon Islands. J. Ecol. 2000, 88, 1063–1078. [Google Scholar] [CrossRef]
  4. O’Connell, C.S.; Ruan, L.; Silver, W.L. Drought Drives Rapid Shifts in Tropical Rainforest Soil Biogeochemistry and Greenhouse Gas Emissions. Nat. Commun. 2018, 9, 1348. [Google Scholar] [CrossRef]
  5. Cupples, A.M. Principles and Applications of Soil Microbiology. J. Environ. Qual. 2005, 34, 731. [Google Scholar] [CrossRef]
  6. Enquist, C.A.F. Predicted Regional Impacts of Climate Change on the Geographical Distribution and Diversity of Tropical Forests in Costa Rica. J. Biogeogr. 2002, 29, 519–534. [Google Scholar] [CrossRef]
  7. Hilbert, D.W.; Ostendorf, B.; Hopkins, M.S. Sensitivity of Tropical Forests to Climate Change in the Humid Tropics of North Queensland. Austral Ecol. 2001, 26, 590–603. [Google Scholar] [CrossRef]
  8. Wang, H.; Hall, C.A.S.; Scatena, F.N.; Fetcher, N.; Wu, W. Modeling the Spatial and Temporal Variability in Climate and Primary Productivity across the Luquillo Mountains, Puerto Rico. For. Ecol. Manag. 2003, 179, 69–94. [Google Scholar] [CrossRef]
  9. Zimmerman, J.K.; Wood, T.E.; González, G.; Ramirez, A.; Silver, W.L.; Uriarte, M.; Willig, M.R.; Waide, R.B.; Lugo, A.E. Disturbance and Resilience in the Luquillo Experimental Forest. Biol. Conserv. 2021, 253, 108891. [Google Scholar] [CrossRef]
  10. Ali, A.; Lin, S.-L.; He, J.-K.; Kong, F.-M.; Yu, J.-H.; Jiang, H.-S. Climatic Water Availability Is the Main Limiting Factor of Biotic Attributes across Large-Scale Elevational Gradients in Tropical Forests. Sci. Total Environ. 2019, 647, 1211–1221. [Google Scholar] [CrossRef]
  11. Lugo, A.E. Visible and Invisible Effects of Hurricanes on Forest Ecosystems: An International Review. Austral Ecol. 2008, 33, 368–398. [Google Scholar] [CrossRef]
  12. Wunderle, J.M., Jr.; Lodge, D.J.; Waide, R.B. Short-Term Effects of Hurricane Gilbert on Terrestrial Bird Populations on Jamaica. Auk 1992, 109, 148–166. [Google Scholar] [CrossRef]
  13. Beard, K.H.; Vogt, K.A.; Vogt, D.J.; Scatena, F.N.; Covich, A.P.; Sigurdardottir, R.; Siccama, T.G.; Crowl, T.A. Structural and Functional Responses of a Subtropical Forest to 10 Years of Hurricanes and Droughts. Ecol. Monogr. 2005, 75, 345–361. [Google Scholar] [CrossRef]
  14. Corlett, R.T. Impacts of Warming on Tropical Lowland Rainforests. Trends Ecol. Evol. 2011, 26, 606–613. [Google Scholar] [CrossRef]
  15. Cantrell, S.A.; Lodge, D.J.; Cruz, C.A.; García, L.M.; Pérez-Jiménez, J.R.; Molina, M. Differential Abundance of Microbial Functional Groups along the Elevation Gradient from the Coast to the Luquillo Mountains. Ecol. Bull. 2013, 54, 87–100. [Google Scholar]
  16. Richardson, B.A.; Richardson, M.J. Litter-Based Invertebrate Communities in Forest Floor and Bromeliad Microcosms along an Elevational Gradient in Puerto Rico. Ecol. Bull. 2013, 54, 101–115. [Google Scholar]
  17. Willig, M.R.; Presley, S.J.; Bloch, C.P.; Alvarez, J. Population, Community, and Metacommunity Dynamics of Terrestrial Gastropods in the Luquillo Mountains: A Gradient Perspective. Ecol. Bull. 2013, 54, 117–140. [Google Scholar]
  18. Campos-Cerqueira, M.; Aide, T.M. Impacts of a Drought and Hurricane on Tropical Bird and Frog Distributions. Ecosphere 2021, 12, e03352. [Google Scholar] [CrossRef]
  19. Ping, C.-L.; Michaelson, G.J.; Stiles, C.A.; González, G. Soil Characteristics, Carbon Stores, and Nutrient Distribution in Eight Forest Types along an Elevation Gradient, Eastern Puerto Rico. Ecol. Bull. 2013, 54, 67–86. [Google Scholar]
  20. Silver, W.L.; Liptzin, D.; Almaraz, M. Soil Redox Dynamics and Biogeochemistry along a Tropical Elevation Gradient. Ecol. Bull. 2013, 54, 195–209. [Google Scholar]
  21. Chen, D.; Yu, M.; González, G.; Zou, X.; Gao, Q. Climate Impacts on Soil Carbon Processes along an Elevation Gradient in the Tropical Luquillo Experimental Forest. Forests 2017, 8, 90. [Google Scholar] [CrossRef]
  22. González, G.; Luce, M.M. Woody Debris Characterization along an Elevation Gradient in Northeastern Puerto Rico. Ecol. Bull. 2013, 54, 181–193. [Google Scholar]
  23. Harris, N.L.; Medina, E. Changes in Leaf Properties across an Elevation Gradient in the Luquillo Mountains, Puerto Rico. Ecol. Bull. 2013, 54, 169–179. [Google Scholar]
  24. Weaver, P.L.; Gould, W.A. Forest Vegetation along Environmental Gradients in Northeastern Puerto Rico. Ecol. Bull. 2013, 54, 43–65. [Google Scholar]
  25. Yu, M.; Gao, Q. Topography, Drainage Capability, and Legacy of Drought Differentiate Tropical Ecosystem Response to and Recovery from Major Hurricanes. Environ. Res. Lett. 2020, 15, 104046. [Google Scholar] [CrossRef]
  26. Leitold, V.; Morton, D.C.; Martinuzzi, S.; Paynter, I.; Uriarte, M.; Keller, M.; Ferraz, A.; Cook, B.D.; Corp, L.A.; González, G. Tracking the Rates and Mechanisms of Canopy Damage and Recovery Following Hurricane Maria Using Multitemporal Lidar Data. Ecosystems 2021, 25, 892–910. [Google Scholar] [CrossRef]
  27. Schwartz, N.B.; Budsock, A.M.; Uriarte, M. Fragmentation, Forest Structure, and Topography Modulate Impacts of Drought in a Tropical Forest Landscape. Ecology 2019, 100, e02677. [Google Scholar] [CrossRef]
  28. Schwartz, N.B.; Feng, X.; Muscarella, R.; Swenson, N.G.; Umaña, M.N.; Zimmerman, J.K.; Uriarte, M. Topography and Traits Modulate Tree Performance and Drought Response in a Tropical Forest. Front. For. Glob. Chang. 2020, 3, 596256. [Google Scholar] [CrossRef]
  29. Smith-Martin, C.M.; Muscarella, R.; Ankori-Karlinsky, R.; Delzon, S.; Farrar, S.L.; Salva-Sauri, M.; Thompson, J.; Zimmerman, J.K.; Uriarte, M. Hydraulic Traits Are Not Robust Predictors of Tree Species Stem Growth during a Severe Drought in a Wet Tropical Forest. Funct. Ecol. 2022. [Google Scholar] [CrossRef]
  30. Pepin, N.C.; Arnone, E.; Gobiet, A.; Haslinger, K.; Kotlarski, S.; Notarnicola, C.; Palazzi, E.; Seibert, P.; Serafin, S.; Schöner, W.; et al. Climate Changes and Their Elevational Patterns in the Mountains of the World. Rev. Geophys. 2022, 60, e2020RG000730. [Google Scholar] [CrossRef]
  31. Waide, R.B.; Comarazamy, D.E.; González, J.E.; Hall, C.A.S.; Lugo, A.E.; Luvall, J.C.; Murphy, D.J.; Ortiz-Zayas, J.R.; Ramírez-Beltran, N.D.; Scatena, F.N.; et al. Climate Variability at Multiple Spatial and Temporal Scales in the Luquillo Mountains, Puerto Rico. Ecol. Bull. 2013, 54, 21–41. [Google Scholar]
  32. González, G.; Willig, M.R.; Waide, R.B. Ecological Gradient Analyses in a Tropical Landscape: Multiples Perspectives and Emerging Themes. Ecol. Bull. 2013, 54, 13–20. [Google Scholar]
  33. Gould, W.A.; González, G.; Carrero Rivera, G. Structure and Composition of Vegetation along an Elevational Gradient in Puerto Rico. J. Veg. Sci. 2006, 17, 653–664. [Google Scholar] [CrossRef]
  34. Van Beusekom, A.E.; González, G.; Rivera, M.M. Short-Term Precipitation and Temperature Trends along an Elevation Gradient in Northeastern Puerto Rico. Earth Interact. 2015, 19, 1–33. [Google Scholar] [CrossRef]
  35. Van Beusekom, A.E.; González, G.; Scholl, M.A. Analyzing Cloud Base at Local and Regional Scales to Understand Tropical Montane Cloud Forest Vulnerability to Climate Change. Atmos. Chem. Phys. 2017, 17, 7245–7259. [Google Scholar] [CrossRef]
  36. Malkus, J.S. The Effects of a Large Island upon the Trade-Wind Air Stream. Q. J. R. Meteorol. Soc. 1955, 81, 538–550. [Google Scholar] [CrossRef]
  37. Odum, H.T.; Pigeon, R.F. A Tropical Rain Forest: A Study of Irradiation and Ecology at El Verde, Puerto Rico; US Atomic Energy Commission, Division of Technical Information: Washington, DC, USA, 1970. [Google Scholar]
  38. Giannini, A.; Kushnir, Y.; Cane, M.A. Interannual Variability of Caribbean Rainfall, ENSO, and the Atlantic Ocean. J. Clim. 2000, 13, 297–311. [Google Scholar] [CrossRef]
  39. Taylor, M.A.; Whyte, F.S.; Stephenson, T.S.; Campbell, J.D. Why Dry? Investigating the Future Evolution of the Caribbean Low Level Jet to Explain Projected Caribbean Drying. Int. J. Climatol. 2013, 33, 784–792. [Google Scholar] [CrossRef]
  40. Holdridge, L.R.; Grenke, W.C. Forest Environments in Tropical Life Zones: A Pilot Study; Pergamon Press: Oxford, UK, 1971. [Google Scholar]
  41. Ewel, J.J.; Whitmore, J.L. The Ecological Life Zones of Puerto Rico and the US Virgin Islands; Research Paper ITF-018; USDA Forest Service, Institute of Tropical Forestry: Washington, DC, USA, 1973; p. 18. [Google Scholar]
  42. Velazquez-Lozada, A.; Gonzalez, J.E.; Winter, A. Urban Heat Island Effect Analysis for San Juan, Puerto Rico. Atmos. Environ. 2006, 40, 1731–1741. [Google Scholar] [CrossRef]
  43. Medina, E.; González, G.; Rivera, M.M. Spatial and Temporal Heterogeneity of Rainfall Inorganic Ion Composition in Northeastern Puerto Rico. Ecol. Bull. 2013, 54, 157–167. [Google Scholar]
  44. Schellekens, J.; Scatena, F.N.; Bruijnzeel, L.A.; Wickel, A.J. Modelling Rainfall Interception by a Lowland Tropical Rain Forest in Northeastern Puerto Rico. J. Hydrol. 1999, 225, 168–184. [Google Scholar] [CrossRef] [Green Version]
  45. Baldocchi, D.; Falge, E.; Wilson, K. A Spectral Analysis of Biosphere–Atmosphere Trace Gas Flux Densities and Meteorological Variables across Hour to Multi-Year Time Scales. Agric. For. Meteorol. 2001, 107, 1–27. [Google Scholar] [CrossRef]
  46. Mills, T.C. Spectral Analysis of Time Series: The Periodogram Revisited and Reclaimed. In The Foundations of Modern Time Series Analysis; Springer: Berlin/Heidelberg, Germany, 2011; pp. 357–374. [Google Scholar]
  47. Pelletier, J.D. Natural Variability of Atmospheric Temperatures and Geomagnetic Intensity over a Wide Range of Time Scales. Proc. Natl. Acad. Sci. USA 2002, 99, 2546–2553. [Google Scholar] [CrossRef] [PubMed]
  48. Richards, M.T.; Rogers, M.L.; Richards, D.S.P. Long-Term Variability in the Length of the Solar Cycle. Publ. Astron. Soc. Pac. 2009, 121, 797–809. [Google Scholar] [CrossRef]
  49. Wu, W.; Geller, M.A.; Dickinson, R.E. The Response of Soil Moisture to Long-Term Variability of Precipitation. J. Hydrometeorol. 2002, 3, 604–613. [Google Scholar] [CrossRef]
  50. Hirsch, R.M.; Slack, J.R. A Nonparametric Trend Test for Seasonal Data with Serial Dependence. Water Resour. Res. 1984, 20, 727–732. [Google Scholar] [CrossRef]
  51. Hirsch, R.M.; Slack, J.R.; Smith, R.A. Techniques of Trend Analysis for Monthly Water Quality Data. Water Resour. Res. 1982, 18, 107–121. [Google Scholar] [CrossRef]
  52. Sen, P.K. Estimates of the Regression Coefficient Based on Kendall’s Tau. J. Am. Stat. Assoc. 1968, 63, 1379–1389. [Google Scholar] [CrossRef]
  53. Thiel, H. A Rank-Invariant Method of Linear and Polynomial Regression Analysis. Indag. Math. 1950, 12, 173–184. [Google Scholar]
  54. Vicente-Serrano, S.M.; Beguería, S.; López-Moreno, J.I. A Multiscalar Drought Index Sensitive to Global Warming: The Standardized Precipitation Evapotranspiration Index. J. Clim. 2010, 23, 1696–1718. [Google Scholar] [CrossRef]
  55. Sorí, R.; Méndez-Tejeda, R.; Stojanovic, M.; Fernández-Alvarez, J.C.; Pérez-Alarcón, A.; Nieto, R.; Gimeno, L. Spatio-Temporal Assessment of Meteorological Drought in Puerto Rico between 1950 and 2019. Environ. Sci. Proc. 2021, 8, 40. [Google Scholar] [CrossRef]
  56. Reed, S.C.; Reibold, R.; Cavaleri, M.A.; Alonso-Rodríguez, A.M.; Berberich, M.E.; Wood, T.E. Chapter Six—Soil Biogeochemical Responses of a Tropical Forest to Warming and Hurricane Disturbance. In Advances in Ecological Research; Tropical Ecosystems in the 21st Century; Dumbrell, A.J., Turner, E.C., Fayle, T.M., Eds.; Academic Press: Cambridge, MA, USA, 2020; Volume 62, pp. 225–252. [Google Scholar]
  57. Bouskill, N.J.; Wood, T.E.; Baran, R.; Ye, Z.; Bowen, B.P.; Lim, H.; Zhou, J.; Nostrand, J.D.V.; Nico, P.; Northen, T.R.; et al. Belowground Response to Drought in a Tropical Forest Soil. I. Changes in Microbial Functional Potential and Metabolism. Front. Microbiol. 2016, 7, 525. [Google Scholar] [CrossRef] [PubMed]
  58. Uriarte, M.; Muscarella, R.; Zimmerman, J.K. Environmental Heterogeneity and Biotic Interactions Mediate Climate Impacts on Tropical Forest Regeneration. Glob. Chang. Biol. 2018, 24, e692–e704. [Google Scholar] [CrossRef] [PubMed]
  59. Song, X.; Li, J.; Zhang, W.; Tang, Y.; Sun, Z.; Cao, M. Variant Responses of Tree Seedling to Seasonal Drought Stress along an Elevational Transect in Tropical Montane Forests. Sci. Rep. 2016, 6, 36438. [Google Scholar] [CrossRef]
  60. Wood, T.E.; Cavaleri, M.A.; Giardina, C.P.; Khan, S.; Mohan, J.E.; Nottingham, A.T.; Reed, S.C.; Slot, M. Chapter 14—Soil Warming Effects on Tropical Forests with Highly Weathered Soils. In Ecosystem Consequences of Soil Warming; Mohan, J.E., Ed.; Academic Press: Cambridge, MA, USA, 2019; pp. 385–439. ISBN 978-0-12-813493-1. [Google Scholar]
  61. González, G.; Van Beusekom, A.E.; Rivera, M.M. Northeastern Puerto Rico Open-Canopy and Under-Canopy Temperature and Moisture Data on an Elevational Gradient 2006–2021; Forest Service Research Data Archive: Fort Collins, CO, USA, 2022. [Google Scholar] [CrossRef]
Figure 1. Map of all locations of data collection. This figure is modified from a previous study [34] to add two new sites. The map includes the National Weather Service Cooperative Observer Program (COOP) stations that collect long-term weather data in the area.
Forests 14 00325 g001
Disclaimer/Publisher’s Note: The statements, opinions and data contained in all publications are solely those of the individual author(s) and contributor(s) and not of MDPI and/or the editor(s). MDPI and/or the editor(s) disclaim responsibility for any injury to people or property resulting from any ideas, methods, instructions or products referred to in the content.

