Article

Quantifying the Probability of Decline in Quality: Implications for Selection Management in Northern Hardwood Forests

by
Guillaume Moreau
1,*,
Malcolm J. L. Cecil-Cockwell
1,
Alexis Achim
2,
Steve Bédard
3,
François Guillemette
3 and
John Caspersen
1
1
Daniels Institute of Forestry and Conservation, University of Toronto, 33 Willcocks St., Toronto, ON M5S 3B3, Canada
2
Département des Sciences du Bois et de la Forêt, Université Laval, 2405 Rue de la Terrasse, Québec, QC G1V 0A6, Canada
3
Direction de la Recherche Forestière, Ministère des Ressources Naturelles et des Forêts du Québec, 2700 Rue Einstein, Québec, QC G1P 3W8, Canada
*
Author to whom correspondence should be addressed.
Forests 2023, 14(2), 280; https://doi.org/10.3390/f14020280
Submission received: 5 January 2023 / Revised: 23 January 2023 / Accepted: 28 January 2023 / Published: 31 January 2023
(This article belongs to the Section Forest Ecology and Management)

Abstract

:
Northern hardwoods are susceptible to a wide range of defects that can reduce the amount of sound wood with desirable qualities, such as the clear sapwood of sugar maple trees. Yet, the rate at which trees decline in quality due to the development of such defects has never been quantified in northern hardwood forests due to a dearth of repeat inventories that record the appearance of defects over time. As a result, it remains uncertain whether, and how, selection management reduces the probability of decline in quality. In this study, we quantify the rate at which trees decline in quality due to the development of defects, and we test several hypotheses regarding the influence of selection management on quality. Our results show that (1) the probability of decline in quality increases as trees grow larger; (2) crown dieback also increases the probability of decline in quality; (3) the probability of decline in quality is slightly lower in managed stands than in unmanaged stands, and (4) the probability of decline in quality increases with the mean annual temperature of the site. Finally, we combined our estimates of the probability of decline in quality with previous estimates of the probability of mortality to assess the overall risk associated with retaining trees of different species, sizes, and vigour profiles. The resulting metric can inform efforts to improve the management of northern hardwood forests by providing an integrated estimate of the risk that the value of a tree will be reduced, or eliminated, due to mortality or decline in quality.

1. Introduction

In northern hardwood forests, the main goal of managing a stand is to grow trees that will yield one or more logs that are suitable for the production of lumber and veneer [1]. Yet, product recovery rates often fail to meet foresters’ expectations because northern hardwoods are susceptible to a wide range of defects, including biotic defects such as cankers and abiotic defects such as cracks [2]. These defects reduce the volume and value of the products that can be recovered from a tree by reducing the proportion of sound wood with desirable qualities, such as the clear sapwood of sugar maple trees.
Many of these defects are readily recognized by foresters, who use them as a proxy for quality when deciding which trees to retain during selection harvests. As a result, it is well known that the occurrence of defects increases as trees grow larger [3,4,5], which is one of the reasons that trees are typically retained only until reaching a maximum diameter of 45 to 70 cm (e.g., OMNR [6]), depending on the region. Retaining high-quality trees beyond the maximum diameter is believed to be economically inefficient, as there is excessive risk that such trees will fail to increase or maintain their value due to their decline [3].
The fact that the occurrence of defects increases as trees grow larger suggests that the probability of developing defects increases with tree age and diameter. This hypothesis is consistent with other evidence that all trees eventually senesce, particularly with respect to the increasing probability of mortality [7]. However, it is also possible that the probability of developing defects remains constant or decreases over time, and that defects have simply accumulated over time with larger, older trees [8]. Indeed, the rate at which trees develop defects related to quality has never been quantified using longitudinal data in the northern hardwood forests of North America, meaning that the significance of the probability of decline in quality relative to tree size is fairly limited.
In addition to harvesting trees that exceed the maximum diameter, foresters also seek to minimize the probability of decline in quality in selection-managed stands by reducing stand density and retaining well-spaced trees that are not only of high quality but also vigorous. Controlling stand density and spacing reduces competition among residual trees, which reduces the probability of mortality [9,10]. Retaining vigorous trees, and particularly trees that have little to no crown dieback, also reduces the probability of mortality [11]. While it seems logical that these tree selection strategies would also reduce the probability of decline in quality, it remains uncertain whether, and how, selection management reduces it in uneven northern hardwood stands [5].
Another important challenge to selection management is to find the balance between improving stand quality and the conservation of biological diversity [12]. Indeed, the defects that are recognized by foresters for having the most impact on tree quality, such as fungal infections, cankers and advance decay [13,14], are also recognized as tree-related microhabitats that are key structural elements supporting forest biodiversity [15]. These distinctive structures are essential substrates for a diversity of species and communities to properly develop and spread [5,16]. Salvaging low-quality trees and the use of a maximum diameter for selection management may thus reduce the abundance and diversity of tree-related microhabitats and undermine their ecological benefits, as reported in managed European temperate forests (e.g., Larrieu et al. [16] and Paillet et al. [17]). This trade-off leaves forest managers in the middle of competing expectations, and because the rate at which trees develop defects has yet to be quantified in northern hardwood forests, the capacity of actual selection management to allow for their continuous renewal remains uncertain [5,18].
The lack of longitudinal studies is due to a dearth of repeat inventories that record the appearance of common defects through time. In this study, we make use of one such dataset to quantify the rate at which trees develop defects related to quality. We then test the following hypotheses: (1) the probability of decline in quality increases as trees grow larger; (2) crown dieback also increases the probability of decline in quality; (3) the probability of decline in quality is lower in managed stands than in unmanaged stands. Finally, we combine our estimates of the probability of decline in quality with previous estimates of the probability of mortality to assess the overall risk associated with retaining hardwoods of different species, sizes, and vigour profiles. These combined estimates aim to provide an integrated assessment of the risk that the value of a standing tree will decrease over time due to the development of defects, or be eliminated due to mortality.

2. Materials and Methods
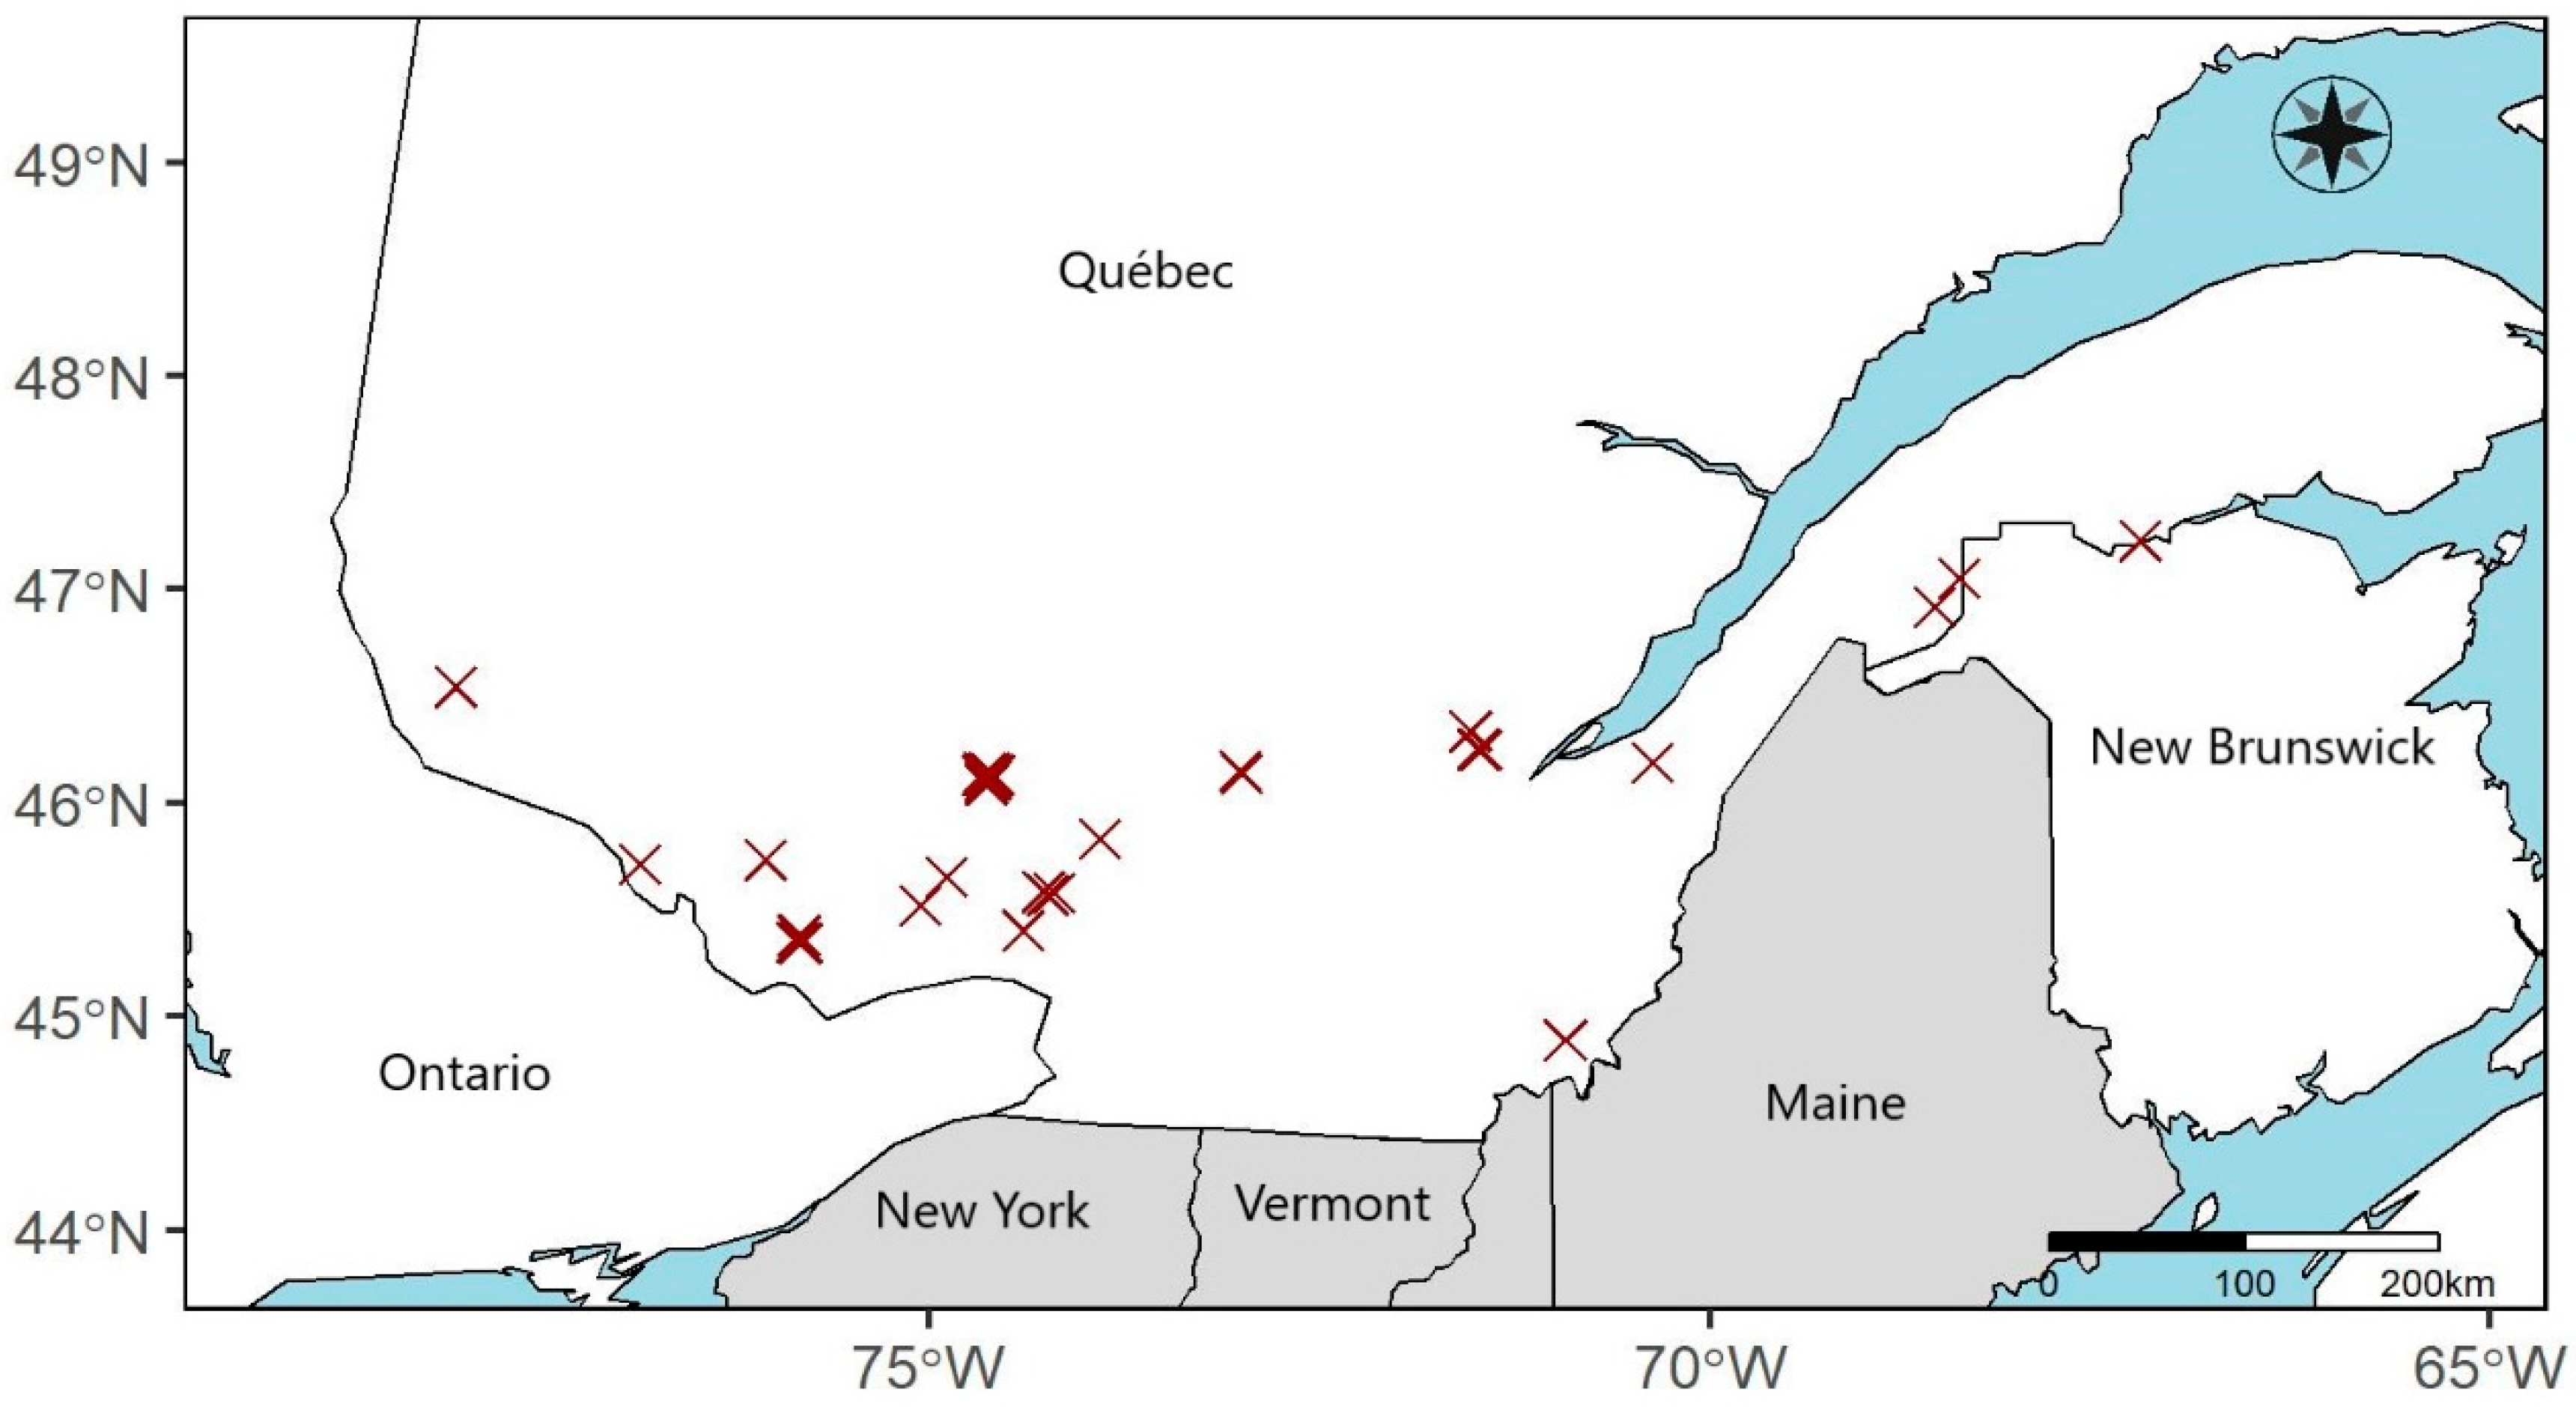
2.1. Sampling Sites

We used repeated measurements of stem and crown defects taken in long-term silvicultural trials conducted between 1983 and 2021 by the Direction de la recherche forestière of the ministère des Forêts, de la Faune et des Parcs du Québec. The inventory dataset includes 87 rectangular permanent sample plots (PSPs) of 0.5 ha (50 × 100 m) that were established in 18 experimental study sites spanning the northern hardwood forest zone of the province of Quebec [9,19]. This zone runs east–west between 78°00′ W to 65°00′ W and north–south between 44°00′ N to 47°00′ N, across an area of approximately 180,000 km2 (Figure 1). The topography is characterized by rolling hills and gentle slopes and the surface deposits are shallow or deep tills of glacial origin [20]. The mean annual temperature is 1.8–4.0 °C and the mean annual precipitation is 920–1420 mm, with the southwestern areas being warmer and dryer than the northeastern areas [21]. The sampling sites were located in previously unmanaged mature uneven-aged northern hardwood stands dominated by sugar maple (Acer saccharum Marsh.), followed by yellow birch (Betula alleghaniensis Britt.) and American beech (Fagus grandifolia Ehrh.) as the most common species, with minor components of red maple (Acer rubrum L.), black cherry (Prunus serotina Ehrh.), basswood (Tilia americana L.), hornbeam (Ostrya virginiana (Mill.) K. Koch), balsam fir (Abies balsamea (L.) Mill.), red spruce (Picea rubens Sargent) and Eastern hemlock (Tsuga Canadensis (L.) Carr.).

2.2. Experimental Design and Data Collection

Selection cuts were conducted in several stands in each of the study sites. The main objective was to reduce stand density uniformly while retaining well-spaced trees that are not only of high quality but also vigorous [22]. Harvesting priority was given to defective trees having the poorest silvicultural characteristics, such as culls, crown dieback and decaying wounds on the main stem [22], with a mean removal of about 30% of the merchantable basal area of the stand. A part of each stand was also left unmanaged, and PSPs of 0.5 ha were established in both the unmanaged (control) and the managed parts of the stand within the 12 months following the harvest. Plot basal area averaged 25 m2/ha in unmanaged plots and 18 m2/ha in managed plots at the time of their establishment. All trees with a diameter at breast height (DBH, 1.3 m above ground) ≥9.1 cm were numbered during plot establishment and the PSPs were inventoried periodically at a mean interval of five years. During each inventory, the tree species was recorded and the DBH was measured using a diameter tape. Tree vigour was assessed by measuring crown dieback, which is the proportion of crown lost to dieback or breakage [11]. The death of lower branches due to self-pruning was not considered.
Decline in quality was also assessed during the periodic inventories by recording the appearance of individual defects that are known to significantly reduce the volume or value of the products that can be recovered from hardwood trees [13,14]. The individual defects were combined into one of two groups during field evaluation. The first group of defects included both fruiting bodies of fungal infections and cankers on the bole. The most common fungi were Armillaria spp., Phellinus cinereus (Niemelä) Fr., Phellinus igniarius (L.: Fr.) Quel., Oxyporus populinus (Sokum.: Fr.) Donk, Kretzschmaria deusta (Hoff.: Fr.) Martin, Inonotus glomeratus (Pk.) Murr. and Inonotus obliquus (Pers.: Fr.) Pilat, while the most common cankers were Eutypella parasitica (Davidson and Lorenz) and Neonectria galligena (Bres.) Rossman and Samuels [19]. The second group of defects included the presence of advanced decay (also referred to as rot) on the stem, mainly in wounds, cavities and cracks. This type of internal decay is the result of complex interactions between a large number of bacteria and fungi that progressively discolour and then digest wood [23]. As demonstrated by Cockwell and Caspersen [13] and Havreljuk et al. [14], the occurrence of these two groups of defects can be used to assess tree quality as an efficient alternative to more complex specifically designed vigour or quality classifications (e.g., Monger [24] and Boulet and Landry [25]). Based on these recommendations, the appearance of one of these groups was considered as a decline in quality. The dataset consisted of 10,021 sugar maple and 1200 yellow birch trees that were periodically remeasured over a span of 20 to 36 years (mean: 25 years) and that remained alive over the study period. For both species, the number of sampled trees decreased with increasing diameter class, which is consistent with the typical distribution of trees in uneven-aged stands (Table 1).

2.3. Statistical Analysis

2.3.1. Probability of Decline in Quality

During each periodic inventory, trees presenting the first sign of decline in quality (i.e., the appearance of one group of defects) were identified. The probability of developing these defects was then modelled at the tree level using the Cox proportional hazards model, with plots included as a random frailty effect using a gamma distribution. These models can be used when the risk of a particular event is recorded through time, but the exact time of its occurrence can only be approximated. This is the case with the subject data, as the development of defects is only known to have occurred at some point between two periodic inventories. In our analysis, the event is therefore an interval-censored variable [26], and the development of defects related to quality was thus treated as a binary outcome, taking a value of 1 if a tree developed one or more defects and a value of 0 if a tree maintained quality up to a particular point in time, which in this case was the next inventory. Although the appearance of defects was recorded over time using repeated inventory, the candidate explanatory variables were fixed at the time of plot establishment for the purposes of our analysis [11].
Two types of explanatory variables were tested: (1) at the tree-level, the initial DBH (cm) as a continuous variable, crown dieback (%), and species; (2) at the plot-level, the basal area (BA, m2/ha) and a categorical treatment variable (managed/unmanaged) were used to quantify stand density, as suggested by Guillemette et al. [19] and Moreau et al. [11]. The mean annual temperature of the site (°C), and total precipitation (mm) for 1970–2000 were also tested (WorldClim database (V.2), [27]) The interaction between the candidate explanatory variables was also tested. Three different models were constructed: (1) the probability of developing fungi and cankers, (2) the probability of developing decaying defects, and (3) the probability of developing any defects related to quality.

2.3.2. Combined Probability of Decline in Quality and Mortality

An assessment of risk should consider the probability of decline in quality as well as the probability of mortality, as trees that die between harvests lose all their value. Accordingly, we combined our estimates of the probability of decline in quality with previous estimates of the probability of mortality to assess the overall risk associated with retaining hardwoods of different species, sizes, and vigour profiles.
In a previous analysis by Moreau et al. [11], sugar maple and yellow birch survival were modelled as a function of initial DBH and crown dieback using similar Cox proportional hazards models. The survival analysis were calibrated with the same dataset as this study, with the addition of a second dataset including 528 circular PSPs of 400 m2 that were established between 1995 and 1999 in 149 operational study sites throughout the northern hardwood forest zone of Quebec [11,28]. For both species, the combined risk of dying or declining in quality was computed as a function of initial DBH and crown dieback over a 30-year period. For the purposes of our analysis, non-vigorous trees were defined as having a crown dieback of 45%, which both reduced tree growth and increases the probability of mortality by more than 50% [11]. The combined risk was calculated using the following equation:
C R = M + 1 M × D  
where C R is the cumulative risk, M is the estimates of the probability of mortality and D is the estimates of the probability of decline in quality.
All statistical analyses were performed in the R statistical programming environment [29]. The coxph function of the survival package was used for the Cox proportional hazards models [30]. The important assumption in the Cox survival model is that the hazards are proportional, which means that the relative hazard remains constant over time with different covariates [31]. This model assumption was validated with graphical analyses of the residuals and statistically tested using the cox.zh function of the survival package. To help describe models, we computed the pseudo-R2 related to the Cox survival analysis using the coxr2 package. Finally, a correlation matrix and chi-square test of independence were performed to detect potential multicollinearity among covariates.

3. Results

For the three general models, low correlations among predictors agreed with a significant chi-square test of independence among categorical predictor variables and with an absence of multicollinearity. Therefore, all predictor variables were included in the models. Moreover, the proportional hazard assumption was supported by a non-significant relationship (α = 0.05) between residuals and time for each of the covariates and for the three global models, which also agreed with an absence of pattern with time from graphical inspection of residuals. Therefore, the assumption of proportional hazards was supported.

3.1. Probability of Developing Cankers and Fungi

Among trees that survived the entire study period, 18% developed cankers and fungi. The significant explanatory variables were the interaction between DBH and species, crown dieback, and the categorical management variable (Table 2), with the final model having a R2 of 0.27. The probability of developing cankers and fungi increased with DBH (Figure 2A,B), and the averaged probability of developing these defects was slightly greater for sugar maple than yellow birch (Figure 1). However, the effect of DBH was more important for yellow birch, for which the probability of developing cankers and fungi was 33% higher for large trees (hereafter, 60 cm DBH) than small trees (hereafter, 20 cm DBH) after 30 years (Figure 2B). For sugar maple, the probability of developing cankers and fungi was 15% higher for large trees than small trees over the same period (Figure 1A). For both species, the probability of developing cankers and fungi increased with increasing crown dieback (Figure 2C,D). Lastly, trees in managed plots showed slightly lower probability of developing cankers and fungi (Figure 2E,F).

3.2. Probability of Developing Decaying Defects

During the study period, 25% of all trees that survived developed decaying defects. The significant explanatory variables were the initial DBH, tree species, crown dieback, and the plot-level averaged annual temperature (Table 2), with the final model having an R2 of 0.17. No interactions were retained in the model. As with cankers and fungi, the probability of developing decaying defects increased with increasing DBH (Figure 3A,B), and the probability was slightly greater for sugar maple than yellow birch (Figure 3). The probability of developing decaying defects increased with dieback (Figure 3C,D), and with annual average temperature (Figure 3E,F).

3.3. Probability of Decline in Quality

Overall, 34% of trees that survived during the study period developed at least one defect related to tree quality. The significant explanatory variables were the interaction between DBH and species, crown dieback, and the annual temperature (marginal; p = 0.056), with an R2 of 0.18 (Table 2). As expected, the probability of decline in quality increased considerably with increasing DBH (Figure 4A,B). For yellow birch, the probability of decline in quality was 50% higher for large trees than small trees after 30 years (Figure 4B), while for sugar maple, this probability was 38% higher for large trees than small trees (Figure 4A). Over 30 years, the probability of decline in quality for sugar maple and yellow birch trees with 45% crown dieback was 18% and 14% higher than that of a tree without any dieback, respectively (Figure 4C,D). Lastly, the probability of decline in quality increased slightly with annual average temperature (Figure 4E,F).

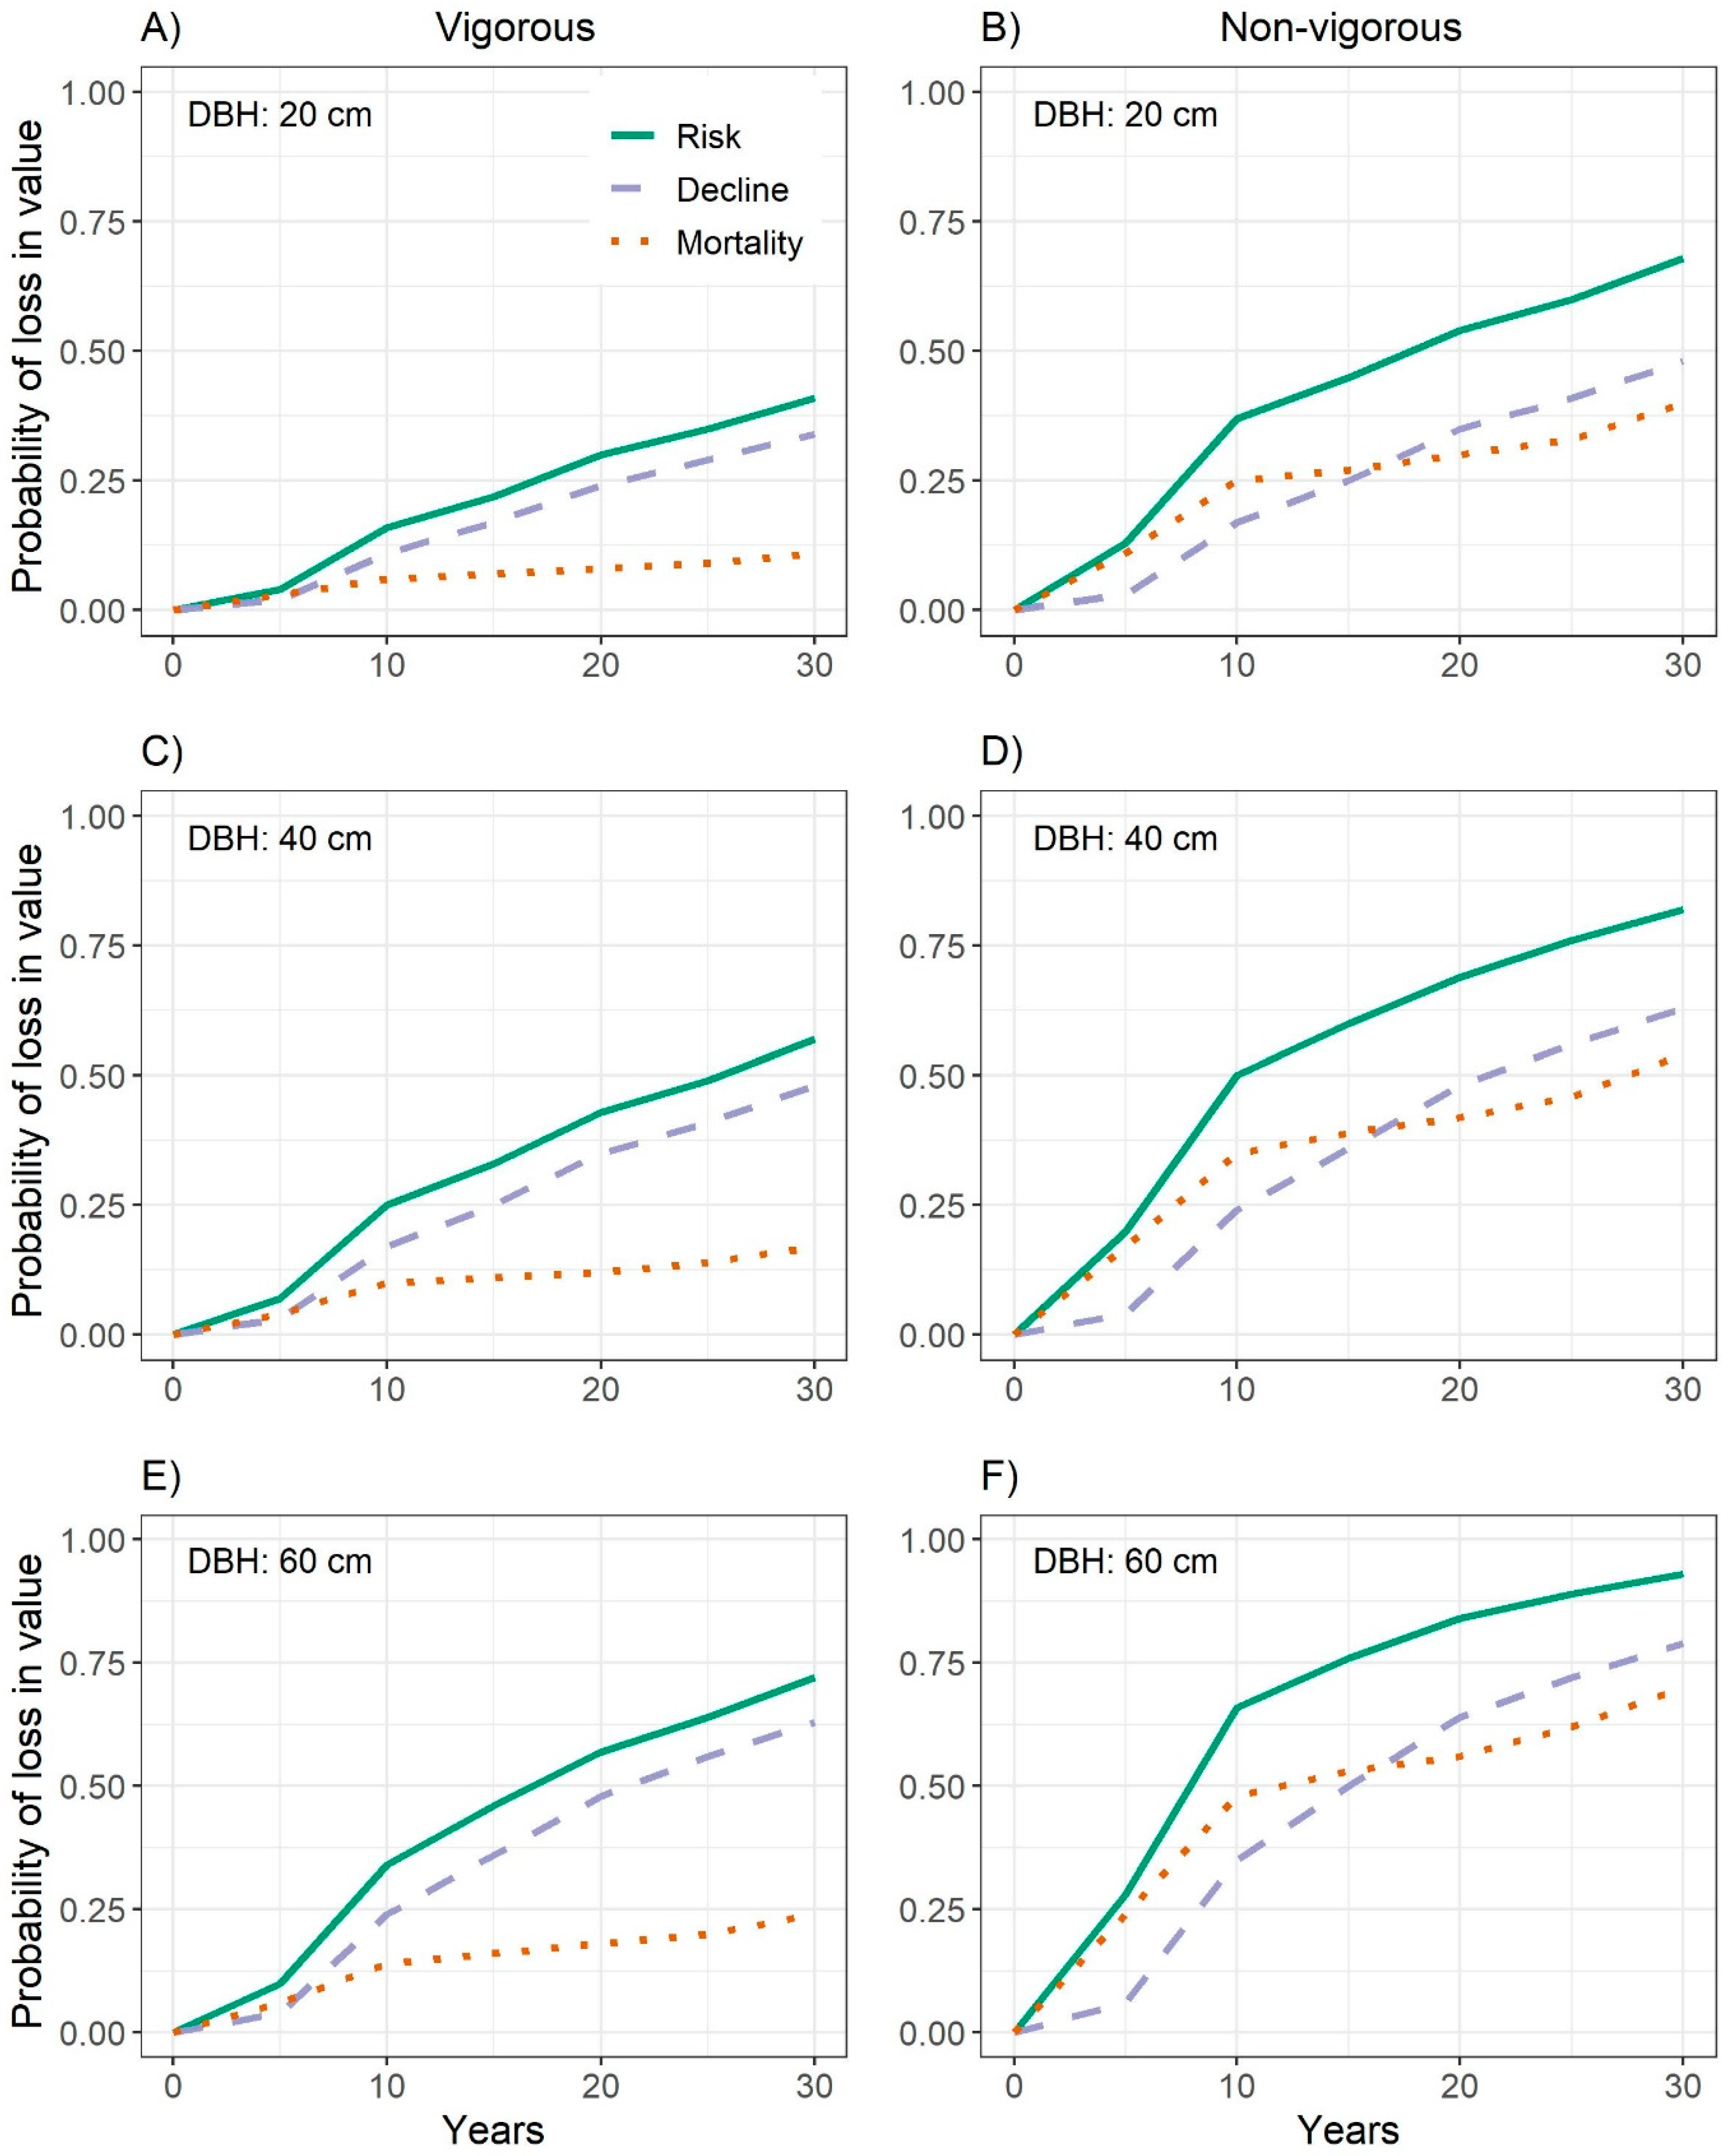
3.4. Combined Probability of Decline in Quality and Mortality

For sugar maple, both the probability of mortality and decline in quality increased with DBH, which resulted in a much higher combined risk for large trees (72%) than small trees (41%) after 30 years (Figure 5A,E). While a crown dieback of 45% increased the probability of decline in quality, the effect was even greater for the probability of mortality (Figure 5B–F). Thus, the combined risk for trees with 45% crown dieback increased by approximately 25% for all DBH class (Figure 5B–F). As a result, less than 10% of all initially non-vigorous sugar maples with a DBH of 60 cm are likely to survive and also maintain quality over 30 years.
For yellow birch, only the probability of decline in quality increased with DBH, but the combined risk for large trees was still 35% higher than for small trees after 30 years (Figure 6A–E). As with sugar maple, the combined risk increased for trees with 45% crown dieback, but this effect was greater for small trees than large trees (Figure 6B–F). As a result, the combined risk for small, non-vigorous yellow birch was as high as 66%, which is almost as high as for large, vigorous trees that were not affected by crown dieback (72%).

4. Discussion

One of the main objectives of this study was to assess whether the probability of decline in quality increases as trees grow larger (hypothesis 1). Our results confirm that the probability of decline in quality increases substantially with DBH for both sugar maple and yellow birch. The effect of DBH on the probability of decline in quality was similar in magnitude to its previously reported effect on the probability of decline in vigour [11]. For example, sugar maple trees with a diameter of 60 cm have a 61% probability of declining in quality over a 30-year period (Figure 4) and a 68% probability of declining in vigour [11]. The sheer magnitude of these risks amplifies the biological and economic impact that defects are already known to have on trees: biologically, a decline in vigour can reduce tree growth by more than 70% and increases the probability of mortality by more than 60% [11]; economically, a decline in quality can reduce a tree’s value by more than 50% [13,14]. Thus, our effort to quantify the risk of decline highlights the potential beneficial impacts of tree selection strategies that promote the retention and growth of smaller trees to maximize the yield of quality timber [32]. Indeed, the higher probability of developing defects for larger trees may be responsible for the decline of both the monetary value per cubic meter and the sawlog-to-merchantable volume ratio that were reported for sugar maple and yellow birch larger than 45 cm [14,33], as well as reaching a plateau in growth efficiency from a similar DBH threshold [34].
Our results underscore the potential impact of setting the maximum diameter too high, as may be the case in central Ontario, where the recommended maximum diameter for sugar maple trees is 60 cm [6,35]. Our results for sugar maple show that the probability of losing value by dying or declining in quality reaches 72% and 93% at 60 cm, for vigorous and non-vigorous trees, respectively (Figure 5). The trend was similar for yellow birch (72% and 91%, respectively), suggesting that the maximum diameter should be much lower than the recommended 60 cm. Recently, a maximum diameter of 43–46 cm has been recommended for Quebec [36], based on a financial maturity analysis, which is defined as the diameter at which there is no financial gain in leaving trees to grow, taking into account the risk of potential losses due to mortality and declining quality. While low-vigorous trees from all size classes that are affected by crown dieback, cankers and fungi should remain the first harvest priority during selection cutting [11], a smaller maximum diameter such as the one proposed by Guillemette [35] could be part of the following priorities to reach the desirable harvest rate. Maintaining the highest priority for low-vigour trees is mandatory to avoid further high grading that resulted from past diameter-limit cuttings in many northern hardwoods stands [1,37].
The other main objective of this study was to assess whether selection management can further reduce the risk of decline in quality by reducing stand density and retaining well-spaced, vigorous trees. Our results confirm that risk of decline is much lower for vigorous trees that have little to no crown dieback (Figure 4, hypothesis 2). However, the effect of crown dieback on the probability of decline in quality was smaller than its previously reported effect on the probability of mortality [11]. Nevertheless, both of these results suggest that healthy crowns are able to fix more carbon, some of which can be allocated to the growth of callus tissues, the compartmentalization of xylem, and the occlusion of wounds [23]. Thus, even if incipient crown dieback does not have an immediate impact on value [14], the resulting decline in vigour does increase vulnerability to infections that lead to a subsequent decline in quality. These results demonstrate once again that focusing on the retention of trees with little to no crown dieback will help foresters meet both the silvicultural and economic objectives of selection management [11]. Furthermore, prioritizing the removal of trees that have begun to exhibit crown dieback but no stem defects will not only serve to increase the yield of subsequent harvests, but also the recovery of value in the current harvest, by allowing tree markers to better identify low-vigor, high-value trees [38].
On the other hand, while our results show that the probability of decline in quality is lower in managed stands than in unmanaged stands, the effect of selection management alone was rather modest (hypothesis 3). This is consistent with our previous finding that the probability of decline in vigour was similar in managed and unmanaged stands [11]. It is also in line with the similar occurrence and characteristics of tree-related microhabitats that was reported between selection-managed and unmanaged northern hardwood stands [5]. Taken together, these results suggest that reducing competition with other residual trees (by controlling density and spacing) has a smaller effect on the development of defects than retaining smaller trees with little to no crown dieback. However, our plot-level variable (i.e., managed/unmanaged) is unable to capture the full range of variation in competition that individual trees must endure, so a spatial neighborhood analysis would be required to better compare the effect of controlling competition with the effect of the other selection strategies [39,40]. In addition, our study could not capture the potential effect of long-term management, since the study period of management (20 to 36 years) represents approximately 10 to 25% of the lifespan of a mature tree (150–200 years).
Over the study period, 25% of the trees developed advanced decay, making this the defect category with the highest occurrence. Unlike defects such as cankers and fungi, the development of these decaying defects increased with increasing temperature, consistent with the well-documented correlation between temperature and decomposition [41]. In general, decay increases with temperature due to the thermodynamics of enzymatic reactions [42], and an increase of micro-organisms and fungal respiration [43,44]. However, previous studies generally focused on standing dead trees and downed woody debris [40,44], and few have previously quantified how temperature affects decay rates in living trees growing under natural forest conditions [45]. Our finding that the development of decaying defects increased with temperature contrasts with the results of Guillemette and Bedard [46], who reported a higher proportion of high-quality trees in warmer portions of our study area. This discrepancy may be explained by the fact that they did not disaggregate the various defects when conducting their temperature-sensitivity analysis. Indeed, the effect of temperature became marginal in our analysis when the two defect categories were combined to include all defects. This suggests that the positive effect of temperature on the probability of developing decay may be partly offset by the greater incidence of frost damage at lower temperatures [46,47].
Our results suggest that global warming will accelerate the rate that hardwoods develop decaying defects, which would reduce the yield of high-quality logs and our ability to predict it using the equations presented here. From an ecological perspective, accelerated decay may also reduce forest carbon storage and our ability to quantify it using actual allometric equations [45]. These results underscore the need to examine decay dynamics across broader climatic gradients in order to better predict how environmental conditions affect the risk of developing defects. Such effort should also include the potential effect of soil conditions variability, which could be another important driver of defect development [47] that was not directly captured by our analysis.

Managing for Yield and Biodiversity Conservation

While interpreting our results to elaborate selection strategies that favour the yield of quality timber, it is fundamental to recognize the critical role of defects as microhabitats that are supporting forest biodiversity [48]. Consequently, focusing on the yielding of smaller trees that have not yet reached financial maturity must be complemented by the retention of a certain number of large trees that are likely to decline, decay and die, thereby providing habitats that benefit biodiversity [49]. For example, current silvicultural guidelines in Ontario require that tree markers retain at least six live trees per hectare that are larger than 25 cm at the DBH and that have cavities or the potential to develop cavities [6]. Because the rate at which trees developed defects increases substantially with DBH, our results suggest that tree markers should focus on the retention of larger trees to create greater microhabitats opportunities [49]. Current guidelines also require the retention of at least one supercanopy tree (trees >60 cm at DBH) per four hectares when available. Indeed, the equations presented in this study could be used to enhance the retention recommendations in northern hardwood stands managed under smaller maximum diameter to ensure that the characteristics of tree-related microhabitats continue to mimic those in unmanaged forests [5,50,51].

5. Conclusions

This study demonstrates that the probability a tree will decline in quality increases substantially as it grows larger. Because the same is true for the probability of mortality and the probability of decline in vigour, our results underscore the potential silvicultural and economic impacts of selection strategies that favor the retention and growth of smaller trees that have not yet reached financial maturity [11,32,36]. Further research on financial maturity should focus on quantifying the rate that trees increase (or decrease) in value, and the extent to which value decreases when trees develop defects. Moreover, further work should include the effect of time on the actualization of value, which was not the case in our analysis. With this additional information, the size at which trees reach financial maturity could be calculated by using our risk analysis to offset the increase in value derived from biological growth, by the decrease in value derived from the risk of dying or declining in quality.
Our study also demonstrates that crown dieback, the best indicator of being non-vigorous, not only increases the probability of mortality [11] but also the probability of decline in quality. Taken together, these results show that prioritizing the removal of trees with crown dieback will help foresters meet both the silvicultural and economic objectives of selection silviculture. Finally, we combined our estimates of the probability of decline in quality with our previous estimates of the probability of mortality to assess the overall risk associated with retaining trees of different species, size, and vigour profiles. The resulting metric can inform efforts to improve the management of northern hardwood forests by providing an integrated estimate of the probability that a tree will die or decline in value.

Author Contributions

G.M.: conceptualization, methodology, formal analysis, writing—original draft, visualization. M.J.L.C.-C.: conceptualization, writing—review and editing, funding acquisition. A.A.: conceptualization, writing—review and editing, funding acquisition. S.B.: review and editing, investigation, data curation. F.G.: review and editing, investigation, data curation. J.C.: conceptualization, writing—review and editing, funding acquisition, supervision. All authors have read and agreed to the published version of the manuscript.

Funding

Data processing: analysis and writing contribution of Guillaume Moreau, Alexis Achim and John Caspersen was funded by a NSERC Alliance project Silva21 NSERC ALLRP 556265-20, granted to Alexis Achim, and by a research grant from Haliburton Forest, granted to Alexis Achim and John Caspersen. The data acquisition and writing contribution of Steve Bédard and François Guillemette was funded by the Ministère des Ressources naturelles et des Forêts under projects 142332026 and 122332053 respectively granted to Steve Bédard and François Guillemette.

Data Availability Statement

Data could be made available upon reasonable request.

Acknowledgments

The authors are grateful to Zoran Majcen who initiated the projects on selection cutting in Québec and to all forestry technicians of the Direction de la recherche forestière, Ministère des Ressources naturelles et des Forêts du Québec for their cooperation in field measurements and data processing in particular Laurier Groleau, Jocelyn Hamel, Pierrot Boulay, Étienne Boulay, Pierre Laurent, Jean-Francois Leblond, William Michaud et Raphael Bégin, and all the consultants who contributed to field measurements over the years.

Conflicts of Interest

The authors declare that they have no known competing financial interests or personal relationships that could have appeared to influence the work reported in this paper.

References

  1. Nyland, R.D. Selection system in northern hardwoods. J. For. 1988, 96, 18–21. [Google Scholar]
  2. Baral, S.K.; Schneider, R.; Pothier, D.; Berninger, F. Predicting sugar maple (Acer saccharum) discoloured wood characteristics. Can. J. For. Res. 2013, 43, 649–657. [Google Scholar] [CrossRef]
  3. Dey, D.C.; Dwyer, J.; Wiedenbeck, J. Relationship between Tree Value, Diameter, and Age in High-Quality Sugar Maple (Acer saccharum) on the Menominee Reservation, Wisconsin. J. For. 2017, 115, 397–405. [Google Scholar] [CrossRef]
  4. Power, H.; Havreljuk, F. Predicting hardwood quality and its evolution over time in Quebec's forests. For. Int. J. For. Res. 2018, 91, 259–270. [Google Scholar] [CrossRef]
  5. Martin, M.; Raymond, P.; Boucher, Y. Influence of individual tree characteristics, spatial structure and logging history on tree-related microhabitat occurrence in North American hardwood forests. For. Ecosyst. 2021, 8, 27. [Google Scholar] [CrossRef]
  6. Ontario Ministry of Natural Ressources. Ontario Tree Marking Guide, Ver. 1.1.; Ontario Ministry of Natural Ressources: Québec, QC, Canada, 2004; 252p.
  7. Fortin, M.; Bédard, S.; DeBlois, J.; Meunier, S. Predicting individual tree mortality in northern hardwood stands under uneven-aged management in southern Québec, Canada. Ann. For. Sci. 2008, 65, 205. [Google Scholar] [CrossRef] [Green Version]
  8. Courbaud, B.; Larrieu, L.; Kozak, D.; Kraus, D.; Lachat, T.; Ladet, S.; Müller, J.; Paillet, Y.; Sagheb-Talebi, K.; Schuck, A.; et al. Factors influencing the rate of formation of tree-related microhabitats and implications for biodiversity conservation and forest management. J. Appl. Ecol. 2021, 59, 492–503. [Google Scholar] [CrossRef]
  9. Bédard, S.; Majcen, Z. Ten-Year Response of Sugar Maple-Yellow Birch-Beech Stands to Selection Cutting in Québec. North. J. Appl. For. 2001, 18, 119–126. [Google Scholar] [CrossRef] [Green Version]
  10. Moreau, G.; Achim, A.; Pothier, D. A dendrochronological reconstruction of sugar maple growth and mortality dynamics in partially cut northern hardwood forests. For. Ecol. Manag. 2019, 437, 17–26. [Google Scholar] [CrossRef]
  11. Moreau, G.; Cecil-Cockwell, M.J.; Pothier, D.; Achim, A.; Bédard, S.; Guillemette, F.; Caspersen, J. Visual assessment of tree vigour in Canadian northern hardwood forests: The need for a simplified system. For. Ecol. Manag. 2023, 529, 120720. [Google Scholar] [CrossRef]
  12. Puettmann, K.J.; Coates, K.D.; Messier, C. A Critique of Silviculture: Managing for Complexity; Island Press: Washington, DC, USA, 2009. [Google Scholar]
  13. Cockwell, M.; Caspersen, J. Sources of Variation in the Net Value of Sugar Maple Trees: Implications for Tree Selection and Operations Management. For. Prod. J. 2014, 64, 250–258. [Google Scholar] [CrossRef]
  14. Havreljuk, F.; Achim, A.; Auty, D.; Bédard, S.; Pothier, D. Integrating standing value estimations into tree marking guidelines to meet wood supply objectives. Can. J. For. Res. 2014, 44, 750–759. [Google Scholar] [CrossRef]
  15. Larrieu, L.; Paillet, Y.; Winter, S.; Bütler, R.; Kraus, D.; Krumm, F.; Lachat, T.; Michel, A.K.; Regnery, B.; Vandekerkhove, K. Tree related microhabitats in temperate and Mediterranean European forests: A hierarchical typology for inventory standardization. Ecol. Indic. 2018, 84, 194–207. [Google Scholar] [CrossRef]
  16. Larrieu, L.; Cabanettes, A.; Brin, A.; Bouget, C.; Deconchat, M. Tree microhabitats at the stand scale in montane beech–fir forests: Practical information for taxa conservation in forestry. Eur. J. For. Res. 2013, 133, 355–367. [Google Scholar] [CrossRef]
  17. Paillet, Y.; Archaux, F.; Boulanger, V.; Debaive, N.; Fuhr, M.; Gilg, O.; Gosselin, F.; Guilbert, E. Snags and large trees drive higher tree microhabitat densities in strict forest reserves. For. Ecol. Manag. 2017, 389, 176–186. [Google Scholar] [CrossRef]
  18. Raymond, P.; Royo, A.A.; Prévost, M.; Dumais, D. Assessing the single-tree and small group selection cutting system as intermediate disturbance to promote regeneration and diversity in temperate mixedwood stands. For. Ecol. Manag. 2018, 430, 21–32. [Google Scholar] [CrossRef]
  19. Guillemette, F.; Bédard, S.; Fortin, M. Evaluation of a tree classification system in relation to mortality risk in Québec northern hardwoods. For. Chron. 2008, 84, 886–899. [Google Scholar] [CrossRef] [Green Version]
  20. Robitaille, G.; Boutin, R.; Lachance, D. Effects of soil freezing stress on sap flow and sugar content of mature sugar maples (Acer saccharum). Can. J. For. Res. 1995, 25, 577–587. [Google Scholar] [CrossRef]
  21. Régnière, J.; Saint-Amant, R.; Béchard, A. BioSIM 10–Guide de l’utilisateur. Ressour. Nat. Can., Serv. can. for., Cent. for. Laurentides, Québec (Québec). Rapp. Inf. LAU-X-137. 2014. Available online: https://cfs.nrcan.gc.ca/publications?id=34817 (accessed on 9 May 2021).
  22. Majcen, Z.; Richard, Y.; Ménard, M.; Grenier, Y. Choix des Tiges à Marquer Pour le Jardinage D’érablières Inéquiennes, Guide Technique; Mémoire No. 96; Ministère de l’Énergie et des Ressources du Québec, Direction de la Recherche Forestière: Québec, QC, Canada, 1990; p. 96.
  23. Shigo, A.L. Wounded forests, starving trees. J. For. 1985, 83, 668–673. [Google Scholar] [CrossRef]
  24. Monger, R. Classification des Tiges D’essences Feuillues: Normes Techniques; Ministère des Ressources Naturelles du Québec, Québec: Québec, QC, Canada, 1991.
  25. Boulet, B.; Landry, G. La Carie Des Arbres: Fondements, Diagnostic Et Application, 3rd ed.; Les Publications du Québec: Québec, QC, Canada, 2015; p. 347.
  26. Cox, D.R.; Oakes, D. Analysis of survival data, Chapman and Hall, London-New York, 201 S. Biom. J. 1984, 29, 114. [Google Scholar]
  27. Fick, S.E.; Hijmans, R.J. WorldClim 2: New 1-km spatial resolution climate surfaces for global land areas. Int. J. Climatol. 2017, 37, 4302–4315. [Google Scholar] [CrossRef]
  28. Guillemette, F.; Gauthier, M.M.; Lambert, M.C.; Bédard, S. Effets Réels Décennaux des Coupes de Jardinage Pratiquées de 1995 à 1999 Dans un Contexte Opérationnel; Mémoire de recherche forestière No 168; Ministère des Ressources Naturelles, Direction de la Recherche Forestière: Québec, QC, Canada, 2013; p. 36.
  29. R Development Core Team. R: A Language and Environment for Statistical Computing; R Foundation for Statistical Computing: Vienna, Austria, 2022. [Google Scholar]
  30. Therneau, T. A Package for Survival Analysis in R, R Package Version 3.5-0; R Foundation: Vienna, Austria, 2023. [Google Scholar]
  31. Kuitunen, I.; Ponkilainen, V.T.; Uimonen, M.M.; Eskelinen, A.; Reito, A. Testing the proportional hazards assumption in cox regression and dealing with possible non-proportionality in total joint arthroplasty research: Methodological perspectives and review. BMC Musculoskelet. Disord. 2021, 22, 489. [Google Scholar] [CrossRef] [PubMed]
  32. Caspersen, J.P.; Vanderwel, M.C.; Cole, W.G.; Purves, D.W. How Stand Productivity Results from Size- and Competition-Dependent Growth and Mortality. PLoS ONE 2011, 6, e28660. [Google Scholar] [CrossRef] [PubMed]
  33. Castle, M.; Weiskittel, A.; Wagner, R.; Ducey, M.; Frank, J.; Pelletier, G. Variation in stem form and risk of four commercially important hardwood species in the Acadian Forest: Implications for potential sawlog volume and tree classification systems. Can. J. For. Res. 2017, 47, 1457–1467. [Google Scholar] [CrossRef]
  34. Anderson, H.W.; McLean, M. Value Increase Potential of Various Grades of Sugar Maple Trees; Ontario Department Lands and Forests, Research Branch: Dorset, ON, Canada, 1970.
  35. Guillemette, F. Diamètres à Maturité Financière Pour L’érable à Sucre et le Bouleau Jaune au Québec; Note de recherche forestière No 145; Mnistère des Forêts, de la Faune et des Parcs, Direction de la Recherche Forestière: Québec, QC, Canada, 2016; p. 14.
  36. Kenefic, L.S.; Sendak, P.E.; Brissette, J.C. Comparison of fixed diameter-limit and selection cutting in northern conifers. North. J. Appl. For. 2005, 22, 77–84. [Google Scholar] [CrossRef] [Green Version]
  37. Martin, A.R.; Caspersen, J.P.; Fuller, M.M.; Jones, T.A.; Thomas, S.C. Temporal dynamics and causes of postharvest mortality in a selection-managed tolerant hardwood forest. For. Ecol. Manag. 2014, 314, 183–192. [Google Scholar] [CrossRef]
  38. Moreau, G.; Achim, A.; Pothier, D. Relevance of stem and crown defects to estimate tree vigour in northern hardwood forests. For. Int. J. For. Res. 2020, 93, 630–640. [Google Scholar] [CrossRef]
  39. Pothier, D.; Fortin, M.; Auty, D.; Delisle-Boulianne, S.; Gagné, L.-V.; Achim, A. Improving tree selection for partial cutting through joint probability modelling of tree vigor and quality. Can. J. For. Res. 2013, 43, 288–298. [Google Scholar] [CrossRef]
  40. Hartmann, H.; Beaudet, M.; Mazerolle, M.J.; Messier, C. Sugar maple (Acer saccharum Marsh.) growth is influenced by close conspecifics and skid trail proximity following selection harvest. For. Ecol. Manag. 2009, 258, 823–831. [Google Scholar] [CrossRef] [Green Version]
  41. Moreau, G.; Achim, A.; Pothier, D. Growth and survival dynamics of partially cut northern hardwood stands as affected by precut competition and spatial distribution of residual trees. For. Int. J. For. Res. 2020, 93, 96–106. [Google Scholar] [CrossRef]
  42. Chagnon, C.; Moreau, G.; Bombardier-Cauffopé, C.; Barrette, J.; Havreljuk, F.; Achim, A. Broad-scale wood degradation dynamics in the face of climate change: A meta-analysis. GCB Bioenergy 2022, 14, 941–958. [Google Scholar] [CrossRef]
  43. Laidler, K.J.; Chen, H.; Ling, M.; Hencz, L.; Ling, H.Y.; Li, G.; Lin, Z.; Liu, G.; Zhang, S.; Abyazisani, M.; et al. The development of the Arrhenius equation. J. Chem. Educ. 1984, 61, 494. [Google Scholar] [CrossRef]
  44. Jomura, M.; Kominami, Y.; Dannoura, M.; Kanazawa, Y. Spatial variation in respiration from coarse woody debris in a temperate secondary broad-leaved forest in Japan. For. Ecol. Manag. 2008, 255, 149–155. [Google Scholar] [CrossRef]
  45. Liu, W.; Schaefer, D.; Qiao, L.; Liu, X. What controls the variability of wood-decay rates? For. Ecol. Manag. 2013, 310, 623–631. [Google Scholar] [CrossRef]
  46. Zheng, Z.; Zhang, S.; Baskin, C.; Baskin, J.; Schaefer, D.; Yang, X.; Yang, L. Hollows in living trees develop slowly but considerably influence the estimate of forest biomass. Funct. Ecol. 2015, 30, 830–838. [Google Scholar] [CrossRef]
  47. Guillemette, F.; Bédard, S. Potential for Sugar Maple to Provide High-Quality Sawlog Trees at the Northern Edge of Its Range. For. Sci. 2019, 65, 411–419. [Google Scholar] [CrossRef]
  48. Frank, J.; E Castle, M.; A Westfall, J.; Weiskittel, A.R.; Macfarlane, D.W.; Baral, S.K.; Radtke, P.J.; Pelletier, G. Variation in occurrence and extent of internal stem decay in standing trees across the eastern US and Canada: Evaluation of alternative modelling approaches and influential factors. For. Int. J. For. Res. 2018, 91, 382–399. [Google Scholar] [CrossRef]
  49. Martin, M.; Paillet, Y.; Larrieu, L.; Kern, C.C.; Raymond, P.; Drapeau, P.; Fenton, N.J. Tree-Related Microhabitats Are Promising Yet Underused Tools for Biodiversity and Nature Conservation: A Systematic Review for International Perspectives. Front. For. Glob. Chang. 2022, 5, 136. [Google Scholar] [CrossRef]
  50. Holloway, G.L.; Caspersen, J.P.; Vanderwel, M.C.; Naylor, B.J. Cavity tree occurrence in hardwood forests of central Ontario. For. Ecol. Manag. 2007, 239, 191–199. [Google Scholar] [CrossRef]
  51. Martin, M.; Raymond, P. Assessing tree-related microhabitat retention according to a harvest gradient using tree-defect surveys as proxies in Eastern Canadian mixedwood forests. For. Chron. 2019, 95, 157–170. [Google Scholar]
Figure 1. Location of study sites in northern hardwood forests of Quebec. Red crosses represent experimental study sites in which square PSPs of 0.5 ha were established between 1983 and 1999.
Forests 14 00280 g001
Figure 2. Probability of developing cankers and fungi for sugar maple (left panels) and yellow birch (right panels), as affected by initial DBH (A,B), crown dieback (C,D) and management (E,F). Confidence intervals of the predictions (shaded area) were calculated with a = 0.05.
Forests 14 00280 g002
Figure 3. Probability of developing decaying defects for sugar maple (left panels) and yellow birch (right panels), as affected by initial DBH (A,B), crown dieback (C,D) and mean annual temperature (E,F). Confidence intervals of the predictions (shaded area) were calculated with a = 0.05.
Forests 14 00280 g003
Figure 4. Probability of developing any defect related to quality for sugar maple (left panels) and yellow birch (right panels), as affected by initial DBH (A,B), crown dieback (C,D) and mean annual temperature (E,F). Confidence intervals of the predictions (shaded area) were calculated with a = 0.05.
Forests 14 00280 g004
Figure 5. Probability of losing value through mortality (red dot), or declining in quality (purple dash), and the combined risk thereof (green line) for vigorous (crown dieback of 0%, left panels) and non-vigorous (crown dieback of 45%, right panels) sugar maple trees growing in managed stands, as affected by initial DBH: 20 cm (A,B), 40 cm (C,D) and 60 cm (E,F).
Forests 14 00280 g005
Figure 6. Probability of losing value through mortality (red dot) or declining in quality (purple dash), and the combined risk thereof (green line) for vigorous (crown dieback of 0%, left panels) and non-vigorous (crown dieback of 45%, right panels) yellow birch trees growing in managed stands, as affected by initial DBH: 20 cm (A,B), 40 cm (C,D) and 60 cm (E,F).
Forests 14 00280 g006
Table 1. Number of trees that were sampled by DBH class and species.
DBH Class (cm)Sugar MapleYellow Birch
9.1–19.04412350
19.1–29.02764325
29.1–39.01637273
39.1–49.0860168
≥49.134884
Total10,0211200
Table 2. Statistics of the three general Cox proportional hazard models on the probability of developing defects related to tree quality, including the estimates, standard errors (SE), chi-squared tests (Chisq), and p-values (p). CDBK = crown dieback.
Probability of Developing Cankers and Fungi
Explanatory Variable EstimateSEChisqp
DBH0.0460.00577.46<0.001
Species (sugar maple)0.9600.22019.14<0.001
CDBK0.0070.0032.920.045
Treatment (managed)−0.1900.0805.560.018
Precipitation0.0010.0010.150.700
Temperature 0.0080.0011.320.250
Initial plot basal area0.0010.0050.050.830
DBH:Species−0.0220.00514.36<0.001
Frailty (plot variance) 159.56<0.001
Probability of developing decaying defects
Explanatory variable EstimateSEChisqp
DBH0.0160.00196.53<0.001
Species (sugar maple)0.2330.0808.46<0.001
CDBK0.0100.00213.49<0.001
Treatment (managed)0.1870.0900.080.780
Precipitation−0.0010.0010.980.320
Temperature 0.0130.0064.920.026
Initial plot basal area−0.0010.0040.060.810
Frailty (plot variance) 191.69<0.001
Probability of developing any defect related to tree quality
Explanatory variable EstimateSEChisqp
DBH0.0370.00559.61<0.001
Species (sugar maple)0.6800.17418.89<0.001
CDBK0.0100.00219.28<0.001
Treatment (managed)−0.0070.0850.010.900
Precipitation0.0010.0010.000.980
Temperature 0.0100.0063.610.056
Initial plot basal area0.0010.0040.010.690
DBH:Species0.0170.00611.66<0.001
Frailty (plot variance) 235.20<0.001
Disclaimer/Publisher’s Note: The statements, opinions and data contained in all publications are solely those of the individual author(s) and contributor(s) and not of MDPI and/or the editor(s). MDPI and/or the editor(s) disclaim responsibility for any injury to people or property resulting from any ideas, methods, instructions or products referred to in the content.

