Article

How to Improve the Supply of Quasi-Public Forest Infrastructure When Government Is the Leader: Evidence from Experimental Economics

1
State Key Joint Laboratory of Environment Simulation and Pollution Control, School of Environment, Beijing Normal University, Beijing 100875, China
2
School of Economics and Management, Beijing Forestry University, Beijing 100083, China
*
Author to whom correspondence should be addressed.
Forests 2023, 14(2), 275; https://doi.org/10.3390/f14020275
Submission received: 14 December 2022 / Revised: 19 January 2023 / Accepted: 24 January 2023 / Published: 31 January 2023
(This article belongs to the Section Forest Economics, Policy, and Social Science)

Abstract

:
Forest infrastructure is an important material basis for healthy forests. According to public goods theory, most forest infrastructures are quasi-public goods, with demand exceeding supply, more than one supplier, unclear responsibilities between suppliers, and a resultant free-rider problem. This study explored ways to improve the supply of goods for forest infrastructure when the government—as leader—cooperates with foresters—as followers. Experimental economics were used to explain the factors that influence the behaviour of forest infrastructure quasi-public goods suppliers; to design twelve policy scenarios by communication, information feedback, rewards and punishments, and leadership styles; and to simulate the changes in foresters’ supply behaviour in different scenarios to analyse which policies were conducive to improving the supply of quasi-public forest infrastructures. The results were as follows: communication, rewards and punishments, information feedback, and leadership style reduce foresters’ free-riding behaviour; communication, rewards, and punishment increase supply, and, furthermore, the supply of the scenario with rewards and punishment is 1.792–4.616 times that of the situation without rewards and punishment; without the constraints of rewards and punishment, only feedback information reduces the supply; and the p values of the Mann–Whitney U test for the influence of leadership style on the supply level of forest infrastructure were all greater than 0.05, which indicates that no significant difference exists between leading by words and leading by example in supply improvement. When foresters are able to communicate with each other, reward and punishment exist, and information feedback is provided; hence, the supply of foresters is higher regardless of whether the government leads by words or by example. This study provided policy suggestions on how to improve the supply of quasi-public goods for forestry infrastructure, namely, that the organizer should organize foresters to fully negotiate before raising funds for infrastructure construction; publish, when appropriate, the supply and income of foresters; and formulate appropriate reward and punishment measures.

1. Introduction

Forest infrastructure refers to the public systems, facilities, and services that facilitate the efficient functioning of forests to meet the economic, environmental, production, and social objectives of a country or region, such as roads, irrigation facilities, bicycle paths, etc. [1]. Forest infrastructures can be divided into categories of private, club, crowded, and pure forest infrastructures, according to the criteria of rivalry and excludability. Among these, club forest infrastructure and crowded forest infrastructure are collectively referred to as quasi-public forest infrastructure.
Scholars, practitioners, and policy makers have increasingly focused on the growth and maintenance of healthy forests—and thus on the supply of forest infrastructure as an important material basis for healthy forests—as the majority of countries worldwide have committed to the goal of carbon neutrality [2,3,4,5]. Improvement of the supply of forest infrastructure is necessary to achieve global carbon neutrality objectives.
However, since most forest infrastructures are considered quasi-public goods, with more than one supplier and unclear responsibilities between suppliers, the supply of forest infrastructure is far from meeting actual demand. Stakeholders have focused on the urgent need to improve the supply of quasi-public forest infrastructure [6,7,8,9,10,11,12,13,14,15,16,17,18]. Among them, Gandaseca et al. [7] suggested that forestry infrastructure should be improved to promote the healthy development of forest tourism. Cheng [16] proposed to improve the supply of forestry infrastructure to promote high-level forest leisure tourism when studying the forest leisure tourism industry. Han [17] studied the factors affecting the competitiveness of forest tourism in Heilongjiang Province and pointed out that improving the supply of forestry infrastructure is a feasible strategy to enhance the competitiveness of scenic spots. Some scholars also believe that the road facilities in forest areas need to be improved; subsequently, the construction of road facilities has been discussed [19,20,21,22,23]. For example, Enache et al. [19] discussed how extraction distance can be used to assess forest road options in a more efficient and effective manner. Hayati et al. [20] considered skidding costs, road construction and maintenance costs, and harvesting volume to evaluate the quantity and quality of existing forest road networks. Laschi et al. [21] developed a decision support system to assist managers in forest road network planning. Parsakhoo and Mostafa [22] evaluated the shortest path in the city of Gorgan’s public road network in Iran. In general, ways to improve the supply of forestry infrastructure need to be studied.
However, most of the extant studies lack systematic research on how to accomplish the improvement of quasi-public forest infrastructures. Some studies pointed out that the supply of forestry infrastructure needs to be improved in the discussion section of the paper [6,7,8,9,10,11,12,13,14,15,16,17,18]. Zhang et al. [24] used game theory to analyse the private, voluntary behaviour supply mechanisms for forest infrastructure from the perspective of quasi-public goods; however, they did not consider the role of governmental leadership, although other studies have demonstrated that the leader has a significant impact on supply behaviour [25,26,27,28,29]. Many scholars use the method of experimental economics to study the supply mechanism of public goods. For example, Weimann [30] used experimental economics to study the influence of information on individual behaviour. Meidinger and Villeval [31] used experimental economics to study the influence of information feedback on supply and concluded that whether there is information symmetry or information asymmetry, leading by example can play a role. Croson [32] used experimental economics to study the impact of individual feedback contributions and total feedback group contributions on the supply of public goods. Bigoni and Suetens [33] used game theory and experimental economics to study the impact of additional individual supply or income feedback on supply in a repeated public welfare game. Irlenbusch and Ter Meer [34] used experimental economics to prove that recipient credulity can be understood through the false consensus effect—that is, the possibility that when individuals believe information about others’ behaviours, it can be explained by their own behavioural tendencies in comparable situations. These studies use different variables to design experimental scenarios to simulate the supply process of public goods and provide scientific policy suggestions for the supply of public goods. However, most of the subjects in these studies are college students, not stakeholders of public goods, which may lead to differences between the research results and reality. Moreover, some experimental scenarios do not consider the reward and punishment mechanism, the role of leaders, or the role of information feedback, when in fact the actual situation of forestry infrastructure supply may need to include such variables, which means that the experimental scenarios designed in the existing research may not be fully applicable to the supply process of quasi-public goods in forestry infrastructure. In general, there is a lack of systematic research on how to improve the supply of quasi-public goods in forestry infrastructure.
In this study, foresters were selected as the subjects, and variables were selected to design experimental scenarios based on the field survey and the actual supply process of forestry infrastructure. Ways to improve the supply of goods for forest infrastructure when the government—as a leader—cooperates with foresters were discussed. Experimental economics was used to explain the reasoning and factors that influence the behaviour of forest infrastructure quasi-public goods suppliers.
The remainder of this paper is organised as follows. Section 2 introduces the experimental design and data collection process. Section 3 compares the supply level in different policy scenarios and analyses whether the variables of communication, information feedback, and leadership styles will improve supply when the government is a leader, and which factors affect the behaviour of foresters (followers) in each policy scenario. Section 4 presents the conclusions and policy recommendations.

2. Materials and Methods

In this study, an experimental economics approach was used to determine the validity and scope of this work, and scientific experiments were used to test which choices individuals made in specific circumstances. The following sections describe the calculation rules of income, specific experimental design, data sources, and statistical characteristics of the experimental participants that were used.

2.1. Game Theory

When building forestry infrastructure, the respective information held by the government and forester is asymmetric. The static game of incomplete information was used to analyse the decision-making behaviour between foresters and the government.
Foresters and the government are the main suppliers of forestry infrastructure. For foresters and governments, there are two strategies, “supply” and “no supply”, each of which has certain costs and benefits. Assume that the cost of forestry infrastructure is 2C, the benefits of government from the supply of forestry infrastructure is R1, and the gain of farmers from the supply of forestry infrastructure is R2. Since the government prefers to supply forestry infrastructure of quasi-public goods, it is assumed that R1 is higher than R2. For government, the benefits of building such forestry infrastructure outweigh the cost, while for the foresters, the benefits of building such forestry infrastructure do not outweigh the cost, i.e., R2-2C < 0; R1-2C > 0. The payment matrix is shown in Table 1.
It can be concluded from Table 1 that the Nash equilibrium of the game is (supply, no supply), that is: the government will always choose supply, while foresters will always want to take a ride from the government and so choose not to supply. Therefore, it is necessary to study how to reduce the free-rider behaviours of foresters to improve the supply of foresters.

2.2. Experimental Design and Statistical Test Method

To carry out the experimental economics approach, firstly, game theory scenarios were designed; then, the z-Tree software package (Zurich Toolbox for Readymade Economic Experiments) [35] was used to build virtual scenarios to test participants’ behaviour and choices; finally, participants made decisions on the software. Thus, the obtained dynamic and real-time data were obtained to study participants’ decision-making process in a scientific framework.
Experimental economics studies the supply of public goods, mainly through the calculation of income. In this study, the calculation rule for income was based on previous studies [36]. The specific calculation rules were as follows: n participants were selected and divided into m groups, and each group played 10 rounds of a game. At the beginning of each round of the game, each participant had an initial number of chips e, and they could choose to keep the chips in their private account or invest them in a public account; however, the remaining chips could not be carried to the next round. If the chips left by member i in the private account in round t was xit and the investment in a public account was git, where 0 ≤ xit ≤ e, 0 ≤ git ≤ e, xit + git = e, then the total investment in a public account in round t was Gt = ∑git. Suppose the rate of return of the public account was β, where 0 ≤ β < 1. Then, the income of п in the t round was ‘п = xit + βGt = e-git + βgit’. Using this calculation rule, it can be shown that the change in income was solely caused by the change in income of the public account. The income of public accounts depended on the total supply of public accounts for each participant—that is, the income of participants depended on their supply of quasi-public goods. Therefore, participants could adjust their investment behaviour by observing changes in their income. A detailed calculation rule for income is shown in Figure 1.
Based on existing studies [36] and real-world situations, four variables were selected: different leadership styles; whether there was information feedback; whether there were rewards and punishments; and whether foresters could communicate. Twelve experimental scenarios were designed (Table 2). In the experiment with communication, foresters (followers) could communicate with each other before each experiment to discuss their contribution (i.e., investment or supply) amount. In the experiment with information feedback, each forester could obtain not only their own investment (supply) and income but also that of other foresters. In the experiment without feedback, the foresters could only obtain their own investment (supply) and income at the end of each experiment. Rewards and punishments existed only in the experiments with feedback. In experiments with rewards and punishments, foresters could decide whether to reward or punish other members—that is, after the feedback, everyone in the group was given an additional 10 chips before the next round, so that each member had the opportunity to reward or punish others (but not themselves). Each participant could use three chips of reward or punishment for the same goal.
In this study, two types of leadership were considered: leading by example and leading by words [25]. Leading by example refers to the condition in which the government first supplies and then publicises the government’s supply to foresters and finally determines the supply according to the supply of the government. Leading by words refers to the condition in which the government promises foresters how much they will supply before the experiment, and both the government and foresters supply at the same time. Four participants were recruited for each experiment, one of whom was chosen as the leader and the other three as followers. The experiment was implemented using z-Tree and z-Leaf software packages (i.e., the participants’ program version of z-Tree).
Before the experiment, the instructions were read out to the subjects, and the subjects were organized to do test questions to ensure that they truly understood the experimental rules. Experiment 3 can be used as an example; see Appendix A and Appendix B for its experimental instructions and test questions; and see Supplementary Materials for other experimental descriptions.
Two methods, Mann–Whitney U Test and Multiple Regression Analysis, were used to analyse the data from the experiments. The Mann–Whitney U Test is mainly used to analyse whether there are differences between two groups of data. In this study, it was used to analyse the effect of communication, information feedback, rewards and punishment, and leadership style on supply when the government is a leader. When the p value was less than 0.05, it indicated that the means of the two independent samples were significantly different. Multiple linear regression was used to analyse the influencing factors of the foresters’ next round of decisions. When the p value was less than 0.05, it indicated that this factor had a significant impact on the supply behaviour of the foresters.

2.3. Data Source and Selection of Subjects

The data were collected based on z-Tree and z-Leaf. First, different game theory scenarios were built using z-Tree software. Next, the participants were organised to conduct online operations in different scenarios. Then, the supply data of the participants were collected in each scenario.
The selection of subjects was mainly based on three criteria: first, the characteristics of subjects were as similar as possible; second, the subjects had certain learning abilities; third, the subjects were skilled in computer operation. Typical forest types such as forest parks, ecological forests, and orchards were selected for field investigation (Table 3). In these field investigation areas, foresters were recruited as subjects according to the above three criteria.
Table 4 shows the statistics of the personal characteristics of the subjects, including gender, age, ethnicity, part-time jobs, loans, and other variables. See Appendix C for questionnaires.
This chapter mainly introduces the theory, method, experimental design, and data sources. Next, the collected data will be analysed based on these methods to discuss the situation in which the supply of foresters is high when the government is the leader.

3. Results and Discussion

To determine which scenario was most conducive to improving the supply of quasi-public forest infrastructure, the mean value, standard deviation, and other statistical characteristics of the supply in the twelve scenarios were compared. To analyse the reasons for the differences between the supply in different scenarios, the scenarios were firstly grouped and then the effects of the four variables on the supply—namely, communication, information feedback, reward and punishment mechanisms, and different leadership styles—were studied through the principle of a single variable. Next, for each experimental scenario, the factors that affected the supply decisions of the foresters in the next round were analysed.

3.1. Comparison of Supply Levels in Different Scenarios

The mean, standard deviation, minimum, median, and maximum values (Figure 2) of the supply were statistically analysed in the twelve groups. Among the twelve experimental scenarios, Experiments 9 and 12 had a higher supply, higher mean, smaller standard deviation, and higher median, which shows that these two scenarios were conducive to improving the supply. The mean value of the supply in Experiment 6 was the lowest, with a maximum value of only 4, which indicates that Experiment 6 was the most unfavourable for the supply of forest infrastructure.

3.2. The Effects of Communication on Improving Supply When Government Is a Leader

To study whether communication would improve the supply of forest infrastructure when the government was the leader, the twelve scenarios were divided into six groups with identical variables, except for different communication. The six groups were as follows: Experiments 1 and 7; Experiments 2 and 8; Experiments 3 and 9; Experiments 4 and 10; Experiments 5 and 11; and Experiments 6 and 12. First, a comparative qualitative analysis was conducted between the two experiments, as shown in Figure 3. We then conducted a Mann–Whitney U test for quantitative analysis (Table 5). If the p value of the Mann–Whitney U test was less than 0.05, then it indicated that there was a significant difference between the two scenarios, that is, communication had significant effects on supply.
By analysing Table 5 and Figure 3, we found that in twelve scenarios the supply with communication was higher than that without communication, but only Experiments 3 and 9 passed the Mann–Whitney U test. This shows that communication had a significant effect on supply only when there was leading by example, information feedback, and a reward and punishment mechanism, while in other scenarios, communication could improve the supply, but the effect was not significant.
To analyse whether communication could reduce the free-riding behaviour of foresters, the changes in the standard deviation of the supply of foresters in the same round were calculated (Figure 4). If the standard deviation between the supply of foresters decreased, then it indicated that free-riding behaviour could be reduced.
As shown in Figure 4, the standard deviation tended to zero whether or not there was communication. This indicates that communication could prevent free-riding behaviour.

3.3. The Effects of Information Feedback on Improving Supply When Government Is a Leader

To study whether information feedback affected the supply of foresters when the government was the leader, a qualitative comparison between Experiments 1 and 2, Experiments 4 and 5, Experiments 7 and 8, and Experiments 10 and 11 were first made in this study, as shown in Figure 5. The Mann–Whitney U test was then conducted for a quantitative comparison, as shown in Table 6. Finally, the change trend of the standard deviation of supply among foresters was used to analyse free-riding behaviour. If the standard deviation trended downward, then it showed that free-riding behaviour could be reduced.
Figure 5 shows that the supply without information feedback (Experiment 1, Experiment 4, Experiment 7, Experiment 10) was higher than the supply with information feedback (Experiment 2, Experiment 5, Experiment 8, Experiment 11), indicating that when government was a leader, information feedback could not improve the supply. Figure 6 shows the change trend of standard deviation. As shown in Figure 6, the standard deviation tended to zero, indicating that information feedback could prevent free riding.

3.4. The Effects of Rewards and Punishments on Improving Supply When Government Is a Leader

To analyse the effect of rewards and punishments on supply, Experiments 2, 3, 8, 9, 5, 6, 11, and 12 were compared based on the principle of a single variable. First, the change trend of supply was compared, as shown in Figure 7 and Table 7. Next, the change trend of the standard deviation, the number of rewards and punishments received by foresters from others, and the number of rewards and punishments implemented by foresters to others was compared. As shown in Figure 7 and Table 7, the supply with rewards and punishments was higher than that without rewards and punishments, and the p value of the Mann–Whitney U test was significant, indicating that rewards and punishments could significantly improve supply.
As shown in Figure 8 and Figure 9, the standard deviation tended to zero, and both the number of rewards and punishments from or to others decreased. This indicates that rewards and punishments could avoid free riding.

3.5. The Effects of Leadership Styles on Improving Supply When Government Is a Leader

To analyse the effect of leadership styles on supply, the experimental scenarios were classified according to the single-variable principle that all variables are the same except for different leadership styles, which were divided into Experiments 1 and 4, Experiments 2 and 5, Experiments 3 and 6, Experiments 7 and 10, Experiments 8 and 11, and Experiments 9 and 12. Next, the supply level was qualitatively compared according to the classified scenarios, and the Mann–Whitney U test was used for quantitative comparisons (Table 8). Finally, the change trend of the standard deviation of the supply level between foresters was calculated to analyse the effects of leadership on free riding.
As shown in Figure 10, with the exception that the supply of Experiment 6 was higher than that of Experiment 3, there was little difference between the supply in the other groups, indicating that leading by word can improve the supply only when information feedback and rewards and punishments coexist.
The p values of the Mann-Whitney U test for the influence of leadership style on the supply level of forest infrastructure were all greater than 0.05, as shown in Table 7, indicating that the influence of leadership style on the supply level was not significant.
As shown in Figure 11, the standard deviation between them tended to zero, indicating that free-riding behaviour could be reduced with both leadership styles.

3.6. Influential Factors of Next Round Decision-Making Behavior in Different Scenarios

In order to study which factors were responsible for the supply difference, the factors that affected the supply of the next round in each experimental scenario were studied. The results are presented in Table 9.
This study is committed to identifying the influencing factors that affect the next supply decision of foresters, focusing on the analysis of the influence direction of independent variables on the dependent variables. Considering that endogenous problems will not change the influence direction, this study does not carry out the research on endogenous problems of variables.
The main factors influencing the decision-making of foresters in the next round were planned supply of followers, last round earnings, supply of leaders, rewards of followers in the last round, punishment of followers in the last round, earnings of followers after rewards and punishments in the last round, and supply committed by leaders.
In Experiment 1, supply of leaders negatively affected the next round of supply of foresters. In Experiment 2, last round earnings and supply of leaders negatively affected the next round of supply. In Experiment 3, last round earnings and rewards of followers in the last round positively affected the next round of supply; and supply of leaders, punishment of followers in the last round, and earnings of followers after rewards and punishments in the last round negatively affected the next round of supply. In Experiment 4, supply committed by leaders positively affected the next round of supply. In Experiment 5, last round earnings and supply committed by leaders negatively affected the next round of supply. In Experiment 6, punishment of followers in the last round, earnings of followers after rewards and punishments in the last round, and supply committed by leaders positively affected the next round of supply; and earnings of followers after rewards and punishments in the last round and rewards of followers in the last round negatively affected the next round of supply. In Experiment 7, the factors that affected the next round of supply were planned supply of followers and supply of leaders, both of which positively affected the next round of supply. In Experiment 8, planned supply of followers and supply of leaders positively affected the next round of supply. In Experiment 9, planned supply of followers, supply of leaders, punishment of followers in the last round, and earnings of followers after rewards and punishments in the last round positively affected the next round of supply; and last round earnings and rewards of followers in the last round negatively affected the next round of supply. In Experiment 10, planned supply of followers and supply committed by leaders positively affected the next round of supply. In Experiment 11, earnings of followers after rewards and punishments in the last round and supply committed by leaders negatively affected the next round of supply. In Experiment 12, last round earnings positively affected the next round of supply.
Because the supply levels of Experiments 9 and 12 were comparatively higher than those of the other experiments, the two experiments were analysed separately to determine the factors that affected the next round of decision-making of foresters in these two scenarios. In Experiment 9, planned supply of followers, supply of leaders, punishment of followers in the last round, and earnings of followers after rewards and punishments in the last round positively affected the next round of decision-making. In Experiment 12, last round earnings positively affected the next round of decision-making, planned supply of followers was related to communication, and punishment of followers in the last round and earnings of followers after rewards and punishments in the last round were related to rewards and punishments, which further confirmed that communication and rewards and punishments could improve supply.
Compared with the existing research, which often selected college students as subjects, the experimental subjects selected in this study were foresters, who are the stakeholders. Therefore, the results obtained are not completely the same as the existing research. In terms of leadership style, the existing research believes that the supply of leading by example is higher than that of leading by words [36]. However, the comparative study of the two leadership styles in the study shows that there is little difference in their impact on the supply. In terms of information feedback, it is found in this study that when there is no reward and punishment mechanism to restrict the free-rider behaviour of foresters, information feedback will reduce the supply, which is different from Zhou’s research results [36]. This is mainly because the role of leaders was considered in this study but not in Zhou’s research [36]. In terms of communication and the mechanism of reward and punishment, the result of this study is that both communication and the mechanism of reward and punishment can improve supply, which is consistent with the existing research results [24].

4. Conclusions and Policy Suggestion

This study mainly discusses a policy scenario in which the supply of foresters (followers) is higher when the government is the leader. The research results were as follows. First, among the twelve experimental scenarios, Experiment 9 (EL × F × P × C) and Experiment 12 (CL × F × P × C) had higher supply levels. Second, when the government acts as a leader, communication can improve supply and reduce free-riding behaviour. Third, without reward and punishment constraints, only feedback information reduces the supply; however, feedback information can reduce free-riding behaviour. Fourth, rewards and punishments can significantly improve supply, and free-riding behaviour can be reduced. Fifth, there is little difference between the two leadership styles—that is, leading by example and leading by words—in terms of supply.
Some policy suggestions were provided to improve the supply of quasi-public forest infrastructure. First, in the supply process, if scenarios were created in which foresters could communicate with each other, then supply could also be effectively increased. For example, it is suggested that before the construction of forestry infrastructure, the organizers should gather the foresters together to let the foresters discuss first, before they decide how much to invest in the construction of facilities. Second, rewards and punishments could reduce free-riding behaviour and increase supply. Therefore, it is necessary to establish an appropriate reward and punishment mechanism for the supply process of quasi-public forest infrastructure. For example, foresters who have hitchhiked could be directly punished by fines, while foresters who have not hitchhiked could be rewarded with living materials. Finally, the policy scenario may be set out as follows: farmers can communicate with each other; in addition, there should be reward and punishment; and feedback information should be provided, so that the supply of farmers is high. Therefore, when building forestry infrastructure, the organizer should organize foresters to fully communicate with each other before raising funds. The process of raising funds should be open and transparent. When appropriate, the supply and income of foresters should be published. In addition, a suitable reward and punishment mechanism to curb free-riding behaviour should be set up. When the organizers can take these measures at the same time, the willingness of foresters to supply is high, and the forestry infrastructure is easy to build.
There are some limitations to this study. For example, the effect of the different ways of information feedback on the supply of forestry infrastructure was not discussed in this study and could therefore be explored in future research. In addition, when designing the personal characteristics questionnaire of foresters, some variables were not considered, such as education level, which may mean the personal characteristics statistics were not comprehensive enough and therefore need to be supplemented in future research.

Supplementary Materials

The following supporting information can be downloaded at: https://www.mdpi.com/article/10.3390/f14020275/s1. Experimental instructions and z-Tree software packages.

Author Contributions

Conceptualization, writing—original draft preparation, L.Z.; methodology, C.W.; writing—review and editing, Y.H. All authors have read and agreed to the published version of the manuscript.

Funding

This work was funded by the National Natural Science Foundation of China (52170175), National Natural Science Foundation of China (72161147003), and Major Projects of High-Resolution Earth Observation Systems of National Science and Technology under Grant 05-Y30B01-9001-19/20-4.

Informed Consent Statement

Informed consent was obtained from all subjects involved in the study.

Data Availability Statement

The data of this study were collected using the z-Tree software packages.

Conflicts of Interest

The authors declare that there are no conflict of interest.

Appendix A. Experimental Instruction 3

Welcome to this experiment and thank you for your cooperation.
The four of you are four foresters. Now, forestry infrastructure (such as a monitoring station) needs to be built in order to protect the healthy growth of trees, which is a quasi-public good. Now, we need to know how much each of you is willing to pay to build this kind of quasi-public forestry infrastructure.
You are in the same forest area. Three of you are foresters (followers) and one is a member of the Forestry Bureau (leader). Now, forestry infrastructure (such as a monitoring station) needs to be built in order to protect the healthy growth of trees, which is a quasi-public good. Now, we need to know how much each of you is willing to pay to build this kind of quasi-public forestry infrastructure. During the experiment, the leader will give priority to donation (supply) and then display their donation (supply). After that, the followers will donate (supply).
At present, there is only one public account, which is for the funds you are willing to give for the construction of forestry infrastructure. After each round of the experiment, each person will have fifty chips. You can choose to invest zero to fifty chips in the public account. After everyone decides the investment amount, each person will get some benefits from the public account, regardless of whether they invested or not, and benefits = (0.4 × Total amount of public account); 0.4 is the rate of return.
In addition, each of you has a private account for depositing your remaining funds, which are used to meet your daily needs. The experiment income of each of you in each round = the amount of private account funds + (0.4 × Total funds in public accounts). That is, if you choose to invest X chips, and the total investment amount of the other three people is Y, then your experimental income is (50 − X) + 0.4 × (X + Y), (50 − X) are the remaining funds in your private account, and 0.4 × (X + Y) is the return on investment you get from your public account.
After each round of the experiment, we will display your investment, your return for that round, and the investment and return of the other three members.
After information feedback, each of you will get ten extra chips before the next round of the experiment, and each of you will have the opportunity to reward or punish others in the previous round (note: you cannot punish or reward yourself). Each use of a chip will increase or decrease the income of the person being rewarded or punished by three chips. The maximum number of chips you can use for each target member is five, that is, you can increase or decrease the income of a target member by fifteen at most.
Finally, the final experiment income of each of you in each round = private account funds + (0.4 × Total amount of funds in public account) +(10 − amount of funds you use to reward or punish others) + 3 × (The total number of rewards you get in this round) − 3 × (The total number of penalties you get in this round).
At the end of each round of the experiment, conduct the next round of the experiment. You will initially get fifty chips from the experimenter for each round of the experiment. We will conduct ten rounds of the experiment. After ten rounds of the experiment, we will pay the respective cash amounts to each person in the experiment. The final cash income will be distributed privately, and only you know your own income. The cash income = 200 * (experimental income per person/(total experimental income of 4 persons)).
During the experiment, it is strictly prohibited to communicate with other participants, and your mobile phone must be set to vibrate. If you have any questions, please raise your hand and we will answer your questions separately. Your compliance with the rules is very important, otherwise we must exclude you from the experiment without paying any remuneration.

Appendix B. Tests

Before the experiment, you need to do three tests to ensure that you fully understand the rules of the experiment, so that you can make optimal decisions and maximize your benefits.
If the investment amount of the fourth person is equal to the average of the total investment amount of the other three people, then all four people will benefit. If the investment amount of the fourth person is less than the average of the total investment amount of the other three people, the fourth person will get the most income. If the investment amount of the fourth person is greater than the average of the total investment amount of the other three people, the fourth person will have the least income. As long as the investment amount of all four people is the same, the total income of each person will be more than fifty. If the investment amount of three people is the same, and the fourth person chooses not to invest, or invests less than the investment amount of the other three people, the fourth person will benefit the most. If the investment amount of three people is the same, and the investment amount of the fourth person is greater than that of the other three people, the fourth person will benefit the least.
1. If the other three people A, B, and C invest 10 chips, 10 chips, and 10 chips, respectively, in the public account, and you also invest 10 chips in the public account, with a return on investment in the public account of 0.4, the remaining funds in your private accounts will be (), (), (), and (), respectively; the incomes obtained from public accounts will be (), (), (), and () respectively; and the experimental benefits of your four will be (), (), (), and () respectively;
2. If the other three people A, B, and C invest 10 chips, 10 chips, and 10 chips, respectively, in the public account, and you invest 0 chips in the public account, with a return on investment in the public account of 0.4, the remaining funds in your private accounts will be (), (), () and () respectively; the incomes obtained from public accounts will be (), (), (), and (), respectively; and the experimental benefits of your four will be (), (), (), and (), respectively;
3. If you invested 0 chips in the public account and the other three people A, B, and C invested 5, 5, and 20 chips, respectively, in the public account, with a return on investment in the public account of 0.4, the remaining funds in your private accounts will be (), (), (), and (), respectively; the incomes obtained from public accounts will be (), (), (), and (), respectively; and the experimental benefits of your four will be (), (), (), and (), respectively.

Appendix C. Questionnaire

Hello!
In order to carry out the research on the “supply behavior of forestry infrastructure”, we invite you to fill in the following questionnaire. The results of the questionnaire are only for scientific research and will be kept strictly confidential. No personal information will be disclosed. Thank you for your participation!
Part I: Personal characteristics
Your date of birth:
Your gender? A. Female B. Male
Your ethnic group? A. Minority B. Han
Are you a communist? A. No B. Yes
Do you take out a loan? A. No B. Yes
Do you have any part-time job? A. No B. Yes
Have you participated in the experiment? A. No B. Yes
What is your average household income per month? A. RMB 0–3000; B. RMB 3001–6000; C.RMB 6001–9000; D. RMB 9000 or more
Part II: The attitude towards trust and risk
Will you believe the words and deeds of strangers?
5 = very trustworthy; 4 = trustworthy; 3 = fair; 2 = untrustworthy; 1 = quite untrustworthy
Do you think you can be trusted?
5 = very trustworthy; 4 = trustworthy; 3 = fair; 2 = untrustworthy; 1 = quite untrustworthy

References

  1. Zhang, L.Y.; Zhang, J.Y.; Zhang, L.X.; Wu, C.L.; Zhang, Y. Study on the Classification of Forestry Infrastructure from the Perspective of Supply Based on the Classical Quartering Method. Appl. Math. Nonlinear Sci. 2021, 6, 447–458. [Google Scholar] [CrossRef]
  2. Mallapaty, S. How China could be carbon neutral by mid-century. Nature 2020, 586, 482–483. [Google Scholar] [CrossRef]
  3. Huang, H.; Roland-Holst, D.W.; Wang, C.; Cai, W.J. China’s income gap and inequality under clean energy transformation: A CGE model assessment. J. Clean. Prod. 2020, 251, 119626. [Google Scholar] [CrossRef]
  4. Zhang, S.H.; An, K.X.; Li, J.; Weng, Y.W.; Zhang, S.H.; Wang, S.X.; Cai, W.J.; Wang, C.; Gong, P. Incorporating health co-benefits into technology pathways to achieve China’s 2060 carbon neutrality goal: A modelling study. Lancet Planet. Health 2021, 5, 808–817. [Google Scholar] [CrossRef] [PubMed]
  5. Sun, L.L.; Cui, H.J.; Ge, Q.S. Will China achieve its 2060 carbon neutral commitment from the provincial perspective. Adv. Clim. Chang. Res. 2022, 13, 169–178. [Google Scholar] [CrossRef]
  6. Schirmer, J.; Kanowski, P.; Race, D. Factors Affecting Adoption of Plantation Forestry on Farms: Implications for Farm Forestry Development in Australia. Aust. Forestry 2000, 63, 44–51. [Google Scholar] [CrossRef]
  7. Gandaseca, S.; Tetsuhiko, Y. Occupational Safety, Health and Living Conditions of Forestry Workers in Indonesia. J. For. Res. 2001, 6, 281–285. [Google Scholar] [CrossRef]
  8. Oliver, C.D. Sustainable forestry-What is it? How do we achieve it? J. Forest. 2003, 101, 8–14. [Google Scholar]
  9. Pinkard, E.; Battaglia, M.; Bruce, J.; Matthews, S.; Callister, A.N.; Hetherington, S.; Last, I.; Mathieson, S.; Mitchell, C.; Mohammed, C.; et al. A History of Forestry Management Responses to Climatic Variability and Their Current Relevance for Developing Climate Change Adaptation Strategies. Forestry 2015, 88, 155–171. [Google Scholar] [CrossRef] [Green Version]
  10. Sekot, W. Forest Accountancy Data Networks as a Means for Investigating Small-Scale Forestry: A European Perspective. Small-Scale For. 2017, 16, 435–449. [Google Scholar] [CrossRef] [Green Version]
  11. Parzych, K. Spatial Differentiation of Tourist and Recreational Infrastructure in the State Forests in Poland (Review). Sylwan 2018, 162, 763–774. [Google Scholar]
  12. Kovyazin, V.F.; Romanchikov, A.Y. The Problem of cadastral appraisal of forest lands taking into account the infrastructure of the forestry fund. J. Min. Inst. 2018, 229, 98–104. [Google Scholar]
  13. Xiong, L.C.; Wang, F.T.; Cheng, B.D.; Yu, C. Identifying factors influencing the forestry production efficiency in Northwest China. Resour. Conserv. Recycl. 2018, 130, 12–19. [Google Scholar] [CrossRef]
  14. Koliouska, C.; Andreopoulou, Z. Exploring the use of smart services in forestry. J. Environ. Prot. Ecol. 2019, 20, 1434–1439. [Google Scholar]
  15. Kovyazin, V.F.; Kitsenko, A.A.; Shobairi, S.O.R. Cadastral valuation of forest lands, taking into account the degree of development of their infrastructure. J. Min. Inst. 2021, 249, 449–462. [Google Scholar] [CrossRef]
  16. Cheng, N.Y. Study on the Development of Forest Leisure Tourism Industry Based on Resource Constraint. Ph.D. Thesis, Nanjing Forestry University, Nanjing, China, 2012. [Google Scholar]
  17. Han, N. Analysis of Forest Tourism Competitiveness in Heilongjiang Province. Master’s Thesis, Northeast Agricultural University, Harbin, China, 2017. [Google Scholar]
  18. Akay, A.E.; Sessions, J. Roading and transport operations. In Encyclopedia of Forest Sciences; Burley, J., Evans, J., Youngquist, J., Eds.; Eds.; Elsevier Academic Press: Amsterdam, The Netherlands, 2004; pp. 259–269. [Google Scholar]
  19. Enache, A.; Pentek, T.; Ciobanu, V.D.; Stampfer, K. GIS based methods for computing the mean extraction distance and its correction factors in Romanian mountain forests. Šumar. List. 2015, 139, 35–46. [Google Scholar]
  20. Hayati, E.; Majnounian, B.; Abdi, E. Qualitative evaluation and optimization of forest road network to minimize total costs and environmental impacts. Forests 2012, 5, 121–125. [Google Scholar] [CrossRef] [Green Version]
  21. Laschi, A.; Neri, F.; Brachetti Montorselli, N.; Marchi, E.A. A Methodological Approach Exploiting Modern Techniques for Forest Road Network Planning. Croat. J. For. Eng. 2016, 37, 319–331. [Google Scholar]
  22. Parsakhoo, A.; Mostafa, M. Road network analysis for timber transportation from a harvesting site to mills (Case study: Gorgan County–Iran). J. For. Sci. 2015, 61, 520–525. [Google Scholar] [CrossRef] [Green Version]
  23. Picchio, R.; Spina, R.; Calienno, L.; Venanzi, R.; Lo Monaco, A. Forest operations for implementing silvicultural treatments for multiple purposes. Ital. J. Agron. 2016, 11, 156–161. [Google Scholar]
  24. Zhang, L.Y.; Wu, C.L.; Zhang, Y. Experimental Study Based on Game Theory on the Private, Voluntary Supply Mechanisms of Goods for Forestry Infrastructure from the Perspective of Quasi-Public Goods. Sustainability 2020, 12, 2808. [Google Scholar] [CrossRef] [Green Version]
  25. Güth, W.; Levati, M.V.; Sutter, M.; Van Der Heijden, E. Leading by Example with and without Exclusion Power in Voluntary Contribution Experiments. J. Public. Econ. 2007, 91, 1023–1042. [Google Scholar] [CrossRef] [Green Version]
  26. Ozono, H.; Jin, N.; Watabe, M.; Shimizu, K. Solving the second-order free rider problem in a public goods game: An experiment using a leader support system. Sci. Rep. 2016, 6, 38349. [Google Scholar] [CrossRef]
  27. Baldwin, K. Elected MPs, Traditional Chiefs, and Local Public Goods: Evidence on the Role of Leaders in Co-Production from Rural Zambia. Comp. Polit. Stud. 2019, 52, 1925–1956. [Google Scholar] [CrossRef]
  28. Fang, Y.H.; Perc, M.; Xu, H.Y. The Singaporean model in public goods dilemmas with benevolent leaders and bribery. J. Theor. Biol. 2020, 501, 110345. [Google Scholar] [CrossRef]
  29. Bahbouhi, J.E.; Moussa, N. Leaders rewiring mechanism promotes cooperation in public goods game. Int. J. Mod. Phys. C 2021, 32, 2150127. [Google Scholar] [CrossRef]
  30. Weimann, J. Individual behavior in a free riding experiment. J. Public Econ. 1994, 54, 185–200. [Google Scholar] [CrossRef]
  31. Meidinger, C.; Villeval, M.C. Leadership in Teams: Signaling or Reciprocating? EconPapers 2002. [Google Scholar]
  32. Croson, R.T.A. Feedback in voluntary contribution mechanisms: An experiment in team production. Res. Exp. Econ. 2001, 8, 85–97. [Google Scholar]
  33. Bigoni, M.; Suetens, S. Feedback and dynamics in public good experiments. J. Econ. Behav. Organ. 2012, 82, 86–95. [Google Scholar] [CrossRef]
  34. Irlenbusch, B.; Ter Meer, J. Fooling the nice guys: Explaining receiver credulity in a public good game with lying and punishment. J. Econ. Behav. Organ. 2013, 93, 321–327. [Google Scholar] [CrossRef]
  35. Fischbacher, U.; Stefani, U. Strategic errors and audit quality: An experimental investigation. Account. Rev. 2007, 82, 9–704. [Google Scholar] [CrossRef]
  36. Zhou, Y.A.; Huang, G.B.; He, H.R.; Liu, M.W. Do leaders really lead by example? a study based on public goods game experiment. Manag. World 2014, 30, 75–90. (In Chinese) [Google Scholar]
Figure 1. The calculation rules of income.
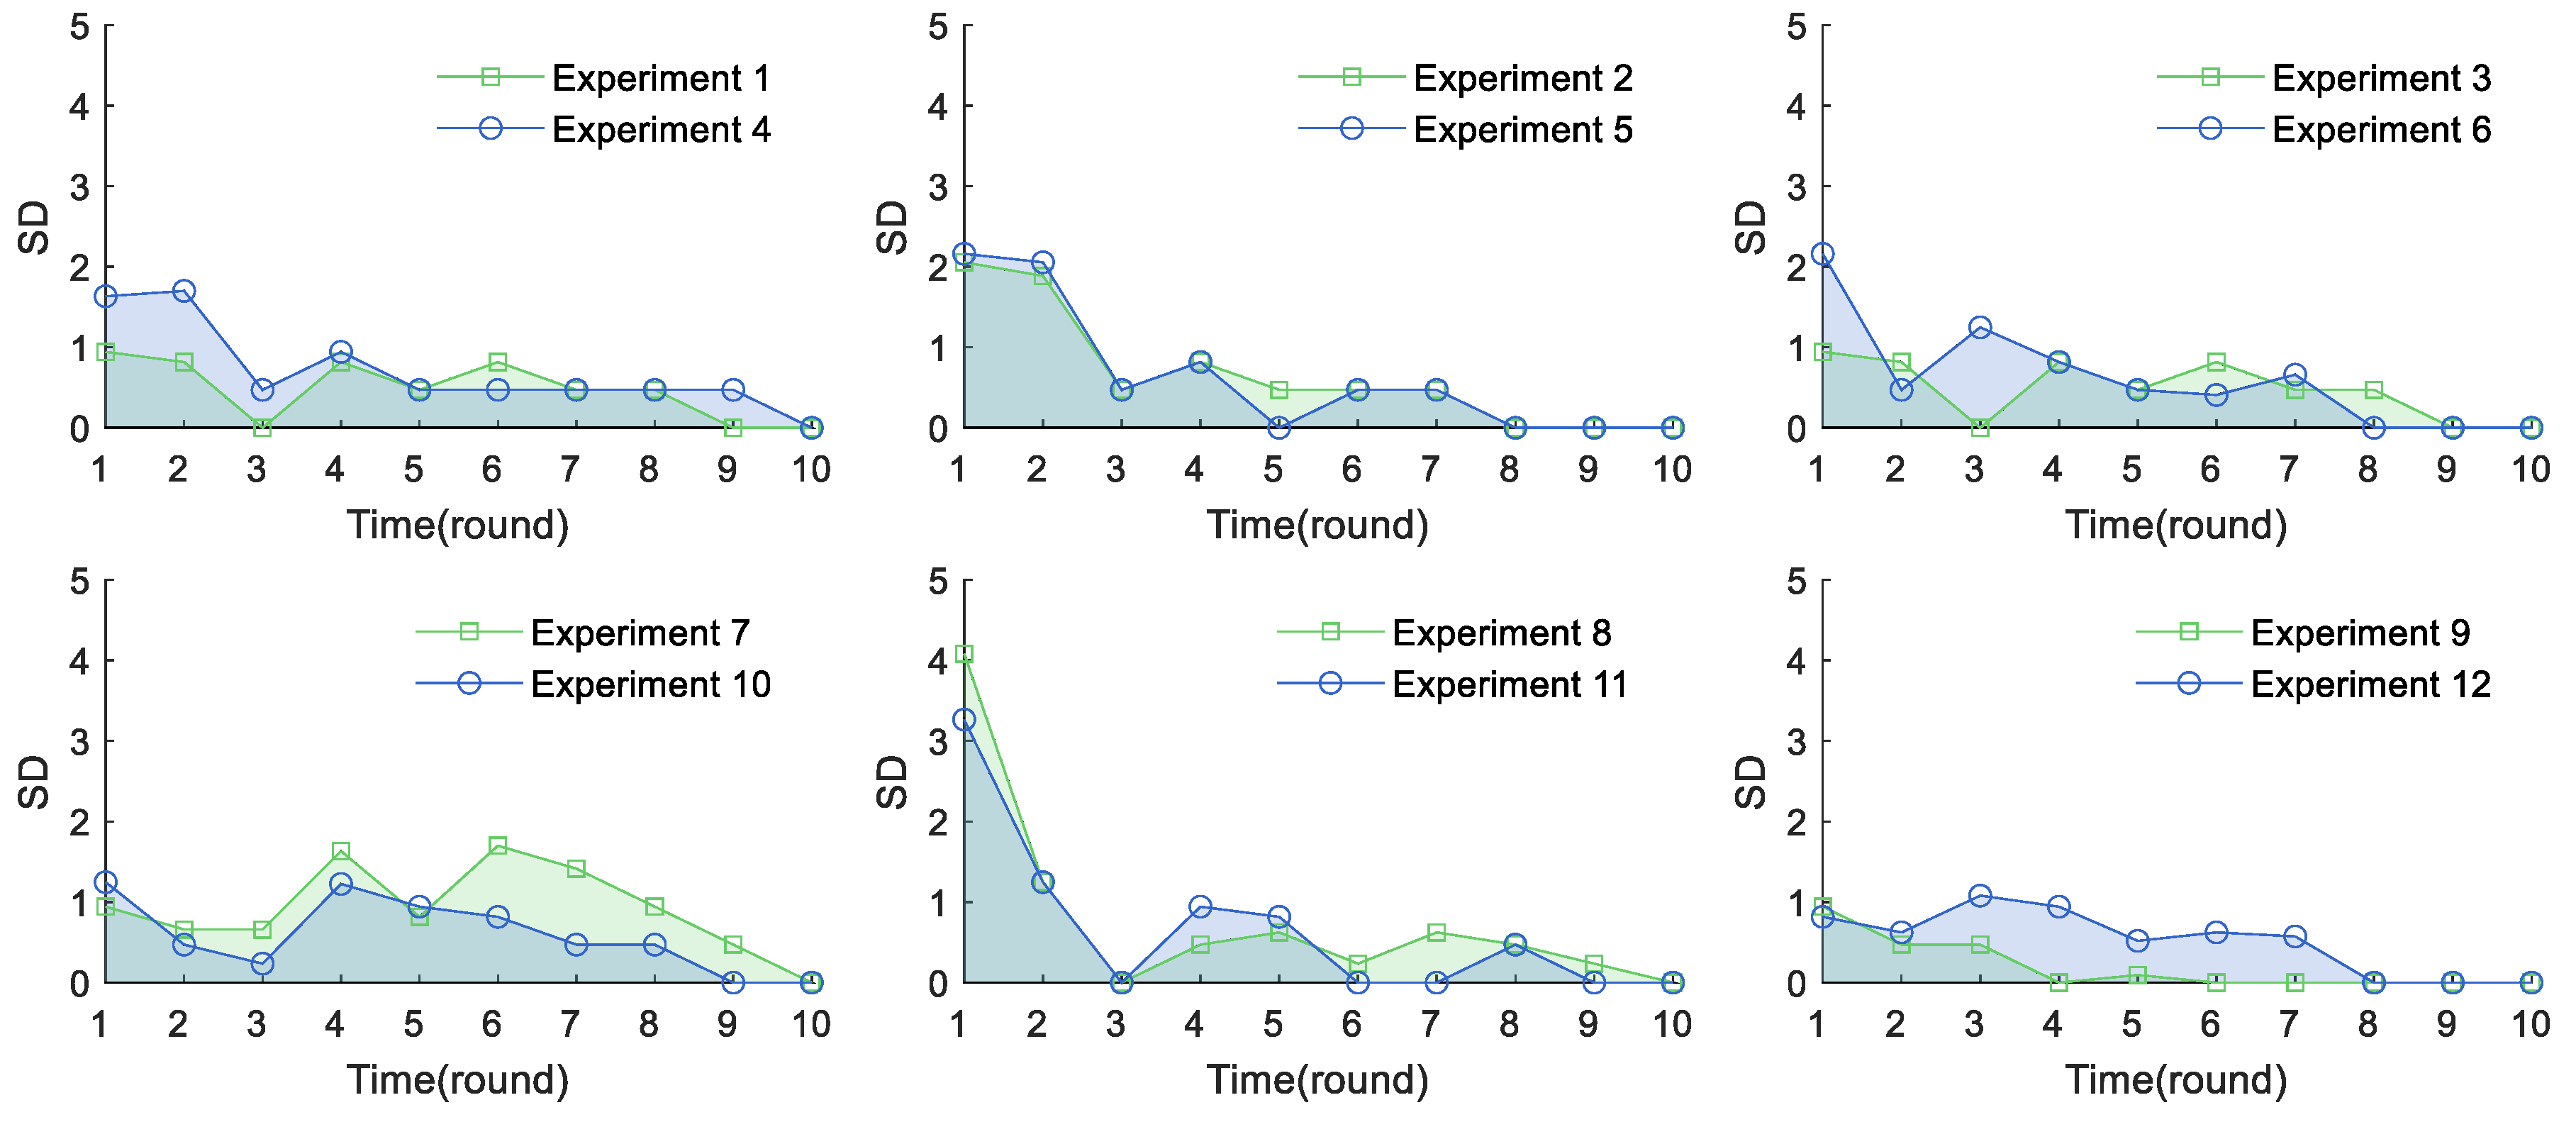
Forests 14 00275 g001
Figure 2. Supply analysis in 12 scenarios.
Forests 14 00275 g002
Figure 3. Effects of communication on supply.
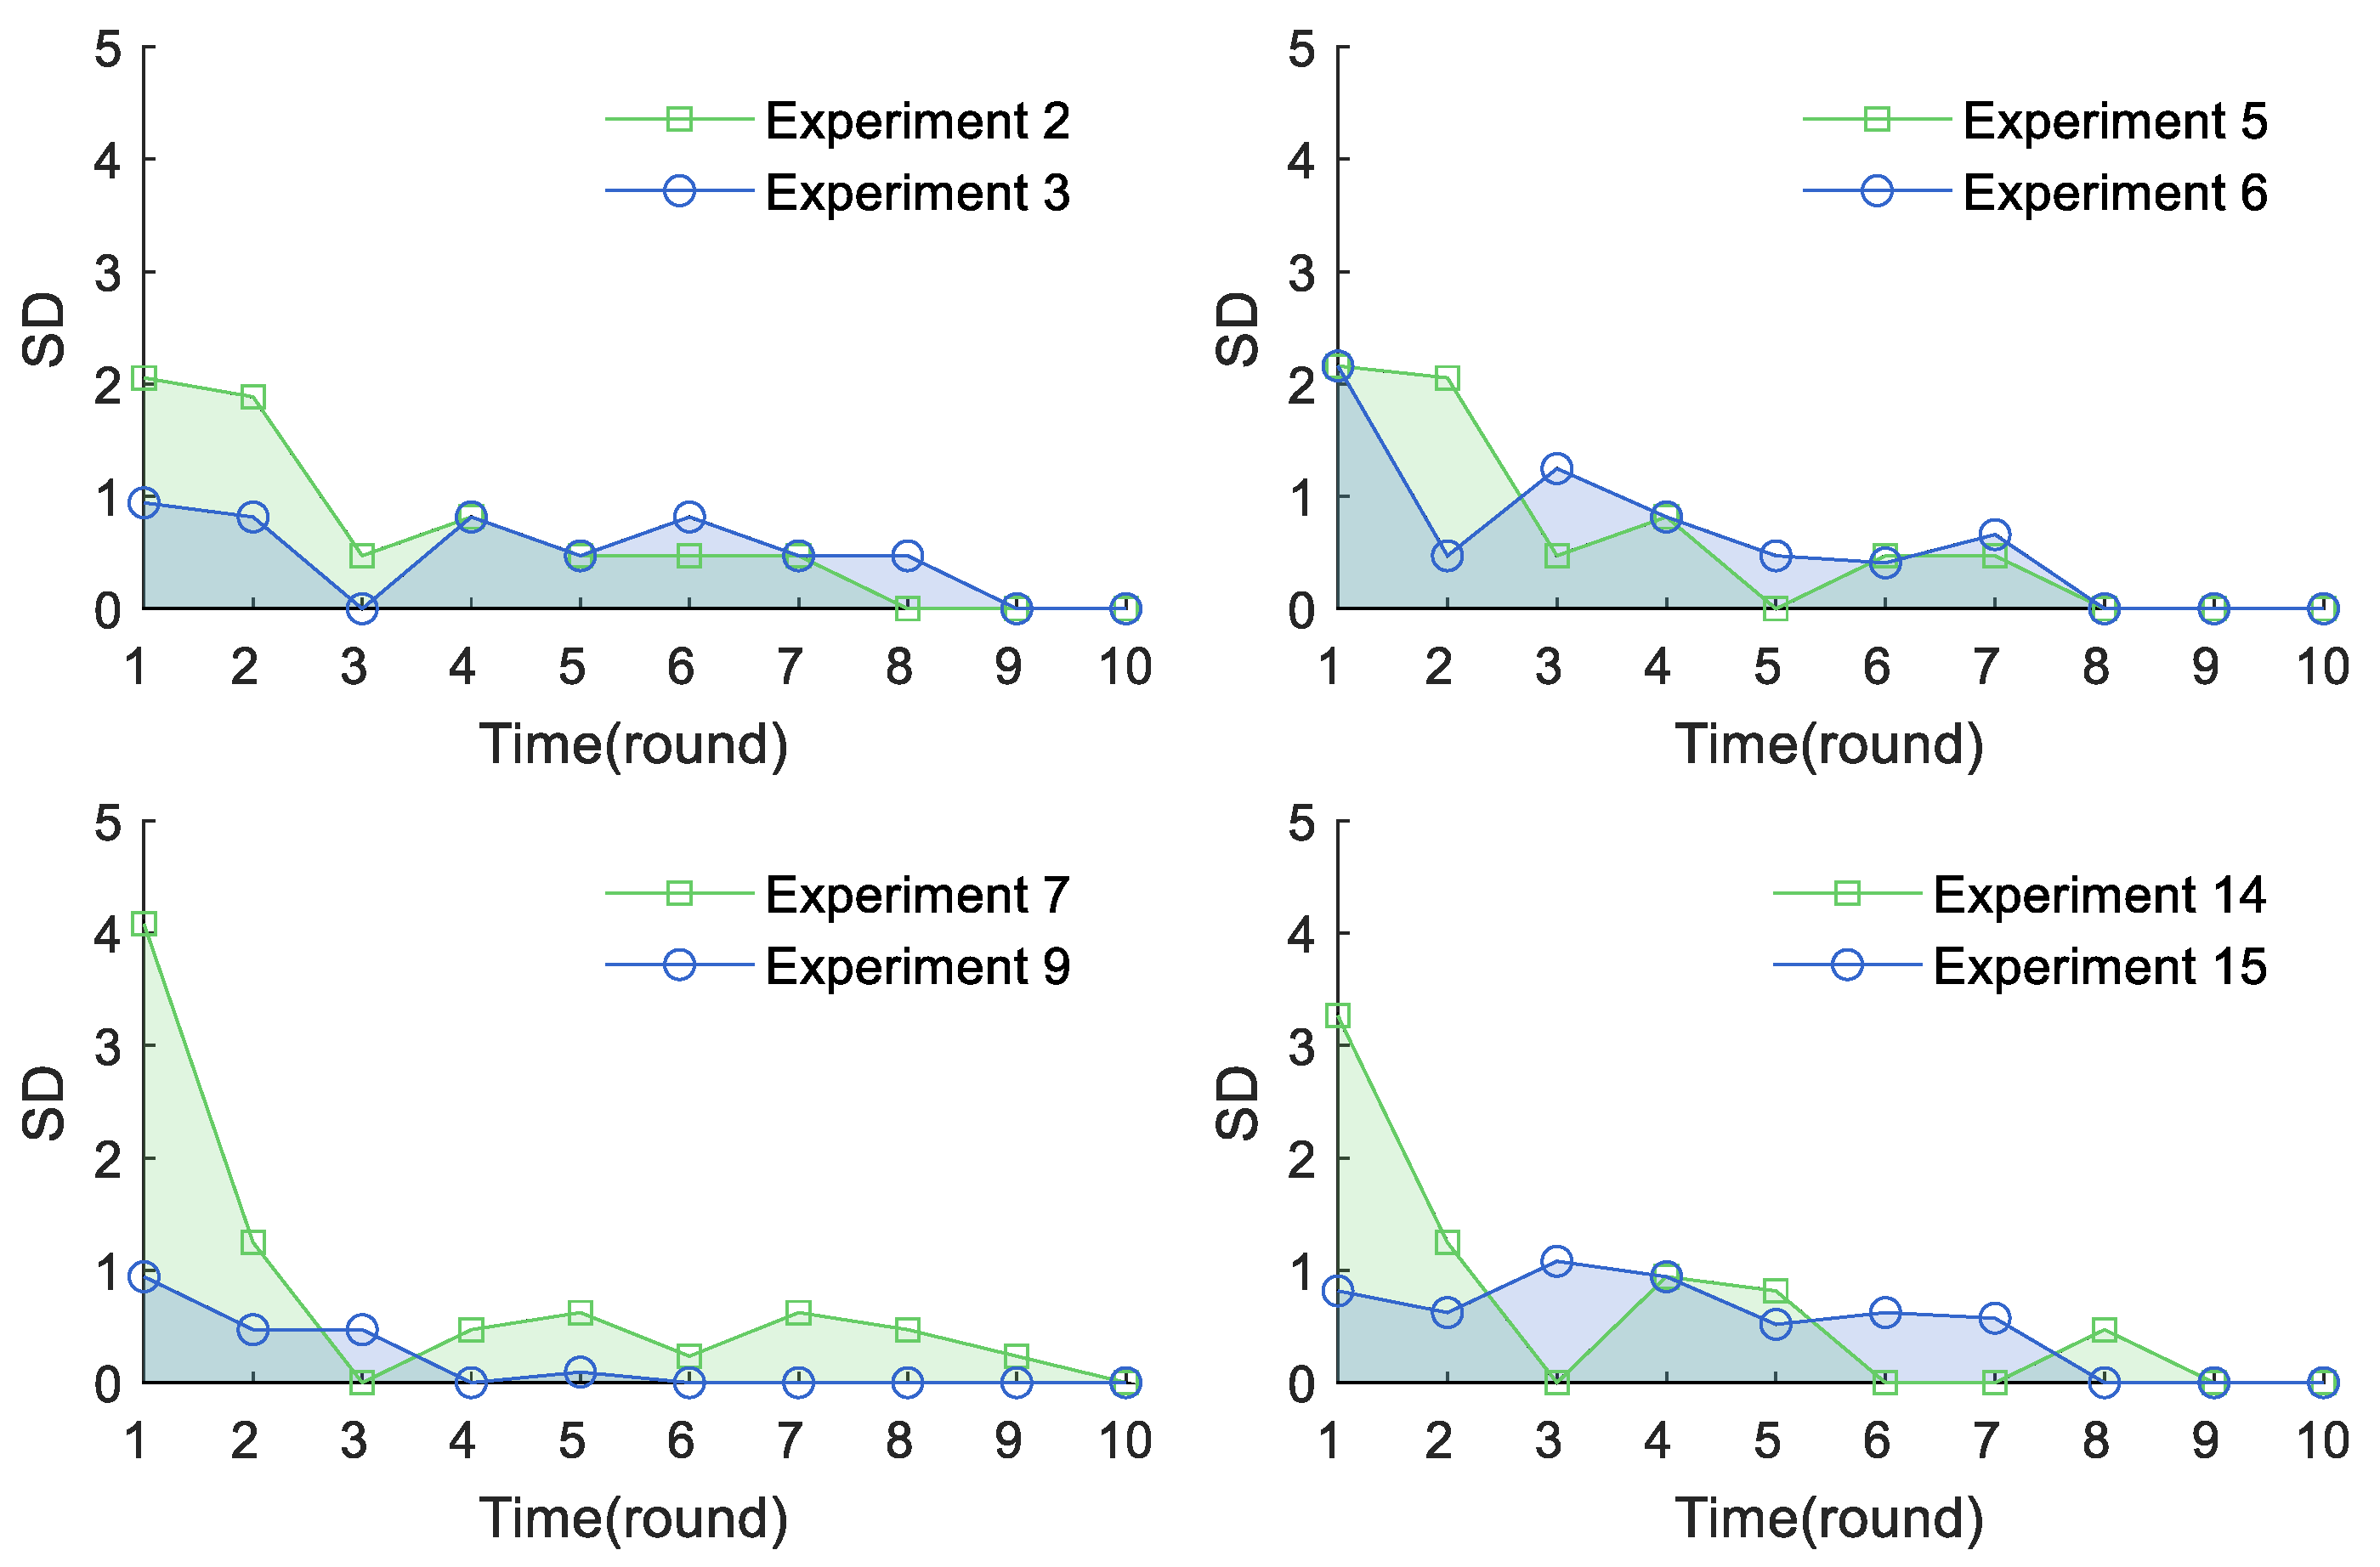
Forests 14 00275 g003
Figure 4. Effects of communication on free-riding behaviour.
Forests 14 00275 g004
Figure 5. Effects of information feedback on supply.
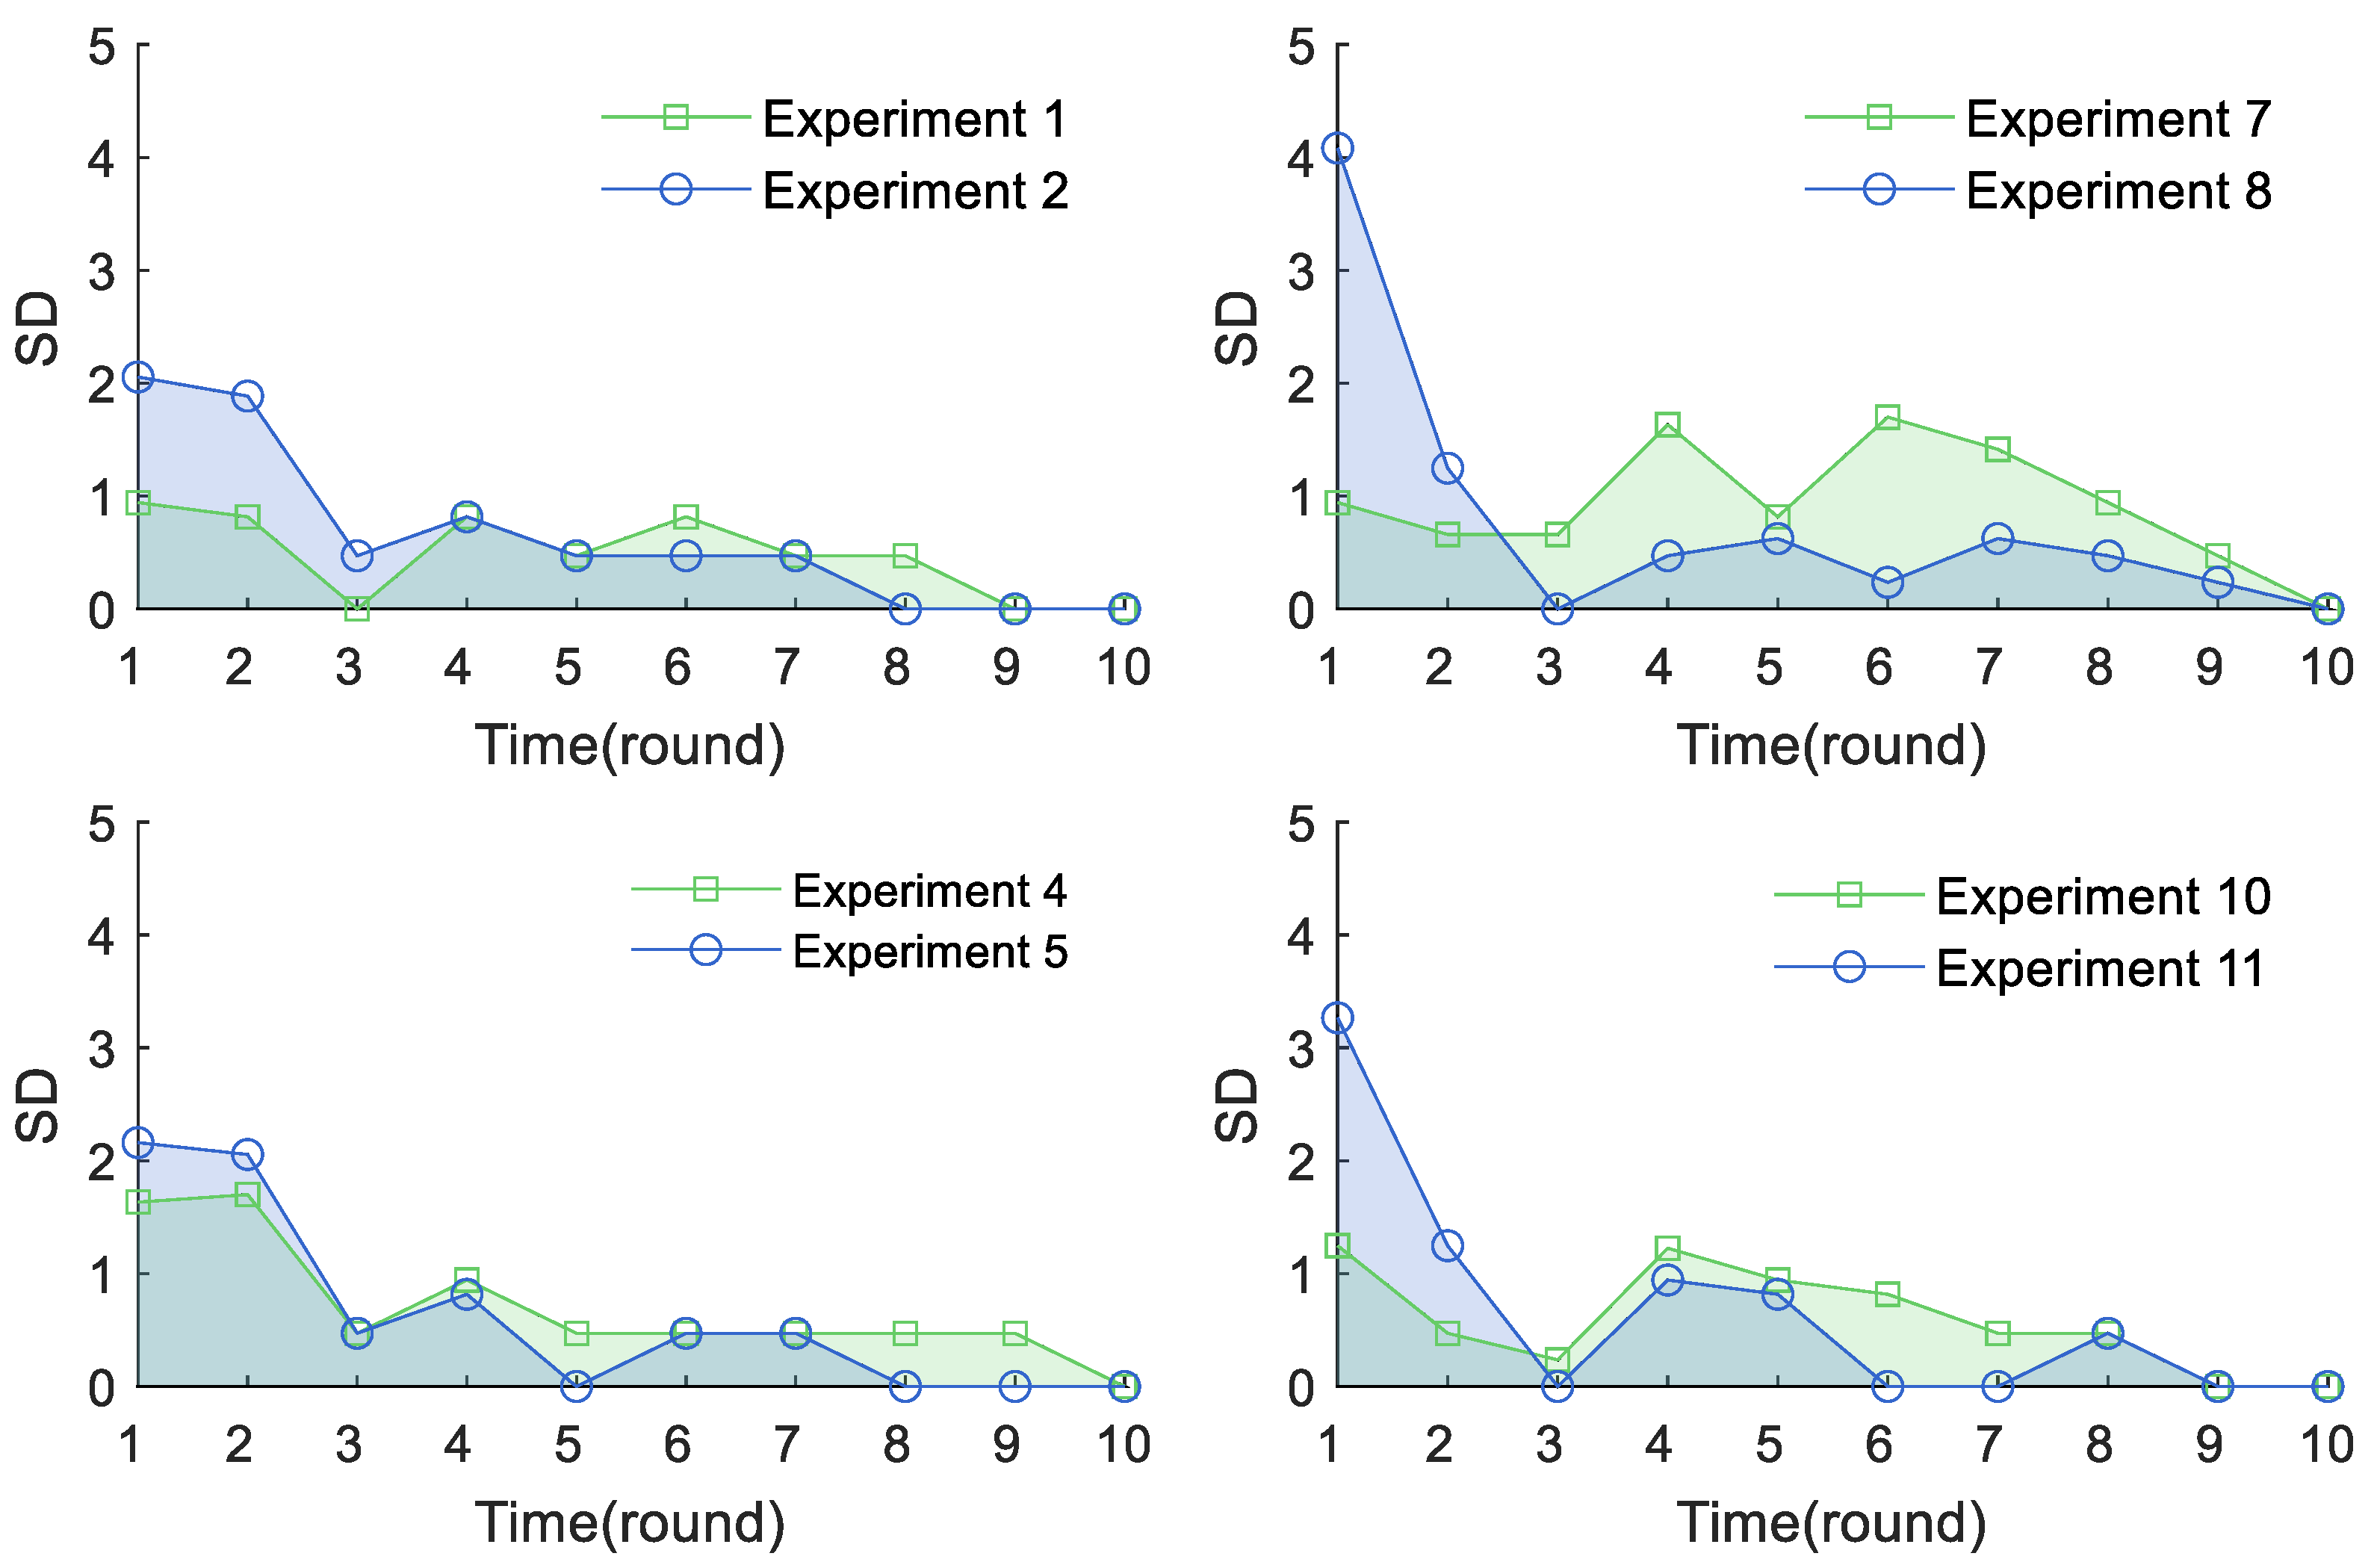
Forests 14 00275 g005
Figure 6. Effects of information feedback on free-riding behaviour.
Forests 14 00275 g006
Figure 7. Effects of rewards and punishments on supply.
Forests 14 00275 g007
Figure 8. The impact of rewards and punishments on free riding.
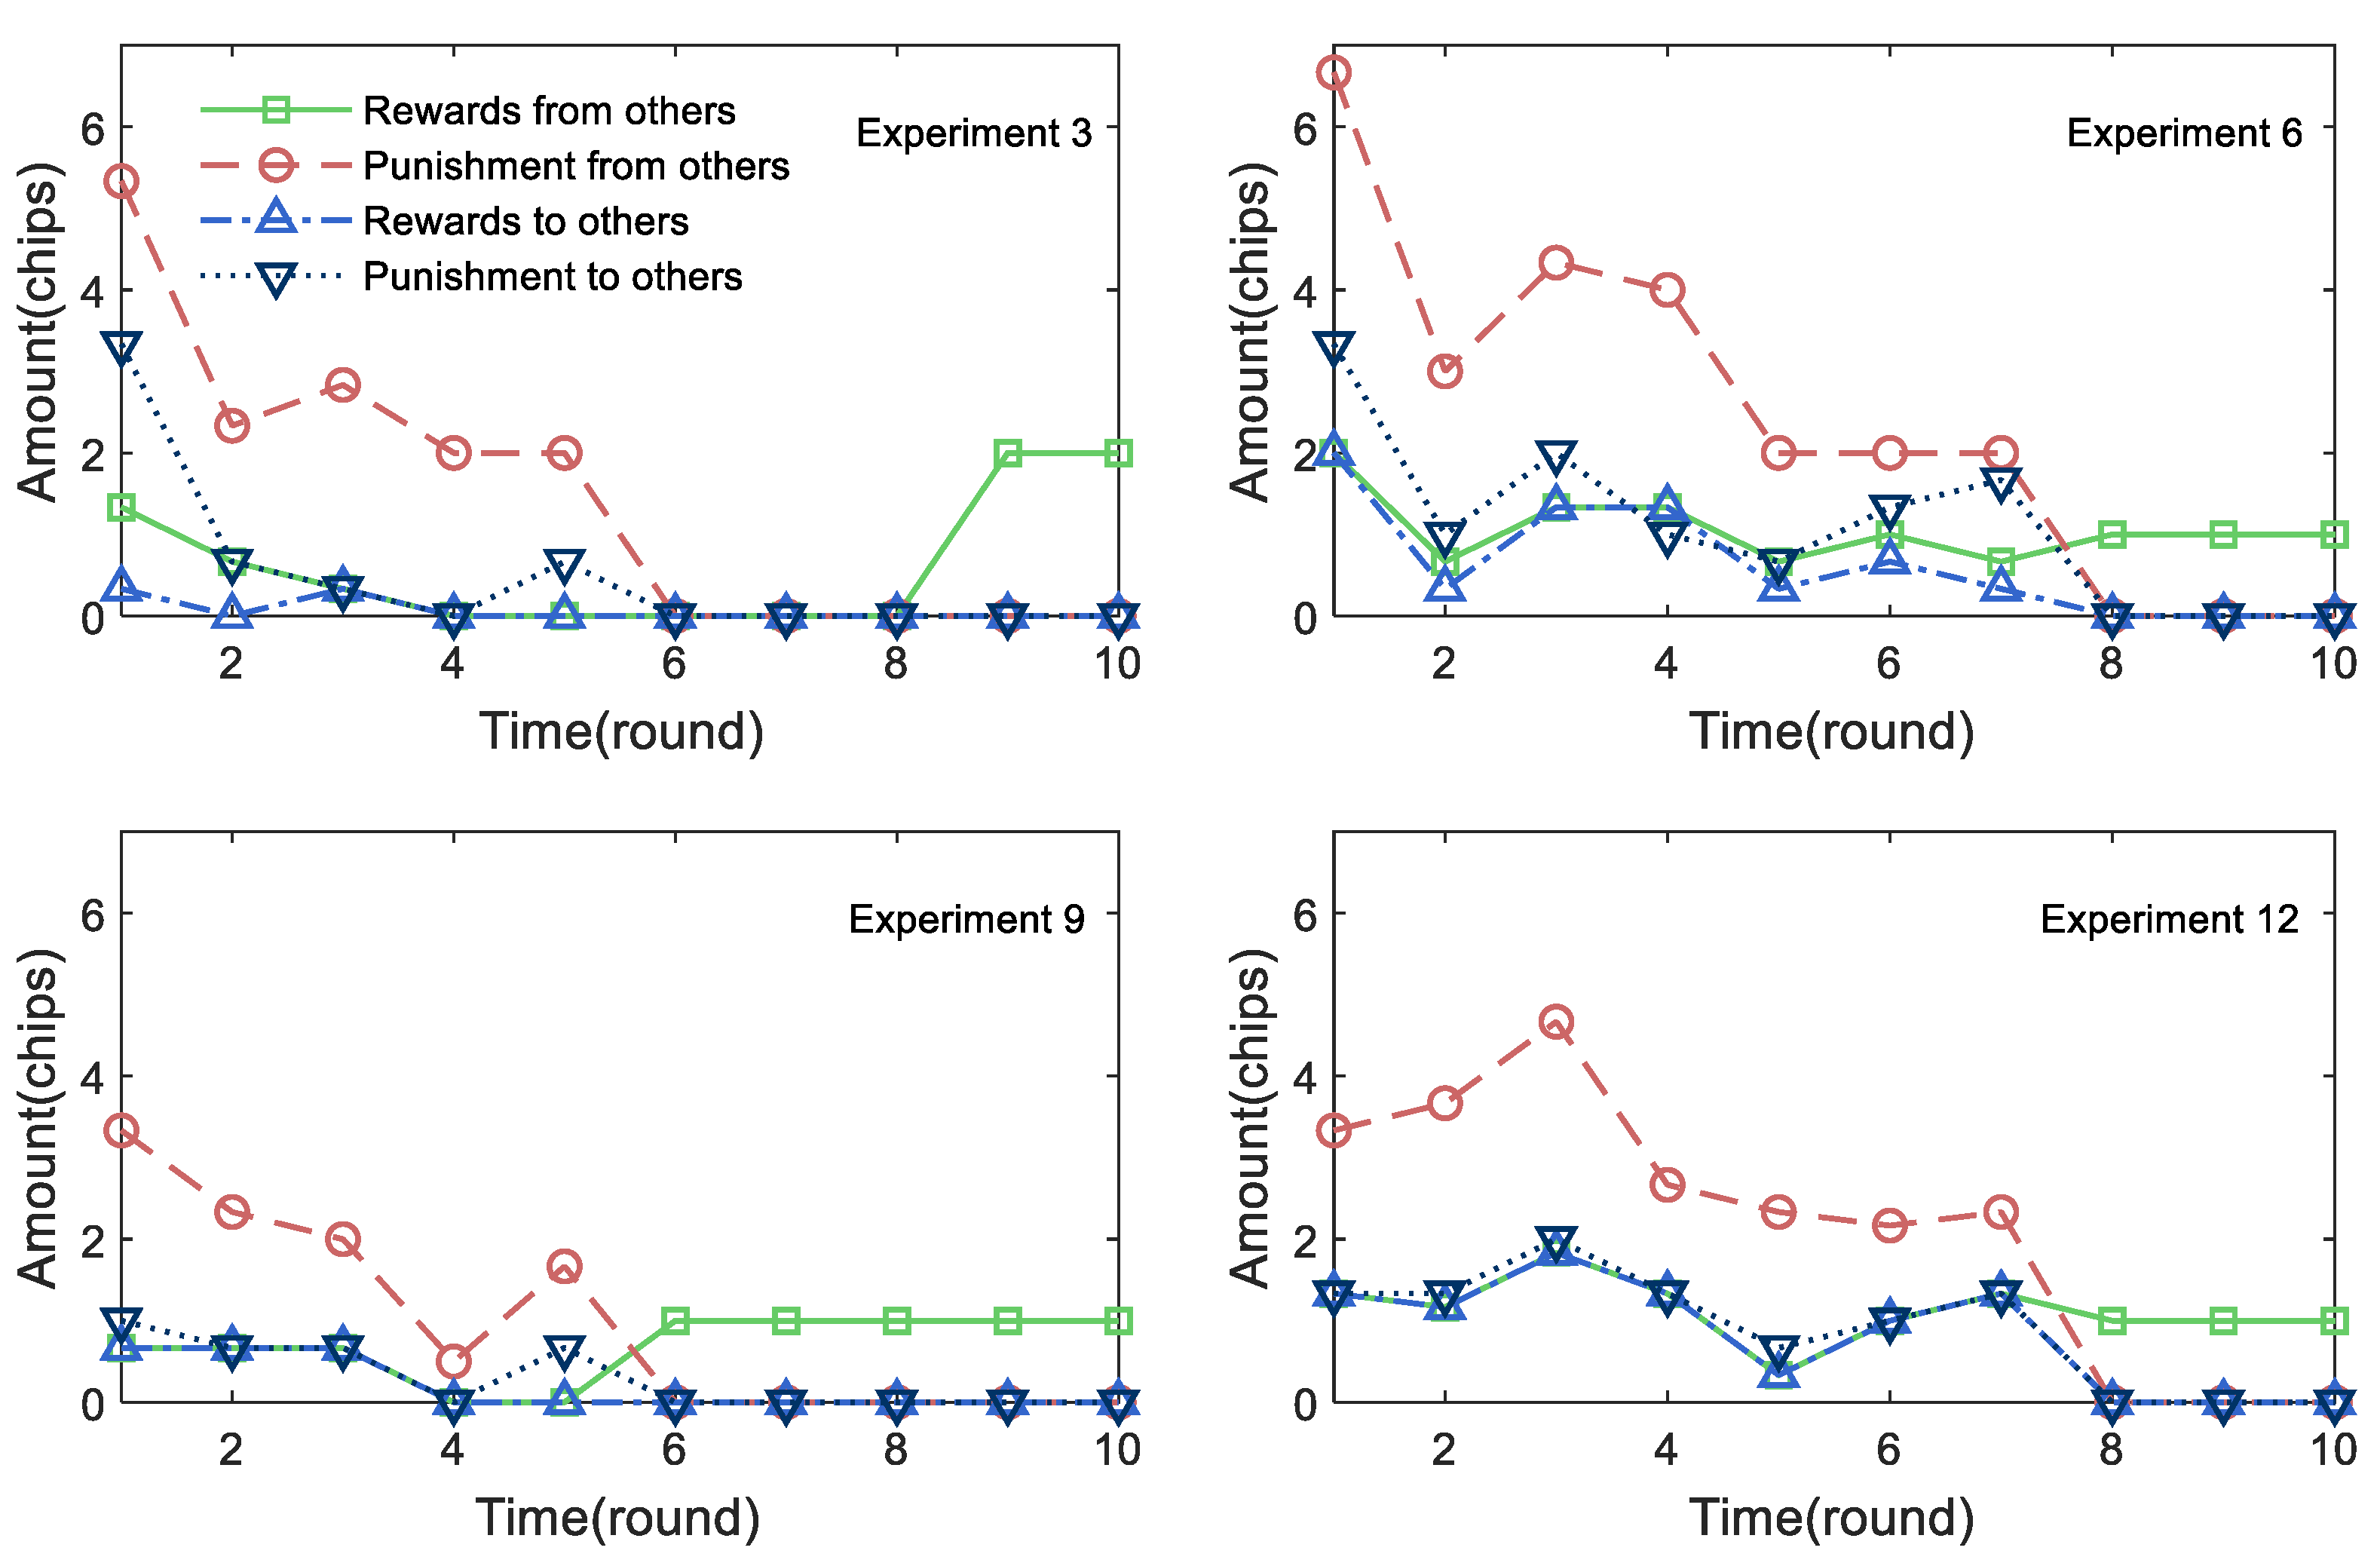
Forests 14 00275 g008
Figure 9. Amounts of reward and punishment implemented or received.
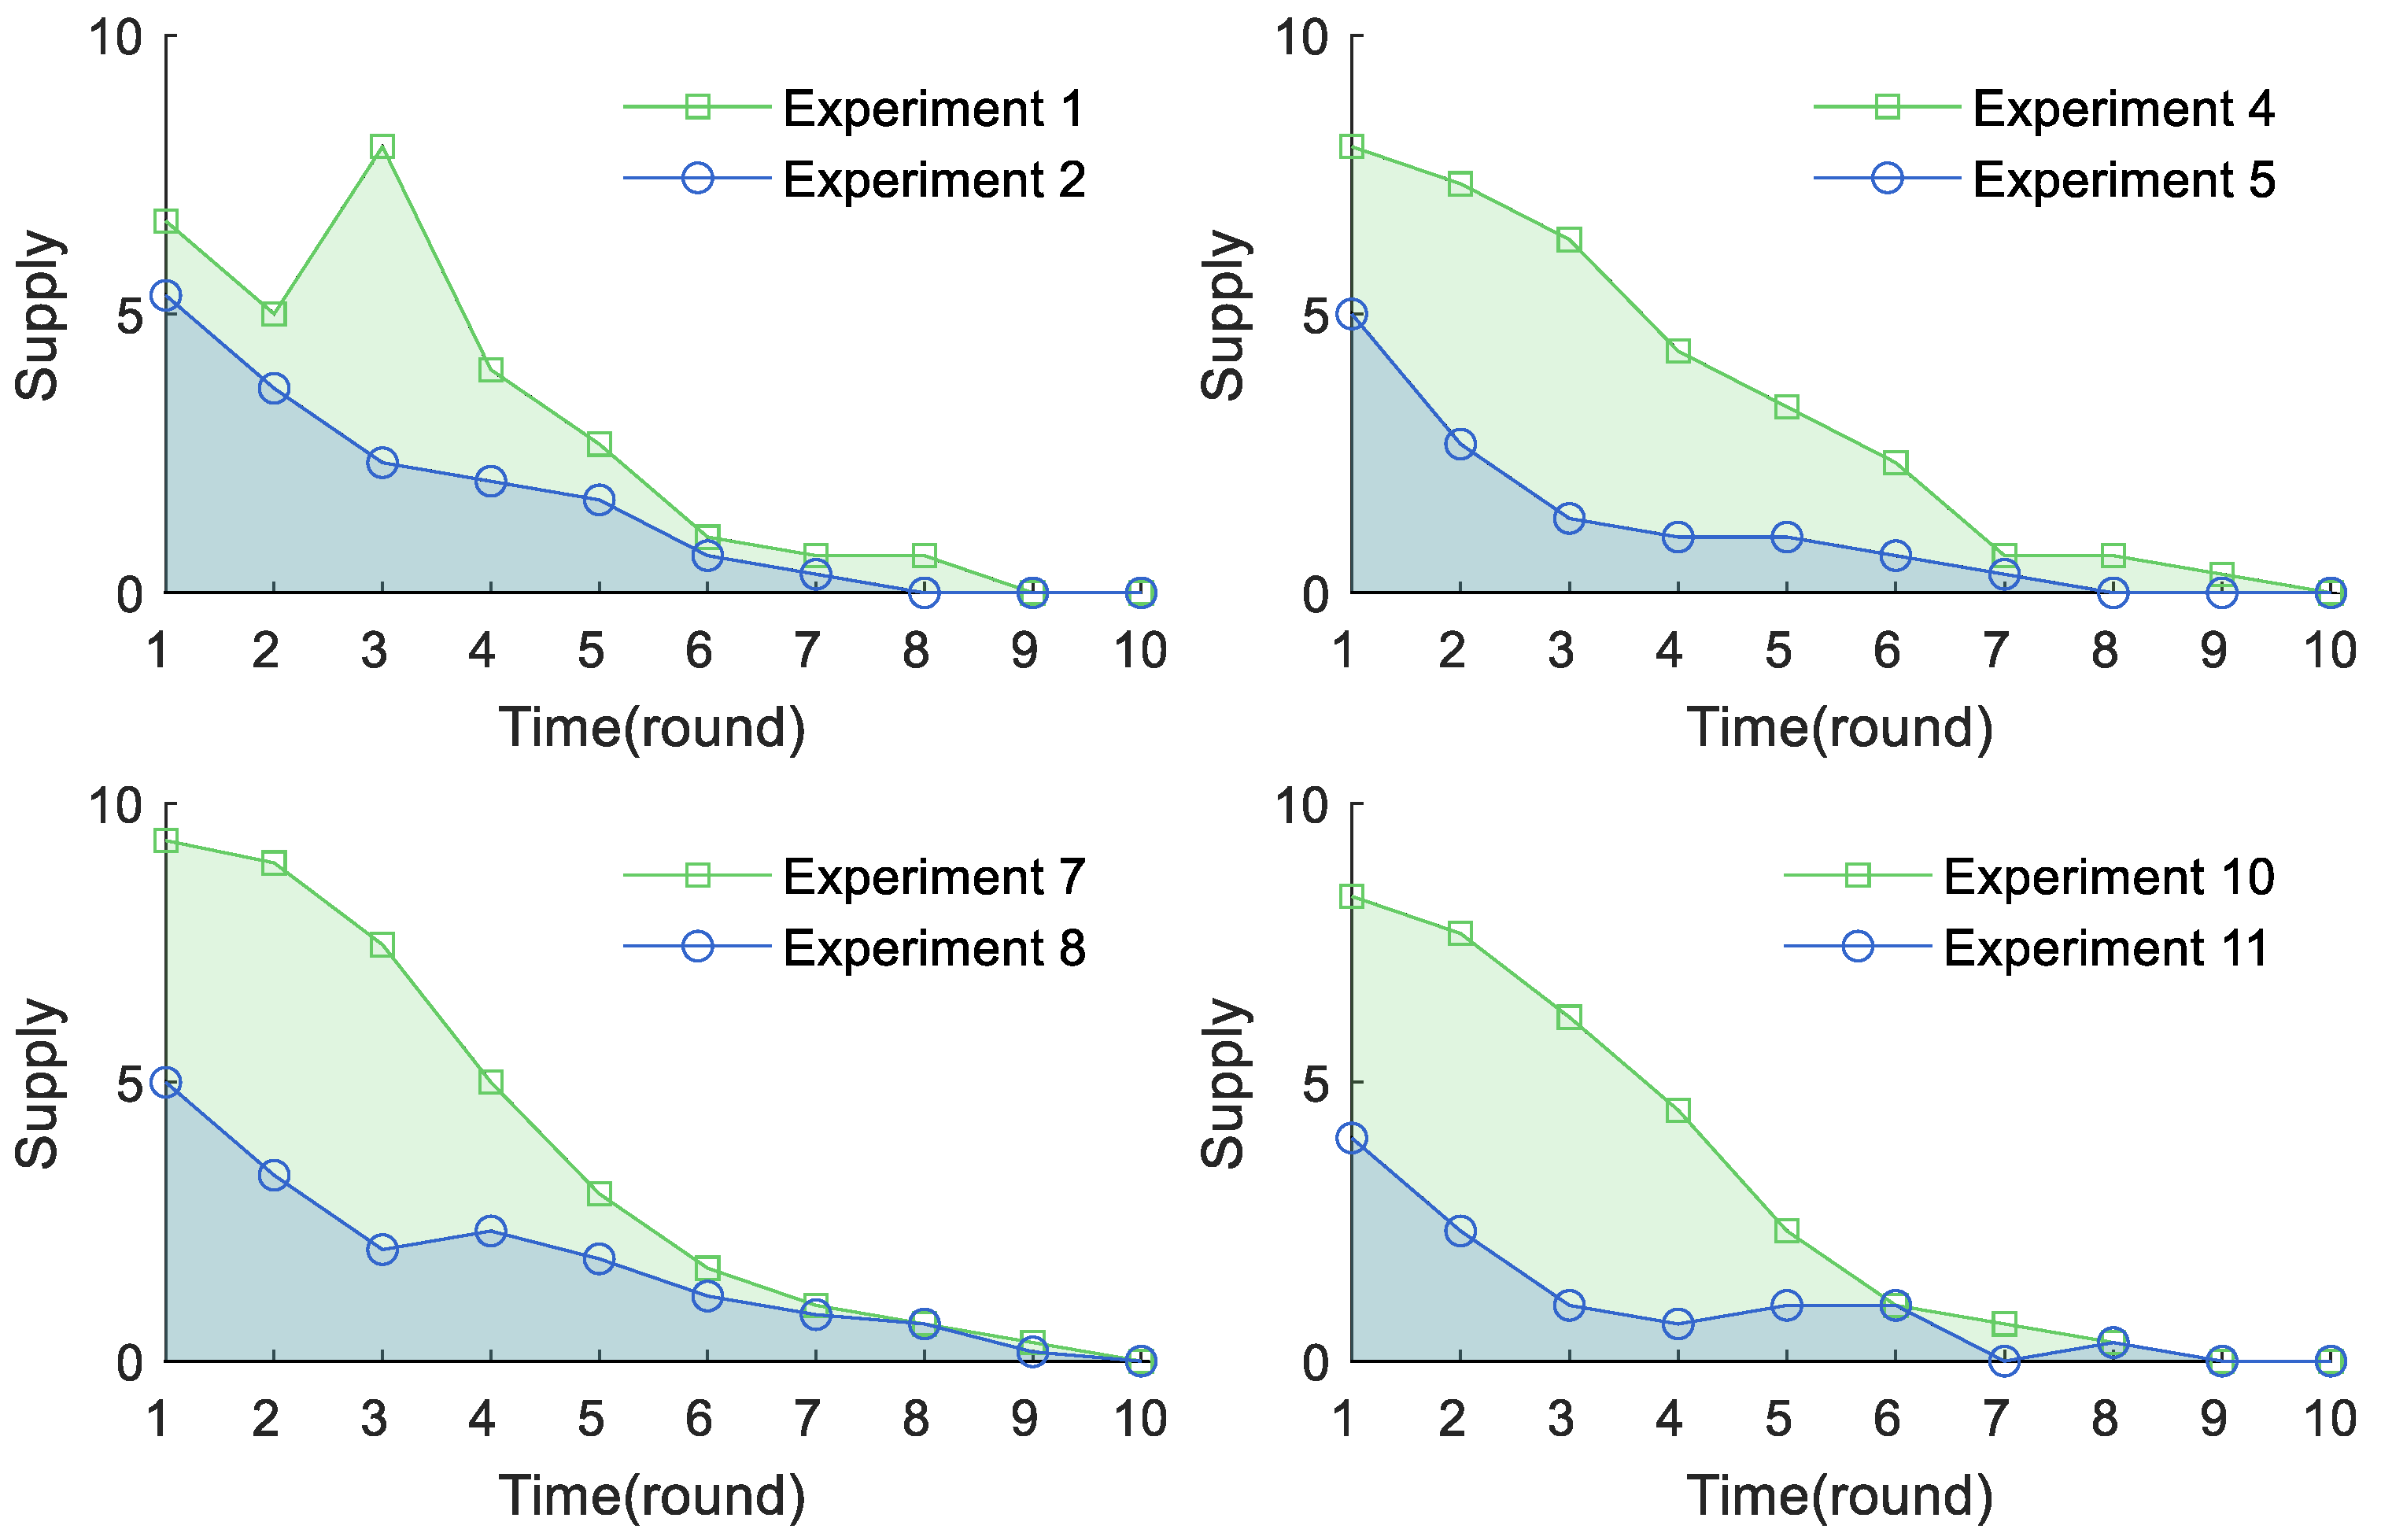
Forests 14 00275 g009
Figure 10. Effects of leadership style on supply.
Forests 14 00275 g010
Figure 11. Effects of leadership style on free-riding behaviour.
Forests 14 00275 g011
Table 1. The static game of incomplete information between forestry farmer and government.
ForestersSupplyNo Supply
Government
SupplyR1-C, R2-CR1-2C, R2
No supplyR1, R2-2C0, 0
The underline represents the game result of Nash equilibrium. Bold is used to describe the two strategies of the foresters and the government respectively. In order to keep the foresters and the government consistent, the strategies are in bold.
Table 2. Experimental design.
ExperimentsExperiments
Experiment 1: EL × NF × NP × NC (10 rounds)Experiment 7: EL × NF × NP × C (10 rounds)
Experiment 2: EL × F × NP × NC (10 rounds)Experiment 8: EL × F × NP × C (10 rounds)
Experiment 3: EL × F × P × NC (10 rounds)Experiment 9: EL × F × P × C (10 rounds)
Experiment 4: CL × NF × NP × NC (10 rounds)Experiment 10: CL × NF × NP × C (10 rounds)
Experiment 5: CL × F × NP × NC (10 rounds)Experiment 11: CL × F × NP × C (10 rounds)
Experiment 6: CL × F × P × NC (10 rounds)Experiment 12: CL × F × P × C (10 rounds)
Note: NC indicates that followers cannot communicate with each other, whereas C indicates that they can communicate with each other. EL represents leading by example; CL represents leading by words; F means that there is information feedback; NF means that there is no information feedback; P means that there are rewards and punishments; and NP means that there are no rewards or punishments.
Table 3. Locations of field investigation.
Forest TypesLocations of Field Investigation
Forest ParkBadaling Forest Park
Forest ParkCuiHu National Urban Wetland Park
Ecological forestWaLi Agricultural Ecological Park in ChangPing District
Ecological forestSongShan Nature Reserve
Ecological forestEcological Forest in YanQing Mountain
Collective forest farmLvJian collective forest farm
OrchardBeijing ShiXin Wowo Orchard
NurseryYiLi First Construction Ecological Technology Co., Ltd.
Table 4. Descriptive statistics of subjects’ social and demographic portrait.
VariablesMeanSDMinMedianMax
Gender 0.6670.4710.0001.0001.000
Ethnic group0.9580.2000.0001.0001.000
Communist or not0.5420.4980.0001.0001.000
Took out a loan or not0.0000.0000.0000.0000.000
Part-time or not0.4170.4930.0000.0001.000
Participated in the experiment or not0.6670.4710.0001.0001.000
Average household income per month3.1250.6652.0003.0004.000
Self-evaluation of reliability4.0000.7073.0004.0005.000
Evaluation of strangers’ reliability2.5420.7631.0003.0004.000
Note: Gender (0 = female; 1 = male); ethnic group (0 = ethnic minority; 1 = ethnic Han); Communist or not (0 = no; 1 = yes); took out a loan or not (0 = no; 1 = yes); part-time or not (0 = no; 1 = yes); participated in the experiment or not (0 = no; 1 = yes); average household income per month (1 = RMB 0–3000; 2 = RMB 3001–6000; 3 = RMB 6001–9000; 4 = RMB 9000 or more); self-evaluation of reliability (5 = very trustworthy; 4 = trustworthy; 3 = fair; 2 = untrustworthy; 1 = quite untrustworthy); evaluation of strangers’ reliability (5 = very trustworthy; 4 = trustworthy; 3 = fair; 2 = untrustworthy; 1 = quite untrustworthy).
Table 5. Results of the Mann–Whitney U test for the effects of communication on supply.
Contrast Groupsp ValuesContrast Groupsp Values
Experiment 1 and Experiment 70.544Experiment 4 and Experiment 100.820
Experiment 2 and Experiment 80.649Experiment 5 and Experiment 110.847
Experiment 3 and Experiment 90.045Experiment 6 and Experiment 120.570
Table 6. Mann–Whitney U test of the effects of information feedback on supply.
Contrast Groupsp-ValuesContrast Groupsp-Values
Experiment 1 and Experiment 20.321Experiment 7 and Experiment 80.496
Experiment 4 and Experiment 50.128Experiment 10 and Experiment 110.221
Table 7. Mann–Whitney U test of the effects of rewards and punishments on supply.
Contrast Groupsp-ValuesContrast Groupsp-Values
Experiment 2 and Experiment 30.321Experiment 8 and Experiment 90.001
Experiment 5 and Experiment 60.001Experiment 11 and Experiment 120.000
Table 8. Mann–Whitney U test of the effects of leadership style on supply.
Contrast Groupsp-ValuesContrast Groupsp-Values
Experiment 1 and Experiment 40.790Experiment 7 and Experiment 100.570
Experiment 2 and Experiment 50.673Experiment 8 and Experiment 110.238
Experiment 3 and Experiment 60.130Experiment 9 and Experiment 120.226
Table 9. Factors influencing supply in different experimental scenarios.
Independent
Variables
Dependent Variables
Experiment 1Experiment 2Experiment 3Experiment 4Experiment 5Experiment 6
PDF
ELF0.008(0.032)−0.032 **(0.009)0.223(0.828)−0.001(0.014)−0.049 ***(0.008)−0.539(0.654)
LD−0.405(0.088)−0.198 ***(0.025)−0.869 **(0.237)
RFL 1.440(2.106) −3.045(1.945)
PFL −1.835(2.966) 2.195(2.121)
EFL −0.075(0.676) 0.490(0.544)
LCD −0.442 ***(0.039)−0.118 ***(0.021)0.029(0.145)
Constant10.734 ***(15.823)7.305 ***(0.438)15.360 ***(2.607)12.415 ***(0.705)6.169 ***(0.375)2.702(1.582)
F16.240 ***93.310 ***10.150 **103.720 ***96.410 ***2.31
R20.8230.9640.9270.9670.9650.743
+++++++
Independent
Variables
Dependent Variables
Experiment 7Experiment 8Experiment 9Experiment 10Experiment 11Experiment 12
PDF15.2176(12.4284)1.234(4.001)6.003(9.442)18.085(11.321)−1.472(6.408)−0.022(0.053)
ELF−0.0191(0.02605)−0.031 **(0.009)−2.984(1.436)−0.030(0.024)−0.035 *(0.014)5.003 ***(0.017)
LD4.579(4.171)0.248(1.343)1.774(3.199)
RFL −7.048(3.006) 0.002(0.003)
PFL 8.382(4.106) −0.001(0.001)
EFL 2.605(1.215) 0.000(0.000)
LCD 5.611(3.799)−0.596(2.176)−2.009 ***(0.017)
Constant−188.652(165.990)−9.819(53.442)−73.436(126.399)−228.641(151.196)24.669(85.839)−249.867 ***(1.286)
F43.970 ***76.000 ***9.080 **42.620 ***23.720 ***83690.430 ***
R20.9570.9740.9480.9550.9220.963
Note: *** p < 0.001; ** p < 0.01; * p < 0.05. PDF = planned supply of followers; ELF = last round earnings; LD = supply of leaders; RFL = rewards of followers in the last round; PFL = punishment of followers in the last round; EFL = earnings of followers after rewards and punishments in the last round; LCD = supply committed by leaders.
Disclaimer/Publisher’s Note: The statements, opinions and data contained in all publications are solely those of the individual author(s) and contributor(s) and not of MDPI and/or the editor(s). MDPI and/or the editor(s) disclaim responsibility for any injury to people or property resulting from any ideas, methods, instructions or products referred to in the content.

