Abstract
The Tabebuia alliance is widely planted in tropical and subtropical countries. However, the lack of accurate taxonomic information for many commercial cultivars leads to commercial disputes. We sought to clarify the background of commercial cultivars in China and to provide a robust basis for patent protection. We collected 82 Tabebuia cultivars and 12 reference individuals, then developed large-scale single nucleotide polymorphism (SNP) markers using genotyping-by-sequencing. We obtained 73,219 SNPs from the test samples, which represented a substantial increase compared with previous studies of Tabebuia species. Based on these SNPs and a clustering analysis, we detected six species among the samples, as well as an uncertain population which may be a hybrid between Handroanthus impetiginosus (Mart. ex DC) Mattos and H. heptaphyllus (Vell.) Mattos. An analysis of genetic diversity to assess germplasm resources indicated that excessive heterozygosity of these cultivars in China, which may explain the genetic basis of “novel-preferred” selection in ornamental plants or a narrow genetic background. After rigorous selection, we identified numerous high-quality molecular markers for cultivar identification, then constructed a concise fingerprint with 54 SNPs. Our work clarifies the background information of commercial cultivars of Tabebuia in China and provides information for cultivar identification. It will serve as an important technical resource for genetic studies, and it will help to protect patents that involve Tabebuia species.
1. Introduction
The Tabebuia alliance was once considered a genus in the family Bignoniaceae, which occurs in Central and South America [1,2]. These plants exhibit a high degree of phenotypic variation both within and among species, which has led to ambiguous taxonomic boundaries and a convoluted nomenclatural history [3]. Gentry in 1972 divided the alliance into 10 aggregations within the New World Tecomeae [2], and Grose further separated these aggregations into three clades using molecular phylogenetic analyses [4]. Based on the latest taxonomic revisions, the Tabebuia alliance temporarily includes 99 species and three genera, including 30 species of Handroanthus, 67 of Tabebuia, and two of Roseodendron [5].
Species in the Tabebuia alliance, also regarded as ipe trees, are known for their high density, pretty pattern, and fireproof heartwood [6]. The most recognizable species are tall trees with large, showy inflorescences that bloom after leaf drop [7]. Species in the alliance have become popular as ornamental plants over the past century; they have been widely planted in tropical and subtropical countries for their showy flowers, thereby generating considerable commercial interest and promoting breeding programs [8,9].
Tabebuia species were introduced to China more than 40 years ago, and novel cultivars have been rapidly developed by horticultural businesses and entrepreneurs for ornamental use [10]. Numerous cultivars are sold in southern China; these cultivars vary in terms of inflorescence, hardiness, flower color, and morphology [10,11]. However, the origins and taxonomic background of commercial cultivars are unclear, which has created confusion among consumers and led to commercial disputes [12]. Identification based on phenotypic traits can be difficult in the Tabebuia alliance [3,13] and is presumably impractical for cultivars. Currently, more than 20 non-standard species names are used for these cultivars, whereas the actual background of the cultivars remains unclear and there is a lack of reliable identification methods.
Molecular markers may be useful for tracing cultivar background. Previous studies have identified several simple sequence repeats (SSR) and single nucleotide polymorphism (SNPs) for the Tabebuia alliance [14,15,16]. However, few markers are available and current markers may be inadequate for distinguishing species, as the background of these commercial cultivars may be more complex that of their wild ancestors [17,18]. Genotyping-by-sequencing (GBS) is considered the most convenient approach for large-scale SNP detection [19]. Abundant SNPs covering the whole genome may be necessary to trace the cultivars and such SNPs would facilitate the assessment of inheritance based on genome composition [14,20], as well as the detection of potential introgression or hybridization at the genome level [21,22].
China is enforcing strict laws regarding plant variety patents and requiring accurate information for these commercial cultivars. Here, we collected 82 Tabebuia cultivars and 12 reference plants in China, then developed large-scale SNP markers using GBS. We sought to clarify the species information for these commercial cultivars and provide a basis for patent protection. The objectives of our analyses, which included stru combined with SNP validation assays, were to reveal the potential taxonomic information of each cultivar and determine the number of species represented by commercially available cultivars in China; to evaluate the genetic diversity of the test samples; and to identify high-quality molecular markers for use in rapid identification. Our results will serve as an important technical resource for both genetic studies and judicial decisions involving Tabebuia species.
2. Materials and Methods
2.1. Study System
Tabebuia samples were collected in Guangdong, Fujian, Hainan, and Sichuan provinces in China, where they are most frequently cultured. Cultivars were collected from urban parks, greenbelts, and horticultural firms. Because commercial cultivars are typically propagated by grafting in China, cultivar samples were identified from seedlings based on the presence of grafting scars on the stem. We collected 729 samples from various sites, then conducted a preliminary assessment of leaf and flower traits to avoid collecting duplicates of any particular cultivar [11]. In total, 82 distinct cultivars were included in the analyses (Table 1).

Table 1.
The test samples of 82 cultivars and 12 references.
Twelve reference samples were also collected from a botanical garden, including six species: Handroanthus chrysanthus (Jacq.) S. Grose, H. chrysotrichus (Mart. ex DC) Mattos, H. heptaphyllus (Vell.) Mattos, H. impetiginosus (Mart. ex DC) Mattos, Tabebuia rosea (DC) Bertol, and T. aurea S. Manso. These plants were cultivated by seeds from South America and the US. Although some of them may not be from natural populations directly, they have been certified by a taxonomist as representative of the species and were reported in some studies as species samples.
2.2. DNA Extraction
DNA was extracted from the 94 samples (82 cultivars and 12 reference samples) using a modified cetyltrimethylammonium bromide method. First, 30 mg of dry leaf tissue and an equal weight of polyvinylpyrrolidone were ground to a powder in liquid nitrogen, then mixed with 1 mL of cetyltrimethylammonium bromide-free buffer and 10 μL of β-mercaptoethanol (1%). Next, samples were vortexed to completely disperse the tissue, then incubated at 65 °C for 10 min. Samples were cooled to 0 °C for 10 min, then centrifuged at 7000× g for 10 min. The supernatant was discarded. Subsequently, 600 μL of cetyltrimethylammonium bromide buffer were added and the samples were incubated at 65 °C for 1.5 h. Each sample was mixed with 600 μL of chloroform:isoamyl alcohol (24:1), vortexed and centrifuged at 10,000× g for 10 min. The supernatant was transferred to a fresh tube to precipitate the DNA using 300 μL of 5 M NaCl solution and 600 μL of isoamyl alcohol (−20 °C). Samples were then centrifuged to pellet the DNA. The pelleted DNA was washed twice using 1 mL of 70% ethanol. The DNA was centrifuged and resuspended in 200 μL of Tris–ethylenediaminetetraacetic acid buffer solution.
2.3. Library Construction
The genomic DNA was incubated at 37 °C with MseI (New England Biolabs, Ipswitch, MA, USA), T4 DNA ligase (New England Biolabs), adenosine triphosphate (New England Biolabs), and MseI Y adapter N containing a barcode. Restriction ligation reactions were heat inactivated at 65 °C, then digested at 37 °C using the restriction enzymes MseI + NlaIII. The restriction ligation samples were purified with Agencourt AMPure XP (Beckman Coulter, Brea, CA, USA), then subjected to polymerase chain reaction. Fragments of 375–400 bp (with indexes and adaptors) were isolated using a gel extraction kit (Qiagen, Hilden, Germany). These fragment products were then repurified and diluted for sequencing.
2.4. Genome Sequencing and SNP Identification
The library was sequenced using an Illumina HiSeq PE150 sequencing platform (Illumina, San Diego, CA, USA). Reads with missing-rate lower than 10% of sequence length or with high quality bases (>5) and more than 50% of the sequence length were retained. Adapter sequences and low-quality reads were trimmed using TASSEL-GBS, and clean data were aligned against the reported H. impetiginosus genome [25] using Burrows-Wheeler Aligner software with the parameters “mem–t4–k32–M”. SNPs were identified using the mpileup function in SAMtools [26]. Quality filtering was performed using VCF Tools, with a missing rate of <30%, a minor allele frequency of >0.05, and retention of only loci with two alleles [27]. Loci with more than 50% heterozygous, significant negative fixation index (1–Ho/He) and not in Hardy–Weinberg Equilibrium (HWE) are filtered out to diminished influence of paralogous fragments [27].
2.5. Species Identification
To clarify the genetic structure of the tested cultivars, we estimated the “best” value for K, the number of species, using a burn-in period of 100,000 steps and 10,000 Monte Carlo steps. The analysis was performed in “admixture” [28]. The best-fit probability for each value of K was determined based on cross-validation error, and the K-value with the lowest cross-validation error was accepted. Identification of all cultivars were conducted by comparison with reference samples. All samples were classified based on the ancestry values. Additionally, principal component analysis was performed to validate the results of the species analysis, with R version 4.1.1 using the “hierfstat” package [29].
2.6. Genetic Diversity Analysis
After species classification, we conducted an analysis of molecular variance with 10,000 permutations to assess the hierarchical partitioning of genetic variance using the “poppr” package in R. The genetic diversity parameters of each taxon were calculated using VCF Tools, by loci with missing-rate <30%. These parameters included the Pi value, observed heterozygosity (Ho), unbiased expected heterozygosity (He), fixation index (F; F = 1 − Ho/He). The pairwise fixation index (Fst) was calculated for each taxa pair to assess genetic correlation using the “adegenet” package in R software [30].
2.7. Obtain High-Quality Loci and Constructed Fingerprints
Selected high-quality loci consisted of three components. The first component was used to identify groups that comprised closely related species (based on the Fst), whereas the second component distinguished among species within groups. These loci should only contain homozygotes which are different in paired-groups or paired-species and missing rate = 0. The third component included loci with diversified genotypes in each taxon (missing rate = 0). We calculated the no-majority genotype rate (1—proportion of most genotypes), which may reflect discrimination efficiency, for each locus.
We constructed the fingerprint as a demonstration of the use of these high-quality loci. Based on the objectives of maximizing discrimination efficiency and minimizing loci, we randomly selected two loci from each pair of groups and three loci from each of pair of species, with different numbers among taxa.
3. Results
3.1. GBS Library Sequencing and SNP Calling and Filtering
In total, 271,195,300 reads were generated, with a total length of 39,137,772,672 bp. The mean number of reads per sample was 2.83 million (range: 2.08 million to 4.83 million; Figure 1). The DNA sequence quality was high (Q20 ≥ 94.01%, Q30 ≥ 85.12%), and the GC content ranged from 35.97% to 40.27%. Based on SNP calls, 1,709,912 SNPs were identified, of which 73,219 met the quality requirements and were used in further analyses.
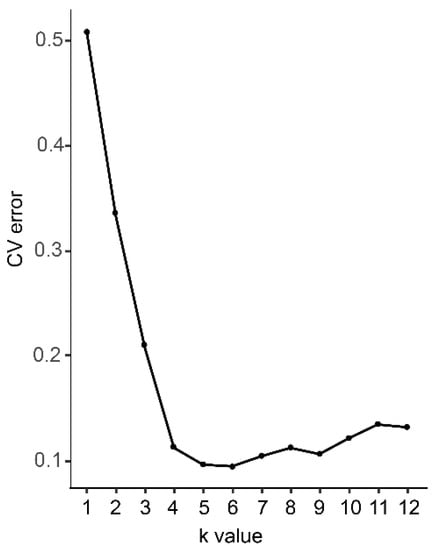
Figure 1.
The probability of best fit into each number of assumed clusters (K).
3.2. Species Identification
The best-fit probability for each value of K is shown in Figure 1. The cross-validation error was lowest at K = 6, indicating that six species are likely represented among the samples.
The cross-validation error with K-values of 2–11 is shown in Figure 2. At K = 6, the 12 reference individuals could be classified according to species, and the cultivars were gathered with same basic flower colors. When K = 7–8, 4 references of H. chrysanthus were separated into three different subgroups, while the other groups show few changes. As there are three taxonomic subspecies in H. chrysanthus, we speculate that the test sample may contain different subspecies in H. chrysanthus and the subspecies with F2 and F15 have the most cultivars in H. chrysanthus. At K = 9, 10, and 11, new taxa replaced individuals with mix bar between H. impetiginosus and H. heptaphyllus. Unstable subgroups are observed in H. chrysotrichus and the suspected hybrids, suggesting that k = 9, 10, 11 may have further separated individual genotypes within species.
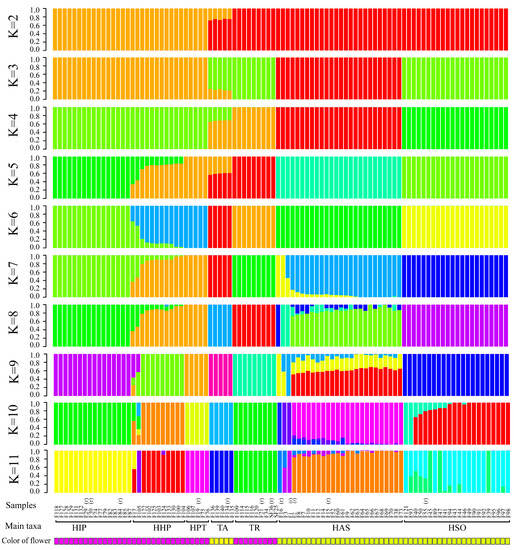
Figure 2.
A structure plot of the 94 individuals from K = 2 To K = 11. (r) represent the reference samples with clear species information. HAS is abbreviation of H. chrysanthus, HSO is abbreviation of H. chrysotrichus, HPT is abbreviation of H. heptaphyllus, HIP is abbreviation of H. impetiginosus, HHP is abbreviation of Mixed traits population, TA is abbreviation of T. aurea, TR is abbreviation of T. rosea.
Based on the reference samples, the cultivars were mostly classified into seven taxa, which included 22 samples with total references of H. chrysanthus, 21 samples with H. chrysotrichus, 13 samples with H. impetiginosus, four samples with H. heptaphyllus, four samples with T. aurea, and seven samples with T. rosea. Eleven samples shared the genotype of H. impetiginosus and H. heptaphyllus (K = 5 to 8), which may represent hybrids between these two species or a new introduced species not reported in China (Table 2).
Table 2.
The result of species identification of 82 cultivars.
These results were confirmed by principal component analysis, in which the first four principal components explained 67.35% of the variance among samples (Figure 3). The first two principal components indicated that seven taxa were grouped into five clusters. H. impetiginosus, H. heptaphyllus, and the hybrid were clustered in the lower left-hand quadrant with abscissa values below zero. Groups were separated along the abscissa in the third and fourth principal components. In terms of graph regions, H. heptaphyllus was clustered in the upper part, H. impetiginosus was clustered in the bottom part, and the hybrid was clustered near the middle.
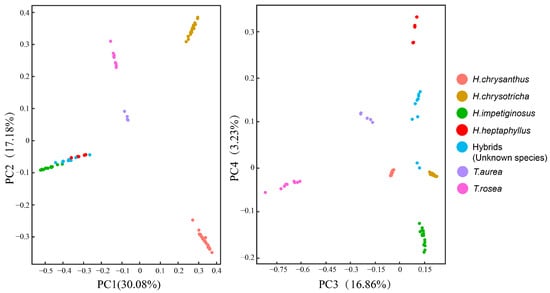
Figure 3.
PCA analysis of the first four component of the 7 species/populations.
3.3. Genetic Diversity
The genetic diversities of the taxa are shown in Table 3. More than 24,000 SNPs were lost in T. rosea and T. aurea. Pi values ranged from 0.0262 to 0.1671, with the highest values observed in H. chrysotrichus and the lowest values observed in T. aurea. Ho values, which are of interest in population analyses and selection dynamics, varied from 0.0327 to 0.2894, whereas F values ranged from −0.2599 to −0.7864. Tajima’s D values were positive for all seven taxa, suggesting strong selection effects in cultivars.
Table 3.
Genetic diversity of the 7 taxa.
Significant differences were observed among taxa (p < 0.01). The most genetic variation was observed among species, with a mean F value of 0.950 (Table 4).
Table 4.
AMOVA of the test samples and the variance components.
The lowest Fst value was observed for H. heptaphyllus and the hybrid/unknown species population (Fst = 0.0755), whereas the highest Fst value was observed for H. chrysotrichus and T. aurea (Fst = 0.8177). H. impetiginosus and H. heptaphyllus had lower Fst values compared with other pairs. T. aurea and T. rosea also had comparatively lower Fst values (Table 5).
Table 5.
Pairwise genetic differentiation (Fst) values among 7 taxa.
3.4. High-Quality Loci and Fingerprints
The pairwise Fst values indicated that the six species could be separated into three groups for SNP detection. Group 1 included H. chrysanthus and H. chrysotrichus, Group 2 included H. impetiginosus and H. heptaphyllus, and Group 3 included T. aurea and T. rosea. The 11 hybrid samples were not included in this analysis, but the loci within populations were estimated. Strict selection revealed 111 available loci between Groups 1 and 2, 197 available loci between Groups 1 and 3, and 226 available loci between Groups 2 and 3 (Figure 4A and Table S1). Selection also revealed three available loci between H. chrysanthus and H. chrysotrichus, 16 available loci between H. impetiginosus and H. heptaphyllus, and 619 available loci between T. aurea and T. rosea (Figure 4B and Table S2). Available loci within each species/population ranged from 65 in T. aurea to 1237 in H. impetiginosus (Figure 4C and Table S3–S9). High-quality loci with a high rate of non-majority genotypes are needed for fingerprint construction.
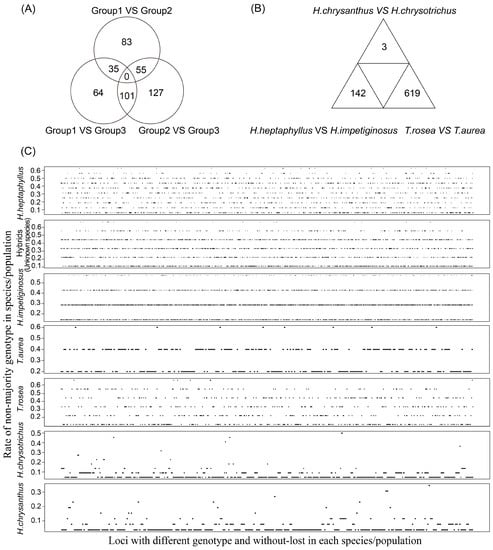
Figure 4.
High-quality loci could be used for fingerprint construction. (A) The number of selected loci available to distinguish different groups; (B) The number of selected loci available to distinguish different species; (C) Description of polymorphic loci available to genetic study within each species.
As an example of their utility, the most concise fingerprint constructed consisted of 54 SNPs from the 94 individuals (Figure 5 and Table S10). Species information is shown based on the first 15 loci, indicating that the first six loci distinguish different groups and the next nine loci distinguish species within groups. Noticeably, some locus combinations could also distinguish the hybrids/unknow species from H. impetiginosus and H. heptaphyllus, as the cultivars display heterozygous or combined genotypes of these two species. Finally, we used 39 loci to identify 94 the cultivars in each taxon. We have listed alternative loci in Tables S1–S9 for use in future studies with more samples.
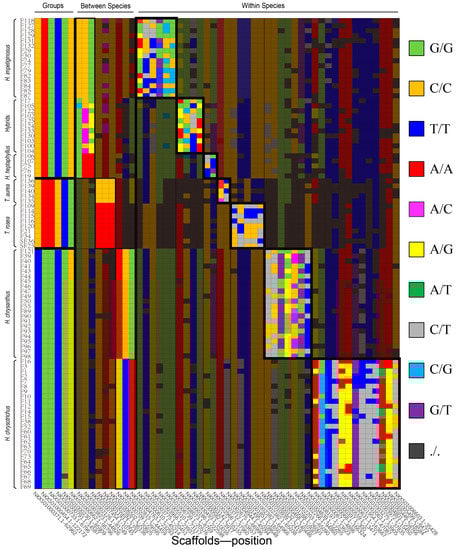
Figure 5.
A fingerprint with only 54 SNPs of 94 sample individuals.
4. Discussion
An understanding of cultivar background is essential for protecting commercial rights and may be more reliably achieved via molecular markers than via phenotypic methods [31,32]. Tabebuia species have great commercial value, and numerous cultivars are grown and sold in China [6,11]. However, the identification of these cultivars is largely unsatisfactory and a comprehensive analysis from a genomic perspective remains lacking.
We used GBS to detect 73,219 SNPs in 94 samples. Our results suggest that GBS can be used to clarify genome-wide SNPs in Tabebuia. In general, the number and distribution of molecular markers can substantially impact the accuracy of genetic analyses [33]. Whereas previous studies of the Tabebuia alliance used phylogenetic analyses to develop 402 SNPs and 30 simple sequence repeats [12,34,35,36], our analyses substantially increased these numbers. GBS is a robust technique for sequencing randomly distributed restriction fragments. Thus, SNPs cover the whole genome and may represent an even distribution of fragments. Combined with previous work [14,35], our analyses revealed that the genome of H. impetiginosus is approximately 557 Mbp, and we may be able to obtain SNP loci for a mean of 7.6 Kbp. SNPs obtained via GBS may provide a high-resolution representation of the whole genome. Analyses using these markers provide comprehensive information regarding genetic variation [37] and increase the reliability of species identification, the background tracing, the evaluation of diversity, and the detection of high-quality molecular markers.
Commercial cultivars of Tabebuia species tend to be given eye-catching names that describe their distinctive traits, rather than reflecting the cultivar’s taxonomic information [11]. Species identification via genome comparison was an effective approach for species identification [20], which may provide important information how many species are traded and which species cultivars belong to. In this study, we included a reference group that comprised 12 positively identified samples representing six species, with the expectation that other species would phenotypically differ from these reference species. The reference samples were clearly delineated based on distinct genetic boundaries, thereby emphasizing the effectiveness of our SNPs. All cultivars corresponded to the references. Thus, we can assume that the cultivars grown in China belong to these six species and an uncertain population with mixed information from both H. impetiginosus and H. heptaphyllus. To be honest, the result of clustering analysis may only be reliable in China due to the lack of reference species from natural distribution. While for a booming non-native market in the world, constructing a rough identification system and acknowledging the background information of the commercial material is necessary in dealing with disputes concerning variety and could be helpful to further studies and the application of Tabebuia species outsides the natural distribution.
In the present study, the uncertain population with mixed information H. impetiginosus and H. heptaphyllus may be evidence of interspecific hybridization in Tabebuia species. Interspecific hybridization has an important role in plant adaptive evolution and speciation [23,38,39], processes that are often used in artificial breeding [40,41]. In previous study, hybridization between pink and yellow Tabebuia species was observed in Argentina [42]. To our knowledge, there is still no reported demonstration of interspecific hybridization in the Tabebuia alliance by molecular markers. H. heptaphyllus are used considered as a subspecies of H. impetiginosus [13], suggesting a close relationship between these two species. Although it is unclear whether the mixed information belongs to another species and occurs naturally, our results increased the possibility of interspecific hybridization. Moreover, our results may attract attention from scientists working in evolutionary studies and breeding programs, and may explain the complex phenotypic variation of commercial variety in the Tabebuia alliance.
Cultivars are also important sources of germplasm for further breeding. Here, we assessed the genetic diversity of each taxon, thus providing the first evaluation of breeding resources in the Tabebuia alliance in China. The taxonomic system of Tabebuia is very complex and the subspecies information has never been taken seriously in China. In this study, we can find distinct subgroups within species, which provides some important information. For example, there may be different subspecies of H. chrysanthus trading in China, and most cultivars belong to the subgroups as references samples of F2 and F15.
The genetic diversities of natural populations of T. aurea, T. rosea, and H. chrysotrichus have been reported. In previous reports, the F-values (fixation index) in Southern American populations usually range from −0.05 to 0.12 [14,43]. In our analyses, F-values for all taxa were negative and much lower (−0.2599 to −0.7864) than in previous reports, suggesting excessive heterozygosity due to negative assortative mating or artificial selection [44,45], or a breeding result with a very low number of individuals derived from the different Chinese cultivars. China is located outside of the native range of Tabebuia species and lacks material for phylogenetic studies. Although the classified samples could potentially be used to simulate natural populations for species-level comparisons, studies in phylogenetics require confirmation based on analyses of additional samples that include more species and are collected from within the native range of Tabebuia. Our work only explained the genetic status of the commercial plants and the findings also emphasize the importance of continuous introduction for further study or breeding programs in China.
Fingerprints can often effectively distinguish plant germplasms, a process that may be automated via custom arrays [19,46]. The identification of loci suitable for fingerprint construction may be beneficial for design patents and the resolution of commercial disputes [47,48]. We identified high-quality molecular markers and indicated their availabilities at different levels. Based on rigorous selection, 466 loci can be used to separate pairs of groups, whereas 738 loci can be used to separate species pairs within groups. Moreover, the combination of these loci can distinguish the six study species. Additionally, SNPs describing intraspecific diversity have rarely been reported for Tabebuia species, and no quality evaluations have been conducted. Our analyses provided numerous optional markers for species tracing and for fingerprinting of the varieties. The concise fingerprint sets an example of practical applications, which could be extended by adding selected loci when more cultivars are included.
5. Conclusions
Our study represents the first attempt to identify Tabebuia cultivars from a genome-wide perspective. We identified 73,219 SNPs using GBS, analyzed the phylogenetic background of 82 cultivars, and obtained abundant high-quality molecular markers for fingerprinting. We clarified the background of commercial cultivars in China, as well as a suspected hybrid between H. impetiginosus and H. heptaphyllus. We observed obvious excessive heterozygosity in China, which may explain the genetic basis of “novel-preferred” selection in ornamental plants or the narrow genetic background. Finally, we obtained numerous high-quality molecular markers for cultivar identification. Our results will serve as an important technical resource for both genetic studies and judicial decisions involving Tabebuia species.
Supplementary Materials
The following supporting information can be downloaded at: https://www.mdpi.com/article/10.3390/f14020271/s1, NCBI at Sequence Read Archive (SRA): SUB12496781. Table S1: High-quality loci could be used for distinguish different groups; Table S2: High-quality loci could be used for distinguish different species in each group; Table S3: High-quality loci could be used for distinguish cultivar in H. chrysanthus; Table S4: High-quality loci could be used for distinguish cultivar in H. chrysotrichus; Table S5: High-quality loci could be used for distinguish cultivar in H. heptaphyllus; Table S6: High-quality loci could be used for distinguish cultivar in H. impetiginosus; Table S7: High-quality loci could be used for distinguish cultivar in T. aurea; Table S8: High-quality loci could be used for distinguish cultivar in T. rosea; Table S9: High-quality loci could be used for distinguish cultivar in hybrids/unknow species population; Table S10: 54 SNPs used for constructing fingerprints.
Author Contributions
Conceptualization, J.M. and Y.Z.; data curation, J.M.; formal analysis, J.M. and R.L.; funding acquisition, J.M.; investigation, Y.W., R.L. and Z.L.; methodology, J.M., Y.Z. and R.L.; project administration, Y.Z.; resources, Y.W., R.L. and Z.L.; software, J.M.; supervision, C.Z.; validation, Y.Z.; visualization, R.L.; writing—original draft, J.M.; writing—review & editing, J.M., Y.Z., Y.W. and C.Z. All authors have read and agreed to the published version of the manuscript.
Funding
This research was funded by Fundamental Research Funds for the Central Non-profit Research Institution of CAF (CAFYBB2020SY021) and Funding by Science and Technology Projects in Guangzhou (SL2022A04J00896).
Data Availability Statement
Not applicable.
Acknowledgments
We thanks to Chunyang Lu, Kunkun, Zhao, Tianyi Liu and Zhirui Fang, as well as Tropical Arboretum of Chinese academy of forestry, South China Agricultural University, Guangzhou International Biological Island, South China National Botanical Garden, Arboretum of Guangdong province for assistance of materials collected or experiments.
Conflicts of Interest
The authors declare no conflict of interest.
References
- Dos Santos, G.; Miller, R.B. Wood anatomy of Tecomeae. Flora Neotrop. Monogr. 1992, 25, 336–358. [Google Scholar]
- Gentry, A.H. A revision of Tabebuia (Bignoniaceae) in Central America. Brittonia 1970, 22, 246–264. [Google Scholar] [CrossRef]
- Dos Santos, S.R. A atual classificação do antigo gênero Tabebuia (Bignoniaceae), sob o ponto de vista da anatomia da madeira. Balduinia 2017, 58, 10–24. [Google Scholar] [CrossRef]
- Grose, S.O.; Olmstead, R.G. Evolution of a Charismatic Neotropical Clade: Molecular Phylogeny of Tabebuia s. l., Crescentieae, and Allied Genera (Bignoniaceae). Syst. Bot. 2007, 32, 650–659. [Google Scholar] [CrossRef]
- Grose, S.O.; Olmstead, G.R. Taxonomic revisions in the polyphyletic genus Tabebuia s. l. (Bignoniaceae). Syst. Bot. 2007, 3, 660–670. [Google Scholar] [CrossRef]
- Muñoz-Flores, H.J.; Castillo-Quiroz, D.; Castillo-Reyes, F.; Sáenz-Reyes, J.T.; Avila-Flores, D.; Rueda-Sánchez, A. Potential Areas for Commercial Timber Plantations of Tabebuia rosea (Bertol.) DC. in Michoacan, Mexico. Open J. For. 2017, 7, 48–57. [Google Scholar]
- Gentry, A.H. Bignoniaceae: Part II (Tribe Tecomeae) (Flora Neotropica); The New York Botanical Garden Press: New York, NY, USA, 1992; pp. 1–370. [Google Scholar]
- Ayala-Silva, T.; Meerow, A.W.; Goenaga, R.; Irish, B. Ornamental plant germplasm exploration in tropical forests of Puerto Rico. Proc. Fla. State Hort. Soc. 2017, 120, 4–7. [Google Scholar]
- Zhang, P.; Wu, Z.; Fang, L.; Zhang, G.; Zhu, L.; Shang, X. Analyses of Growth Adaptability of Five Tabebuia Species. Eucalypt Sci. Technol. 2018, 35, 37–40. [Google Scholar]
- Jing, Z.; Shaobo, L.; Bing, S.; Shuixing, L.; Yong, C.; Guozheng, S.; Ke, Z. Flowering phenology and flower morphology of Handroanthus chrysantha. J. Zhejiang A F Univ. 2017, 34, 759–764. [Google Scholar]
- Zhang, J.; Li, R.; Meng, J.; Zhang, Y.; Zhong, C.; Abecasis, G. Phenotypic Variation and Genetic Diversity of Leaves Traits of Tabebuia and Handroanthus (Bignoniaceace) in China. Bull. Bot. Res. 2021, 41, 851–861. [Google Scholar]
- Jin, H.; Dai, J.; Huang, G.; Chen, Z.; Songyi, H. Germplasm Resources of Tabebuia and Handroanthus in South China: Morphology and Molecular Identification. Chin. Agric. Sci. Bull. 2019, 35, 36–41. [Google Scholar]
- Mattos, J.D. Handroanthus, um novo gênero para os “ipês” do Brasil. Loefgrenia 1970, 50, 1–4. [Google Scholar]
- Braga, A.C.; Reis, A.M.M.; Leoi, L.T.; Pereira, R.W.; Collevatti, R.G. Development and characterization of microsatellite markers for the tropical tree species Tabebuia aurea (Bignoniaceae). Mol. Ecol. Notes 2007, 7, 53–56. [Google Scholar] [CrossRef]
- Morillo, E.; Buitron, J.; Limongi, R.; Vignes, H.; Argout, X. Characterization of Microsatellites Identified by Next-Generation Sequencing in the Neotropical Tree Handroanthus billbergii (Bignoniaceae). Appl. Plant Sci. 2016, 4, 1500135. [Google Scholar] [CrossRef] [PubMed]
- Sobreiro, M.B.; Vieira, L.D.; Nunes, R.; Novaes, E.; Coissac, E.; Silva-Junior, O.B.; Grattapaglia, D.; Collevatti, R.G. Chloroplast genome assembly of Handroanthus impetiginosus: Comparative analysis and molecular evolution in Bignoniaceae. Planta 2020, 252, 91. [Google Scholar] [CrossRef]
- Ravishankar, K.V.; Bommisetty, P.; Bajpai, A.; Srivastava, N.; Mani, B.H.; Vasugi, C.; Rajan, S.; Dinesh, M.R. Genetic diversity and population structure analysis of mango (Mangifera indica) cultivars assessed by microsatellite markers. Trees 2015, 29, 775–783. [Google Scholar] [CrossRef]
- Yu, W.; Zhang, Y.; Xu, X.; Zhong, C.; Wei, Y.; Meng, J.; Chen, Y.; Li, Z.; Bush, D. Molecular markers reveal low genetic diversity in Casuarina equisetifolia clonal plantations in South China. New For. 2020, 51, 689–703. [Google Scholar] [CrossRef]
- Kishor, D.S.; Song, W.; Noh, Y.; Lee, G.P.; Park, Y.; Jung, J.; Shim, E.; Chung, S. Development of SNP markers and validation assays in commercial Korean melon cultivars, using Genotyping-by-sequencing and Fluidigm analyses. Sci. Hortic. 2020, 263, 109113. [Google Scholar] [CrossRef]
- Wong, M.M.L.; Gujaria-Verma, N.; Ramsay, L.; Yuan, H.Y.; Caron, C.; Diapari, M.; Vandenberg, A.; Bett, K.E. Classification and Characterization of Species within the Genus Lens Using Genotyping-by-Sequencing (GBS). PLoS ONE 2015, 10, e122025. [Google Scholar] [CrossRef]
- Fagernäs, Z. Biogeography of Norway Spruce (Picea abies (L.) Karst.): Insights from a Genome-Wide Study; Department of Ecology and Environmental Sciences, Umeå University: Umeå, Sweden, 2017. [Google Scholar]
- White, O.W. Genomics of speciation and hybridisation in the Macaronesian endemic genus Argyranthemum (Asteraceae; Anthemideae). Doctoral Thesis, University of Southampton, Southampton, UK, 2018. [Google Scholar]
- Collevatti, R.G.; Dornelas, M.C. Clues to the evolution of genome size and chromosome number in Tabebuia alliance (Bignoniaceae). Plant Syst. Evol. 2016, 302, 601–607. [Google Scholar] [CrossRef]
- de Guerra, N.A.; Natera, J.R.M. Chromosome numbers of three Tabebuia species (Bignoiaceae). Nord. J. Bot. 2007, 25, 359–360. [Google Scholar] [CrossRef]
- Silva-Junior, O.B.; Grattapaglia, D.; Novaes, E.; Collevatti, R.G. Genome assembly of the Pink Ipê (Handroanthus impetiginosus, Bignoniaceae), a highly valued, ecologically keystone Neotropical timber forest tree. Gigascience 2018, 7, 1–16. [Google Scholar] [CrossRef] [PubMed]
- Pan, J.; Wang, B.; Pei, Z.-Y.; Zhao, W.; Gao, J.; Mao, J.-F.; Wang, X.-R. Optimization of the genotyping-by-sequencing strategy for population genomic analysis in conifers. Mol. Ecol. Resour. 2015, 15, 711–722. [Google Scholar] [CrossRef] [PubMed]
- Hall, D.; Zhao, W.; Wennström, U.; Andersson Gull, B.; Wang, X. Parentage and relatedness reconstruction in Pinus sylvestris using genotyping-by-sequencing. Heredity 2020, 124, 633–646. [Google Scholar] [CrossRef] [PubMed]
- Alexander, D.H.; Shringarpure, S.S.; Novembre, J.; Kenneth, L. Admixture 1.3 Software Manual; UCLA Human Genetics Software Distribution: Los Angeles, CA, USA, 2015. [Google Scholar]
- Goudet, J.; Jombart, T.; Kamvar, Z.N.; Archer, E.; Hardy, O. Package ‘hierfstat’. Estimation and Tests of Hierarchical F-Statistics. Available online: https://cloud.r-project.org/ (accessed on 13 October 2022).
- Thibaut, J.; Zhian, N.K.; Caitlin, C.; Roman, L.; Marie-Pauline, B.; Brian, J.K.; Peter, S.; Vladimir, M.; Klaus, S.; Tiago, M.; et al. Package ‘adegenet’. Exploratory Analysis of Genetic and Genomic Data. Available online: https://cloud.r-project.org/ (accessed on 26 January 2023).
- Bernet, G.P.; Bramardi, S.; Calvache, D.; Carbonell, E.A.; Asins, M.J. Applicability of molecular markers in the context of protection of new varieties of cucumber. Plant Breed. 2003, 122, 146–152. [Google Scholar] [CrossRef]
- Dendauw, J.; De Loose, M.; De Riek, J.; Van Bockstaele, E.; Leus, L. Variety protection by use of molecular markers: Some case studies on ornamentals. Plant Biosyst. Int. J. Deal. All Asp. Plant Biol. 2001, 135, 107–113. [Google Scholar] [CrossRef]
- Sunnucks, P. Efficient genetic markers for population biology. Trends Ecol. Evol. 2000, 15, 199–203. [Google Scholar] [CrossRef] [PubMed]
- Marulanda, M.L.; Ospina, C.M. Characterizing Tabebuia rosea (Bertol.) DC. Using Microsatellites in Provenance and Progeny Trials in Colombia. In Molecular Approaches to Genetic Diversity; IntechOpen: London, UK, 2015. [Google Scholar] [CrossRef]
- Meyer-Sand, B.R.V.; Blanc-Jolivet, C.; Mader, M.; Paredes-Villanueva, K.; Tysklind, N.; Alexandre, M.S.; Guichoux, E.; Degen, B. Development of set of SNP markers for population genetics studies of lpe (Handroanthus sp.), a valuable tree genus from Latin America. Conserv. Genet. Resour. 2018, 10, 779–781. [Google Scholar] [CrossRef]
- Feres, J.M.; Martinez, M.L.L.; Martinez, C.A.; Mestriner, M.A.; Alzate-Marin, A.L. Transferability and characterization of nine microsatellite markers for the tropical tree species Tabebuia roseo-alba. Mol. Ecol. Resour. 2009, 9, 434–437. [Google Scholar] [CrossRef]
- Elshire, R.J.; Glaubitz, J.C.; Sun, Q.; Poland, J.A.; Kawamoto, K.; Buckler, E.S.; Mitchell, S.E. A robust, simple genotyping-by-sequencing (GBS) approach for high diversity species. PLoS ONE 2011, 6, e19379. [Google Scholar] [CrossRef]
- Barros, M.G. Pollination ecology of Tabebuia aurea (Manso) Benth. & Hook. and T. ochracea (Cham.) Standl.(Bignoniaceae) in Central Brazil cerrado vegetation. Braz. J. Bot. 2001, 24, 255–261. [Google Scholar]
- Cordeiro, J.M.; Kaehler, M.; Souza, L.G.; Felix, L.P. Heterochromatin and numeric chromosome evolution in Bignoniaceae, with emphasis on the Neotropical clade Tabebuia alliance. Genet. Mol. Biol. 2020, 43, e20180171. [Google Scholar] [CrossRef] [PubMed]
- Lim, K.; Barba-Gonzalez, R.; Zhou, S.; Ramanna, M.S.; Van Tuyl, J.M. Interspecific hybridization in Lily (Lilium): Taxonomic and commercial aspects of using species hybrids in breeding. Floric. Ornam. Plant Biotechnol. 2008, 5, 146–151. [Google Scholar]
- Christov, M. Contribution of interspecific hybridization to sunflower breeding. Helia 2012, 35, 37–46. [Google Scholar] [CrossRef]
- Facciuto, G.; Coviella, A.; Bologna, P.; Pannunzio, M.J.; Soto, S. Hybridization between pink and yellow Tabebuia species native to Argentina (Bignoniaceae). VI Int. Symp. New Floric. Crops 2009, 813, 127–132. [Google Scholar]
- Rabaiolli, S.M.D.S. Propagação vegetativa e análise da diversidade molecular em Handroanthus chrysotrichus (MART. ex DC) J. Mattos. Doctoral Thesis, Universidade Federal de Santa Maria, Santa Maria, Argentina, 2019. [Google Scholar]
- Fernando, R.L.; Gianola, D. Rules for assortative mating in relation to selection for linear merit functions. Theor. Appl. Genet. 1984, 68, 227–237. [Google Scholar] [CrossRef]
- Miranda, A.C.; da Silva, P.H.; Moraes, M.L.; Lee, D.J.; Sebbenn, A.M. Investigating the origin and genetic diversity of improved Eucalyptus grandis populations in Brazil. For. Ecol. Manag. 2019, 448, 130–138. [Google Scholar] [CrossRef]
- Xu, C.; Ren, Y.; Jian, Y.; Guo, Z.; Zhang, Y.; Xie, C.; Fu, J.; Wang, H.; Wang, G.; Xu, Y.; et al. Development of a maize 55 K SNP array with improved genome coverage for molecular breeding. Mol. Breed. 2017, 37, 20. [Google Scholar] [CrossRef]
- Fang, W.; Meinhardt, L.; Tan, H.; Zhou, L.; Mischke, S.; Wang, X.; Zhang, D. Identification of the varietal origin of processed loose-leaf tea based on analysis of a single leaf by SNP nanofluidic array. Crop. J. 2016, 4, 304–312. [Google Scholar] [CrossRef]
- Tian, H.-L.; Wang, F.-G.; Zhao, J.-R.; Yi, H.-M.; Wang, L.; Wang, R.; Yang, Y.; Song, W. Development of maizeSNP3072, a high-throughput compatible SNP array, for DNA fingerprinting identification of Chinese maize varieties. Mol. Breed. 2015, 35, 136. [Google Scholar] [CrossRef]


Disclaimer/Publisher’s Note: The statements, opinions and data contained in all publications are solely those of the individual author(s) and contributor(s) and not of MDPI and/or the editor(s). MDPI and/or the editor(s) disclaim responsibility for any injury to people or property resulting from any ideas, methods, instructions or products referred to in the content. |
© 2023 by the authors. Licensee MDPI, Basel, Switzerland. This article is an open access article distributed under the terms and conditions of the Creative Commons Attribution (CC BY) license (https://creativecommons.org/licenses/by/4.0/).