Article

Tree Growth and Vegetation Diversity in Northern Idaho Forest Water Reclamation Facilities

1
Environmental Science Program, College of Natural Resources, University of Idaho, Moscow, ID 83844, USA
2
Department of Forest, Rangeland and Fire Sciences, College of Natural Resources, University of Idaho, Moscow, ID 83844, USA
*
Author to whom correspondence should be addressed.
Forests 2023, 14(2), 266; https://doi.org/10.3390/f14020266
Submission received: 31 December 2022 / Revised: 24 January 2023 / Accepted: 27 January 2023 / Published: 30 January 2023
(This article belongs to the Section Forest Ecology and Management)

Abstract

:
Forest water reclamation can improve tree growth and renovate municipal wastewater. Although there are indications that long-term application may exceed forest assimilation capacity, there is limited information on the long-term effects of reclaimed water application on coniferous ecosystems. The purpose of our study was to assess the impacts of prolonged reclaimed water application on forest growth responses and vegetation diversity. We examined the effects of reclaimed water at five water reuse facilities established between 1978 and 2013 in a four-decade time series. We collected tree cores and stem measurements to determine current and retrospective increments. We assessed plant diversity with vegetation surveys. The greatest diameter response observed for reclaimed water amendment compared to controls was 166.1% for western redcedar, while Douglas-fir increased up to 116.4% and ponderosa pine increased up to 100.6%. The minimum response observed was 30.3%. Current annual increments showed that the basal area and volume were significantly greater at long-established facilities for reclaimed-water-amended plots. The understory vegetation diversity declined with application time, while overstory vegetation diversity increased with application time. We conclude that reclaimed water can be a valuable resource to improve forest productivity, but continued application without stocking control may have detrimental effects on forest growth and vegetation diversity.

1. Introduction

Reclaimed water is a byproduct of human society that can serve as a reliable resource to enhance forest growth and production. Coniferous forest growth in the western United States is limited by water and nutrient resources [1,2]. Regionally, summer drought imposes significant restrictions in water availability, which can be alleviated through supplemental irrigation [3]. Nutrients such as nitrogen (N) and phosphorus (P) also substantially limit the productivity of coniferous forests [4,5,6]. Amendments to overcome forest nutrient limitations typically involve one-time, high-dose fertilizer applications [7,8], yet regular low doses of supplemental nutrients that match nutrient demand can improve growth by two- or three-fold [9,10,11,12]. Moreover, regular low dose amendments supplied during the growing season can significantly increase nutrient retention and restrict ecosystem losses [13]. Providing supplemental water and nutrient resources through land application of reclaimed water offers the opportunity to overcome forest resource limitations, improve the inherent productivity potential of regional forests and renovate wastewater to return it safely to the environment.
Forest water reclamation (FWR) using land application systems is a well-established, environmentally sound and cost-effective approach for managing and renovating wastewater globally [14,15,16]. Land application systems are prominent in smaller communities where the construction of tertiary wastewater treatment plants is not financially and technologically feasible. In such communities, low-cost lagoons are utilized [1], and tertiary treatment is achieved using established native vegetation and soil that act as natural filters to trap and assimilate the applied nutrients and contaminants [17]. FWR has been widely accepted as an effective disposal method with environmental benefits [18,19]. It helps to reduce nutrient loads, particularly in areas where surface waters are sensitive to nutrient additions [20,21]. Many municipal water reuse facilities in the U.S. annually apply reclaimed water at forested facilities during dry summer months. During winter, these facilities either reserve wastewater in lagoons for summer land application or dispose of it into surface waters when permitted. Diversion to land application is often preferred due to strict water quality standards and discharge regulations designed to protect surface water resources. The alternative includes various artificial nutrient removal processes that can be rigorous and costly.
Reclaimed water containing constituent nutrients is effective in stimulating tree growth [17,22,23], which also provides economic opportunities [17]. Various deciduous and coniferous forest ecosystems have shown an increased tree growth response to reclaimed water application [3,19,24,25,26]. Timber harvesting is one of the predominant economic activities in the Pacific Northwest region [27]. Forest water reclamation provides an opportunity to analyze the maximum growth potential of western coniferous forests by alleviating growth limitations and to explore the upper limits of forest productivity for high-value timber species in the Inland Northwest.
While forests are considered to be benign repositories for nutrient storage, potential environmental risks of land application have also been identified. Detrimental impacts include a decline in forest productivity, tree mortality, altered community structure, nutrient leaching, and detrimental effects on soil physical, chemical and biological health [28,29,30,31,32,33,34]. Reclaimed water application can also dramatically change understory species composition with weed invasion as a potential indicator of nitrogen saturation [19]. Irrigation with reclaimed water can lead to a highly productive herb–shrub layer understory that exists in more mesic conditions. However, plant diversity has been found to significantly decline with opportunistic species dominating the perennial herb–shrub layer vegetation and simplifying the community [35]. In addition, abundant water and nutrients during the growing season may lead to denser overstory canopies, which intercept nutrient and light resources and result in an overall decline in understory species diversity [36,37,38], which plays an important role in the structure and function of forest ecosystems [39,40,41,42].
Scores of water reuse facilities have been practicing forest water reclamation for decades in northern Idaho. Yet, there have been no attempts to understand the facility-specific long-term effects of reclaimed water amendment on tree growth and vegetation diversity. Most of the existing studies on the effects of land application of reclaimed water are decades old and short-term. These require continued investigation to understand the long-term implications for forest ecosystems and environmental quality. Our forest water reclamation study presents a unique opportunity to assess forest responses using a time series of regional water reuse facilities with the longest operation time being over 40 years. We were able to assess the benefits and implications of forest water reclamation on regional conifer forest growth and diversity at decadal time-scales using tools in dendrochronology that allow retrospective assessment of ecosystem dynamics with tree-ring records of site conditions over an extended time and that can be valuable in forest management [43,44]. We also used vegetation diversity surveys to assess changes in species composition in response to wastewater irrigation [19], providing insight into long-term community-level changes in the forest ecosystem.
Our main objectives were to assess facility-specific growth responses using dendrochronology [43,44,45] and to investigate vegetation diversity responses to long-term reclaimed water application. Our secondary objectives were to compare the impacts of various lengths of treatment with permitted loading rates at five different forest water reclamation facilities with varying dates of establishment. We hypothesized that regular low doses of growing-season nutrient and water amendment will result in enhanced tree growth. We also hypothesized that vegetation diversity will decline with increasing length of application.

2. Materials and Methods

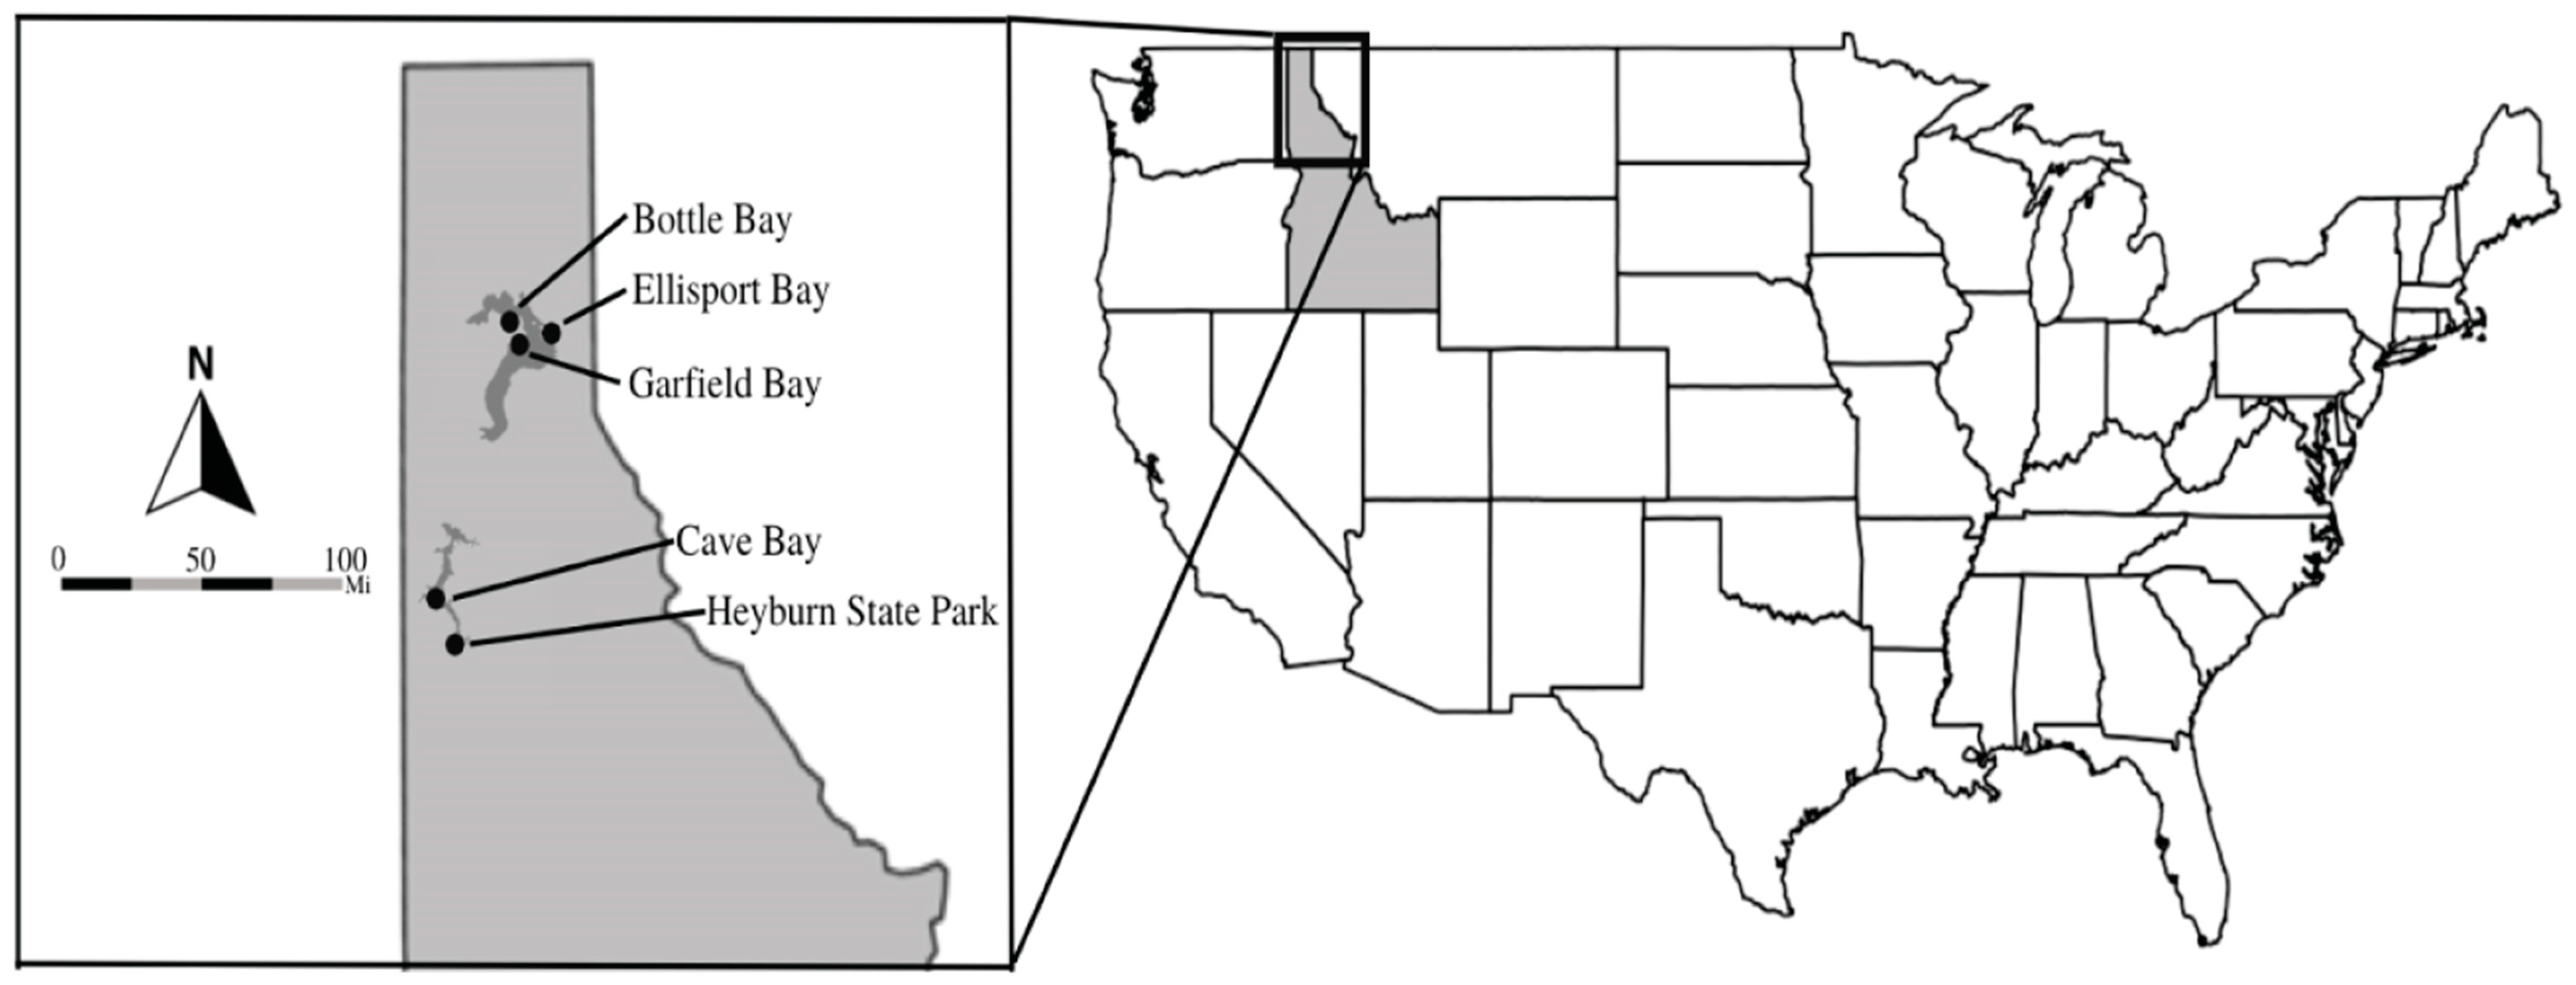
2.1. Study Facilities

The study was conducted at five water reuse facilities situated along Lake Coeur d’Alene and Lake Pend Oreille in northern Idaho, United States (Figure 1). All facilities were established between 1978 and 2013 to create a four-decade time series (Table 1). To determine reclaimed water treatment effects on forest growth, five one-tenth-acre measurement plots were established in management units at each of the five study facilities along with five adjacent control plots (n = 50, Figure A1 and Figure A2). Where possible, the control plots selected had comparable soil, stand composition and structure as the treatment plots. The treatment and control plots were established at locations with no more than a 5% slope.
Soils varied between facilities (Table 2). Soils at each of the Pend Oreille facilities (Garfield Bay, Bottle Bay and Ellisport Bay) contained the same soil series, which is characterized by parent material of volcanic ash and/or loess over till derived from granite and/or metamorphic rock. The soils are well drained, and the ecological sites are ashy over loamy, glassy over mixed, superactive, frigid Alfic Udivitrands [46]. Heyburn State Park soils are moderately well drained, and the ecological site is warm frigid, xeric, unglaciated, loamy and fragipans. Soils at Heyburn facility are fine-silty, mixed, superactive, frigid Vitrandic Fragixeralfs [46]. Cave Bay soils are well drained, and the ecological site is warm mesic, xeric and unglaciated [46].
Reclaimed water containing constituent N and P was applied at the discretion of facility managers ranging from daily to weekly frequencies during the growing season. Average hydraulic loading among the facilities was 30 cm yr−1, while average constituent nutrients were applied at 37 kg N ha−1 yr−1 and 14 kg P ha−1 yr−1. Since each facility was established on different dates cumulative loads in 2019 ranged from 168 kg N ha−1 and 79 kg P ha−1 at Cave Bay (est. 2013) to 1752 kg N ha−1 and 563 kg P ha−1 at Garfield Bay (est. 1978).

2.2. Stand Parameters

Individual tree diameter at breast height (DBH) was measured for each tree over 2.5 cm (1 in) diameter in each of the 0.04 ha (1/10th acre) study plots (n = 10 at each facility). Tree DBH measurements were collected in Fall 2019 and 2021. Initial 2019 DBH was used to calculate stand-level estimates of various forestry parameters. Plot basal area (BA) was calculated using Equation (1):
BA = i = 1 t 0.00007854 × DBH i 2
where BA is the basal area per hectare, t is the number of trees in the plot and 0.00007854 is a forester’s constant for metric units [47]. Quadratic mean diameter (QMD)in centimeters was calculated using Equation (2):
QMD = BA TPH 0.00007854 .
where TPH is the number of trees per hectare [48] and Stand Density Index (SDI) was computed using Equation (3) [49]:
SDI = TPH × QMD 25.4 1.605 .
Tree heights were measured in Fall 2019 where feasible. We predicted within- and between-year heights for unmeasured trees using height–DBH regression models from measured trees [50,51] for the main purpose of calculating volume. Tree volumes were estimated as the product of DBH squared, height and species-specific taper coefficients [51]. Plot level diameter increment, basal area increment and volume increment between 2019 and 2021 were determined and expressed as annual increments.

2.3. Tree-Ring Width Data and Series Chronologies

Tree cores were collected in Fall 2019. All tree species occurring within each circular plot were cored at breast height using a 4.3 mm increment borer. Cores from two trees per species were collected from each DBH class present in every plot. The cores were air-dried, mounted, sanded, polished and scanned at 2400 dpi resolution. The scanned images were examined using WinDENDRO software package (Regent Instruments Inc., Quebec, QC, Canada). WinDENDRO is a semi-automatic image analysis program that requires manual adjustment of ring boundaries to account for growth anomalies [52]. To ensure that all the rings were accurately detected, each ring width was analyzed. Where necessary, missing rings were added, and false rings were removed manually. Accurate ring width chronologies were developed using crossdating, which involved matching ring width patterns across trees at each facility.
Statistical accuracy of crossdating was checked using the COFECHA program, which created a master chronology of tree rings and calculated correlation coefficients to indicate how well the interannual variability in the ring widths for any one core correlated with the other ring widths within the series [43,44,52,53,54,55]. Bark thickness was measured for all of the cored trees and estimated for unmeasured trees using a species-specific, DBH-based regression model computed for measured trees [56]. Diameter inside bark (DIB) was determined by subtracting the bark thickness. DIBs for the cored trees were calculated every five years from ring width analysis. Differences between consecutive 5-year DIB measurements were used to determine diameter increments. Plot level mean diameter increment (DI) and basal area increment (BAI) were calculated for each facility. We did not determine height or volume increments from tree-ring data due to unknown stocking and the uncertainty of predicting retrospective heights from measured height–DBH regression models.

2.4. Understory Vegetation Survey and Biomass

2.4.1. Understory Vegetation Survey

The understory shrub and herb layer species were assessed in early summer 2020 to correspond with peak flowering. Four one-meter-square sampling quadrats were established by randomly locating quadrats at either 2 m or 5 m distance from the plot center along four transects in each cardinal direction (N, S, E, W). Within each sampling quadrat, shrub and herb layer composition were determined by identifying and counting individual plants to species level. Both shrub and herb layer species composition were documented with floristic voucher specimens of herb layer species archived at Stillinger Herbarium, University of Idaho, Moscow, ID. Based on the abundance of understory species including shrubs and forbs, species richness, Shannon–Wiener diversity index and Pielou’s evenness were calculated at the plot level [57]. Species richness (S) was estimated using Equation (4):
S = Σ n
where n is the total number of species documented across four sampling quadrats in each plot. Shannon–Wiener diversity index (H) was estimated using Equation (5):
H = i = 1 S p i ln p i
where ln pi is the natural logarithm of the i-th species proportion. Pielou’s evenness (J) was estimated using Equation (6):
  J = H ln S .

2.4.2. Understory Vegetation Biomass

The herbaceous vegetation in three one-meter-square sampling quadrats was collected in every study plot. Stem diameters for shrubs and seedlings (DBH < 2.5 cm) within the quadrats were measured using a caliper and representative samples of the measured shrubs and seedlings (n = 8–12) were collected. Allometric equations of dry mass (DM) and caliper measurements were developed to determine dry mass from caliper measurements for samples that were not destructively harvested. Mass from harvested samples and estimated shrub DM were summed for each quadrat and plot-level averages were calculated.

2.5. Statistical Analysis

Analysis of variance was performed on initial stand parameters as dependent response variables in a two-way factorial model that included treatment and facility as class variables. Dependent variables included plot-level mean diameter increment, basal area increment, total volume increment, understory vegetation biomass, Shannon–Wiener diversity index, richness, and evenness. Analysis of covariance was performed on growth increments as dependent variables with facility, treatment and species included as independent class variables. Initial values for each increment were included as covariates in their respective models. If normality and homoscedasticity assumptions for analysis of variance were not met, data were transformed [58] prior to analysis. Differences were considered significant at α = 0.05. Tukey’s pairwise comparisons were performed to compare least square means between the control and treatment at the five reuse facilities. Statistical analyses were conducted in R version 4.2.1 [59].

3. Results

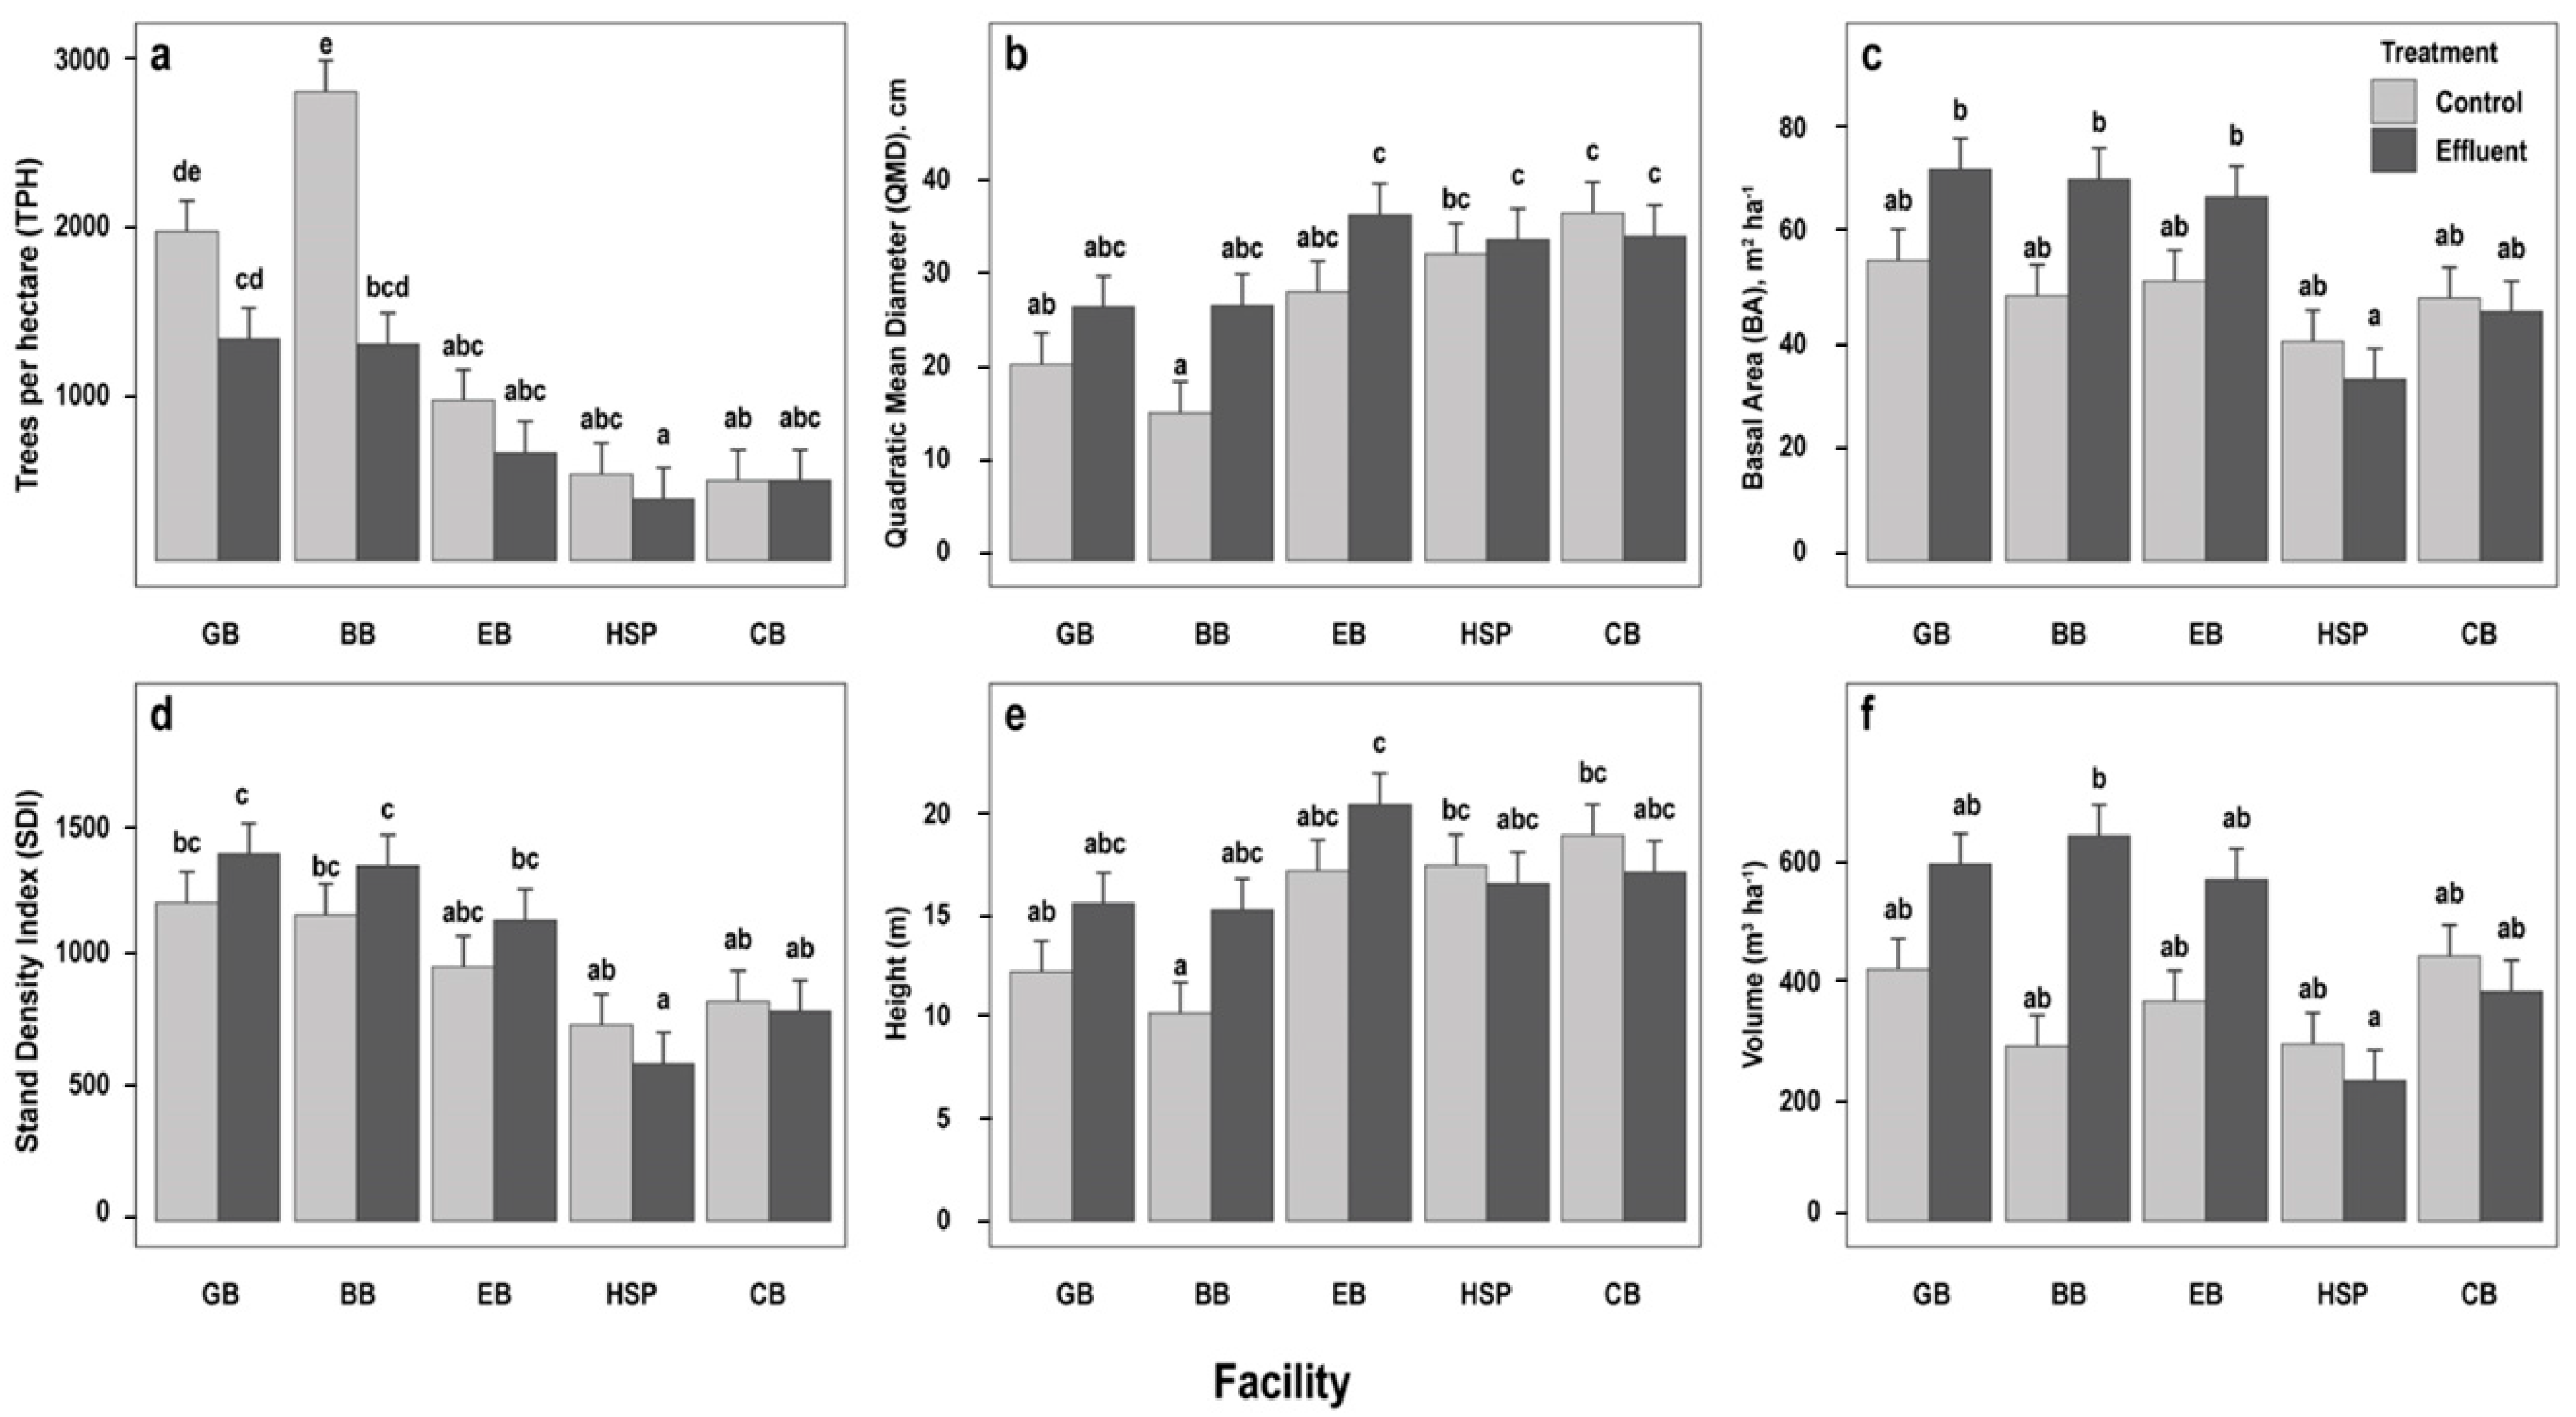
3.1. Initial Stand Parameters

Initial stand metrics following establishment indicate some structural differences among facilities and between effluent stands in FWR management units and adjacent control stands at each FWR facility. Facilities explained more of the variation in stand variables than treatment differences did (Table 3, F-statistic for F > F-statistic for T). Although, effluent stands in comparison to controls had greater quadratic mean diameter (QMD), basal area (BA), mean height and total stand volume (Table 3, T, p ≤ 0.05; Table 4; Figure 2), the stand density index (SDI) was equal (T, p = 0.26), and trees per hectare (TPH) were lower (T, p < 0.01). These results indicate that tree size was consistently greater in effluent plots, but measures of density were ambiguous. Additionally, the response of TPH to treatment depended upon the facility (Table 3, T × F, p < 0.01; Figure 2a). Due to the in-growth of many saplings in control plots, TPH at establishment was 54% higher in Bottle Bay control plots than in effluent irrigated plots. TPH in Cave Bay effluent plots were equal to the controls. When all locations were combined, there was a greater number of small diameter trees in control plots, but there was a lower number of large diameter trees in controls (Figure 3).

3.2. Estimated Historic Diameter Increment Responses from Tree Cores (DIc)

3.2.1. DIc Responses across Facilities

Cored tree diameter increment (DIc) for increment periods 2014–2018, 2009–2014 and 2004–2009 varied by tree diameter, treatment, species and facility (Table 5). The effect of variable diameter among trees, treatments and facilities was effectively accounted for in the model by including initial diameter (D0) in the model (Table 5, F > 83, p < 0.01). Historic diameter increments for the effluent plots were notably higher compared to the control plots (Figure 4) for each of the increment periods at all facilities except at Garfield Bay. DIc at the Bottle Bay effluent plot for both the 2014–2018 and 2009–2014 increment periods were, respectively, 70.6% and 89.9% greater than the control (Figure 4a,b). Similarly, DIc at Ellisport Bay was approximately 45.8% greater in effluent plots for the 2014–2018 increment period and 108.3% greater for 2009–2014. A similar increase was observed for recently established facilities in 2014–2018 with a 99.4% greater response in effluent plots at Heyburn State Park and a 108.8% greater response at Cave Bay. There was a 63.1% increase in diameter increment at effluent plots in Heyburn State Park in 2009–2014. In 2004–2009, greatest differences in diameter increment were observed at Ellisport Bay with a 382.6% increase at effluent plots compared to the controls (Figure 4c). The diameter increment was 65.9% greater at the Bottle Bay effluent plots. In contrast, there was a 3% decrease in diameter increment at the Garfield Bay effluent plots compared to the controls.

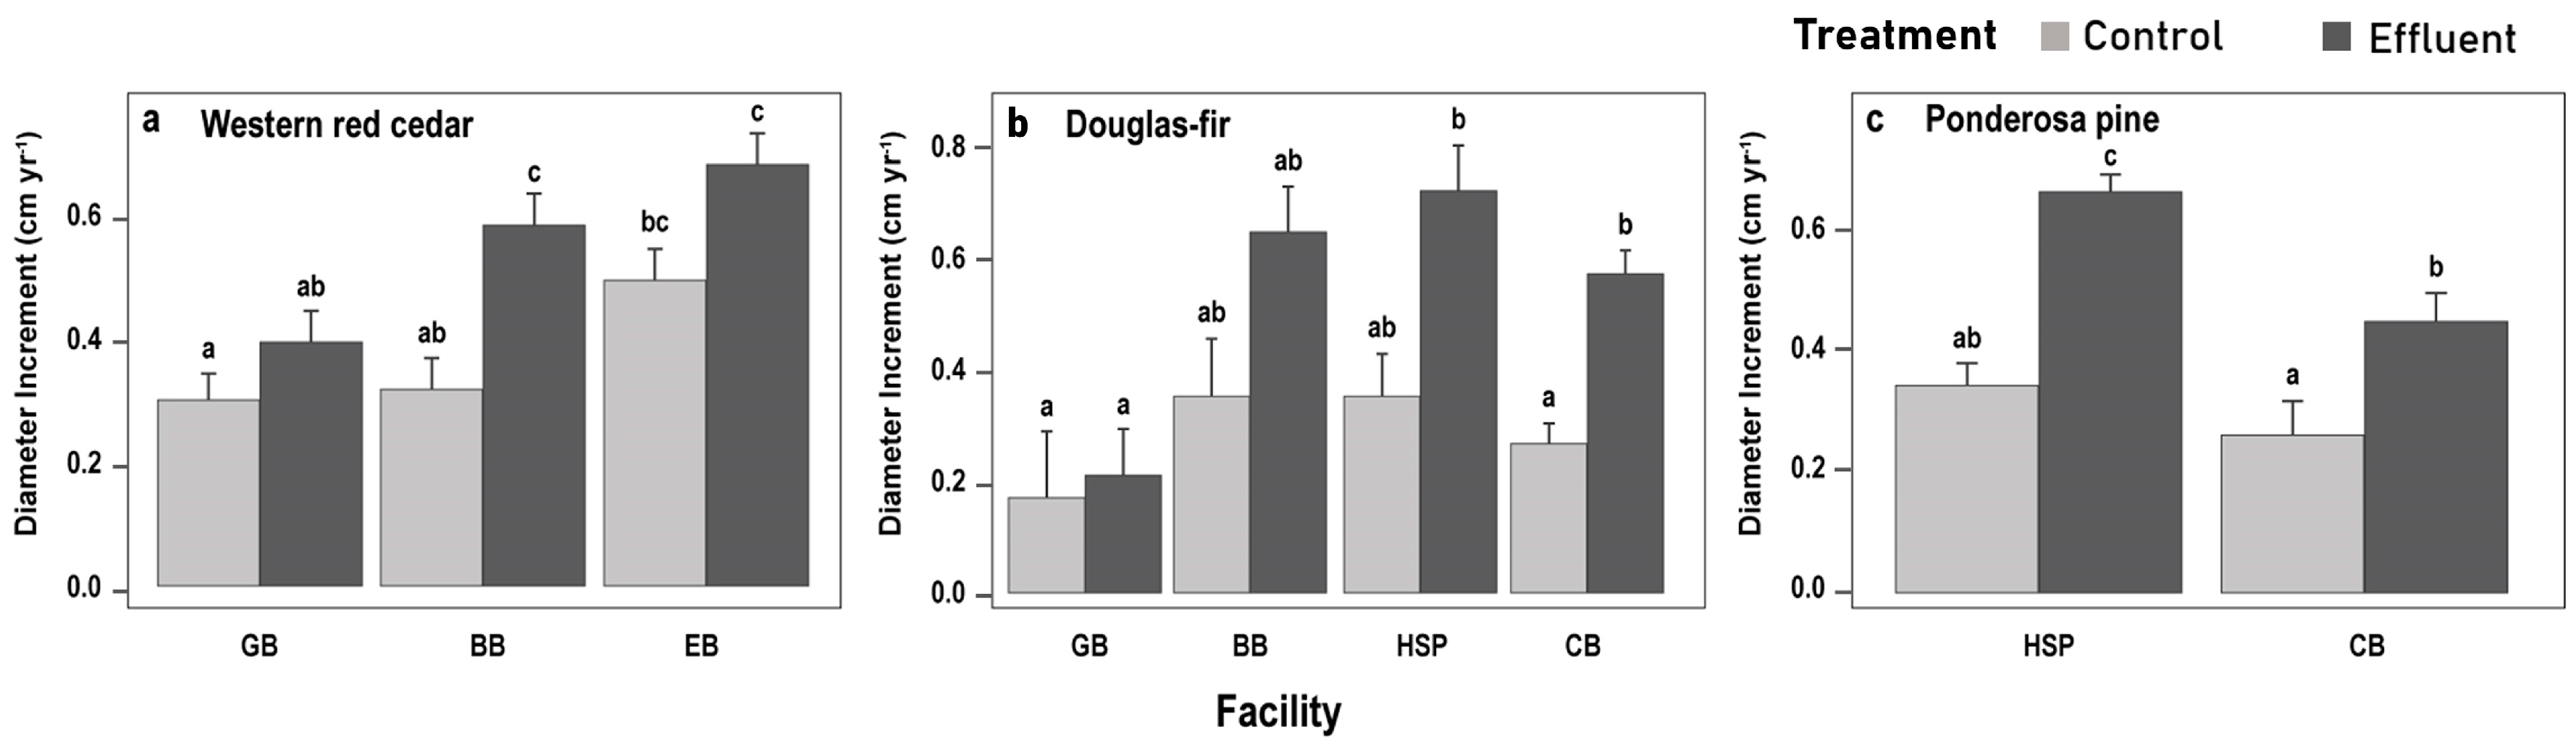
3.2.2. Species-Specific DIc Responses

DIc responses to reclaimed water depended upon the species, facility, and treatment (Table 5). Although tree growth declined over time, the diameter increments at Ellisport Bay and Bottle Bay was significantly enhanced with the onset of reclaimed water application (Figure 5c,d). The diameter increments for effluent plots for western redcedar were 41.6% at Garfield Bay, 86.0% at Bottle Bay and 59.8% at Ellisport Bay of that in control plots (Figure 6a). The treatment difference in diameter increment for western redcedar was not statistically significant at Garfield Bay. The diameter increments for Douglas-fir at Bottle Bay, Heyburn State Park and Cave Bay were significantly greater for effluent plots compared to the unamended control plots (Figure 6b). Bottle Bay had a 69.9%, Heyburn State Park had a 113.6% and Cave Bay had a 116.4% greater diameter response to reclaimed water application compared to controls. The 30.3% difference at Garfield Bay was not statistically significant. The diameter increment responses were significantly greater in reclaimed-water-amended ponderosa pine stands where they increased by 100.6% at Heyburn State Park and by 50.8% at Cave Bay compared to control plots (Figure 6c).

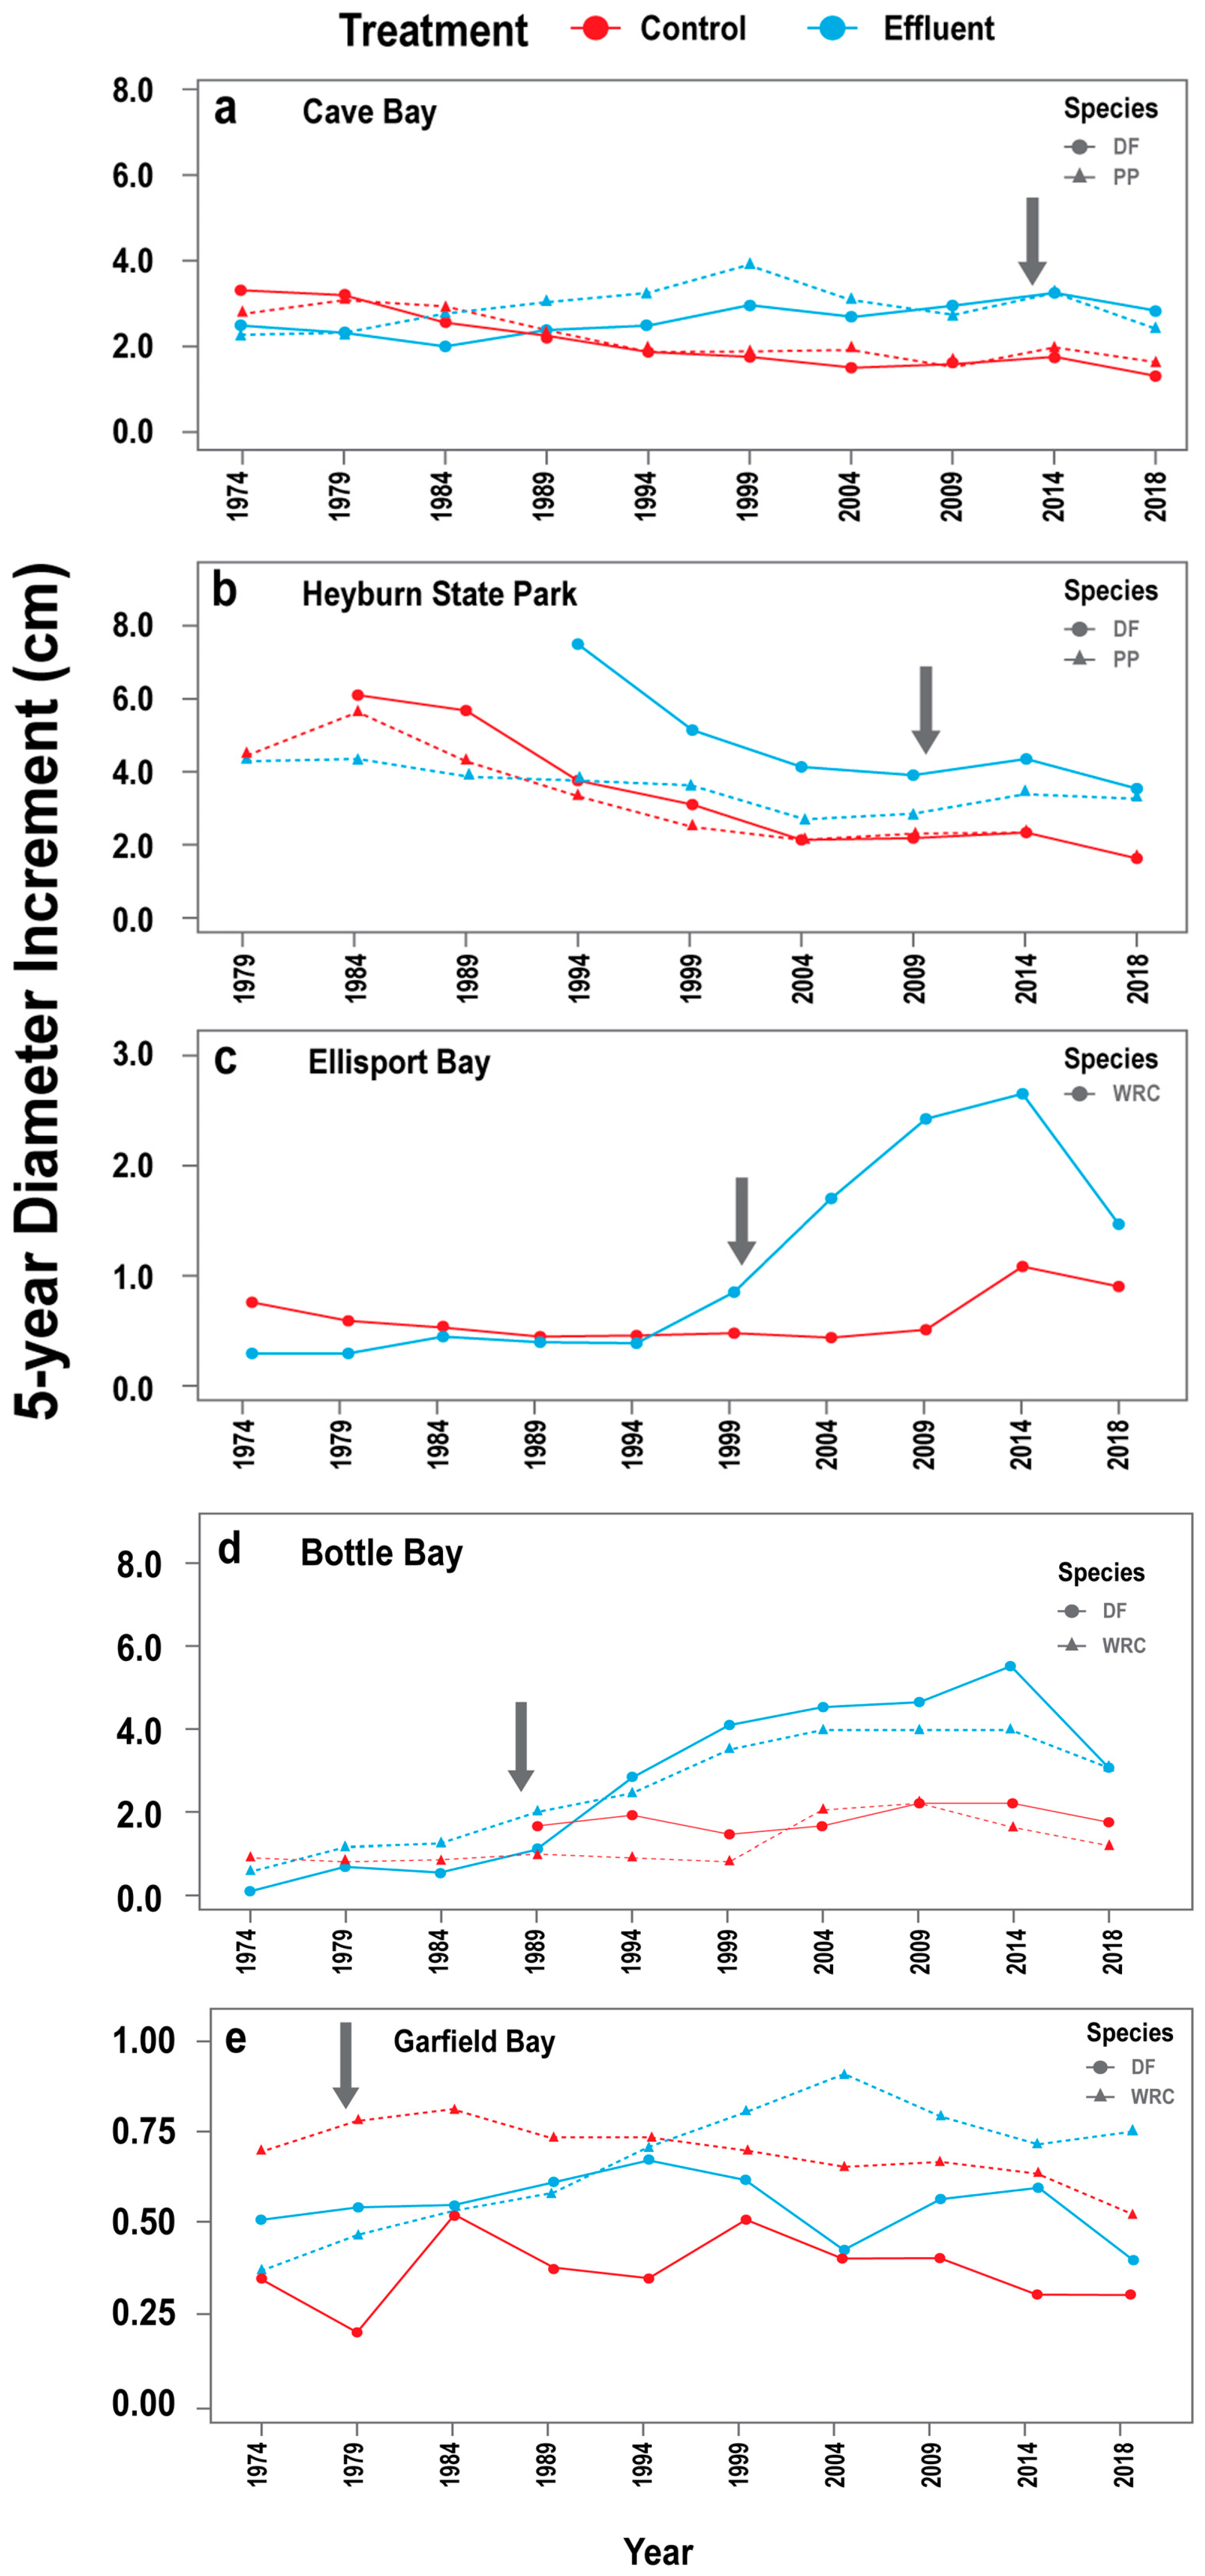
3.3. Growth Increments during Study Period

The growth increment determined from the DBH, and height measurements collected during the study period (2019–2021) varied by initial measurements, treatment, and facility (Figure 7). As with tree core increments, diameter increment (DI) was highly dependent upon the initial diameter (Table 6, D0, F = 230). Including initial values in the model accounted for the effect of diameter when testing for treatment and facility effects. The DIs for the reclaimed-water-amended plots were consistently higher compared to the unamended controls (Figure 7a). The differences were significantly greater at Heyburn State Park, where effluent plots had an approximately 118.4% greater diameter growth than control plots, while DI treatment responses at other facilities were much lower (Table 6, TxF, p < 0.01).
Basal area increment and volume increment varied by both treatment and facility (Figure 7b,c). Basal area increment and volume increment were consistently higher in reclaimed-water-amended plots compared to the controls (Table 6, T, p < 0.01) and neither depended on facility (Table 6, TxF, p > 0.71). Basal area increments for effluent compared to control plots were 85.2% greater at Garfield Bay and 93.6% greater at Ellisport Bay. Similarly, volume increments in effluent plots compared with control plots were 142.9% greater at Garfield Bay, 77.7% at Bottle Bay and 147.4% at Ellisport Bay.

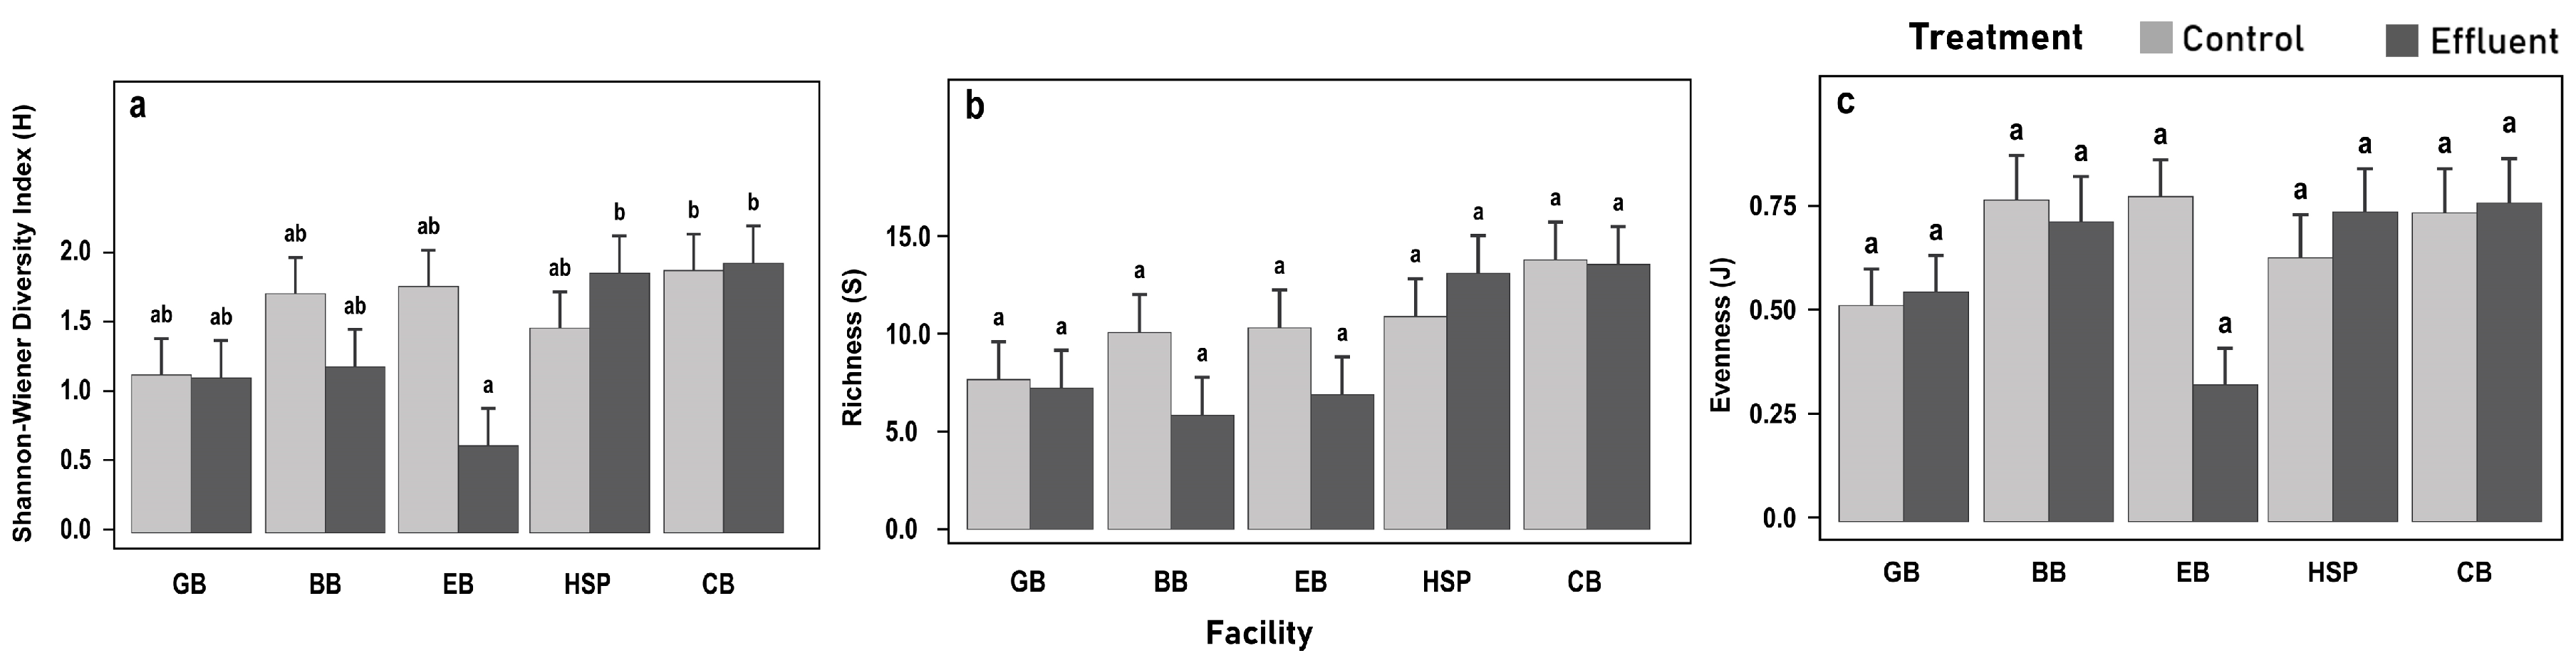
3.4. Understory Vegetation Biomass and Diversity Responses

The understory vegetation biomass, Shannon–Wiener diversity index and richness for understory species varied by facility (Table 7, Figure 8 and Figure 9). The understory vegetation biomass was significantly greater for the effluent plots at Heyburn State Park and Cave Bay (Figure 8). The Shannon–Wiener index was significantly affected by treatment at only one facility (Table 7, TxF, p = 0.05). Evenness was marginally affected by treatment (TxF, p < 0.09). Typically, vegetation diversity, richness and evenness in the reclaimed-water-amended plots were not different from the control. The exception to this was at the Ellisport Bay facility, where in effluent plots, the Shannon–Wiener diversity index was 65% of the controls and evenness was 57.7% of the controls (Figure 9). The understory vegetation biomass at the recently established facilities Heyburn State Park and Cave Bay were also orders of magnitude greater than the long-established facilities (Table 7, Figure 8). The date of facility establishment affected both the Shannon–Wiener diversity index and richness. They were greater at the recently established facilities (Figure 9a,b) and the facility establishment response was consistent for both treatments (Table 7, TxE, p ≥ 0.44).

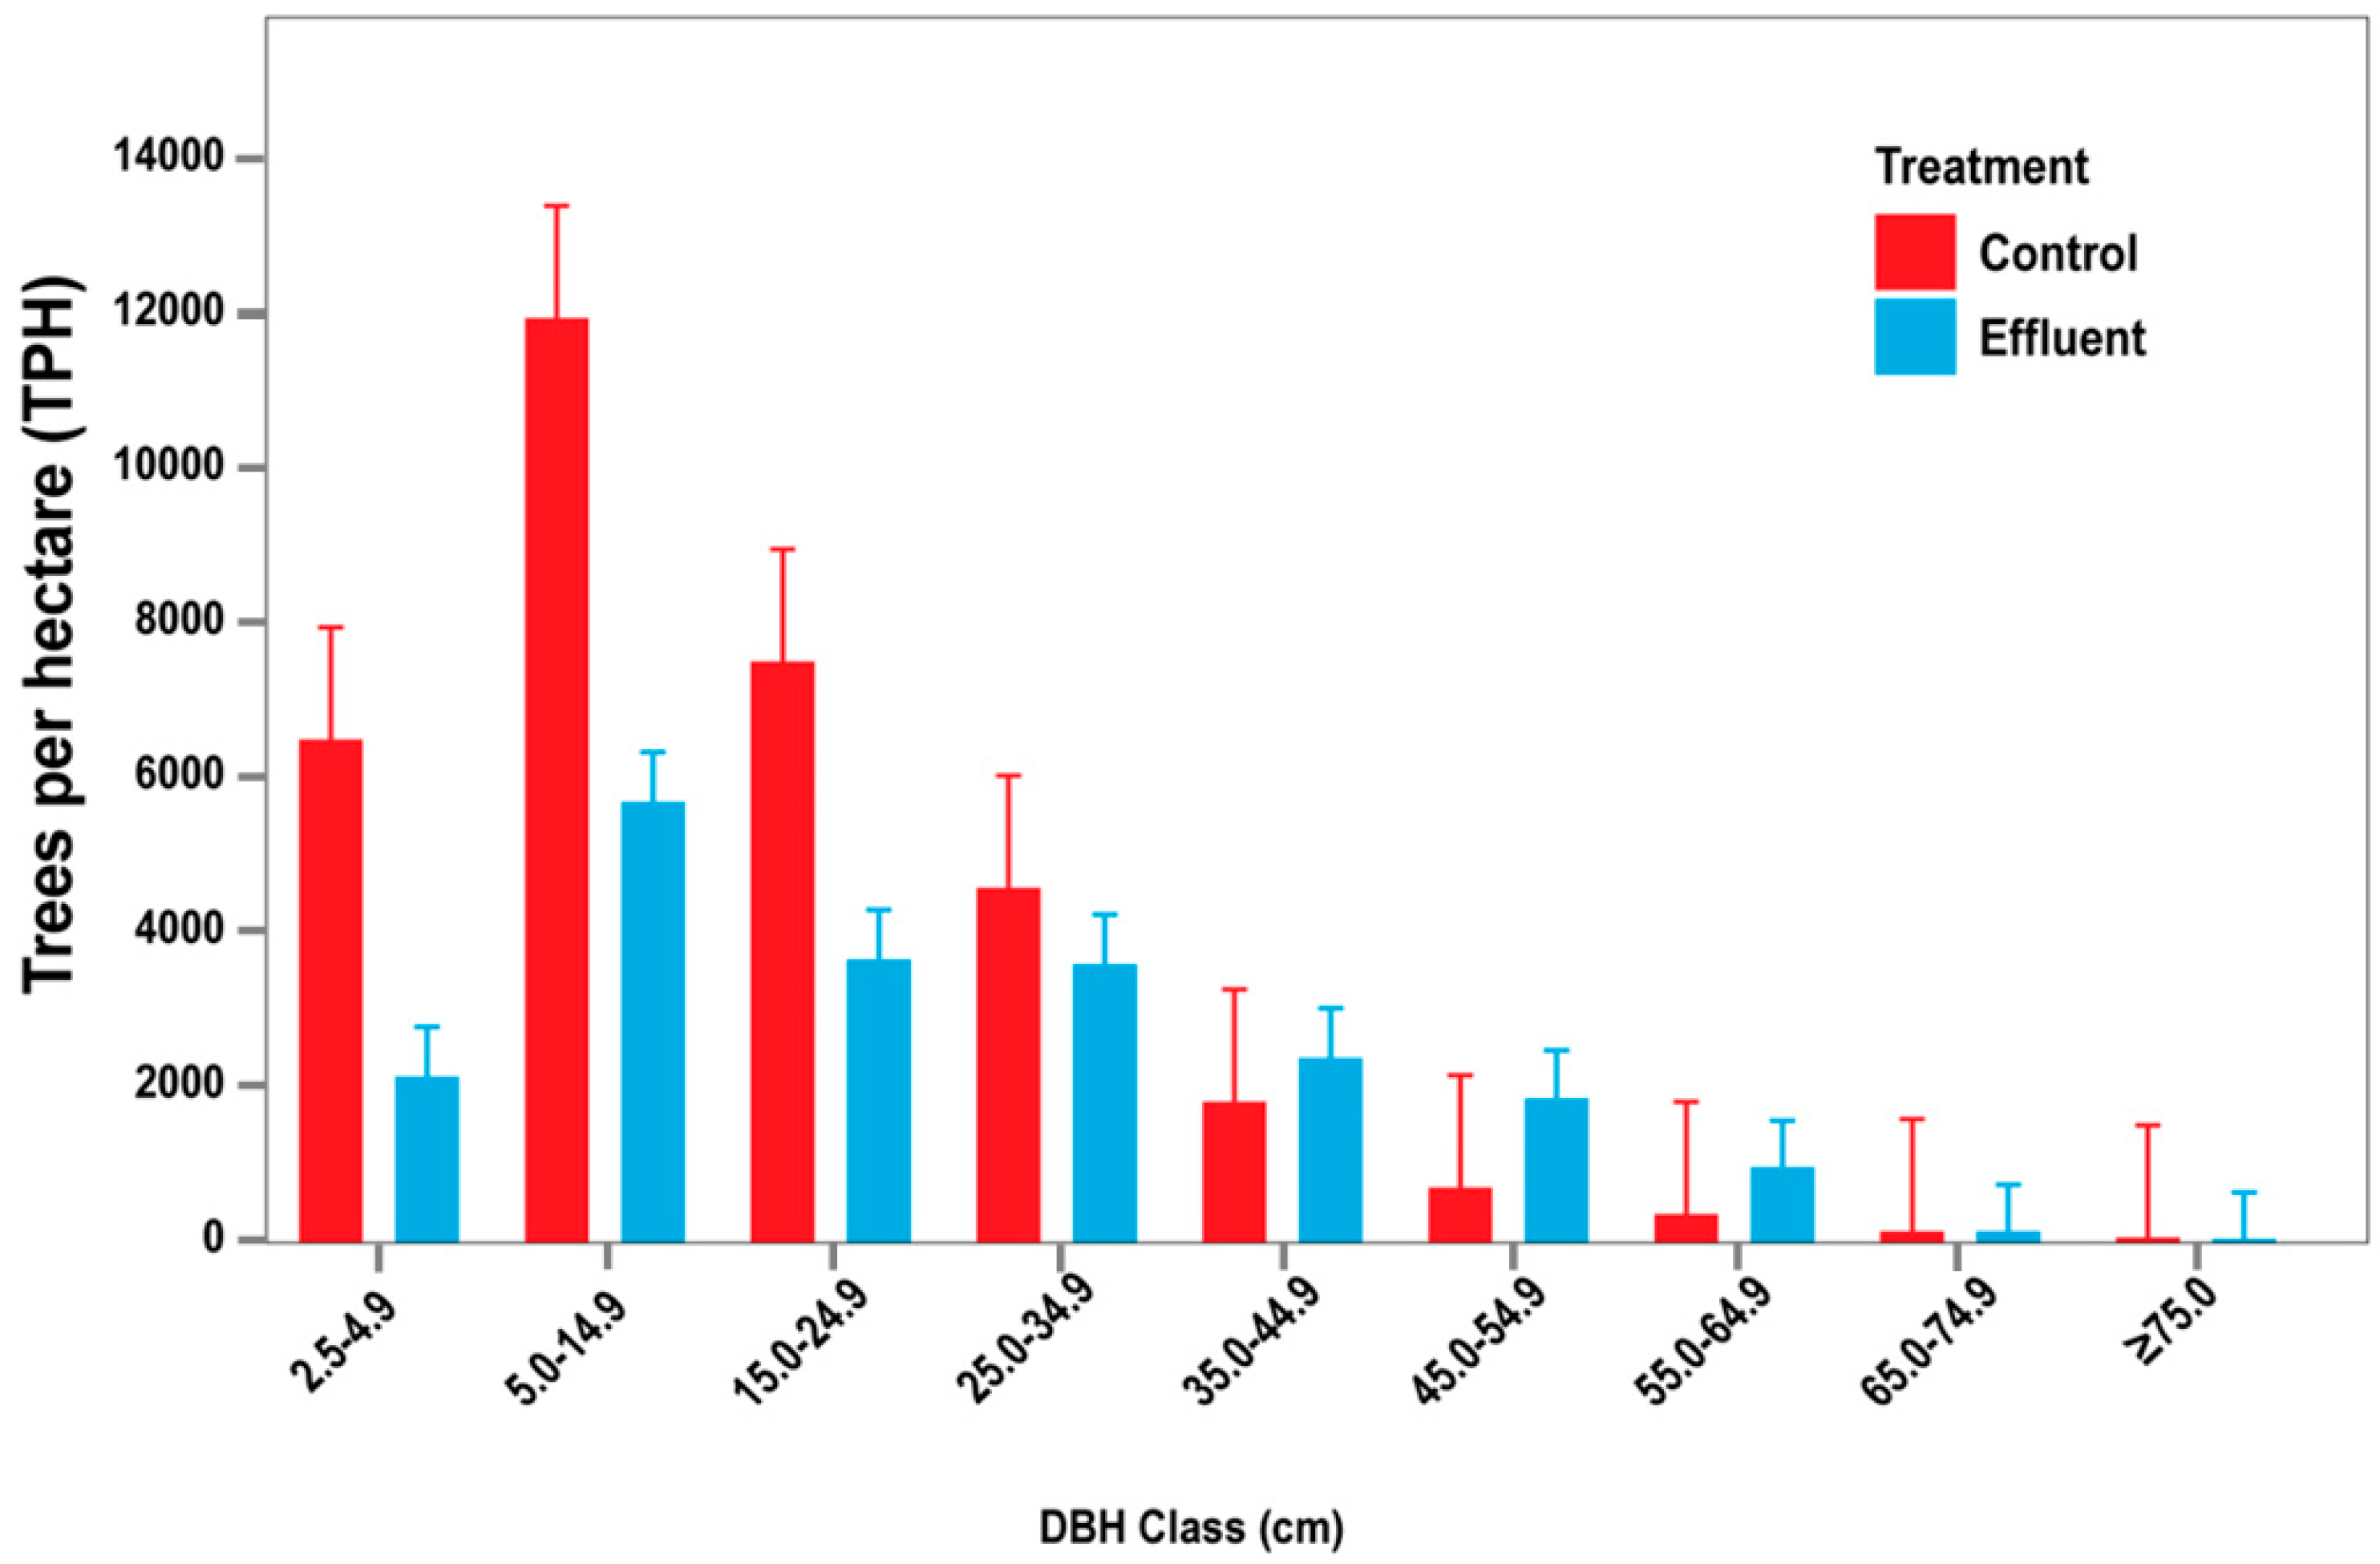
3.5. Overstory Tree Diversity Responses

Similarly, overstory diversity, richness and evenness varied by facility and date of establishment but were largely unaffected by treatment (Table 8). In contrast with the understory vegetation diversity, the Shannon–Wiener index, and richness for overstory vegetation were greater in early established facilities compared to the recently established facilities (Table 8, F, p < 0.01; E, p < 0.02), except Cave Bay which was comparable with the early facilities (Figure 10a,b). Heyburn State Park followed by Cave Bay showed the lowest tree diversity and richness, while the highest diversity and richness were observed at Garfield Bay and Bottle Bay. As with understory diversity and richness, the facility establishment response was consistent for both treatments (Table 8, TxE, p ≥ 0.75).

4. Discussion

Our results show that reclaimed water amendments during the growing season had overall positive effects on forest growth responses of coniferous forests in the Inland Northwest and yet had minimal effects on vegetation diversity. We found that the dominant commercial tree species occurring at the study facilities responded positively to reclaimed water, with substantial increases in growth. Furthermore, incremental fertilization and irrigation from reclaimed water application during the growing season sustained growth responses over the long-term. These findings provide insight into long-term effects of reclaimed water application on tree and forest growth responses and community-level changes in understory and overstory vegetation diversity.

4.1. Forest Growth Response

These results support our hypothesis that regular growing season amendments of reclaimed water at permitted rates will substantially and continuously increase Inland Northwest tree growth and forest productivity compared to unamended controls. Diameter, basal area and volume increments were consistently greater in effluent amended plots compared to control plots (Figure 4 and Figure 7), which agrees with other studies showing sustained growth increases in response to incremental fertilization in combination with irrigation [10,11,12,60,61]. Supply of moisture and nutrients in reclaimed water addresses the seasonal summer drought and N limiting characteristic common to the Inland Northwest. The water- and nutrient-deficient trees opportunistically responded to such resource availability through increased annual growth increments, which translate into increased productivity. Tree growth responses at the FWR facilities were consistent with previous studies on forest responses to N fertilization in the Inland Northwest where N is the main growth limiting nutrient [62], and thus N contained in reclaimed wastewater was expected to enhance tree growth. Yet, the magnitude of the N fertilizer response within the region is dependent upon the available moisture [63]. Consequently, the addition of both water and incremental nutrients at FWR facilities realized 30 to 116% increases in diameter growth relative to the controls (Figure 6). Furthermore, those growth enhancements were sustained year-over-year after facility establishment, while the above regional fertilization studies demonstrate increases up to 39% relative to controls, and that was temporary: lasting up to six years following treatment [63]. Of course, improved soil moisture along with N and other growth-limiting nutrients supplied incrementally in wastewater is expected to be superior to N-only fertilization. Yet, our results suggest that regional productivity potential is far higher than that achieved thus far with modern forest management practices.

4.2. Individual Species Responses

The mixed conifer forests in the facilities studied offered an opportunity to consider species-specific responses to wastewater amendments at common locations. Various growth responses to wastewater application have been reported among forest types [3,24,25,63]. Thus, we expected species-specific treatment differences in tree growth because species are known to respond differently to nutrient and moisture availability [64]. Our study found that all dominant tree species responded positively to reclaimed water treatment (Figure 5 and Figure 6). The greatest diameter increment response to reclaimed water treatment was observed in western redcedar at Ellisport Bay and Bottle Bay and for Douglas-fir at Bottle Bay (Figure 5). A large change also occurred for western redcedar at Garfield Bay; however, the average diameter growth increments among treatment plots at establishment were half those of the controls and, over time, increments in the effluent plots crossed above those of controls (Figure 5e). This was analogous to the findings of Hesse et al. [26], who reported that pretreatment, basal area increments were originally lower in treatment plots, gradually increased with the initiation of reclaimed water amendment and ultimately exceeded the growth of the controls by more than 50%. In contrast, the initial diameter increments in effluent plots were larger for Douglas-fir and ponderosa pine at the recently established Cave Bay and Heyburn state Park facilities compared to the controls (Figure 5a,b). However, except for ponderosa pine at Heyburn, they did not diverge and continued to follow similar growth increment differences after establishment. Such responses may be due to other dominating site factors [65], which are outside of experimental control factors in multisite studies.
The overall responses of individual species were also dependent upon the facility at which they were growing. For the three species that occurred in sufficient numbers to make a comparison, each showed a near or above doubling of the average five-year diameter growth increment for at least one of the facilities (Figure 5). Other studies show that fast-growing species have even greater responses. For instance, a three-fold increase for Douglas-fir and an eight-fold production increase for poplar was found for wastewater-treated stands in western Washington [3]. Western redcedar and Douglas-fir showed the lowest diameter growth increment at Garfield Bay (Figure 6). However, based on previous reports and the responses of these species at the other facilities within our study, we expected to see a much larger increase in diameter increment in response to reclaimed water application. The lack of a growth response among tree species may be due to other dominant site factors affecting tree growth. A similarly limited response was observed in a mixed oak–hickory forest, where it was concluded that the lack of a growth response to fertilization may be from individual tree and microsite characteristics that influence tree growth [65]. The annual application rate will also cause a potential decline. For instance, in a 15-year N-amendment study, a rate of 50 kg N ha−1 yr−1 continued to stimulate forest growth, while 150 kg N ha−1 yr−1 caused a decline in productivity and increased tree mortality [66]. However, facility N loading rates in our study averaged 37 kg N ha−1 yr−1 with the rate at Garfield Bay being 42 kg N ha−1 yr−1, so these rates are moderate and not expected to cause forest decline.
A decrease in tree growth is also linked to stand development. Young, vigorous forests achieve peak stand growth early in development, and that plateaus after canopy closure and maximum leaf area [67,68,69]. Effluent stands at Garfield Bay are fully stocked with an average of 1300 TPH and an individual tree volume of 0.46 m3 (Figure 2), which means that they are approaching the developmental stage of imminent mortality [70]. Indeed, we observed a decline in diameter increment over time in the tree core data (Figure 5), which is consistent with growth dynamics in mature forests where inter-tree competition slows growth and ultimately results in mortality of suppressed trees [71]. Inland Northwest stands that are fully stocked respond poorly to fertilization unless they have been thinned to allow growing space [72]. Thus, among the possible reasons for the limited diameter increment response to reclaimed water amendments at Garfield, overstocking is the most likely cause.

4.3. Vegetation Diversity Responses

The understory diversity indices at Bottle Bay and Ellisport Bay significantly declined in reclaimed-water-amended plots compared to the controls (Figure 9). Stocking increased at these sites but stand development had not yet reached the level of competition that it had at Garfield Bay. Although reclaimed water addition overcomes moisture limitations and leads to a highly productive understory, plant diversity ultimately declines with continued treatment resulting in community simplification [35]. Forest fertilization also increases leaf area index and light interception [73] and decreases plant species diversity [29,74] by favoring the most shade-tolerant understory species [36,37,38]. Indeed, plant community composition is often used as an indicator of site quality [75,76,77]. Decreased diversity at Bottle Bay and Ellisport Bay in effluent plots is most likely due to increased canopy cover, which is an expected growth response by the overstory to abundant moisture and nutrients during the growing season.
The Shannon–Wiener diversity index of the understory also depends on the initial understory composition and on stand developmental conditions [42,78]. Understory species abundance at Heyburn State Park (est. 2010) and Cave Bay (est. 2013) in our study was dominated by common snowberry and other shrub species (Figure 8) with ponderosa pine and Douglas-fir overstories. While reclaimed water amendments at these recently established facilities are expected to ultimately decrease understory diversity through an increase in common snowberry abundance [78], that transition had not yet occurred during our observations. Conversely, the abundant growth of alpine enchanter’s nightshade (Circaea alpina L.) in effluent plots at Ellisport Bay (est. 2000) is most likely due to increased moisture availability which corresponded with significant declines in diversity (Figure 9). We also noted an increase in the abundance of Rocky Mountain maple (Acer glabrum) in the effluent plots at Bottle Bay (est. 1989). This supports observations that continued inputs of N may change forest stands from a slow-growing and slow-N-cycling coniferous forest to a fast-growing and fast-N-cycling deciduous forest [79]. Thus, the duration of reclaimed water application treatment and initial prevalence of understory species noticeably affected species diversity.
Our results indicate that stand density and overstory vegetation development also significantly influence understory vegetation responses to reclaimed water. The decline in understory diversity in long-established facilities corresponded with increased overstory diversity (Figure 10) and increased stocking (Figure 2), as well as increased basal area and volume increments, especially in effluent plots (Figure 7). Understory vegetation growth depends on light and nutrient availability [80,81,82]. Nitrogen amendments create denser tree canopies leading to lower light and nutrient availability for understory plants [36,37,38]. Lower light availability results in lower understory diversity in old growth forests compared to that found with higher light in selectively logged uneven-aged forests [83]. Thus, progressive stand development and increased overstory diversity at our long-established facilities may also have resulted in a decline in understory diversity due to decreased resource availability and the selection of tolerant understory plants.

4.4. Time Series Study Design and Analysis

Our study opportunistically focused on a time series, or a space-for-time substitution, which uses chronosequences as an alternative to long-term, longitudinal studies. Time series have been extensively used to study long-term responses in ecological studies that would otherwise not be possible to practically address [84]. Time series are challenging to establish because of the strong influence of site conditions on stand metrics which then become confounded with the temporal effect of interest. However, time series studies can be an extremely useful and effective tool for ecosystem management due to the value of long-term data [85]. In our study, initial stand metrics demonstrated differences among facilities that were related to establishment date, and effluent plots were often larger in tree and stand dimensions than controls (Figure 2). While the rankings of initial parameters are consistent with stand development and treatment responses, it is difficult to be certain that these factors are the cause, and not confounded with site conditions. Despite inevitable tradeoffs inherent in this time series, we were reasonably successful in matching control and effluent stand structure, species composition, soils, and topography. Furthermore, we used initial parameter values as covariates in statistical models that tested growth increments. These covariates largely accounted for differences in size variation within and among stands. Thus, our FWR study appeared to provide a unique and rigorous chance to assess long-term forest responses to reclaimed water application.

5. Conclusions

Forest water reclamation offers the prospect to improve forest productivity while renovating applied wastewater and preventing environmental degradation. Increasing demand for renewable wood products combined with decreasing land area for working forests creates a critical need to improve forest productivity on available acreage. Dramatic increases in forest productivity demonstrate the potential productivity in the Inland Northwest and generally for dry western forests.
Our findings suggested that trees respond favorably to reclaimed water irrigation during the growing season at permitted rates, particularly western redcedar and Douglas-fir. However, long-term reclaimed water application may adversely affect tree growth, permanently alter vegetation composition and diversity, and lead to community-level changes in forest ecosystems. Our results also suggest that an increasing length of treatment may lead to a decline in tree growth and diversity. While we concluded that FWR promotes forest growth, evidence from the past literature suggests that there are potential environmental risks of nutrient contamination and eutrophication of surface waters in response to long-term land application. Future research on soil nutrient budgets, nutrient cycling, drainage and leaching within this time series will provide more insight into the water and nutrient assimilation capacities of these forest application systems. Despite the potential risks, proper hydraulic and nutrient loading rates in low doses spread across sufficient application areas would optimize forest productivity and prevent nutrient losses.
Forest water reclamation presents environmental, social, and economic implications in the region. Understanding long-term forest responses enables water reuse facility managers to formulate sound forest management strategies to promote productivity and prevent nutrient contamination, and the consequent environmental degradation, while presenting possibilities of generating revenue through timber production. The social liability of reclaimed water can be potentially converted to an asset that substantially improves productivity. Furthermore, tertiary treatment of reclaimed water by forest ecosystems prevents environmental degradation and helps maintain water quality and sustain communities. When repeated across many municipalities across the Inland Northwest, FWR will be at a scale to maintain regional environmental quality and boost the economic viability of facilities and adjacent timberland owners.

Author Contributions

Conceptualization, M.D.C.; methodology, M.D.C. and E.J.; formal analysis, E.J.; investigation, E.J.; resources, M.D.C.; data curation, E.J.; writing—original draft preparation, E.J.; writing—review and editing, M.D.C. and E.J.; visualization, E.J.; supervision, M.D.C.; project administration, M.D.C.; funding acquisition, M.D.C. All authors have read and agreed to the published version of the manuscript.

Funding

This research was funded by United States Department of Agriculture, National Institute of Food and Agriculture, grant number 2020-67020-31174. The understory vegetation research was funded by Stillinger Herbarium Expedition Fund, University of Idaho, Moscow, ID, USA.

Data Availability Statement

Not applicable.

Acknowledgments

The authors of this article express their gratitude to Matthew Plaisted at IDEQ; Ron Hise, Chris Hoosick and Nathan Blackburn at Heyburn State Park; Dex Vogel and Trecy Carpenter at Ellisport Bay Sewer District; Bob Hansen, Don Moore, Stephen Miller and William Valentine at Garfield Bay Water & Sewer District and Bottle Bay Recreational Water & Sewer District; Leanord Johnson and Jeremy Polk at Cave Bay Community Services; Norris Booth from Coeur d’Alene Tribe and Ray Entz from Kalispell Tribe of Indians; and finally Dale and Gary Vanstone (Ellisport Bay landowners), without whose support, this project would not have been possible. In addition, special thanks to Madeline Schwarzbach for assisting with field work and analysis.

Conflicts of Interest

The authors declare no conflict of interest.

Appendix A

Figure A1 shows the schematic representation of the experimental design at the five water reuse facilities and Figure A2 shows the control and effluent plot locations at Heyburn State Park facility as an example. Each facility had a unique spatial distribution of control and effluent plots and the schematic diagram in Figure A1 does not represent the actual layout.
Figure A1. Schematic representation of the experimental design showing number of control (Con) and effluent (Eff) plots at each facility.
Forests 14 00266 g0a1
Figure A2. Location of five control plots (201HC1, 202HC2, 203HC3, 204HC4 and 205HC5) and five effluent plots (206HE1, 207HE2, 208HE3, 209HE4 and 210HE5) at Heyburn State Park facility demonstrating the unique spatial distribution of study plots. The land application site is the area enclosed by the yellow line.
Forests 14 00266 g0a2

References

  1. Al-Jamal, M.S.; Sammis, T.W.; Mexal, J.G.; Picchioni, G.A.; Zachritz, W.H. A Growth-Irrigation Scheduling Model for Wastewater Use in Forest Production. Agric. Water Manag. 2002, 56, 57–79. [Google Scholar] [CrossRef]
  2. Cole, D.; Gessel, S. Fundamentals of Tree Nutrition. In Forest Fertilization: Sustaining and Improving Nutrition and Growth of Western Forests; Institute of Forest Resources Contribution: Seattle, WA, USA, 1992; pp. 7–16. [Google Scholar]
  3. Gessel, S.P.; Miller, R.E.; Cole, D.W. Relative Importance of Water and Nutrients on the Growth of Coast Douglas Fir in the Pacific Northwest. For. Ecol. Manag. 1990, 30, 327–340. [Google Scholar] [CrossRef]
  4. Cole, D.W.; Rapp, M. 6. Elemental Cycling in Forest Ecosystems. Dyn. Prop. For. Ecosyst. 1981, 23, 341. [Google Scholar]
  5. Johnson, D.W.; Turner, J. Nitrogen Budgets of Forest Ecosystems: A Review. For. Ecol. Manag. 2014, 318, 370–379. [Google Scholar] [CrossRef]
  6. Lang, F.; Bauhus, J.; Frossard, E.; George, E.; Kaiser, K.; Kaupenjohann, M.; Krüger, J.; Matzner, E.; Polle, A.; Prietzel, J.; et al. Phosphorus in Forest Ecosystems: New Insights from an Ecosystem Nutrition Perspective. J. Plant Nutr. Soil Sci. 2016, 179, 129–135. [Google Scholar] [CrossRef]
  7. Chappell, H.N.; Cole, D.W.; Gessel, S.P.; Walker, R.B. Forest Fertilization Research and Practice in the Pacific Northwest. Fertil. Res. 1991, 27, 129–140. [Google Scholar] [CrossRef]
  8. Fox, T.R.; Allen, H.L.; Albaugh, T.J.; Rubilar, R.; Carlson, C.A. Forest Fertilization in Southern Pine Plantations. Better Crops 2006, 90, 12–15. [Google Scholar]
  9. Coyle, D.R.; Aubrey, D.P.; Coleman, M.D. Growth Responses of Narrow or Broad Site Adapted Tree Species to a Range of Resource Availability Treatments after a Full Harvest Rotation. For. Ecol. Manag. 2016, 362, 107–119. [Google Scholar] [CrossRef] [Green Version]
  10. Iivonen, S.; Kaakinen, S.; Jolkkonen, A.; Vapaavuori, E.; Linder, S. Influence of Long-Term Nutrient Optimization on Biomass, Carbon, and Nitrogen Acquisition and Allocation in Norway Spruce. Can. J. For. Res. 2006, 36, 1563–1571. [Google Scholar] [CrossRef]
  11. Weetman, G.F.; Prescott, C.E.; Kohlberger, F.L.; Fournier, R.M. Ten-Year Growth Response of Coastal Douglas-Fir on Vancouver Island to N and S Fertilization in an Optimum Nutrition Trial. Can. J. For. Res. 1997, 27, 1478–1482. [Google Scholar] [CrossRef]
  12. Ingestad, T. New Concepts on Soil Fertility and Plant Nutrition as Illustrated by Research on Forest Trees and Stands. Geoderma 1987, 40, 237–252. [Google Scholar] [CrossRef]
  13. Van Miegroet, H.; Cole, D.W. The Impact of Nitrification on Soil Acidification and Cation Leaching in a Red Alder Ecosystem. J. Environ. Qual. 1984, 13, 586–590. [Google Scholar] [CrossRef] [Green Version]
  14. Asano, T. Irrigation with Reclaimed Municipal Wastewater. GeoJournal 1987, 15, 273–282. [Google Scholar] [CrossRef]
  15. Hamilton, A.J.; Stagnitti, F.; Xiong, X.; Kreidl, S.L.; Benke, K.K.; Maher, P. Wastewater Irrigation: The State of Play. Vadose Zone J. 2007, 6, 823–840. [Google Scholar] [CrossRef] [Green Version]
  16. Andrews, D.M.; Robb, T.; Elliott, H.; Watson, J.E. Impact of Long-Term Wastewater Irrigation on the Physicochemical Properties of Humid Region Soils: “The Living Filter” Site Case Study. Agric. Water Manag. 2016, 178, 239–247. [Google Scholar] [CrossRef]
  17. Mexal, J.G.; Zachritz, W.H.; Sammis, T.W. Trees Are the Solution to Wastewater Treatment for Small Communities. In National Proceedings: Forest and Conservation Nursery Associations—1999, 2000 and 2001; US Department of Agriculture, Forest Service, Southern Research Station: Ogden, UT, USA, 2002; pp. 327–335. [Google Scholar]
  18. Duan, R.; Sheppard, C.D.; Fedler, C.B. Short-Term Effects of Wastewater Land Application on Soil Chemical Properties. Water Air Soil Pollut. 2010, 211, 165–176. [Google Scholar] [CrossRef]
  19. Jordan, M.J.; Nadelhoffer, K.J.; Fry, B. Nitrogen Cycling in Forest and Grass Ecosystems Irrigated with 15N-Enriched Wastewater. Ecol. Appl. 1997, 7, 864–881. [Google Scholar] [CrossRef]
  20. Barton, L.; Schipper, L.A.; Barkle, G.F.; McLeod, M.; Speir, T.W.; Taylor, M.D.; McGill, A.C.; van Schaik, A.P.; Fitzgerald, N.B.; Pandey, S.P. Land Application of Domestic Effluent onto Four Soil Types: Plant Uptake and Nutrient Leaching. J. Environ. Qual. 2005, 34, 635–643. [Google Scholar] [CrossRef]
  21. Tomer, M.D.; Smith, C.T.; Thorn, A.J.; Gielen, G.J.H.P.; Barton, L. Evaluation of Treatment Performance and Processes after Six Years of Wastewater Application at Whakarewarewa Forest, New Zealand. For. Res. 2000, 155–162. [Google Scholar]
  22. Beedlow, P.A.; Waschmann, R.S.; Lee, E.H.; Tingey, D.T. Seasonal Patterns of Bole Water Content in Old Growth Douglas-Fir (Pseudotsuga Menziesii (Mirb.) Franco). Agric. For. Meteorol. 2017, 242, 109–119. [Google Scholar] [CrossRef]
  23. Marron, N. Agronomic and Environmental Effects of Land Application of Residues in Short-Rotation Tree Plantations: A Literature Review. Biomass Bioenergy 2015, 81, 378–400. [Google Scholar] [CrossRef]
  24. Moffat, A.J.; Armstrong, A.T.; Ockleston, J. The Optimization of Sewage Sludge and Effluent Disposal on Energy Crops of Short Rotation Hybrid Poplar. Biomass Bioenergy 2001, 20, 161–169. [Google Scholar] [CrossRef]
  25. Weetman, G.F.; McDonald, M.A.; Prescott, C.E.; Kimmins, J.P. Responses of Western Hemlock, Pacific Silver Fir, and Western Red Cedar Plantations on Northern Vancouver Island to Applications of Sewage Sludge and Inorganic Fertilizer. Can. J. For. Res. 1993, 23, 1815–1820. [Google Scholar] [CrossRef]
  26. Hesse, I.D.; Day, J.W.; Doyle, T.W. Long-Term Growth Enhancement of Baldcypress (Taxodium Distichum) from Municipal Wastewater Application. Environ. Manag. 1998, 22, 119–127. [Google Scholar] [CrossRef] [PubMed]
  27. Affleck, D.L.R. Aboveground Biomass Equations for the Predominant Conifer Species of the Inland Northwest USA. For. Ecol. Manag. 2019, 432, 179–188. [Google Scholar] [CrossRef]
  28. Oswald, B.P.; Ott, B.; Williams, H.M.; Farrish, K.W.; Van Kley, J.E. Understory Vegetative Diversity of Post-Thinned Pine Plantations Treated with Fertilizer, Fire and Herbicide in East Texas. Int. J. For. Res. 2009, 2009, 572480. [Google Scholar] [CrossRef] [Green Version]
  29. Thomas, S.C.; Halpern, C.B.; Falk, D.A.; Liguori, D.A.; Austin, K.A. Plant Diversity in Managed Forests: Understory Responses to Thinning and Fertilization. Ecol. Appl. 1999, 9, 864–879. [Google Scholar] [CrossRef]
  30. Aiello, R.; Cirelli, G.L.; Consoli, S. Effects of Reclaimed Wastewater Irrigation on Soil and Tomato Fruits: A Case Study in Sicily (Italy). Agric. Water Manag. 2007, 93, 65–72. [Google Scholar] [CrossRef]
  31. Wallach, R.; Ben-Arie, O.; Graber, E.R. Soil Water Repellency Induced By Long-Term Irrigation with Treated Sewage Effluent. J. Environ. Qual. 2005, 34, 1910–1920. [Google Scholar] [CrossRef]
  32. Duan, R.; Fedler, C.B.; Sheppard, C.D. Field Study of Salt Balance of a Land Application System. Water Air Soil Pollut. 2011, 215, 43–54. [Google Scholar] [CrossRef]
  33. Magesan, G.N.; Williamson, J.C.; Yeates, G.W.; Lloyd-Jones, A.R. Wastewater C:N Ratio Effects on Soil Hydraulic Conductivity and Potential Mechanisms for Recovery. Bioresour. Technol. 2000, 71, 21–27. [Google Scholar] [CrossRef]
  34. Toze, S. Reuse of Effluent Water—Benefits and Risks. Agric. Water Manag. 2006, 80, 147–159. [Google Scholar] [CrossRef] [Green Version]
  35. Hunt, E.J.; Shure, D.J. Vegetation and Arthropod Responses to Wastewater Enrichment of a Pine Forset. Oecologia 1980, 47, 118–124. [Google Scholar] [CrossRef]
  36. Alvarez-Clare, S.; Mack, M.C.; Brooks, M. A Direct Test of Nitrogen and Phosphorus Limitation to Net Primary Productivity in a Lowland Tropical Wet Forest. Ecology 2013, 94, 1540–1551. [Google Scholar] [CrossRef] [Green Version]
  37. Ibáñez, I.; Zak, D.R.; Burton, A.J.; Pregitzer, K.S. Chronic Nitrogen Deposition Alters Tree Allometric Relationships: Implications for Biomass Production and Carbon Storage. Ecol. Appl. 2016, 26, 913–925. [Google Scholar] [CrossRef] [Green Version]
  38. Schroth, G.; da Mota, M.D.S.S.; de Assis Elias, M.E. Growth and Nutrient Accumulation of Brazil Nut Trees (Bertholletia Excelsa) in Agroforestry at Different Fertilizer Levels. J. For. Res. 2015, 26, 347–353. [Google Scholar] [CrossRef]
  39. Burton, P.J.; Balisky, A.C.; Coward, L.P.; Cumming, S.G.; Kneeshaw, D.D. The Value of Managing for Biodiversity. For. Chron. 1992, 68, 225–237. [Google Scholar] [CrossRef]
  40. DeWald, L.E.; Mahalovich, M.F. The Role of Forest Genetics in Managing Ecosystems. J. For. 1997, 95, 12–16. [Google Scholar]
  41. Oliver, C.D.; Lippke, B. Managing for Multiple Values: A Proposal for the Pacific Northwest. J. For. 1993, 91, 14–18. [Google Scholar]
  42. Zhang, J.; Young, D.H.; Oliver, W.W.; Fiddler, G.O. Effect of Overstorey Trees on Understorey Vegetation in California (USA) Ponderosa Pine Plantations. Forestry 2016, 89, 91–99. [Google Scholar] [CrossRef] [Green Version]
  43. Shikangalah, R.; Mapani, B.; Mapaure, I.; Herzschuh, U.; Musimba, A.; Tabares, X. Growth Ring Formation of Dichrostachys Cinerea and Senegalia Mellifera in Arid Environments in Namibia. Dendrochronologia 2020, 59, 125661. [Google Scholar] [CrossRef]
  44. Arenas-Castro, S.; Fernández-Haeger, J.; Jordano-Barbudo, D. A Method for Tree-Ring Analysis Using Diva-Gis Freeware on Scanned Core Images. Tree-Ring Res. 2015, 71, 118–129. [Google Scholar] [CrossRef]
  45. McCarroll, D.; Loader, N.J. Stable Isotopes in Tree Rings. Quat. Sci. Rev. 2004, 23, 771–801. [Google Scholar] [CrossRef]
  46. Soil Survey Staff Official Soil Series Descriptions. 2019. Available online: https://soils.usda.gov/technical/classification/osd/index.html (accessed on 24 January 2023).
  47. Caron, T.M.F.; Chuma, V.J.U.R.; Sandi, A.A.; Norris, D. Big Trees Drive Forest Structure Patterns across a Lowland Amazon Regrowth Gradient. Sci. Rep. 2021, 11, 3380. [Google Scholar] [CrossRef] [PubMed]
  48. VanderSchaaf, C.L.; Burkhart, H.E. Relationship Between Maximum Basal Aarea Carrying Capacity and Maximum Size-Density Rrelationships. Mod. Appl. Sci. 2007, 1, 3–6. [Google Scholar] [CrossRef] [Green Version]
  49. Woodall, C.W.; Miles, P.D.; Vissage, J.S. Determining Maximum Stand Density Index in Mixed Species Stands for Strategic-Scale Stocking Assessments. For. Ecol. Manag. 2005, 216, 367–377. [Google Scholar] [CrossRef]
  50. Hulshof, C.M.; Swenson, N.G.; Weiser, M.D. Tree Height-Diameter Allometry across the United States. Ecol. Evol. 2015, 5, 1193–1204. [Google Scholar] [CrossRef]
  51. Wykoff, W.R.; Crookston, N.L.; Stage, A.R. User’s Guide to the Stand Prognosis Model (Forestry); US Department of Agriculture, Forest Service, Intermountain Forest and Range Experiment Station: Ogden, UT, USA, 1982. [Google Scholar]
  52. Maxwell, R.S.; Wixom, J.A.; Hessl, A.E. A Comparison of Two Techniques for Measuring and Crossdating Tree Rings. Dendrochronologia 2011, 29, 237–243. [Google Scholar] [CrossRef]
  53. Shikangalah, R.; Musimba, A.; Mapaure, I.; Mapani, B.; Herzschuh, U.; Tabares, X.; Kamburona-Ngavetene, C. Growth Rings and Stem Diameter of Dichrostachys Cinerea and Senegalia Mellifera along a Rainfall Gradient in Namibia. Trees For. People 2021, 3, 100046. [Google Scholar] [CrossRef]
  54. Bogino, S.; Fernández Nieto, M.J.; Bravo, F. Climate Effect on Radial Growth of Pinus Sylvestris at Its Southern and Western Distribution Limits. Silva Fenn. 2009, 43, 609–623. [Google Scholar] [CrossRef] [Green Version]
  55. Roversi, G.D.; Canussio, V.; Spennacchio, M. Recognition and Significance of Maternogenic Fetal Acidosis during Intensive Monitoring of Labor. J. Perinat. Med. 1975, 3, 53–67. [Google Scholar] [CrossRef] [Green Version]
  56. Yang, S.I.; Radtke, P.J. Predicting Bark Thickness with One- and Two-Stage Regression Models for Three Hardwood Species in the Southeastern US. For. Ecol. Manag. 2022, 503, 119778. [Google Scholar] [CrossRef]
  57. Wang, G.G.; Kemball, K.J. Effects of Fire Severity on Early Development of Understory Vegetation. Can. J. For. Res. 2005, 35, 254–262. [Google Scholar] [CrossRef]
  58. Box, G.E.P.; Cox, D.R. An Analysis of Transformations. J. R. Stat. Soc. Ser. B 1964, 26, 211–243. [Google Scholar] [CrossRef]
  59. The R Project for Statistical Computing. 2021. Available online: http://www.R-project.org (accessed on 24 January 2023).
  60. Bergh, J.; Linder, S.; Lundmark, T.; Elfving, B. The Effect of Water and Nutrient Availability on the Productivity of Norway Spruce in Northern and Southern Sweden. For. Ecol. Manag. 1999, 119, 51–62. [Google Scholar] [CrossRef]
  61. Pereira, J.S.; Linder, S.; Araújo, M.C.; Pereira, H.; Ericsson, T.; Borralho, N.; Leal, L.C. Optimization of Biomass Production in Eucalyptus Globulus Plantations—A Case Study. In Biomass Production by Fast-Growing Trees; Springer: Berlin/Heidelberg, Germany, 1989; pp. 101–121. [Google Scholar]
  62. Mika, P.G.; Moore, J.A.; Brockley, R.P.; Powers, R.F. Fertilization response by interior forests: When, where, and how much. In Forest Fertilization: Sustaining and Improving Nutrition and Growth of Western Gorests Chappell; Weetman, G.F., Miller, R.E., Eds.; College of Forest Resources, University of Washington: Seattle, WA, USA, 1992; pp. 127–142. [Google Scholar]
  63. Cromer, R.N. Irrigation of Radiata Pine with Waste Water: A Review of the Potential for Tree Growth and Water Renovation. Aust. For. 1980, 43, 87–100. [Google Scholar] [CrossRef]
  64. Aubrey, D.P.; Coyle, D.R.; Coleman, M.D. Functional Groups Show Distinct Differences in Nitrogen Cycling during Early Stand Development: Implications for Forest Management. Plant Soil 2012, 351, 219–236. [Google Scholar] [CrossRef]
  65. Wallace, Z.P.; Lovett, G.M.; Hart, J.E.; Machona, B. Effects of Nitrogen Saturation on Tree Growth and Death in a Mixed-Oak Forest. For. Ecol. Manag. 2007, 243, 210–218. [Google Scholar] [CrossRef]
  66. Magill, A.H.; Aber, J.D.; Currie, W.S.; Nadelhoffer, K.J.; Martin, M.E.; McDowell, W.H.; Melillo, J.M.; Steudler, P. Ecosystem Response to 15 Years of Chronic Nitrogen Additions at the Harvard Forest LTER, Massachusetts, USA. For. Ecol. Manag. 2004, 196, 7–28. [Google Scholar] [CrossRef]
  67. Binkley, D.; Stape, J.L.; Ryan, M.G.; Barnard, H.R.; Fownes, J. Age-Related Decline in Forest Ecosystem Growth: An Individual-Tree, Stand-Structure Hypothesis. Ecosystems 2002, 5, 58–67. [Google Scholar] [CrossRef]
  68. Foster, J.R.; D’Amato, A.W.; Bradford, J.B. Looking for Age-Related Growth Decline in Natural Forests: Unexpected Biomass Patterns from Tree Rings and Simulated Mortality. Oecologia 2014, 175, 363–374. [Google Scholar] [CrossRef] [PubMed]
  69. Xu, C.Y.; Turnbull, M.H.; Tissue, D.T.; Lewis, J.D.; Carson, R.; Schuster, W.S.F.; Whitehead, D.; Walcroft, A.S.; Li, J.; Griffin, K.L. Age-Related Decline of Stand Biomass Accumulation Is Primarily Due to Mortality and Not to Reduction in NPP Associated with Individual Tree Physiology, Tree Growth or Stand Structure in a Quercus-Dominated Forest. J. Ecol. 2012, 100, 428–440. [Google Scholar] [CrossRef] [Green Version]
  70. Klinka, K.; Brisco, D. Silvics and Silviculture of Coastal Western Redcedar: A Literature Review; Special Report Series; Ministry of Forests and Range: Vancouver, BC, Canada, 2009. [Google Scholar]
  71. Oliver, C.D.; Larson, B.C. Forest Stand Dynamics; Wiley: New York, NY, USA, 1996; p. 520. [Google Scholar]
  72. Scanlin, D.C.; Loewenstein, L. Response of inland Douglas-fir and grand fir to thinning and nitrogen fertilization in northern Idaho. In Proceedings of the Forest Fertilization Conference, Union, WA, USA, 25–27 September 1979; Gessel, S.P., Kenady, R.M., Atkinson, W.A., Eds.; University of Washington, College of Forest Resources, Institute of Forest Resources: Seattle, WA, USA, 25 September 1979; pp. 82–88. [Google Scholar]
  73. Fox, T.R.; Allen, H.L.; Albaugh, T.J.; Rubilar, R.; Carlson, C.A. Tree Nutrition and Forest Fertilization of Pine Plantations in the Southern United States. South. J. Appl. For. 2007, 31, 5–11. [Google Scholar] [CrossRef] [Green Version]
  74. Bobbink, R.; Hicks, K.; Galloway, J.; Spranger, T.; Alkemade, R.; Ashmore, M.; Bustamante, M.; Cinderby, S.; Davidson, E.; Dentener, F.; et al. Global Assessment of Nitrogen Deposition Effects on Terrestrial Plant Diversity: A Synthesis. Ecol. Appl. 2010, 20, 30–59. [Google Scholar] [CrossRef] [PubMed] [Green Version]
  75. Binkley, D.; Giardina, C. Why Do Tree Species Affect Soils? The Warp and Woof of Tree-Soil Interactions. Biogeochemistry 1998, 42, 89–106. [Google Scholar] [CrossRef]
  76. Compton, J.E.; Church, M.R.; Larned, S.T.; Hogsett, W.E. Nitrogen Export from Forested Watersheds in the Oregon Coast Range: The Role of N2-Fixing Red Alder. Ecosystems 2003, 6, 773–785. [Google Scholar] [CrossRef]
  77. Hobbie, S.E. Effects of Plant Species on Nutrient Cycling. Trends Ecol. Evol. 1992, 7, 336–339. [Google Scholar] [CrossRef]
  78. VanderSchaaf, C.L.; Moore, J.A.; Kingery, J.L. The Effect of Multi-Nutrient Fertilization on Understory Plant Diversity. Northwest Sci. 2000, 74, 316–324. [Google Scholar]
  79. McNulty, S.G.; Aber, J.D.; Newman, S.D. Nitrogen Saturation in a High Elevation New England Spruce-Fir Stand. For. Ecol. Manag. 1996, 84, 109–121. [Google Scholar] [CrossRef]
  80. Dirnböck, T.; Grandin, U.; Bernhardt-Römermann, M.; Beudert, B.; Canullo, R.; Forsius, M.; Grabner, M.T.; Holmberg, M.; Kleemola, S.; Lundin, L.; et al. Forest Floor Vegetation Response to Nitrogen Deposition in Europe. Glob. Chang. Biol. 2014, 20, 429–440. [Google Scholar] [CrossRef]
  81. Gurmesa, G.A.; Lu, X.; Gundersen, P.; Mao, Q.; Zhou, K.; Fang, Y.; Mo, J. High Retention of 15N-Labeled Nitrogen Deposition in a Nitrogen Saturated Old-Growth Tropical Forest. Glob. Chang. Biol. 2016, 22, 3608–3620. [Google Scholar] [CrossRef]
  82. Walter, C.A.; Raiff, D.T.; Burnham, M.B.; Gilliam, F.S.; Adams, M.B.; Peterjohn, W.T. Nitrogen Fertilization Interacts with Light to Increase Rubus Spp. Cover in a Temperate Forest. Plant Ecol. 2016, 217, 421–430. [Google Scholar] [CrossRef]
  83. Scheller, R.M.; Mladenoff, D.J. Understory Species Patterns and Diversity in Old-Growth and Managed Northern Hardwood Forests. Ecol. Appl. 2002, 12, 1329–1343. [Google Scholar] [CrossRef]
  84. Wogan, G.O.U.; Wang, I.J. The Value of Space-for-Time Substitution for Studying Fine-Scale Microevolutionary Processes. Ecography 2018, 41, 1456–1468. [Google Scholar] [CrossRef] [Green Version]
  85. Banet, A.I.; Trexler, J.C. Space-for-Time Substitution Works in Everglades Ecological Forecasting Models. PLoS ONE 2013, 8, e81025. [Google Scholar] [CrossRef]
Figure 1. Study area: water reclamation facilities in northern Idaho, USA.
Forests 14 00266 g001
Figure 2. Stand parameter plot means and standard errors (n = 5) at the water reuse facilities; (a) trees per hectare (TPH); (b) quadratic mean diameter (QMD); (c) basal area(BA); (d) stand density index (SDI); and (e) height; and (f) total volume. Five facilities included: Garfield Bay (GB), Bottle Bay (BB), Ellisport Bay (EB), Heyburn State Park (HSP) and Cave Bay (CB). Same letters over bars indicate no differences between treatment levels at α = 0.10. Facilities are arranged in establishment order with GB being first (1978) and CB last (2013).
Forests 14 00266 g002
Figure 3. Size class distribution of control and effluent treatment plots at the five reuse facilities.
Forests 14 00266 g003
Figure 4. Mean and standard error (n = 5) of five-year Diameter Increment during facility operation for (a) diameter increment period 2014–2018; (b) diameter increment period 2009–2014 and (c) diameter increment period 2004–2009 for all species combined. Same letters over bars within each panel indicate no differences between treatment levels at α = 0.10. Facility abbreviations are described in Figure 2. Facilities are arranged in establishment order with GB being first (1978) and CB being last (2013). Since treatment had not begun at some facilities, the number of facilities decreases for earlier increments.
Forests 14 00266 g004
Figure 5. Average five-year diameter increments for (a) DF (Douglas-fir)and PP (ponderosa pine) at Cave Bay; (b) PP (ponderosa pine) and DF (Douglas-fir) at Heyburn State Park; (c) WRC (western redcedar) at Ellisport Bay; (d) DF (Douglas-fir) and WRC (western redcedar) at Bottle Bay; and (e) DF (Douglas-fir) and WRC (western redcedar) at Garfield Bay. Arrows indicate the start of reclaimed water application.
Forests 14 00266 g005
Figure 6. Species responses to treatment variations of 2014–2018 mean diameter increment for facilities where those species occurred: (a) western redcedar; (b) Douglas-fir; and (c) ponderosa pine. No species occurred at all facilities. Same letters over bars indicate no differences between treatment levels at α = 0.10. Facility abbreviations are described in Figure 2. Facilities are arranged in establishment order with GB being first (1978) and CB last (2013).
Forests 14 00266 g006
Figure 7. Plot means and standard error (n = 5) for 2019-2021annual increments for (a) diameter increment; (b) basal area increment; and (c) volume increment. Same letters over bars indicate no differences between treatment levels at α = 0.10. Facility abbreviations are as described in Figure 2. Facilities are arranged in establishment order with GB being first (1978) and CB last (2013).
Forests 14 00266 g007
Figure 8. Comparison of understory vegetation biomass at the five reuse facilities. Facility abbreviations are as described in Figure 2. Facilities are arranged in establishment order with GB being first (1978) and CB last (2013).
Forests 14 00266 g008
Figure 9. Plot mean and standard error (n = 5) for understory (a) Shannon–Wiener diversity index; (b) richness; and (c) evenness. Same letters over bars indicate no differences between treatment levels at α = 0.10. Facility abbreviations are as described in Figure 2. Facilities are arranged in establishment order with GB being first (1978) and CB last (2013).
Forests 14 00266 g009
Figure 10. Plot mean and standard error (n = 5) for overstory (a) Shannon–Wiener diversity index; (b) richness; and (c) evenness. Same letters over bars indicate no differences between treatment levels at α = 0.10. Facility abbreviations are as described in Figure 2. Facilities are arranged in establishment order with GB being first (1978) and CB last (2013).
Forests 14 00266 g010
Table 1. Study facility information, including location, elevation, establishment date, mean annual precipitation, mean annual temperature, average maximum temperature and average minimum temperature.
Reuse FacilityCoordinatesElevation (m)Establishment DateMean Annual Precipitation 1 (mm)Mean Annual Temperature 1 (°C)Average Max Temperature 1 (°C)Average Min Temperature 1 (°C)
Cave Bay47.4703° N 116.8803° W7112013534.48.419.6−5.1
Heyburn State Park47.3462° N 116.7821° W7692010662.68.219.4−5.2
Ellisport Bay48.2159° N 116.2696° W6592000633.17.718.8−5.6
Bottle Bay48.2018° N 116.4207° W6961989752.47.427.4−5.7
Garfield Bay48.2287° N 116.4384° W7071978708.97.427.4−5.8
Note: 1 30-year average data from (PRISM Climate Group).
Table 2. Initial soil properties for the top 15 cm of mineral soil depth and facility overstory and understory vegetation composition.
FacilitySoil TypeTexturepHBulk Density
(g m−3)
Dominant Tree Species 1Dominant Understory
Vegetation Species 2
Cave BayLacyGravelly loam6.9 ± 0.180.8 ± 0.04P. menziesii,
P. ponderosa
P. malvaceus, H. discolor,
S. albus
Heyburn SPCarlintonSilt loam6.5 ± 0.180.99 ± 0.05P. ponderosa,
P. menziesii
P. malvaceus, H. discolor,
S. albus
Ellisport BayPend OreilleSilt loam6.4 ± 0.130.85 ± 0.04T. plicata,
T. heterophylla,
A. grandis
P. munitum, C. alpina,
B. aquifolium
Bottle BayPend OreilleSilt loam6.2 ± 0.150.68 ± 0.04T. plicata,
P. menziesii,
A. grandis
P. malvaceus, S. albus,
H. discolor, B. aquifolium
Garfield BayPend OreilleSilt loam6.7 ± 0.170.71 ± 0.04T. plicata,
P. menziesii,
A. grandis
P. malvaceus, S. albus,
H. discolor, B. aquifolium
Note: 1 P. ponderosa—ponderosa pine (Pinus ponderosa Douglas ex C. Lawson); P. menziesii—Douglas-fir (Pseudotsuga menziesii var. glauca (Mirb.) Franco); A. grandis—grand fir (Abies grandis (Douglas ex D. Don) Lindl.); T. plicata—western redcedar (Thuja plicata Donn ex D. Don); T. heterophylla—western hemlock (Tsuga heterophylla (Raf.) Sarg.). 2 P. malvaceus—ninebark (Physocarpus malvaceus (Greene) Kuntze); H. discolor—ocean spray (Holodiscus discolor (Pursh) Maxim); S. albus—common snowberry (Symphoricarpus albus (L.) Blake); P. munitum—Western Swordfern (Polystichum munitum (Kaulf.) Presl, Tent.); C. alpina—alpine enchanter’s nightshade (circaea alpina L. ssp. pacifica (Asch. & Magnus) P.H. Raven; B. aquifolium—creeping Oregon grape (Berberis aquifolium Pursh. Beaq).
Table 3. Analysis of variance results for stand parameters at establishment (2019). Results include F-statistic (F) and p-values (p) of the measured effects of reclaimed water treatment (T) and facility (F) for stand parameters: TPH (Trees per hectare); QMD (Quadratic Mean Diameter); BA (Basal Area); SDI (Stand Density Index), Height and Volume.
EffectTPHQMD (cm)BA (m2 ha−1)SDIHeight (m)Volume
(m3 ha−1)
FpFpFpFpFpFp
T21.01<0.01 ***8.31<0.01 ***4.100.05 **1.320.263.51<0.01 ***5.280.03 **
F32.48<0.01 ***10.52<0.01 ***5.17<0.01 ***14.75<0.01 ***6.270.06 *2.590.05 **
TxF5.68<0.01 ***2.040.111.710.171.150.351.930.122.260.08 *
Note: Significance levels: p < 0.1 (*), p < 0.05 (**), p < 0.01 (***).
Table 4. Descriptive statistics (LS mean ± SE) of stand parameters [TPH (Trees per hectare); QMD (Quadratic Mean Diameter); BA (Basal Area); SDI (Stand Density Index); Height and Volume] by treatment at the five water reuse facilities.
TreatmentTPHQMDBASDIHeightVolume
Control1335 ± 160 a26.4 ± 1.7 a48.3 ± 3.67 a968 ± 68.2 a15.3 ± 0.84 a368 ± 41.2 a
Effluent817 ± 160 b31.4 ± 1.7 b57.1 ± 3.67 a1044 ± 68.2 a17.1 ± 0.84 a488 ± 41.2 b
Note: Same letters with each measurement indicate no differences between treatment levels at α = 0.10.
Table 5. Analysis of covariance results for diameter increment. Results include F-statistic (F) and p-values (p) for the first three five-year increment periods (2004–2009, 2009–2014, and 2014–2018) at the plot level. Initial diameters D0 (diameters in 2004, 2009 and 2014) were used as covariates.
EffectDIc (cm)
2014–20182009–20142004–2009
FpFpFp
T53.33<0.01 ***50.24<0.01 ***58.94<0.01 ***
F15.41<0.01 ***33.68<0.01 ***25.98<0.01 ***
Sp2.050.03 **2.160.02 **2.49<0.01 ***
TxF2.880.02 **9.49<0.01 ***32.77<0.01 ***
D097.55<0.01 ***84.99<0.01 ***83.34<0.01 ***
Note: Significance levels: p < 0.05 (**), p < 0.01 (***)
Table 6. Growth increment analysis of covariance results. Plot mean diameter increment (DI), mean annual basal area increment (BAI) and mean volume increment (VI) for 2019–2021. Results include F-statistic (F) and p-values (p). Covariates for DI, BAI and VI were initial diameter (D0), basal area (BA0), and volume (V0) measurements in 2019.
EffectDI (cm yr−1)BAI (m2 ha−1 yr−1)VI (m3 ha−1 yr−1)
FpFpFp
T9.11<0.01 ***8.50<0.01 ***11.06<0.01 ***
F30.23<0.01 ***7.35<0.01 ***5.44<0.01 ***
TxF10.48<0.01 ***0.540.710.470.76
Covariate230.23<0.01 ***1.170.294.340.04 **
Note: Significance levels: p < 0.05 (**), p < 0.01 (***).
Table 7. Analysis of variance (ANOVA) and analysis of covariance (ANCOVA) results for understory Shannon–Wiener diversity index (H), richness (S) and evenness (J). Results include F-statistic (F) and p-values (p). ANOVA assessed effects of reclaimed water treatment (T) and facility (F) for the diversity parameters. The ANCOVA assessed the effects of establishment date (E) as a covariate.
TestEffectBiomass (g m−2)Shannon–Wiener Diversity Index (H)Richness (S)Evenness (J)
FpFpFpFp
ANOVAT5.30.03 **2.170.150.940.340.940.34
F20.69<0.01 ***3.080.03 **3.80<0.01 ***1.940.12
TxF1.670.172.640.05 **0.880.482.170.09 *
ANCOVAT0.010.911.840.180.950.340.800.38
E58.38<0.01 ***6.88<0.01 ***12.62<0.01 ***1.880.18
TxE0.020.900.470.500.600.440.020.88
Note: Significance levels: p < 0.1 (*), p < 0.05 (**), p < 0.01 (***).
Table 8. Analysis of variance (ANOVA) and analysis of covariance (ANCOVA) for overstory Shannon–Wiener diversity index (H), richness (S) and evenness (J). Results include F-statistic (F) and p-values (p) for the parameters. Facility establishment date (E) was used as the ANCOVA covariate.
TestEffectShannon–Wiener Diversity Index (H)Richness (S)Evenness (J)
FpFpFp
ANOVAT1.490.230.170.683.750.06 *
F5.67<0.01 ***12.32<0.01 ***2.990.03 **
TxF1.150.350.560.690.960.44
ANCOVAT1.160.290.160.693.110.09 *
E6.430.02 **38.94<0.01 ***0.180.67
TxE0.100.750.050.830.060.81
Note: Significance levels: p < 0.1 (*), p < 0.05 (**), p < 0.01 (***).
Disclaimer/Publisher’s Note: The statements, opinions and data contained in all publications are solely those of the individual author(s) and contributor(s) and not of MDPI and/or the editor(s). MDPI and/or the editor(s) disclaim responsibility for any injury to people or property resulting from any ideas, methods, instructions or products referred to in the content.

