Article

Effect of Landscape Elements on Public Psychology in Urban Park Waterfront Green Space: A Quantitative Study by Semantic Segmentation

1
College of Architecture and Urban Planning, Fujian University of Technology, Fuzhou 350118, China
2
College of Landscape Architecture and Art, Fujian Agriculture and Forestry University, Fuzhou 350000, China
*
Author to whom correspondence should be addressed.
Forests 2023, 14(2), 244; https://doi.org/10.3390/f14020244
Submission received: 20 November 2022 / Revised: 21 December 2022 / Accepted: 26 January 2023 / Published: 28 January 2023
(This article belongs to the Special Issue Landsenses in Green Spaces)

Abstract

:
Urban park waterfront green spaces provide positive mental health benefits to the public. In order to further explore the specific influence mechanism between landscape elements and public psychological response, 36 typical waterfront green areas in Xihu Park and Zuohai Park in Gulou District, Fuzhou City, Fujian Province, China, were selected for this study. We used semantic segmentation technology to quantitatively decompose the 36 scenes of landscape elements and obtained a public psychological response evaluation using virtual reality technology combined with questionnaire interviews. The main results showed that: (1) the Pyramid Scene Parsing Network (PSPNet) is a model suitable for quantitative decomposition of landscape elements of urban park waterfront green space; (2) the public’s overall evaluation of psychological responses to the 36 scenes was relatively high, with the psychological dimension scoring the highest; (3) different landscape elements showed significant differences in four dimensions. Among the elements, plant layer, pavement proportion, and commercial facilities all have an impact on the four dimensions; and (4) the contribution rate of the four element types to the public’s psychological response is shown as spatial element (37.9%) > facility element (35.1%) > natural element (25.0%) > construction element (2.0%). The obtained results reveal the influence of different landscape elements in urban park waterfront green spaces on public psychology and behavior. Meanwhile, it provides links and methods that can be involved in the planning and design of urban park waterfront green space, and also provides emerging technical support and objective data reference for subsequent research.

1. Introduction

According to the “World Urbanization Prospects” prepared by the United Nations, 55% of the population will live in cities by 2018, and this number is expected to rise to nearly 70% by 2050, indicating that human beings are gradually concentrating in cities. Studies from various sources mention that urbanized life actually affects the health of residents on a physical and psychological level. At the physical level, respiratory problems [1], cardiovascular diseases [2,3], immune diseases [4], and kidney diseases [5] brought about by changes in the living environment pose a challenge to human health. Urban life in densely populated areas may also have a number of psychological effects on residents. One study showed that people living in the most densely populated areas had a 68%–77% higher risk of mental illness and a 12%–20% higher risk of depression than those living in areas with low levels of urbanization [6], with urbanized environments placing varying degrees of cognitive and emotional stress on residents [7], along with a reduction in their sense of well-being [8]. In the current context of COVID-19 gripping the world, urban residents are facing dramatic changes in their lives, with disruptions in daily life, the risk of unemployment, and social isolation sounding the alarm for a range of emotional stresses and mental illnesses [9,10,11]. The emergence of these mental illnesses is a reminder that people are becoming aware of the various stresses associated with urban life and that mental health issues need to be taken seriously.
Wilson, a proponent of the Biophilia Hypothesis, pointed out that human beings come from nature, instinctively such as nature, adore nature, and are attracted to nature [12], and that contact with the natural environment can greatly reduce stress and help with mental recovery [13], as well as enhancing feelings of pleasure [14]. Further research indicates that people show higher preference, restoration, and motivation for landscapes that contain water [15,16]. Compared with other green spaces, spending time in or around waterfront spaces will significantly reduce people’s negative emotions and mental stress [17] and effectively increase their sense of well-being [18]. Researchers from environmental psychology and environmental health have pointed to the potential of waterfront spaces to become health-promoting “therapeutic landscapes” [19]. Many studies have confirmed the positive effects of exposure to waterfront environments. For example, epidemiological evidence suggests that urban residents living close to blue spaces report more positive general health conditions compared to residents in other areas [20], and that they are significantly less likely to suffer from mental illness [21]; Gascon M et al. [22,23] based on a study of the association between waterfront landscapes and public psychology indicated that there are mechanisms of influence between the two that reduce stress, downplay anxiety, enhance restorative qualities, and provide evidence of effective positive benefits, as well as positive alleviating effects on specific psychological disorders such as mood disorders and psychological distress; Pasanen et al. noted that waterfront spaces can encourage people to engage in sports and exercise to regulate their lifestyles [24] and promote positive social interactions [25]; Gao et al. [26] argue that forested water spaces, especially dynamic water features, contribute to the public’s emotional attitude towards the environment; and Britton et al. [27] further emphasized that an emphasis on the exploration of the mechanisms of influence between waterfront space and human health is key to future research. For this reason, urban park waterfront green space has become an excellent vehicle for urban residents to engage with nature. It provides a variety of positive benefits to residents, and it is also essential to focus on the psychological healing benefits that this environment provides. However, it is worth noting that the presence of an element in the environment and the differences in its visual representation may provide different perceptual effects. For example, studies have mentioned that changes in the sky openness, building height, vegetation area, water proportion, etc. in the scene may also change the public’s perception attitude to a certain extent [28,29,30]. This means that, in addition to the qualitative evaluation of the structure and form of landscape elements, the quantitative visual effects conveyed by the landscape are also an important part of measuring the public’s perception attitude. However, there is still a lack of research on urban park waterfront green space, and systematic evaluation indexes and quantitative methods have not been developed yet.
With the continuous development of the computer field, the interdisciplinary application of emerging technologies is gradually gaining academic attention. In recent years, deep learning for semantic segmentation in artificial intelligence has become a trending topic. The principle of semantic segmentation lies in the automatic analysis of a large amount of data and feature learning, which effectively extracts the low, medium, and high level information from the image and achieves pixel-level predictive classification of unknown images depending on the expressed semantics. Its powerful image processing capabilities make automated processing of large volumes of image data a reality [31]. In addition to applications in medical imaging and artificial driving, there is a new trend to use semantic segmentation of images to quantify landscapes and to combine public perception to provide effective guidance for future planning and design. Currently, semantic segmentation is more often applied in studies related to streetscapes in landscape gardening habitat research, such as the measurement of urban street composition [32], pedestrian space [33], quality assessment [34], and aesthetic judgement [35]. We note that there are few examples of this technique being applied to other landscape types, such as the urban park waterfront that is the subject of this study. Urban park waterfront green space has different and more complex components than street landscapes, with common elements such as sky, trees, and buildings, as well as unique landscape elements such as landscape vignettes and landscape structures. However, the application of semantic segmentation to urban park waterfront green space has not yet been discussed or investigated empirically. With the continuous development of deep learning algorithms, more and more deep learning-based segmentation models are gradually developed. The selection of models and datasets applicable to urban park waterfront green space will help expand the scenario of landscape gardening applications of semantic segmentation, and also provide new technical support for the quantitative evaluation of urban park waterfront green space, and there is some room for exploration in this area of research.
Virtual Reality (VR) in the field of computer simulation bridges the gap between traditional image studies. As a method of maximizing the simulation of the perceived spatial environment [36,37], VR provides a convenient and rapid representation of the natural environment for the public without having to leave home. Recent studies have shown that in addition to visual appreciation, the immersive nature scenes offered by VR can have a near-realistic emotional and psychological healing effect on people [38,39,40,41]. Subjects experiencing virtual natural scenes within a safe period of time (5–10 min) can significantly improve physiological stress [42,43], become more “fascinating” and “coherent” in psychological recovery [44], and further enhance human emotions and awareness [45]. Based on a large number of existing studies, the application of virtual reality in scene presentation is considered novel, effective, and feasible, and has a wide range of application prospects.
The information conveyed by the objective environment provides multisensory stimulation and subsequently has an impact on human physical and mental health; this interaction indicates a potential relationship between the two [46]. How to change the objective physical environment characteristics to enhance public mental health while incorporating feedback and application of public mental health to landscape design is the key to the study of urban park waterfront green space and public mental health. In addition, the emergence of new technologies has helped us conduct scientific research more efficiently and objectively. Based on this, this paper takes Xihu Park and Zuohai Park in Gulou District, Fuzhou City, Fujian Province, China, as the study subjects and explores the following:
(1)
Analyze the differences between different semantic segmentation models and datasets applied to urban park waterfront green space images, and find out which semantic segmentation model and dataset are capable of efficiently and accurately obtaining quantitative data on urban park waterfront green spaces;
(2)
Using semantic segmentation and virtual reality as technical support, analyze what impact urban park waterfront green spaces have on the public psyche;
(3)
To further explore whether different landscape elements in urban park waterfront green spaces have an impact on public psychology, and what the specific mechanisms of impact are.
This study aims to explore the impact of urban park waterfront green spaces on public psychology from the perspective of public response, to identify landscape elements in urban park waterfront green spaces that may have positive or negative psychological benefits to the public, and to further examine the specific mechanisms and the degree of importance of these landscape elements in influencing public psychology. Through this study, it is possible to provide links and ways to intervene in the landscape construction and optimal design of urban park waterfront green spaces and to provide effective and targeted solutions for the development of urban park waterfront environments with psychological healing benefits.

2. Materials and Methods

2.1. Study Sites

The study site, Fuzhou, Fujian Province, is located in the southeastern hills, the first of the three major hills in China, and is a typical city in the hilly region. Xihu Park and Zuohai Park are located in the Gulou District of Fuzhou, in the heart of the bustling city, surrounded by famous attractions such as Three Lanes and Seven Alleys, and Fuway. The park is surrounded by many offices, such as the Fujian Provincial Government and the Fujian Provincial Forestry Bureau, and many residential communities, serving a wide range of people and belonging to a typical urban park.
Xihu Park is a classical garden park with a long history and the most complete preservation in Fuzhou and is known as the “Pearl of Fujian Gardens”. It was first built in the third year of Jin’s Taikang dynasty and was renovated in 1914 to become the present-day Xihu Park. The park is classically beautiful and is a citywide comprehensive park combining history and culture with natural landscape. With a total area of about 0.4251 km2 and a water surface of 0.303 km2, Zuohai Park is one of the first and largest parks in Fuzhou. In 1990, local farmers converted the northern part of the site belonging to the former Xihu to create the present Zuohai Park. Zuohai Park was established with Xihu Park as a reference and incorporates more characteristic parks and modern facilities, covering an area of 0.3547 km2 and a water surface of 0.1814 km2. In 2015, based on the concept of “Great Xihu”, Fuzhou City implemented a wooden walkway around the lake and the water system to connect the two parks, making the Xihu and Zuohai Park into one, creating a landscape planning pattern of “one water, two parks, three peaks and four shores”, thus forming a representative urban waterfront park in Fuzhou City, which is also an important part of the city’s landscape pattern and is regarded as one of the top ten scenic spots in Fuzhou. Both parks are well equipped with functional zones and various facilities that can meet the needs of Fuzhou citizens for various types of leisure and recreational activities. Based on this, the study takes Xihu Park and Zuohai Park as the research objects, which are typical and representative.
The completed landscape nodes of the park usually play the role of guiding visitors to gather. In this study, the distribution map of landscape nodes in the park was used as the basis and further combined with fieldwork to select sample sites; 36 scenes were finally identified as sample sites for this study (Figure 1), including waterfront roads, squares, pavilions, viewing platforms, and other important landscape nodes. The principles of sample site selection are as follows: (1) the waterfront landscape as a linear tour space; the experimental selection of sample scenarios with established landscape nodes that can simulate the walking route of visitors along the waterfront trail. (2) Select sample scenarios with a high frequency of viewing, which refers to a certain amount of human traffic observed in the actual survey in the early stages. (3) The sample scenarios should be able to objectively and comprehensively reflect the characteristics of the park and should have natural (soil, vegetation, water bodies, etc.) and artificial (buildings, squares, paths, facilities, etc.) landscape elements, with the water environment in the field of view.

2.2. Virtual Reality Image Acquisition

To restore the objective integrity of the scenes, VR images were used as visual stimuli to initiate public perception assessment. The study used the “insta 360 ONE” panoramic camera for sample scenario scenes collection from 10:00 to 14:30 on 27 December 2020. The camera was fixed at a level of 1.6 m above the ground with a tripod, which ensures that the shooting height is consistent with the level of the human eye and reduces the error caused by manual hand-held operation. A total of 98 VR images were taken, with an output resolution of 6912 × 3456 pixels. After eliminating images with similar angles, large differences in light perception, and more irrelevant influencing factors, 36 VR images that could restore the whole picture of the park were selected as the research samples for this study.

2.3. Participants and Procedure

A total of 40 volunteers, 21 males and 19 females, aged between 19 and 30 years old (M = 23.7, SD = 2.9), were recruited as subjects for this experiment among university teachers and students. Young students and teachers are considered to have diverse professional backgrounds, as well as a certain level of environmental perception and a wide range of preferences [26,47]. The method of using young students and teachers as respondents has been widely used in previous studies [48,49,50,51] and is considered to have low cost and high effectiveness, so the selection of this group as subjects is feasible and representative. Considering the purpose of the experiment, all 40 subjects were reported to have good mental health or no mental disorders (as judged by the results of university psychological tests); no history of cardiovascular and neuropsychiatric disease; normal or corrected visual acuity reported in both eyes; and were able to wear VR devices continuously for a short time without strong discomfort. The evaluation process includes the following three steps (Figure 2): (1) stress experiment: before the experiment, participants were invited to complete the short Spielberger State-Trait Anxiety Inventory (STAI-S), which is used to effectively assess participants’ current psychological status. The test consists of 20 items, each assessed on a 4-point scale, with scores from 1 to 4 corresponding to a stepwise scale of “not at all” to “fully”. Then, the auditory continuous addition test (PASAT) proposed by neuropsychologist Deary was used to stimulate the anxiety and stress levels of the subjects, who were asked to complete random number calculation questions without any computing equipment, and an alarm would be triggered if they answered incorrectly. Lastly, participants were asked to complete the STAI-S test again after the experiment; (2) VR experience: subjects were asked to wear a head-mounted display device and experience 36 VR scenes one by one by turning their heads or bodies. To prevent dizziness, fatigue, and other discomforting reactions caused by prolonged viewing of VR scenes, the length of continuous experience should be 5–10 min [41,52,53]. Given the large number of samples in this experiment, the samples were divided equally into three groups to start the virtual scene experience, with each group experiencing for 8–9 min and being allowed to take a 3-min break at the end of each group experience; (3) questionnaire completion: with the help of the short version of the recovery scale (SRRS) proposed by Han [54], public psychological responses were collected from four dimensions: emotional, physical, cognitive, and behavioral, as shown in Table 1. The questionnaire was scored on a 7-point scale with scores 1 to 7 corresponding to a stepped scale of strongly agree to strongly disagree. All 40 subjects completed the above experiment according to the procedure, which showed that the design and time control of the VR experiment were reasonable.

2.4. GSA-Based Landscape Element Screening

Based on Wang’s classification of park landscape elements [55], by consulting experts in landscape architecture and related fields, the environmental characteristics were initially decomposed into 20 pre-selected landscape elements from four aspects: spatial elements, natural elements, construction elements, and facility elements.
Grey Statistic Analysis (GSA) is a fuzzy statistical method based on “little” information and “uncertainty” [56], which can effectively solve the limitations of researchers’ knowledge structures and is considered to be effective in improving the scientificity of element selection. For further screening of primary selection elements with GSA, the process is as follows: (1) the questionnaire was sent to 20 landscape architecture experts to solicit their opinions on the importance of the indexes of the elements, and the questionnaire used a 7-level scale, with levels 1 to 7 indicating a stepped scale from “very unimportant” to “very important”; (2) the pre-selected elements are classified into three levels: high, medium, and low. To construct a gray category whitening function, the calculation formula is shown in (1)–(3); (3) to calculate the decision coefficients of gray categories, the formula is shown in (4). Obtain the decision coefficients of high, medium, and low gray categories of each element, and select the elements with “high” importance to start the subsequent study. The final selection of landscape elements is shown in Table 2.
f 1 ( a b ) = { 1 h a b 7 h a b 4 7 4 4 < h a b < 7 0 h a b 4
f 2 ( a b ) = { 0 h a b 7 7 h a b 7 4 4 < h a b < 7 1 h a b = 4 h a b 1 4 1 1 < h a b < 4 0 h a b 1
f 3 ( a b ) = { 0 h a b 4 4 h a b 4 1 1 < h a b < 4 1 h a b 1
η k ( b ) =   L ( a b ) × f k ( a b )
In the formula:
f k ( a b ) —denotes the value of the whitening function, with the importance of the bth indicator as a, and k denotes the number of gray classes as 1, 2, and 3.
h a b —denotes the importance of the bth indicator as the value of the assignment of a.
η k ( b ) —indicates that the bth indicator is the decision coefficient of the kth gray class.
L ( a b ) —indicates the number of experts whose importance factor of the bth indicator is an assignment of a.
Table 2. Landscape element index selection.
TypeLandscape IndicatorsCalculation MethodQuantification MethodsNo.
Spatial elementsSky opennessProportion of the sky in the viewSemantic segmentationK1
Visual complexitySpace composition complexity indexMatlabK2
Colorfulness of spaceColorful index of space elementsK3
Natural elementsGreen viewing ratioProportion of vegetation in the viewSemantic segmentationZ1
Blue viewing ratioProportion of water in the viewZ2
Plant layersNumber of tree, shrub, and herb strata in the plant landscapeCounting statisticsZ3
Plant colorfulnessNumber of colored foliage and flowering plant speciesZ4
Soil exposureProportion of bare soil in the viewSemantic segmentationZ5
Plant growth conditionCondition of decaying and dead plants in the plant landscape, with = 0, without = 1Assignment statisticsZ6
Building elementsBuilding proportionProportion of buildings in the viewSemantic segmentationJ1
Pavement proportionThe proportion of paving in the viewJ2
Pavement formMasonry = 0, wood = 1, pebbles = 2Assignment statisticsJ3
Vignette proportionProportion of vignettes in the viewSemantic segmentationJ4
Humanistic atmosphereProportion of traditional buildings in the viewJ5
Facility elementsCommercial facilitiesThe proportion of commercial facilities, such as cruise ships and amusement facilitiesS1

2.5. Scene Quantization Decomposition Based on Semantic Segmentation

We used semantic segmentation as an auxiliary technique to quickly obtain objective and accurate quantitative data from the scenes, which can quickly achieve pixel-level classification based on the semantic information contained in the image. It is usually based on both CNN models and datasets. In order to improve the segmentation accuracy of waterfront green space, we intend to compare the current excellent model algorithms and build a training dataset with urban green space as the main part, so as to select the optimal model for subsequent analysis.

2.5.1. Model Selection and Semantic Segmentation Accuracy Improvement

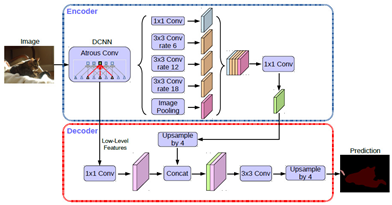
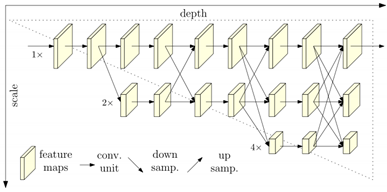
Using PASCAL VOC, a world-class challenge in computer vision, three models (DeepLabV3+ [57], PSPNet [58], and HRNet [59]) with excellent performance on this dataset were initially selected. The three models are widely used in the current study. The models used scenes that contained streets, natural landscapes, remote sensing images, etc., and showed a high level of accuracy (Table 3).
Semantic segmentation requires learning and obtaining laws from scenes with a large number of annotated objects (a training dataset). In addition to the structural conditions of the model itself, the quantity, quality, and diversity of the training dataset will have a significant impact on the segmentation accuracy. To improve the recognition accuracy of the model on urban park waterfront green space images, this study expanded the annotated samples of urban green space images on the basis of ADE20K dataset in a targeted manner to establish the training dataset of this paper, and the specific steps are as follows: (1) image acquisition: a large number of images were acquired using panoramic cameras, DSLR cameras, and other devices, and the acquisition image conditions cover different weather, lighting, etc.; (2) sample labeling: the image labeling software LabelMe, developed by the Computer Science and Artificial Intelligence Laboratory (CSAIL) at the Massachusetts Institute of Technology (MIT), was used to label the acquired images with polylines. The label categories were based on the ADE20K dataset labels; and (3) dataset establishment: sample data were stored in JSON files with annotation information and output.

2.5.2. Semantic Segmentation Accuracy Calculation

Semantic Segmentation accuracy is usually measured in terms of Mean Intersection over Union (MIoU) [60], which describes the overlap ratio of predicted and real pixels of an image.
M I o U = 1 k + 1 i = 0 k p i i j = 0 k p i j + j = 0 k p j i p i i
In the formula:
k —indicates total number of landscape tag categories.
p i i —indicates the total number of pixels of real pixel category i that are predicted to be of category I.
p i j —indicates the total number of pixels of real pixel category i that are predicted as category j.
p j i —indicates the total number of pixels of real pixel category j predicted to be of category I.

2.6. Statistical Analysis

Different analysis methods were used for different data: (1) SPSS 20 statistical software was used to conduct multiple reliability and validity tests on the subjective questionnaire to verify its scientific and accuracy; (2) a paired sample t-test was conducted to compare STAI-S data (pre-PASAT vs. post-PASAT) to ensure the PASAT increased the stress level of subjects significantly; (3) partial correlation analysis was used in analysis of subject–object correlations, using partial correlation coefficient as a criterion, the factors with low correlation were gradually removed; (4) conduct multiple linear regression analysis. The adjusted coefficient of determination R2 was used to test the fit of the multiple regression line to the observed values and used analysis of variance (ANOVA) to test whether the multiple regression estimation equation was statistically significant. The significance level (p < 0.0001) and the p-value indicated the significant level of the single factor (p < 0.05). The statistical analysis was completed in SPSS Statistics 22.0.

3. Results

3.1. Results of Semantic Segmentation

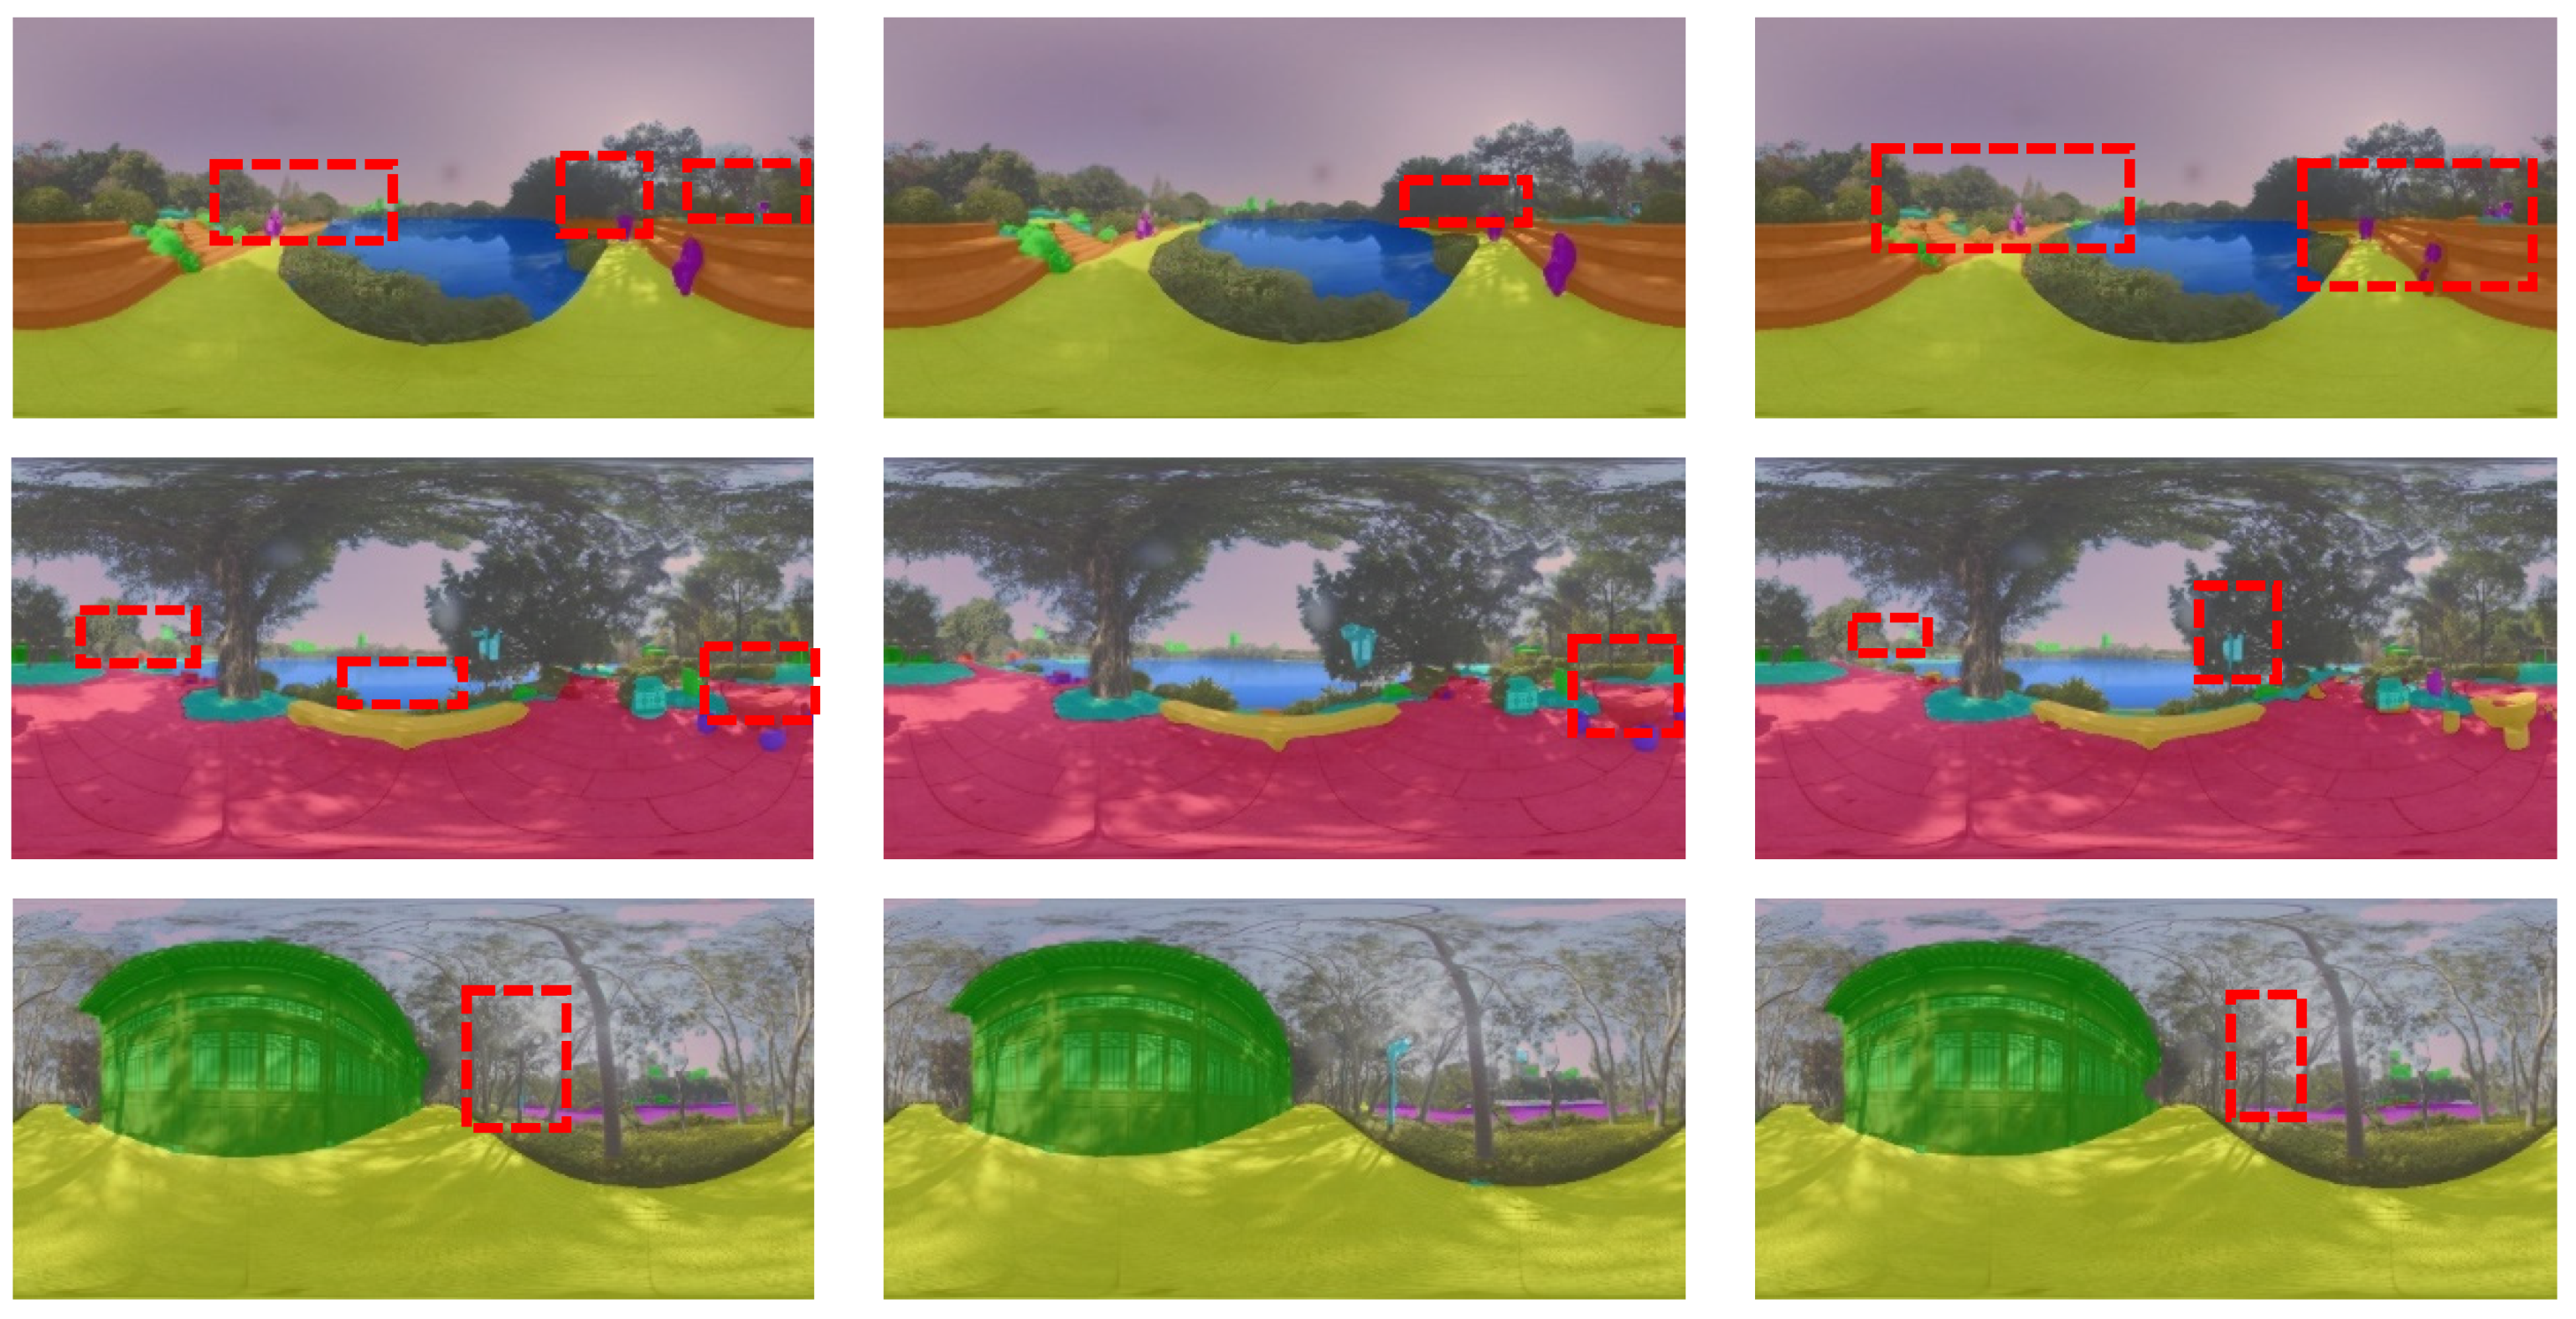
The semantic segmentation results show that the three models trained by the dataset of this paper can correctly identify and classify the elements with a larger pixel share, such as sky, greenery, roads, and pavements, along the contour of the image (Figure 3). PSPNet, compared with DeepLabV3+, is less likely to miss identifying small-scale landscape elements, such as distant buildings, low shrubs, and scenic rocks, and it can also achieve better accurate label classification. HRNet’s recognition performance was relatively inaccurate. There were many misclassifications, omissions, and multiple classifications of the same object for both near and distant landscape elements, which were subject to the influence of light and other factors in the segmentation process.
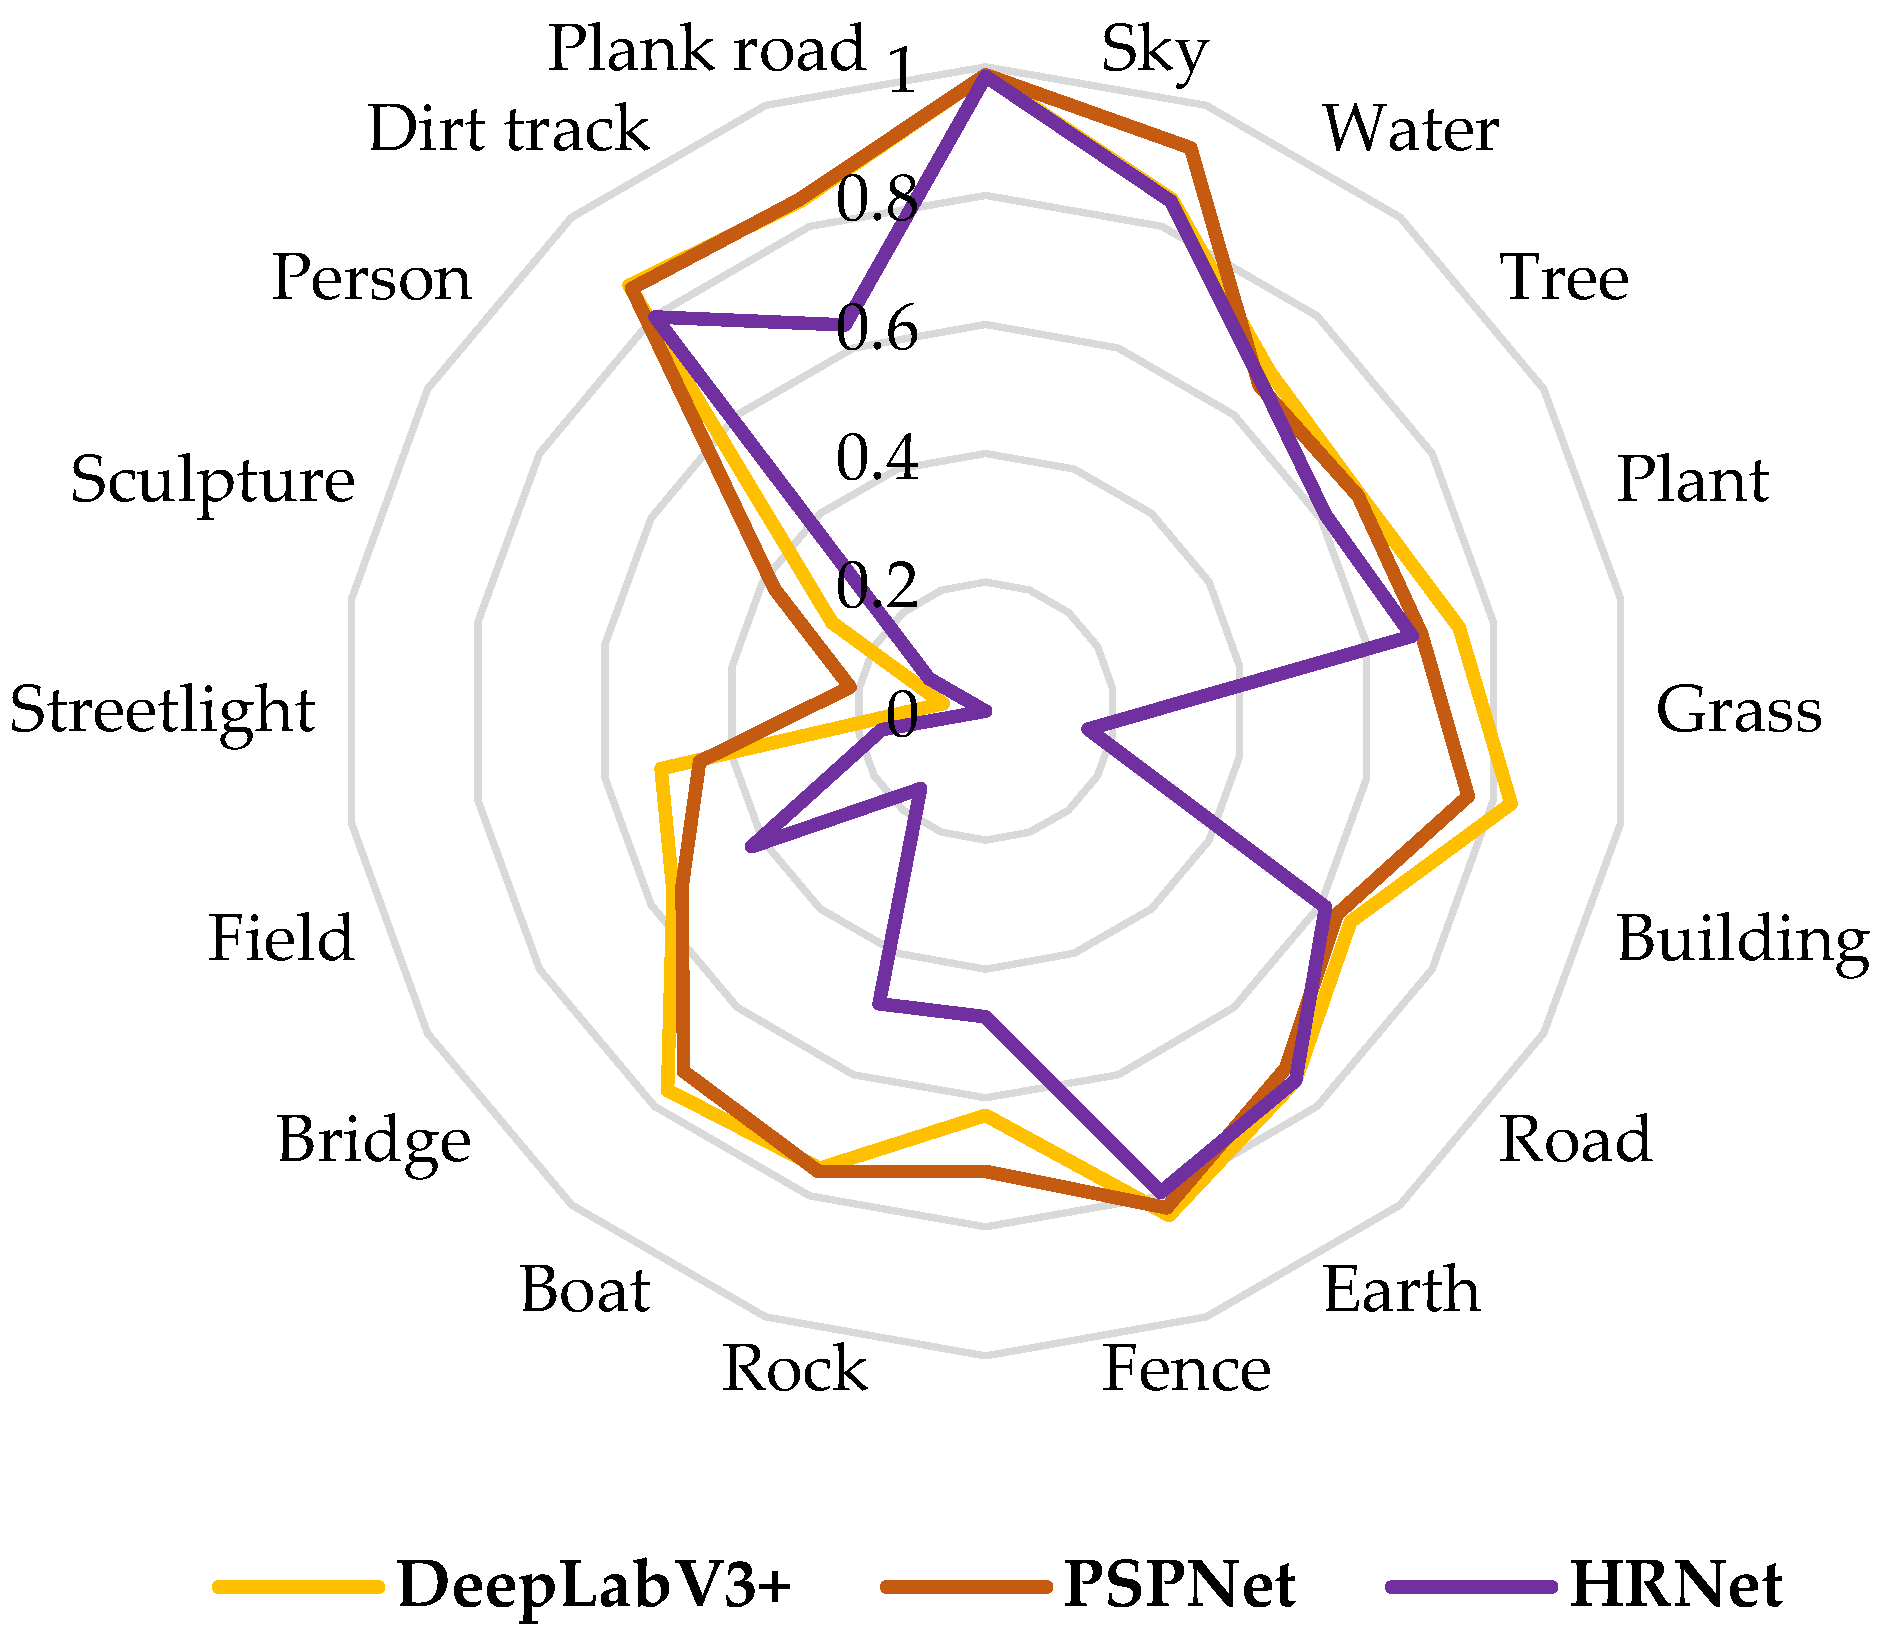
The semantic segmentation accuracy of the three models on the urban park waterfront green space was obtained after excluding the indoor landscape categories such as “Sofa” and “Chair” in the ADE20k dataset (Figure 4). Using MIoU as the criterion, the ranking performance of the three models is PSPNet (0.6865) > DeepLabV3+ (0.6816) > HRNet (0.5179).
To confirm the validity of the dataset constructed in this study, the segmentation results of PSPNet trained by the ADE20k dataset and our dataset were compared. The PSPNet trained by the ADE20k dataset on the scene was unsatisfactory, as shown in Table 4, with fragmented and disordered segmentation, uneven recognition and classification of objects, low edge fit, and almost no recognition of small-scale elements such as distant scenes and facilities. The PSPNet model trained by our dataset greatly improved on the above failures, and most of the elements can be segmented and correctly classified independently. The edge recognition was finer, while the segmentation effect of small-scale elements had been improved, and in general, the segmentation integrity and completeness were significantly better than the previous model. The data show that the PSPNet model trained by the dataset of this paper has significantly improved in both PA and MIoU test criteria, and the MIoU is improved by about 26.8%, which verifies the advantageousness of the dataset of this paper.

3.2. The Public Psychological Response of Urban Park Waterfront Green Space

3.2.1. Test on Reliability and Validity

The questionnaire reliability test showed that the overall Cronbach’s α value of the study scale was 0.741, which was greater than 0.6, indicating that the scale has a relatively good internal consistency and a high degree of reliability; the Kaiser-Meyer-Olkin (KMO) was 0.758, and the significance of the Barlett’s spherical test statistic was 0.000, indicating that the questionnaire has a high degree of association and good structural validity.

3.2.2. Public Psychological Response Results

The question items of the psychological dimension (F3) of the SRRS measure psychological arousal [54], so the scores of this dimension were calculated upside down. The results of the questionnaire analysis and cluster analysis showed that the distribution of the public’s psychological response levels to the 36 scenarios tended to be moderate to high, with the highest score being sample 4 (5.05), and the lowest being sample 7 (3.89).
The scores for each dimension showed that F3 > F1 > F2 > F4 (Figure 5). The sample scenarios convey a higher restorative benefit to the public in F3, while it still falls short in F4. In terms of standard deviation, the subjects’ perceptions were more consistent in F3 (0.17), and the perceived differences were greater in F4 (0.43).
The two scenarios with the highest and lowest psychological response scores were explored further. As shown in Table 5 and Table 6, the scores of psychological dimensions (4.89) and cognitive dimensions (4.97) in scenario 4 were lower than those of behavioral dimensions (5.00) and emotional dimensions (5.32). The highest scoring emotional dimension was particularly demonstrated by the switch from anxiety to relaxation (E2 = 5.38), which was the highest mean score for the subfeature factor in this scenario. In scenario 7, the behavioral dimensions (3.30) and the cognitive dimensions (3.59) scored lower than the emotional dimensions (4.19) and the psychological dimensions (4.49). The psychological impact of the scenario on the public is particularly evident in the reduction of people’s dwell time (B2 = 3.24) and frequency of visits (B1 = 3.35); in addition, two sub-trait factors of the cognitive dimensions (C1 = 3.57 and C2 = 3.62) contributed to the lower mental response scores in scenario 7.

3.3. How Do Landscape Elements Affect Public Psychology

3.3.1. Psychological Response Model Construction

Four dimensions (emotional dimension, cognitive dimension, psychological dimension, and behavioral dimension) were used as dependent variables, and the quantified values of landscape elements were used as independent variables to carry out the partial correlation analysis. The elements with low bias correlation coefficients were gradually eliminated according to the results, and the linear regression model of the four dimensions was established with the final retained elements.
The multiple linear regression model shows that colorfulness of space (K3) plays the greatest positive influence in F1 and F3 (p < 0.05), commercial facilities (S1) is the factor with the greatest negative influence in the F1 (p < 0.05), and visual complexity (K2) shows the greatest negative influence in F3 (p < 0.05); in F2 and F4, those showing the greatest positive as well as negative influence are plant layers (Z3) and commercial facilities (S1) (p < 0.05).
The results of the goodness of fit and significant level tests showed that the adjusted R2 for the 4 models were 0.570, 0.452, 0.480, and 0.421, respectively. The established regression equations were considered to have a good degree of explanation, corresponding to a p ≤ 0.001, indicating a high level of significance and a statistically significant equation (Table 7).

3.3.2. Specific Mechanisms of Influence of Landscape Elements on Public Psychology

From the coefficients of the established regression model, it was clear that there were differences in the contribution of each factor indicator in different dimensions, with the overall performance of spatial elements (average = 37.9%) > facility elements (average = 35.2%) > natural elements (average = 25.0%) > construction elements (average = 2.0%).
Among the types of elements that have an impact on the public’s psychological response, the spatial elements include K2 and K3; the facility element is S1; the natural elements include Z1, Z2, Z3, Z5, and Z6; and the construction elements include J1 and J2. Among them, we note that the 3 elements Z3, J2, and S1 provide some contribution to all 4 dimensions of the public’s psychological response (Figure 6).

4. Discussion

4.1. Semantic Segmentation Model and Dataset for Urban Park Waterfront Green Space

Through the comparison of the three models, the PSPNet trained by the dataset of this paper is considered to be a more suitable semantic segmentation model for urban park waterfront green space, and its accuracy exceeds 0.60, which was considered to reach a good level of semantic segmentation accuracy [61]. The single-element data show that the model performs well (MIoU > 0.60) for 14 of the 18 element categories, including the sky, water, and trees, and achieves an accuracy level of more than 0.90 for 2 elements in particular: the sky and water. The reason was that the morphological and color characteristics of these elements were more fixed in this study [62], which made it easy for the model to determine and recognize them. However, the model is still deficient in identifying small-scale elements, such as sculptures, people, and streetlights. This was due to the fact that small-scale landscape elements contain a relatively low percentage of pixels in the scene representation, and their information, such as color, texture, and semantic features, were weakened in a series of pooling and convolution operations, which increased the difficulty of detection [63]. On the other hand, there were spatial sequences of the foreground and background in the image, and the depth setting of the dataset’s annotated objects makes the segmentation process usually recognize the complete outline of the foreground landscape (e.g., trees) as a unit and ignore the pores between trunks, branches, leaves, etc. [64]. The background elements that are heavily obscured by the foreground landscape were difficult to accurately recognize in the complex environment due to the incompleteness of the appearance outline, which leads to a bias in recognition.
Semantic segmentation is based on a combination of two aspects: the model and the dataset. In terms of datasets, the current one that is often used is usually collected from streetscapes and does not include annotated samples of elements specific to park scenes. This makes the model unable to learn and summarize the semantic patterns, which leads to the disadvantage of identifying urban park images. In this paper, we increase the sampling rate and annotation amount of elements specific to park landscapes (e.g., landscape streetlights, scenic stones, pavilions) based on the ADE20k dataset. Comparing the results of the PSPNet trained by the ADE20k dataset and the dataset of this paper, it is noted that the model trained by our dataset shows a significant advantage (a 26.8% improvement in MIoU), confirming that this initiative can effectively improve the recognition accuracy of the model for urban park images, which is consistent with the previously mentioned approach [65].
In addition, the distortion caused by the conversion of VR scenes to flat projection can degrade the segmentation performance of the model [66]. This is due to a certain degree of distortion or stretching at the edges and bottom of the converted image, which leads to a reduction in segmentation accuracy due to non-compliance with the semantic laws of the model. Semantic enhancement inputs can mitigate the distortion of target detection based on this condition [66]. We added a large number of annotated samples taken by panoramic cameras to this study, and a comparative study shows that the initiative effectively helps the model learn the patterns of panoramic images and shows a significant improvement in recognition accuracy.

4.2. The Impact of Virtual Reality-Based Urban Park Waterfront Green Space on Public Psychological Response

The public’s psychological response ratings for these 36 sample sites tended to be moderate to high, in line with Kaplan’s concept of a restorative environment, which refers to the public’s ability to recover and relax physically and mentally after spending time in such an environment [67]. The public’s psychological response reflects differences in four dimensions: first, the public showed higher restorative benefits and higher consistency on the psychological dimension, which may be due to the fact that green spaces were usually places of relaxation, and subjects were less experience excessive physiological arousal when exposed to natural landscapes [68]; second, the public harvested less recovery in the behavioral dimension and showed more variation. It is possible that this is related to the season, as people are less likely to stay outdoors In the cold winter. In addition, subjects may express different behavioral intentions when facing the same scenario due to their personalities and emotional differences; for example, Scenario 26 was a more remote corner in a park, and some subjects believed that a quiet place to get away from the noise and enjoy solitude could bring better healing effects [69]. Additionally, some subjects would feel insecure due to the remoteness of the scenario, which led to a reluctance to stay for a long time.
Ulrich, a proponent of environmental stress relief theory, argues that the physical environment can be a source of stress or relief and that a healing natural environment should have the following characteristics: an abundance of natural elements, especially greenery and water; a complexity of environmental content with focal points in the spatial structure; a medium to high level of visual depth; winding view corridors; and the absence of things that could pose a danger [70]. Analysis of the scenarios with the highest and lowest public psychological response scores revealed that the scene (scenario 4) with the highest psychological response is a pavilion environment to the left of the entrance to Zuohai Park. The overall style here tends to be classical with a quiet environment, which is thought to be effective in regulating public mood. Through the interviews, we know that the public focuses on resting and other experiences. In addition to visual experiences when visiting, the presence of the pavilion seats in Scenario 4 enhances the public’s willingness to act. In the psychological dimension, the public felt slightly faster breathing (P1 = 4.73), which may be related to the scenario being close to water and without a safety guardrail. The results of the scenario analysis found that Scenario 7 has a significantly higher percentage of commercial facilities (0.65%) than other scenarios, with the top 3 percentages. Based on the significant impact factors, we know that commercial facilities have a negative impact on all four dimensions to varying degrees, which is likely the biggest reason for the low score of this scenario. In addition, the scene space is monotonous in color, the plant growth condition is poor, and the overall lack of visual appeal makes it difficult for the public to find attention and interest when viewing. Poor environmental shade may also be responsible for reducing the length of sustained exploration and the frequency of visits by the public.
This study introduced virtual reality technology in the acquisition of public psychological data, and the results of the study showed convergence with the results of the field experiment. That is, near-natural environments in cities, including urban park waterfront green space, provide an effective restorative environment in which experiences can bring positive benefits such as fatigue relief, emotional recovery, and improved cognitive functioning [49,71], while increasing their willingness to act [72]. In previous studies, virtual reality has been used to compare landscape representations with real environments, pictures, videos, and other methods. The results show that virtual reality provides a three-dimensional environment that closely resembles the real environment and gives the viewer a more “immersive” experience than traditional media such as pictures [36,37]. The subjects’ view of VR was largely consistent with the live view, and the psychological evaluations yielded feedback that was significantly closer to the live scene [73].

4.3. Mechanisms of Influence of Urban Park Waterfront Green Space Landscape Elements on Different Psychological Dimensions of the Public

The four element types have different degrees of influence and mechanisms of action on the four dimensions of public psychological response. Spatial elements show the highest contribution rate (37.9%), while construction elements show the lowest contribution rate (2.0%).

4.3.1. Spatial Element

Among the spatial elements, K2 and K3 were two factors that affected the public’s psychological response. Scenes with high visual complexity reduced the public’s psychological perception of F2, F3, and F4, and showed a greater negative effect in F2 (33.6%) and F4 (34.3%). This is consistent with previous research findings, where dealing with complex scenarios often requires greater cognitive effort on the part of the public [74], which may also further influence the public’s willingness to behave. K3 as the element with the greatest positive contribution in both F1 (31.8%) and F3 (24.3%), the color experiment in the last century pointed out that when people are looking at things, color will first attract 80% of attention, and at the same time, color will have a lot of complex effects on people’s psychology and physiology through visual contact [75]. This paper further suggests, from a psychological perspective, that rich spatial colors can liberate people from negative emotions and enhance the level of psychological recovery.

4.3.2. Facility Element

S1 affects the public’s psychological changes to a large extent, which are reflected in F1 (49.4%), F2 (40.6%), and F4 (36.3%), especially in F1, which shows a contribution of nearly 50%, indicating that with the increase in the proportion of commercial facilities, the public is very prone to negative emotions such as anxiety and irritability. In addition, the frequent appearance of S1 greatly weakens the attraction of the scene; the degree of interest and psychological calming effect of the crowd decrease; the frequency of visits and the intention to stay for a long time also decrease; and the overall psychological feeling develops in a negative direction. This is a distinctive feature; the public was repulsed by messy and disorderly commercial facilities [76]. This is reflected in this study by the presence of commercial signs, brightly colored boats, etc. in the sample, which form a clear difference in the park landscape. This suggests that future planning should focus on the location of large commercial facilities and a coordinated and uniform style of commercial elements.

4.3.3. Natural Element

Linear regression models indicated that Z3 was the natural element with the largest contribution (average = 16.8%) to public psychology, and showed positive correlation with all 4 dimensions of psychological response. Previous studies have noted that greenery is the element that receives the most attention in visual evaluation and can have positive psychological benefits [77]. We further found in this study that Z3 in particular stimulates and prolongs the frequency and duration of public visits, contributing to the public’s willingness to visit the space for extended periods of healthy activity. Z5 is the element with the second largest contribution (4.5%) to public psychology, as reflected in F1, F2, and F4. Previous studies often ignore the impact of surface vegetation on people’s visual and psychological response. One study mentioned that when people viewed the natural environment with restoration needs, shrubs are the longest viewed component of the environment [78]; spending time observing trees, bushes, and lower ground vegetation resulted in a higher likelihood of restoration [79]. This suggests that the creation of low-level plant landscapes, such as grass and flowers, also need attention and more soil exposure can have a negative psychological impact. Plant landscapes with conditions such as dead branches and fallen leaves were usually considered to reduce the restorative qualities [51], which in this study were specifically shown to have a psychological arousing effect on the public. There was a negative correlation between Z1 and the public’s psychological response, which is contrary to the existence of previous studies. The green-visibility environment in this study mostly consisted of tall trees and less grass and shrubs; this type of planting may create a sense of psychological unease due to the strong sense of enclosure, and may make it difficult to find a visual focus due to the monotony of the landscape, which in turn reduces the desire to stay. Z2 showed a negative effect on F3 but has no obvious effect on other dimensions. This may be related to the fact that the sample sites in this study are all watered environments; however, great blue ratings means that it is closer to the water, while the lack of safety fences also leads to a sense of insecurity.

4.3.4. Construction Element

In comparison, the construction element provides a much lower contribution (2.0%) than the other three element types. This may be due to the fact that the sample parks contained relatively few built elements (mean building proportion = 4.46%, mean paving proportion = 29.6%) or were better integrated with the park style and, therefore, less likely to provide a greater impact on public psychology. Both two elements included in construction element show a negative correlation with the public’s psychological response; this supports a well-established understanding [77]. The increase in the proportion of the hard landscape leads to the lack of naturalness of the scene, which breaks the continuity and immersion of people enjoying the natural landscape, making it impossible for people to obtain a higher psychological healing effect [80,81].

5. Limitations

There were still some limitations in this study: (1) the public’s perception of the scene and a series of complex psychological and behavioral activities are related to each other’s perception indicators. Focusing on other rich sensory experiences and the public’s dynamic perception and recreational behavior in the park will further help us collect more comprehensive feedback data; (2) in terms of research objects, urban waterfronts usually include multiple types, and other different types of waterfront green spaces should be included in the follow-up research to summarize a sound urban waterfront green space characteristic system with a psychological healing effect; (3) there was still room for PSPNet to improve the recognition of small-scale landscape elements. We should target to improve the sampling rate and sample annotation of small-scale elements, and further enhance the detection rate and recognition accuracy of small-scale targets in order to provide more accurate and effective environmental data. In addition, the subjects selected in this study were all university faculty and students, which did not take into account the variability of social groups, and the population sample should be expanded in the future to obtain more comprehensive and in-depth findings.

6. Conclusions

As an important place that provides urban residents with access to nature, research on the association between urban park waterfront green space and public psychology is necessary. However, the specific mental health benefits provided by urban park waterfronts and the role of each of the microscopic landscape elements on public psychology remain to be further explored. Based on the above, this study selected 36 sample sites in Xihu Park and Zuohai Park in Gulou District, Fuzhou City, Fujian Province, China, and introduced semantic segmentation and virtual reality as the technical support for obtaining subjective and objective quantitative data to conduct a study on the association between urban park waterfront green space and the public’s psychological response. The following conclusions were eventually drawn:
(1)
In terms of the application of semantic segmentation, the results indicate that PSPNet is a more suitable semantic segmentation model for urban park waterfronts. In terms of dataset, compared to the model trained by the ADE20k dataset, the PSPNet trained by the dataset in this paper shows a higher level of accuracy, which can be used as a technical support to obtain quantitative environmental data of urban park waterfront green space efficiently and accurately;
(2)
In terms of the results of the public’s psychological response to urban park waterfront green spaces, urban park waterfront green spaces provide a psychologically healing environment for the public, with the psychological dimension > emotional dimension > cognitive dimension > behavioral dimension in the different psychological response dimensions. The public’s psychological relief is better in urban park waterfronts, while the effects of the behavioral dimensions, such as frequency of visits and length of stay, need to be improved;
(3)
In terms of the specific role played by landscape elements in urban park waterfront green spaces, among the four types of landscape elements, the spatial element is the element type with the greatest contribution to public psychology, followed by the facility element and the natural element, with the construction element producing the lowest impact. Specifically, rich spatial color, complex plant community forms, and good plant growth can provide positive effects on public psychology, while complex spatial composition, a higher proportion of construction, and facility elements can reduce people’s psychological mitigation effects.
These results confirm the effectiveness of the emerging technologies in the application of urban park waterfronts and the specific ways in which they can be applied. In addition, the findings suggest the psychological healing effects of waterfront green spaces in urban parks. In future planning and design, attention to the construction of spatial and facility elements will have a significant effect on the construction of urban park waterfront green spaces with psychological healing as the main theme.

Author Contributions

Conceptualization, J.L., Z.Z. and W.F. (Weicong Fu); methodology, J.L., Z.Z. and W.F. (Weicong Fu); software, J.L., D.Z. and P.H.; validation, J.L., Y.Z. and S.H.; formal analysis, J.L. and Z.H.; investigation, J.L., Z.H., D.Z., Y.Z., P.H., S.H. and W.F. (Wenqiang Fang); resources, Z.Z.; data curation, J.L.; writing—original draft preparation, J.L.; writing—review and editing, J.L. and Z.Z. All authors have read and agreed to the published version of the manuscript.

Funding

The Natural Science Foundation of Fujian Province of China: Research on the influence mechanism and optimization strategy of urban green space spatial differentiation on air quality. Grant number: 2022J01233348.

Data Availability Statement

The data used to support the findings of this study are available from the corresponding author upon request.

Conflicts of Interest

The authors declare no conflict of interest.

References

  1. Liu, Q.; Xu, C.; Ji, G.; Liu, H.; Shao, W.; Zhang, C.; Gu, A.; Zhao, P. Effect of exposure to ambient PM2.5 pollution on the risk of respiratory tract diseases: A meta-analysis of cohort studies. J. Biomed. Res. 2017, 31, 130–142. [Google Scholar]
  2. Mustafić, H.; Jabre, P.; Caussin, C.; Murad, M.H.; Escolano, S.; Tafflet, M.; Périer, M.C.; Marijon, E.; Vernerey, D.; Empana, J.P. Main air pollutants and myocardial infarction: A systematic review and meta-analysis. Jama J. Am. Med. Assoc. 2012, 307, 713–721. [Google Scholar] [CrossRef] [Green Version]
  3. Kramer, C.K.; Leitão, C.B.; Viana, L.V. The impact of urbanisation on the cardiometabolic health of Indigenous Brazilian peoples: A systematic review and meta-analysis, and data from the Brazilian Health registry. Lancet 2022, 400, 2074. [Google Scholar] [CrossRef]
  4. Danielsson, M.; Heimerson, I.; Lundberg, U.; Perski, A.; Stefansson, C.G.; Akerstedt, T. Psychosocial stress and health problems: Health in Sweden: The National Public Health Report 2012. Chapter 6. Scand. J. Public Health 2012, 40, 121–134. [Google Scholar] [CrossRef] [PubMed] [Green Version]
  5. Liang, Z.; Wang, W.; Wang, Y.; Ma, L.; Liang, C.; Li, P.; Yang, C.; Wei, F.; Li, S.; Zhang, L. Urbanization, ambient air pollution, and prevalence of chronic kidney disease: A nationwide cross-sectional study. Environ. Int. 2021, 156, 106752. [Google Scholar] [CrossRef] [PubMed]
  6. Kristina, S.; Gölin, F.; Jan, S. Urbanisation and incidence of psychosis and depression. Br. J. Psychiatry 2004, 184, 293–298. [Google Scholar]
  7. Peng, G.; Song, L.; Elizabeth, J.C.; Qingwu, J.; Jianyong, W.; Lei, W.; Justin, V.R. Urbanisation and health in China. Lancet 2012, 379, 843–852. [Google Scholar]
  8. Okulicz-Kozaryn, A.; Valente, R.R. Urban unhappiness is common. Cities 2021, 118, 103368. [Google Scholar] [CrossRef]
  9. Tang, F.; Liang, J.; Zhang, H.; Kelifa, M.M.; He, Q.; Wang, P. COVID-19 related depression and anxiety among quarantined respondents. Psychol. Health 2020, 36, 164–178. [Google Scholar] [CrossRef]
  10. Zabini, F.; Albanese, L.; Becheri, F.R.; Gavazzi, G.; Giganti, F.; Giovanelli, F.; Gronchi, G.; Guazzini, A.; Laurino, M.; Li, Q.; et al. Comparative Study of the Restorative Effects of Forest and Urban Videos during COVID-19 Lockdown: Intrinsic and Benchmark Values. Int. J. Environ. Res. Public Health 2020, 17, 8011. [Google Scholar] [CrossRef]
  11. Pfefferbaum, B.; North, C.S. Mental Health and the COVID-19 Pandemic. N. Engl. J. Med. 2020, 383, 510–512. [Google Scholar] [CrossRef]
  12. Wilson, E.; Massachusetts, U. Biophilia; Harvard University Press: Cambridge, MA, USA, 1984; pp. 1–157. [Google Scholar]
  13. Guo, X.; Liu, J.; Albert, C.; Hong, X. Audio-visual interaction and visitor characteristics affect perceived soundscape restorativeness: Case study in five parks in China. Urban For. Urban Green. 2022, 77, 127738. [Google Scholar] [CrossRef]
  14. Hong, X.; Wang, G.; Liu, J.; Song, L.; Wu, E.T.Y. Modeling the impact of soundscape drivers on perceived birdsongs in urban forests. J. Clean. Prod. 2021, 292, 125315. [Google Scholar] [CrossRef]
  15. Mathew, W.; Amanda, S.; Kelly, H.; Sabine, P.; Deborah, S.; Michael, D. Blue space: The importance of water for preference, affect, and restorativeness ratings of natural and built scenes. J. Environ. Psychol. 2010, 30, 482–493. [Google Scholar]
  16. Jesper, J.A.; Stefan, W.; Mats, E.N. Stress Recovery during Exposure to Nature Sound and Environmental Noise. Int. J. Environ. Res. Public Health 2010, 7, 1036–1046. [Google Scholar]
  17. Volker, S.; Kistemann, T. Developing the urban blue: Comparative health responses to blue and green urban open spaces in Germany. Health Place 2015, 35, 196–205. [Google Scholar] [CrossRef]
  18. Garrett, J.K.; White, M.P.; Huang, J.; Ng, S.; Hui, Z.; Leung, C.; Tse, L.A.; Fung, F.; Elliott, L.R.; Depledge, M.H.; et al. Urban blue space and health and wellbeing in Hong Kong: Results from a survey of older adults. Health Place 2019, 55, 100–110. [Google Scholar] [CrossRef]
  19. Volker, S.; Kistemann, T. The impact of blue space on human health and well-being—Salutogenetic health effects of inland surface waters: A review. Int. J. Hyg. Environ. Health 2011, 214, 449–460. [Google Scholar] [CrossRef]
  20. Hooyberg, A.; Roose, H.; Grellier, J.; Elliott, L.R.; Lonneville, B.; White, M.P.; Michels, N.; De Henauw, S.; Vandegehuchte, M.; Everaert, G. General health and residential proximity to the coast in Belgium: Results from a cross-sectional health survey. Environ. Res. 2020, 184, 109225. [Google Scholar] [CrossRef] [Green Version]
  21. Garrett, J.K.; Clitherow, T.J.; White, M.P.; Wheeler, B.W.; Fleming, L.E. Coastal proximity and mental health among urban adults in England: The moderating effect of household income. Health Place 2019, 59, 102200. [Google Scholar] [CrossRef]
  22. Nieuwenhuijsen, M.J.; Kruize, H.; Gidlow, C.; Andrusaityte, S.; Antó, J.M.; Basagaña, X.; Cirach, M.; Dadvand, P.; Danileviciute, A.; Donaire-Gonzalez, D.; et al. Positive health effects of the natural outdoor environment in typical populations in different regions in Europe (PHENOTYPE) a study programme protocol. BMJ Open 2014, 4, e4951. [Google Scholar] [CrossRef] [Green Version]
  23. Mireia, G.; Wilma, Z.; Cristina, V.; Mathew, P.W.; Mark, J.N. Outdoor blue spaces, human health and well-being: A systematic review of quantitative studies. Int. J. Hyg. Environ. Health 2017, 220, 1207–1221. [Google Scholar]
  24. Tytti, P.P.; Mathew, P.W.; Benedict, W.W.; Joanne, K.G.; Lewis, R.E. Neighbourhood blue space, health and wellbeing: The mediating role of different types of physical activity. Environ. Int. 2019, 131, 105016. [Google Scholar]
  25. Katherine, J.A.; Sabine, P.; Paul, W.; Mathew, P.W. The beach as a setting for families’ health promotion: A qualitative study with parents and children living in coastal regions in Southwest England. Health Place 2013, 23, 138–147. [Google Scholar]
  26. Gao, Y.; Zhang, T.; Zhang, W.; Meng, H.; Zhang, Z. Research on visual behavior characteristics and cognitive evaluation of different types of forest landscape spaces. Urban For. Urban Green. 2020, 54, 126788. [Google Scholar] [CrossRef]
  27. Britton, E.; Kindermann, G.; Domegan, C.; Carlin, C. Blue care: A systematic review of blue space interventions for health and wellbeing. Health Promot. Int. 2020, 35, 50–69. [Google Scholar] [CrossRef] [Green Version]
  28. Yohan, S.; Céline, C.; Jean-Christophe, F. Spatial modelling of landscape aesthetic potential in urban-rural fringes. J. Environ. Manag. 2016, 181, 623–636. [Google Scholar]
  29. Gungor, S.P.A.T. Relationship between visual quality and landscape characteristics in urban parks. J. Environ. Prot. Ecol. 2018, 19, 939–948. [Google Scholar]
  30. Li, L.; Riken, H.; Kazuhisa, I. Preferences for a lake landscape: Effects of building height and lake width. Environ. Impact Asses. 2018, 70, 22–33. [Google Scholar]
  31. LeCun, Y.; Bengio, Y.; Hinton, G. Deep learning. Nature 2015, 521, 436–444. [Google Scholar] [CrossRef] [PubMed]
  32. Gong, F.Y.; Zeng, Z.C.; Zhang, F.; Li, X.; Ng, E.; Norford, L.K. Mapping sky, tree, and building view factors of street canyons in a high-density urban environment. Build. Environ. 2018, 134, 155–167. [Google Scholar] [CrossRef]
  33. Nagata, S.; Nakaya, T.; Hanibuchi, T.; Amagasa, S.; Kikuchi, H.; Inoue, S. Objective scoring of streetscape walkability related to leisure walking: Statistical modeling approach with semantic segmentation of Google Street View images. Health Place 2020, 66, 102428. [Google Scholar] [CrossRef] [PubMed]
  34. Fan, Z.; Bolei, Z.; Liu, L.; Yu, L.; Helene, H.F.; Hui, L.; Carlo, R. Measuring human perceptions of a large-scale urban region using machine learning. Landsc. Urban Plan. 2018, 180, 148–160. [Google Scholar]
  35. Ye, Y.; Zeng, W.; Shen, Q.; Zhang, X.; Lu, Y.; Yang, P.P.; Yamagata, Y.; Badrinarayanan, V.; Kendall, A.; Cipolla, R.; et al. The visual quality of streets: A human-centred continuous measurement based on machine learning algorithms and street view images. Environ. Plan. B Urban Anal. City Sci. 2019, 46, 1439–1457. [Google Scholar] [CrossRef]
  36. Amit, B.; Martin, D.; Dick, E.; Joost, D.K.; Geert, D.L.; Nico, D. The utilization of immersive virtual environments for the investigation of environmental preferences. Landsc. Urban Plan. 2019, 189, 129–138. [Google Scholar]
  37. Chamilothori, K.; Wienold, J.; Andersen, M. Adequacy of Immersive Virtual Reality for the Perception of Daylit Spaces: Comparison of Real and Virtual Environments. Leukos J. Illum. Eng. Soc. N. Am. 2019, 15, 203–226. [Google Scholar] [CrossRef] [Green Version]
  38. Li, C.; Sun, C.; Sun, M.; Yuan, Y.; Li, P. Effects of brightness levels on stress recovery when viewing a virtual reality forest with simulated natural light. Urban For. Urban Green. 2020, 56, 126865. [Google Scholar] [CrossRef]
  39. Riva, G.; Bernardelli, L.; Castelnuovo, G.; Di Lernia, D.; Tuena, C.; Clementi, A.; Pedroli, E.; Malighetti, C.; Sforza, F.; Wiederhold, B.K.; et al. A Virtual Reality-Based Self-Help Intervention for Dealing with the Psychological Distress Associated with the COVID-19 Lockdown: An Effectiveness Study with a Two-Week Follow-Up. Int. J. Environ. Res. Public Health 2021, 18, 8188. [Google Scholar] [CrossRef] [PubMed]
  40. Anna, F.; Oswald, D.K.; Mareike, S.; Anna-Katharina, H.; Leon, B.; Helmut, H.; Ilse, K. Is virtual reality emotionally arousing? Investigating five emotion inducing virtual park scenarios. Int. J. Hum.-Comput. Stud. 2015, 82, 48–56. [Google Scholar]
  41. Yu, C.; Lee, H.; Luo, X. The effect of virtual reality forest and urban environments on physiological and psychologi-cal responses. Urban For. Urban Green. 2018, 35, 106–114. [Google Scholar] [CrossRef]
  42. Qiuyun, H.; Minyan, Y.; Hao-ann, J.; Shuhua, L.; Nicole, B. Trees, grass, or concrete? The effects of different types of environments on stress reduction. Landsc. Urban Plan. 2020, 193, 103654. [Google Scholar]
  43. Jie, Y.; Jing, Y.; Nastaran, A.; Paul, J.C.; Joseph, G.A.; John, D.S. Effects of biophilic indoor environment on stress and anxiety recovery: A between-subjects experiment in virtual reality. Environ. Int. 2020, 136, 105427. [Google Scholar]
  44. Osmo, M.; Arto, K.; Essi, P.; Kaisa, H.; Jani, H.; Petri, P. Restoration in a virtual reality forest environment. Comput. Hum. Behav. 2020, 107, 106295. [Google Scholar]
  45. Li, W.; Zhu, J.; Fu, L.; Zhu, Q.; Xie, Y.; Hu, Y. An augmented representation method of debris flow scenes to improve public perception. Int. J. Geogr. Inf. Sci. 2021, 35, 1521–1544. [Google Scholar] [CrossRef]
  46. Hu, F.; Wang, Z.; Sheng, G.; Lia, X.; Chen, C.; Geng, D.; Hong, X.; Xu, N.; Zhu, Z.; Zhang, Z.; et al. Impacts of national park tourism sites: A perceptual analysis from residents of three spatial levels of local communities in Banff national park. Environ. Dev. Sustain. 2022, 24, 3126–3145. [Google Scholar] [CrossRef]
  47. Van, D.; Joye, Y.; Koole, S.L. Why viewing nature is more fascinating and restorative than viewing buildings: A closer look at perceived complexity. Urban For. Urban Green. 2016, 20, 397–401. [Google Scholar]
  48. Jo, H.I.; Jeon, J.Y. The influence of human behavioral characteristics on soundscape perception in urban parks: Subjective and observational approaches. Landsc. Urban Plan. 2020, 203, 103890. [Google Scholar] [CrossRef]
  49. Deng, L.; Li, X.; Luo, H.; Fu, E.; Ma, J.; Sun, L.; Huang, Z.; Cai, S.; Jia, Y. Empirical study of landscape types, landscape elements and landscape components of the urban park promoting physiological and psychological restoration. Urban For. Urban Green. 2020, 48, 126488. [Google Scholar] [CrossRef]
  50. Li, D.; Sullivan, W.C. Impact of views to school landscapes on recovery from stress and mental fatigue. Landsc. Urban Plan. 2016, 148, 149–158. [Google Scholar] [CrossRef] [Green Version]
  51. Zhao, J.; Xu, W.; Ye, L. Effects of auditory-visual combinations on perceived restorative potential of urban green space. Appl. Acoust. 2018, 141, 169–177. [Google Scholar] [CrossRef]
  52. Calogiuri, G.; Litleskare, S.; Fagerheim, K.A.; Rydgren, T.L.; Brambilla, E.; Thurston, M. Experiencing Nature through Immersive Virtual Environments: Environmental Perceptions, Physical Engagement, and Affective Responses during a Simulated Nature Walk. Front. Psychol. 2018, 8, 2321–2335. [Google Scholar] [CrossRef] [PubMed] [Green Version]
  53. Zhang, Z.; Xu, L.Q. The Healing Benefits and Application of the Virtual Natural Environment. South Archit. 2020, 04, 34–40. [Google Scholar]
  54. Han, K. A reliable and valid self-rating measure of the restorative quality of natural environments. Landsc. Urban Plan. 2003, 64, 209–232. [Google Scholar] [CrossRef]
  55. Ning, X.; Wang, J. Study of Urban Public Space Based on Civic Daily Life: Case Study of Three Kinds of Public Space in Nanjing Old City. Archit. J. 2008, 8, 45–48. [Google Scholar]
  56. Julon, D. Gray Theory Foundation; Huazhong University of Science and Technology Press: Wuhan, China, 2002; pp. 40–42. [Google Scholar]
  57. Chen, L.; Zhu, Y.; Papandreou, G.; Schroff, F.; Adam, H. Encoder-Decoder with Atrous Separable Convolution for Semantic Image Segmentation. In Proceedings of the European Conference on Computer Vision (ECCV), Munich, Germany, 8–14 September 2018; Volume 11211, pp. 833–851. [Google Scholar]
  58. Zhao, H.; Shi, J.; Qi, X.; Wang, X.; Jia, J. Pyramid Scene Parsing Network. In Proceedings of the Conference on Computer Vision and Pattern Recognition, IEEE Computer Society, Honolulu, HI, USA, 21–26 July 2017. [Google Scholar]
  59. Sun, K.; Xiao, B.; Liu, D.; Wang, J. Deep High-Resolution Representation Learning for Human Pose Estimation. In Proceedings of the IEEE/CVF Conference on Computer Vision and Pattern Recognition (CVPR), Long Beach, CA, USA, 16–20 June 2019; pp. 5686–5696. [Google Scholar]
  60. Garcia-Garcia, A.; Orts-Escolano, S.; Oprea, S.; Villena-Martinez, V.; Garcia-Rodriguez, J. A Review on Deep Learning Techniques Applied to Semantic Segmentation. arXiv 2017, arXiv:1704.06857. [Google Scholar]
  61. Dang, H.; Li, J. The integration of urban streetscapes provides the possibility to fully quantify the ecological landscape of urban green spaces: A case study of Xi’an city. Ecol. Indic. 2021, 133, 108388. [Google Scholar] [CrossRef]
  62. Zhang, W.; Yang, M.; Zhou, Y. Visible Street Space Analysis Based on Geo-tagged Panoramic Images. J. Wuhan Univ. Technol. 2020, 42, 70–78. [Google Scholar]
  63. Lin, Y. Research on Small-Scale Pedestrian Real-Time Detection for Complex Road Scenes; Southwest Jiaotong University: Chengdu, China, 2020. [Google Scholar]
  64. Zhou, B.; Zhao, H.; Puig, X.; Xiao, T.; Fidler, S.; Barriuso, A.; Torralba, A. Semantic Understanding of Scenes Through the ADE20K Dataset. Int. J. Comput. Vis. 2019, 127, 302–321. [Google Scholar] [CrossRef] [Green Version]
  65. Kisantal, M.; Wojna, Z.; Murawski, J.; Naruniec, J.; Cho, K. Augmentation for small object detection. arXiv 2019, arXiv:1902.07296. [Google Scholar]
  66. Wang, M.; Lyu, X.; Li, Y.; Zhang, F. VR content creation and exploration with deep learning: A survey. Comput. Vis. Media 2020, 6, 3–28. [Google Scholar] [CrossRef] [Green Version]
  67. Kaplan, S.; Talbot, J.F. Psychological Benefits of a Wilderness Experience; Springer: Boston, MA, USA, 1983; Volume 6, pp. 163–203. [Google Scholar]
  68. Magdalena, V.D.B.; Mireille, V.P.; Graham, S.; Margarita, T.; Sandra, A.; Irene, V.K.; Willem, V.M.; Christopher, G.; Regina, G.; Mark, J.N.; et al. Does time spent on visits to green space mediate the associations between the level of residential greenness and mental health? Urban For. Urban Green. 2017, 25, 94–102. [Google Scholar]
  69. Staats, H.H.T. Alone or with a Friend: A Social Context for Psychological Restoration and Environmental Preferences. J. Environ. Psychol. 2004, 24, 199–211. [Google Scholar] [CrossRef]
  70. Ulrich, R.S. Aesthetic and Affective Response to Natural Environment; Springer: Boston, MA, USA, 1983. [Google Scholar]
  71. Chen, Z.; He, Y.; Yu, Y. Enhanced functional connectivity properties of human brains during in-situ nature experience. PeerJ 2016, 4, e2210. [Google Scholar] [CrossRef] [PubMed] [Green Version]
  72. Yao, W.; Yun, J.; Zhang, Y.; Meng, T.; Mu, Z. Usage behavior and health benefit perception of youth in urban parks: A case study from Qingdao, China. Front. Public Health 2022, 10, 923671. [Google Scholar] [CrossRef]
  73. Chen, Z.; Fu, W.; Zhu, Z.; Dong, J. Analysis of advantages and disadvantages of panorama presentation technology in landscape visual evaluation. J. Xi’an Univ. Archit. Technol. (Nat. Sci. Ed.) 2021, 53, 584–593. [Google Scholar]
  74. Yannick, J.; Agnes, V.D.B. Is love for green in our genes? A critical analysis of evolutionary assumptions in restorative environments research. Urban For. Urban Green. 2011, 10, 261–268. [Google Scholar]
  75. Fujisawa, H. Color Psychology; Scientific and Technical Literature Press: Beijing, China, 1989; pp. 1–103. [Google Scholar]
  76. Lü, X.; Li, H. The Layout of Micro Commercial Facilities in Street Space. Planners 2019, 35, 57–62. [Google Scholar]
  77. Liu, L.; Qu, H.; Ma, Y.; Wang, K.; Qu, H. Restorative benefits of urban green space: Physiological, psychological restoration and eye movement analysis. J. Environ. Manag. 2022, 301, 113930. [Google Scholar] [CrossRef]
  78. Nordh, H.; Hagerhall, C.M.; Holmqvist, K. Exploring view pattern and analysing pupil size as a measure of restorative qualities in park photos. Acta Hortic. 2010, 881, 767–772. [Google Scholar] [CrossRef]
  79. Kaplan, R.; Kaplan, S. The Experience of Nature: A Psychological Perspective; Cambridge University Press: Cambridge, UK, 1989. [Google Scholar]
  80. Kjell, N. Forests, trees and human health and wellbeing. Urban For. Urban Green. 2006, 5, 109. [Google Scholar]
  81. Velarde, M.D.; Fry, G.; Tveit, M. Health effects of viewing landscapes-Landscape types in environmental psychology. Urban For. Urban Green. 2007, 6, 199–212. [Google Scholar] [CrossRef]
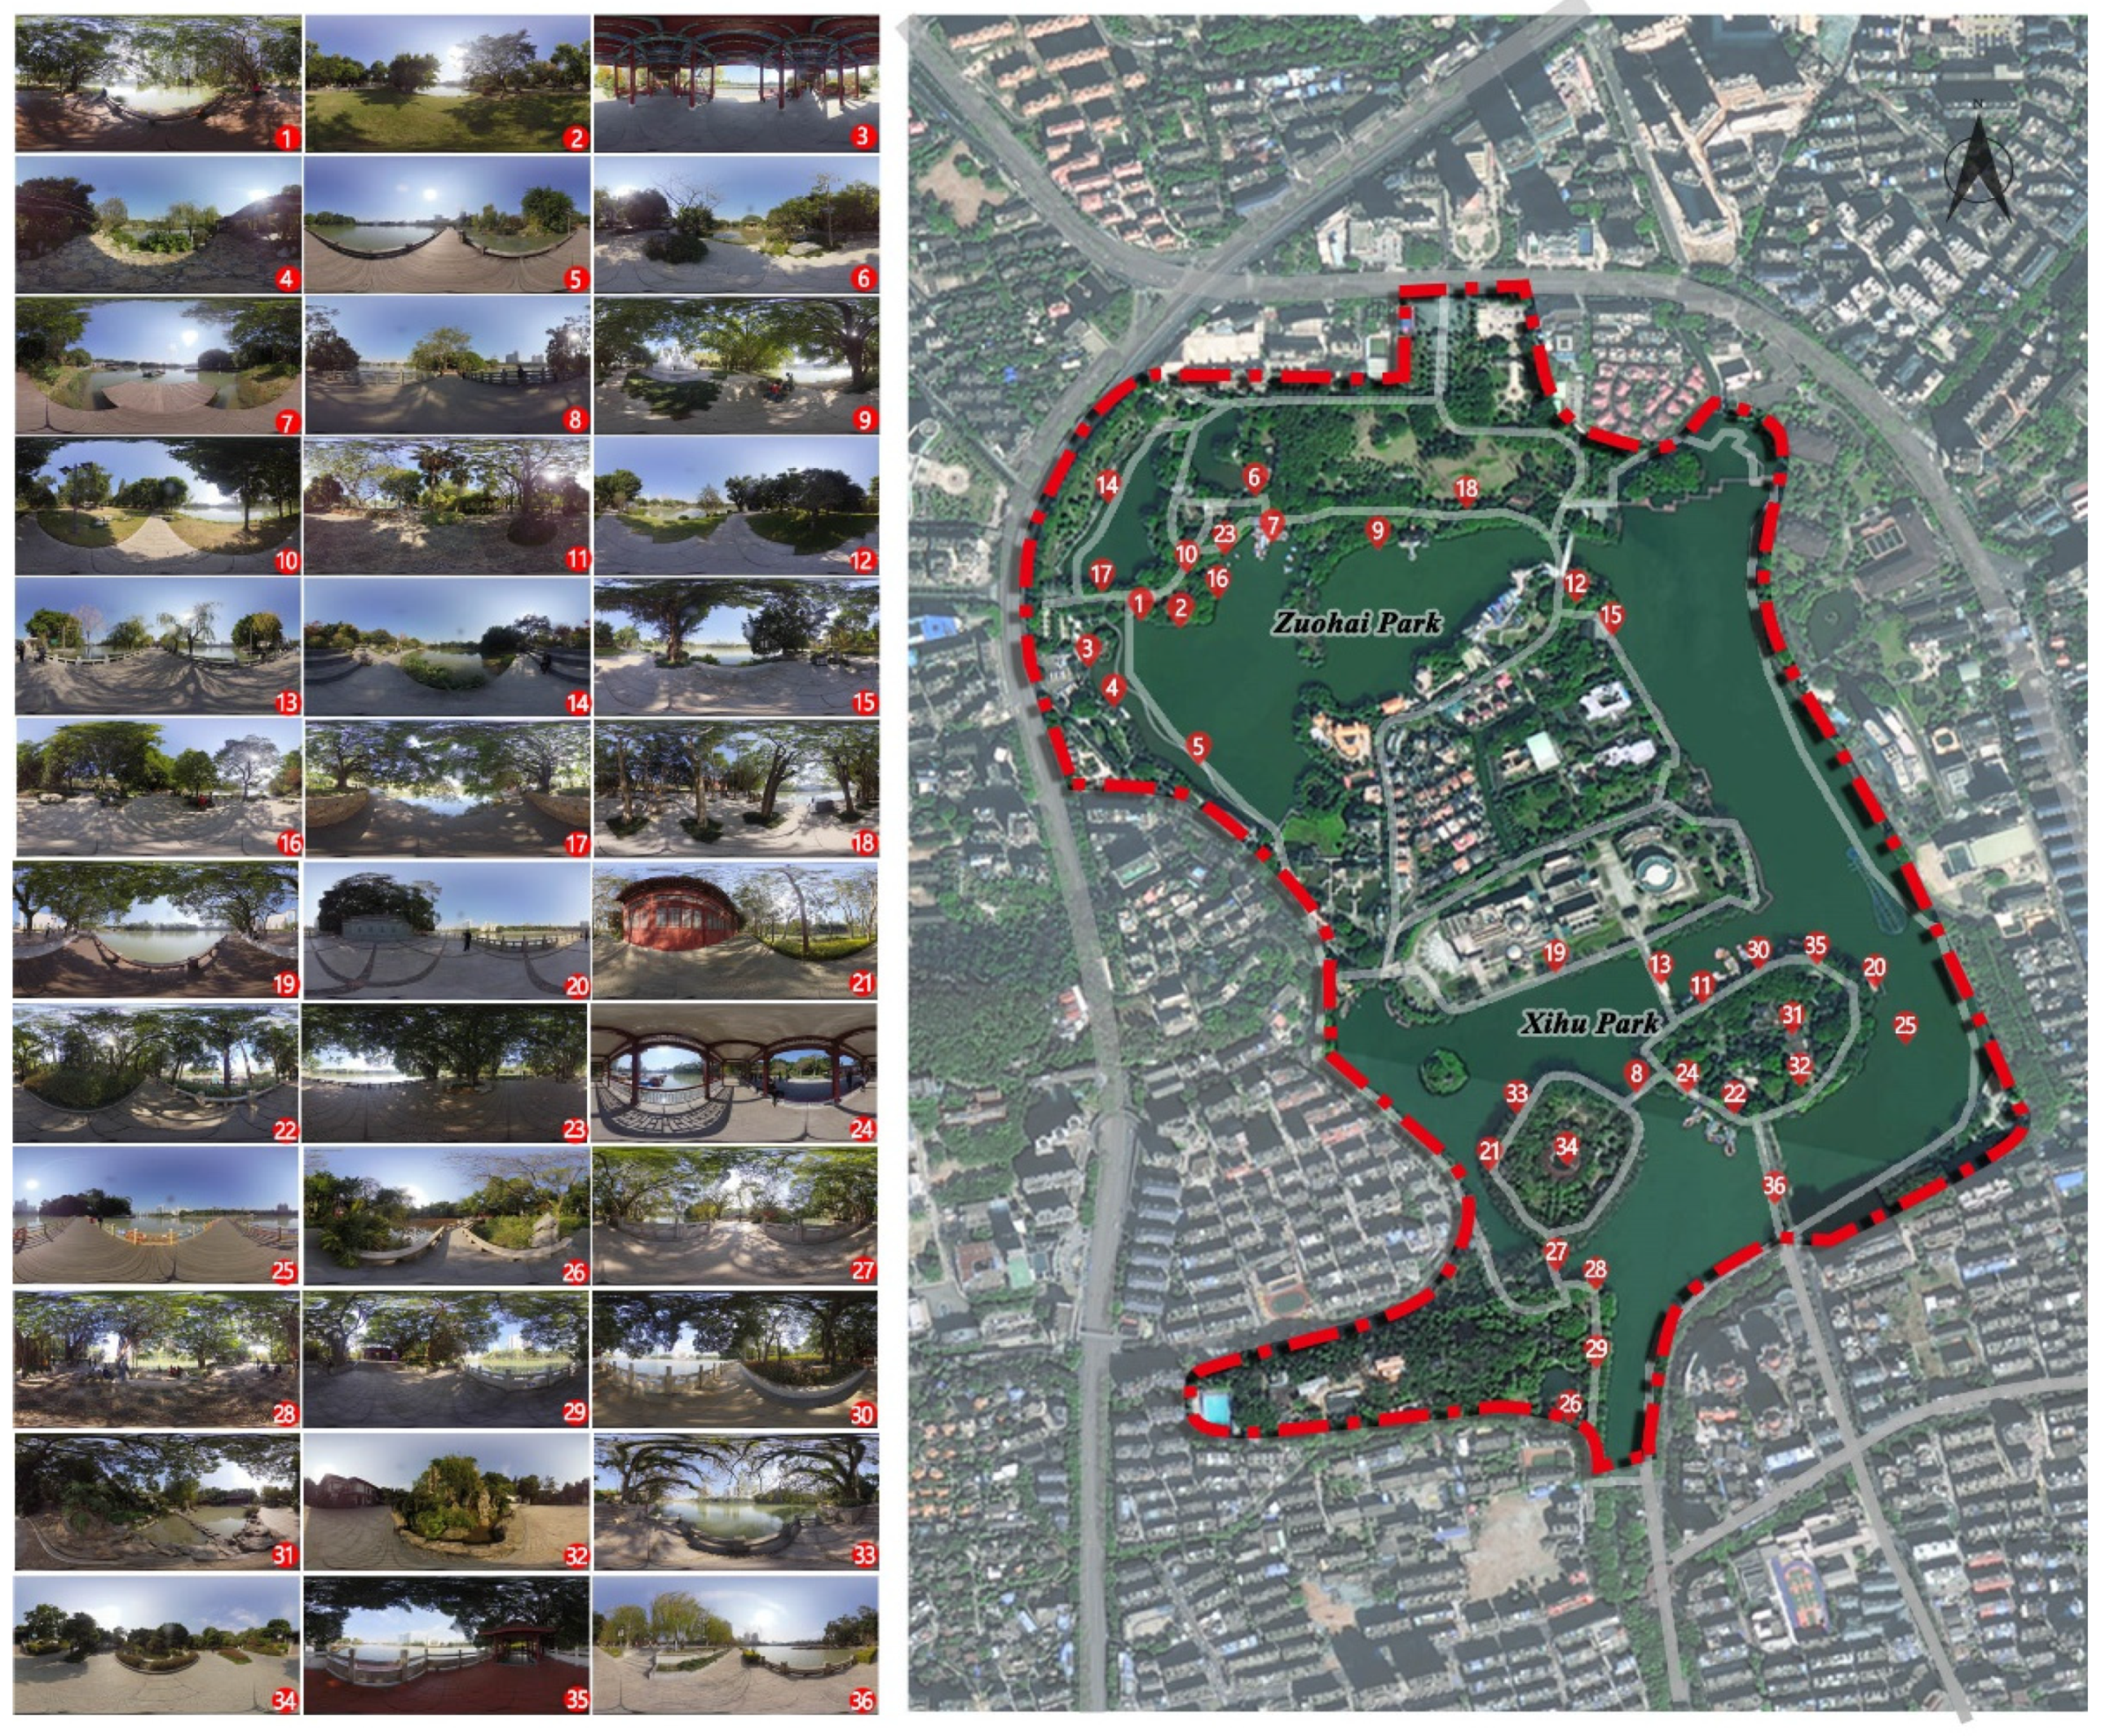
Figure 1. Sample scenarios selection.
Forests 14 00244 g001
Figure 2. Experimental process.
Forests 14 00244 g002
Figure 3. Segmentation results comparison.
Forests 14 00244 g003aForests 14 00244 g003b
Figure 4. Semantic segmentation results.
Forests 14 00244 g004
Figure 5. Differences in psychological response across four dimensions.
Forests 14 00244 g005
Figure 6. Contribution rate of spatial elements.
Forests 14 00244 g006
Table 1. Short-version revised restoration scale.
DimensionsItemScore
(F1) Emotional dimensionsV1, Grouchy–Good natured1, 2, 3, 4, 5, 6, 7
V2, Anxious–Relaxed1, 2, 3, 4, 5, 6, 7
(F2) Cognitive dimensionsV3, I am interested in the presented scene1, 2, 3, 4, 5, 6, 7
V4, I feel attentive to the presented scene1, 2, 3, 4, 5, 6, 7
(F3) Physiological dimensionsV5, My breathing is becoming faster1, 2, 3, 4, 5, 6, 7
V6, My hands are sweating1, 2, 3, 4, 5, 6, 7
(F4) Behavioral dimensionsV7, I would like to visit here more often1, 2, 3, 4, 5, 6, 7
V8, I would like to stay here longer1, 2, 3, 4, 5, 6, 7
Table 3. Model overview.
Name of ModelModel Network Architecture
DeepLabV3+Forests 14 00244 i001
PSPNetForests 14 00244 i002
HRNetForests 14 00244 i003
Note: The DeepLabV3+ model refers to the paper: Encoder-Decoder with Atrous Separable Convolution for Semantic Image Segmentation, doi:10.1007/978-3-030-01234-2_49; the PSPNet model refers to the paper: Pyramid Scene Parsing Network, doi:10.1109/CVPR.2017.660; and the HRNet model refers to the paper: Deep High-Resolution Representation Learning for Human Pose Estimation, doi:10.1109/CVPR.2019.00584.
Table 4. PSPNet segmentation results based on different datasets.
PAMIoUSchematic Diagram 1Schematic Diagram 2
PSPNet-trained by ADE20k dataset0.80390.4189Forests 14 00244 i004Forests 14 00244 i005
PSPNet-trained by the dataset in this paper0.87830.6865Forests 14 00244 i006Forests 14 00244 i007
Table 5. Psychological response results of scenario 4.
Emotional
Dimensions (E)
Cognitive
Dimensions (C)
Physiological
Dimensions
(P)
Behavioral Dimensions (B)
E1E2C1C2P1P2B1B2
Mean score of each subconstruct5.275.385.164.784.735.054.925.08
Mean score of each construct5.324.974.895
Table 6. Psychological response results of scenario 7.
Emotional
Dimensions (E)
Cognitive
Dimensions (C)
Physiological Dimensions (P)Behavioral
Dimensions (B)
E1E2C1C2P1P2B1B2
Mean score of each subconstruct4.114.213.573.624.324.653.353.24
Mean score of each construct4.163.594.493.30
Table 7. Multiple linear regression models for the psychological dimensions and the significant influences obtained.
Model BStd.
Error
Standardized
Coefficients
tSig.
F1
(R = 0.795 a, R2 = 0.632, Adjusted R2 = 0.570; F = 10.296, Sig. = 0.000 b)
(constant)4.8550.218 22.2720.000
K30.4200.1830.3022.3000.029
Z30.1580.0650.2822.4120.022
Z5−0.0770.022−0.463−3.4180.002
J2−0.0130.005−0.367−2.8510.008
S1−0.6530.111−0.690−5.9010.000
F2
(R = 0.739 a, R2 = 0.546, Adjusted R2 = 0.452; F = 5.808, Sig. = 0.000 b)
(constant)5.9910.552 10.8520.000
K2−0.4620.176−0.398−2.6220.014
Z1−0.0130.004−0.614−3.1630.004
Z30.2340.0920.3482.5450.017
Z5−0.0750.027−0.379−2.7430.010
J2−0.0320.008−0.748−4.1600.000
S1−0.5580.148−0.490−3.7680.001
F3
(R = 0.783 a, R2 = 0.614, Adjusted R2 = 0.480; F = 4.591, Sig. = 0.001 b)
(constant)5.8390.438 13.3210.000
K2−0.2910.113−0.521−2.5750.016
K30.3310.1320.4102.4980.019
Z1−0.0120.004−1.193−3.1220.004
Z2−0.0330.010−0.773−3.3050.003
Z30.2170.0540.6684.0500.000
Z6−0.1140.053−0.293−2.1380.042
J1−0.0150.004−0.936−3.6750.001
J2−0.0150.006−0.706−2.5970.015
S1−0.1720.078−0.314−2.2140.036
F4
(R = 0.721 a, R2 = 0.520, Adjusted R2 = 0.421; F = 5.240, Sig. = 0.001 b)
(constant)5.7760.684 8.4480.000
K2−0.5510.218−0.394−2.5250.017
Z1−0.0120.005−0.454−2.2750.030
Z30.3200.1140.3932.8020.009
Z5−0.1070.034−0.444−3.1300.004
J2−0.0320.010−0.611−3.3070.003
S1−0.5830.183−0.426−3.1830.003
a, b: Predictors
Disclaimer/Publisher’s Note: The statements, opinions and data contained in all publications are solely those of the individual author(s) and contributor(s) and not of MDPI and/or the editor(s). MDPI and/or the editor(s) disclaim responsibility for any injury to people or property resulting from any ideas, methods, instructions or products referred to in the content.