Article

The Species Richness-Environment Relationship for Cherries (Prunus subgenus Cerasus) across the Northern Hemisphere

1
Co-Innovation Center for Sustainable Forestry in Southern China, College of Biology and the Environment, Nanjing Forestry University, Nanjing 210037, China
2
Biology Department, Qiongtai Normal University, Haikou 571127, China
3
College of Life Science, Neijiang Normal University, Neijiang 641112, China
*
Author to whom correspondence should be addressed.
Forests 2023, 14(2), 193; https://doi.org/10.3390/f14020193
Submission received: 5 December 2022 / Revised: 16 January 2023 / Accepted: 18 January 2023 / Published: 19 January 2023

Abstract

:
Understanding large-scale patterns of biodiversity and their drivers remains significant in biogeography. Cherries species (Prunus subgenus Cerasus, Rosaceae) are economically and ecologically important in ecosystems and human agricultural activities. However, the mechanisms underlying the patterns of the species richness–environment relationship in Cerasus remain poorly understood. We collected and filtered worldwide specimen data to map the species richness of Cerasus at the global scale. The map of Cerasus species richness was created using 21,043 reliable recorded specimens. The center of Cerasus diversity was determined using spatial cluster analysis. Stepwise regression analysis was carried out using five groups of 21 environmental variables and an integrated model was included to assess the impact of the overall environment. We calibrated each of the four integrated models and used them to predict the global Cerasus species richness and that of the other continents. Our results revealed that Cerasus species have two centers of diversity (the southwest of China and Honshu Island in Japan) with differing environmental variables influencing the distribution patterns of these two centers. In the southwest of China, hygrothermal conditions are the main driving factor while in Japan, habitat heterogeneity is the main driving factor. The relationship between the abundance of Cerasus and the various groups of factors generally supports both the productivity and the habitat heterogeneity hypotheses. However, these hypotheses do not fully explain the Cerasus species richness pattern, indicating that other factors such as historical environment, topography, and human activities likely played a role in pattern formation. The high level of habitat heterogeneity and better hygrothermal conditions may have played an important role in the establishment of its globally consistent richness–climate relationship. Our results can provide valuable information for the classification and conservation of Cerasus natural resources as well as contribute to furthering our understanding of biogeography at a global scale.

1. Introduction

Species richness is a fundamental measure of species diversity and the basis for biodiversity conservation strategies [1,2]. Geographical patterns of species richness provide essential information for the planning of conservation districts and the management of biodiversity [3], especially under global climate changes [4].
To further understand the mechanisms underlying the species richness patterns, many hypotheses have been proposed and tested [5,6,7,8,9]. The contemporary environment, mainly including climate (temperature, precipitation, and climate seasonality) and habitat heterogeneity, is typically expected to be the primary driver of species richness at a global scale [8,10]. As a result, two types of hypotheses, the energy hypothesis and the habitat heterogeneity hypothesis, have gained widespread attention. According to the energy hypothesis, energy is the main driver of species richness in an area, with higher energy areas having higher species richness [11]. The energy hypothesis can be divided into the productivity hypothesis, the cold tolerance hypothesis, the water-energy dynamics hypothesis, and so on, depending on the effect of different forms of energy on species diversity [5,7,12,13]. According to the habitat heterogeneity hypothesis, regions with more complex ecosystems and higher spatial heterogeneity provide more ecological niches, thus accommodating more species and increasing species richness [8]. However, species richness is influenced by several factors and processes [14,15,16]. Furthermore, a growing number of studies has shown that mechanisms underlying species richness are complex and cannot be explained by one hypothesis [15,17]. Therefore, the species richness distribution patterns and their formation mechanisms are still worth discussing. Recent studies are gradually exploring the distribution patterns of species richness and their formation mechanisms at the genera level [18,19,20].
Prunus species are commercially important fruit (plums, apricots, peaches, and cherries) and ornamental trees. The genus is thought to have originated in East Asia and is widely distributed both in the temperate zone of the Northern Hemisphere and in the subtropical and tropical forests of Asia, Africa, South America, and Australia. As the genus Prunus contains several subgenera, most of which have economically important tree species within each subgenus, researchers have mostly focused on a particular subgenus [21]. The subgenus Cerasus, as known as cherry, is widely distributed in the temperate regions of the Northern Hemisphere. Cherries are economically and ecologically important trees with great commercial value [22,23]. Fruits are accepted as nutrient-dense foods with relatively low caloric content. They have significant amounts of bioactive components including polyphenols, fiber, vitamin C, carotenoids, and potassium [24]. The flowering cherry is one of the most popular ornamental trees in the world. Some species could be used for vegetation restoration due to their adaptability [25]. The cherry also provides food for birds and mammals in the forest, allowing its seed to spread [26]. In recent years, research on Cerasus has focused on the exploitation of specific species, physiological and biochemical aspects, genetic variation, and phylogeny [23,27,28,29,30]. The relationship between species richness and environmental variables in Cerasus has not been adequately explored. Exploring the distribution pattern of species richness and its relationship with environmental variables will facilitate resource conservation of Cerasus as well as systematic and evolutionary research of the genus.
In this study, we combined Cerasus species distribution data and environmental variables to (i) assess the relative importance of contemporary climate and habitat heterogeneity on the species richness patterns of subgenus Cerasus; and (ii) assess the difference in higher Cerasus species richness regions caused by energy or/and spatial heterogeneity.

2. Materials and Methods

2.1. Species Distribution Data

The geographical distribution data of subgenus Cerasus were obtained from herbarium specimens recorded by the Global Biodiversity Information Facility (GBIF, https://www.gbif.org/ (accessed on 6 May 2022)) and Chinese Virtual Herbarium (CVH, https://www.cvh.ac.cn/ (accessed on 6 May 2022)). All species names were standardized according to Catalogue of Life (COL, 2019 Annual Checklist, http://www.catalogueoflife.org/annual-checklist/2019/ (accessed on 15 August 2022)). The following steps have been implemented to improve species records: (1) All records were double-checked to ensure the accuracy of the coordinates and specimen records that lacked coordinates were replaced by selecting the coordinates of a point on the map based on the recorded location; (2) all cultivars were not considered in this study; (3) for some species like Prunus avium, only wild records were kept; (4) P. yedoensis is believed to have originated in a nursery in Tokyo, and then spread throughout Japan [31]. Therefore, a point was placed in Tokyo to replace its distribution. The final list included 79 species and infraspecific units (Supplementary Table S1).
The global administrative area vector map was downloaded from the GADM database (https://gadm.org/data.html (accessed on 15 August 2022)). To minimize the effects of the area on species richness, by overlapping the distribution maps with the 300 × 300 km grid cells in ArcGIS 10.2, the global administrative area vector map was converted to gridded distributions with a 300 × 300 km spatial resolution. The area of the grid cells was not significantly correlated with species richness at the global scales (p > 0.05). The total number of species in each grid cell was used to calculate the species richness.

2.2. Environmental Data

To estimate the effects of environmental variables on large-scale patterns of Cerasus species richness, we chose 21 variables to analyze the association between species richness and environmental variables. The environmental variables were grouped into five types: environmental energy availability, water availability, climate seasonality, habitat heterogeneity, and soil properties (Table 1).
Energy availability variables included the mean annual temperature (MAT, °C), mean temperature of the warmest quarter (MTWQ, °C), mean temperature of the coldest quarter (MTCQ, °C), potential evapotranspiration (PET, mm), and minimum monthly potential evapotranspiration (PETmin, mm). Water availability variables included the mean annual precipitation (MAP, mm), actual evapotranspiration (AET, mm), water deficit (WD, mm), precipitation of warmest quarter (PWQ, mm), and precipitation of coldest quarter (PCQ, mm). Due to the results of the precipitation models being consistent with the rainfall models developed by Xu et al., MAP was used to represent rainfall [20]. Climate seasonality variables included an annual range of temperature (ART, °C), temperature seasonality (TSN), and precipitation seasonality (PSN). Habitat heterogeneity included the range of elevation (RELE, m), range of mean annual temperature (RMAT, °C), and range of mean precipitation (RMAP, mm) within each grid cell. Soil properties measured included the available water storage capacity (AWC), reference bulk density (RBD, kg/dm3), USDA (used to describe the relative proportion of different grain sizes of mineral particles in a soil), organic carbon (OC, % weight), cation exchange capacity (CEC, cmol/kg), total exchange bases (TEB, cmol/kg), pH, and electrical conductivity (ECE, dS/m).
MAT, MTWQ, MTCQ, MAP, PWQ, PCQ, elevation, and climate seasonality data with a spatial resolution of 30 arc seconds were downloaded from the WorldClim database (https://www.worldclim.org/ (accessed on 15 August 2022)). PET and AET were obtained from the Consortium of International Agricultural Research Centers (https://cgiarcsi.community/category/data/ (accessed on 15 August 2022)) at a spatial resolution of 30 arc seconds. PETmin was calculated as the monthly minimum PET of a year, and WD was calculated as the difference between PET and AET. Using the ArcGIS zonal statistic tool, RELE, RMAT, and RMAP were calculated as the range of elevation, mean annual temperature, and mean annual precipitation within each grid cell. Soil variables were obtained from the Harmonized World Soil Database v1.2 (https://www.fao.org/soils-portal/soil-survey/soil-maps-and-databases/harmonized-world-soil-database-v12/en/ (accessed on 15 August 2022)).

2.3. Statistical Analysis

Global patterns of Cerasus species richness were drawn first. The Jenks function in ArcGIS 10.2 was used to categorize the species richness into five groupings. The environmental variables in the grids corresponding to the maximum grading intervals were retrieved as suitable ranges for the growth conditions of Cerasus. Moran’s I was calculated to examine whether species richness within each grid cell was spatially autocorrelated. A clustering diagram was created to further investigate the global patterns of Cerasus species richness. According to Tobler’s First Law [32], everything is related to everything else, but near things are more related to each other. The regions of cluster can be considered as the main distribution regions of the subgenus Cerasus. High–high cluster indicates high species richness in the area, which may also be the center of its differentiation; low–low cluster indicates that the area meets the environmental conditions for the growth of certain species.
To assess the effects of each set of variables, stepwise regression analyses were conducted for the species richness and environmental variables. Meanwhile, an integrated model was added. The adjusted R2 was used to determine the degree of influence of each model. Higher adjusted R2 indicates a better model fit and more reliable results.
We calibrated each of the four integrated models and used them to predict the global species richness and that of the other continents to test for consistency in the richness–environment relationship. We then calculated the root mean squared error (RMSE) for each prediction to assess the predictive power of the models. Lower RMSEs indicate higher predictive power and consistency in the richness–environment relationship between the predicted continent and the geographical distribution data used to construct the model. All statistical analyses were performed in R v4.0.3 using package “leaps” and function “glm”.

3. Results

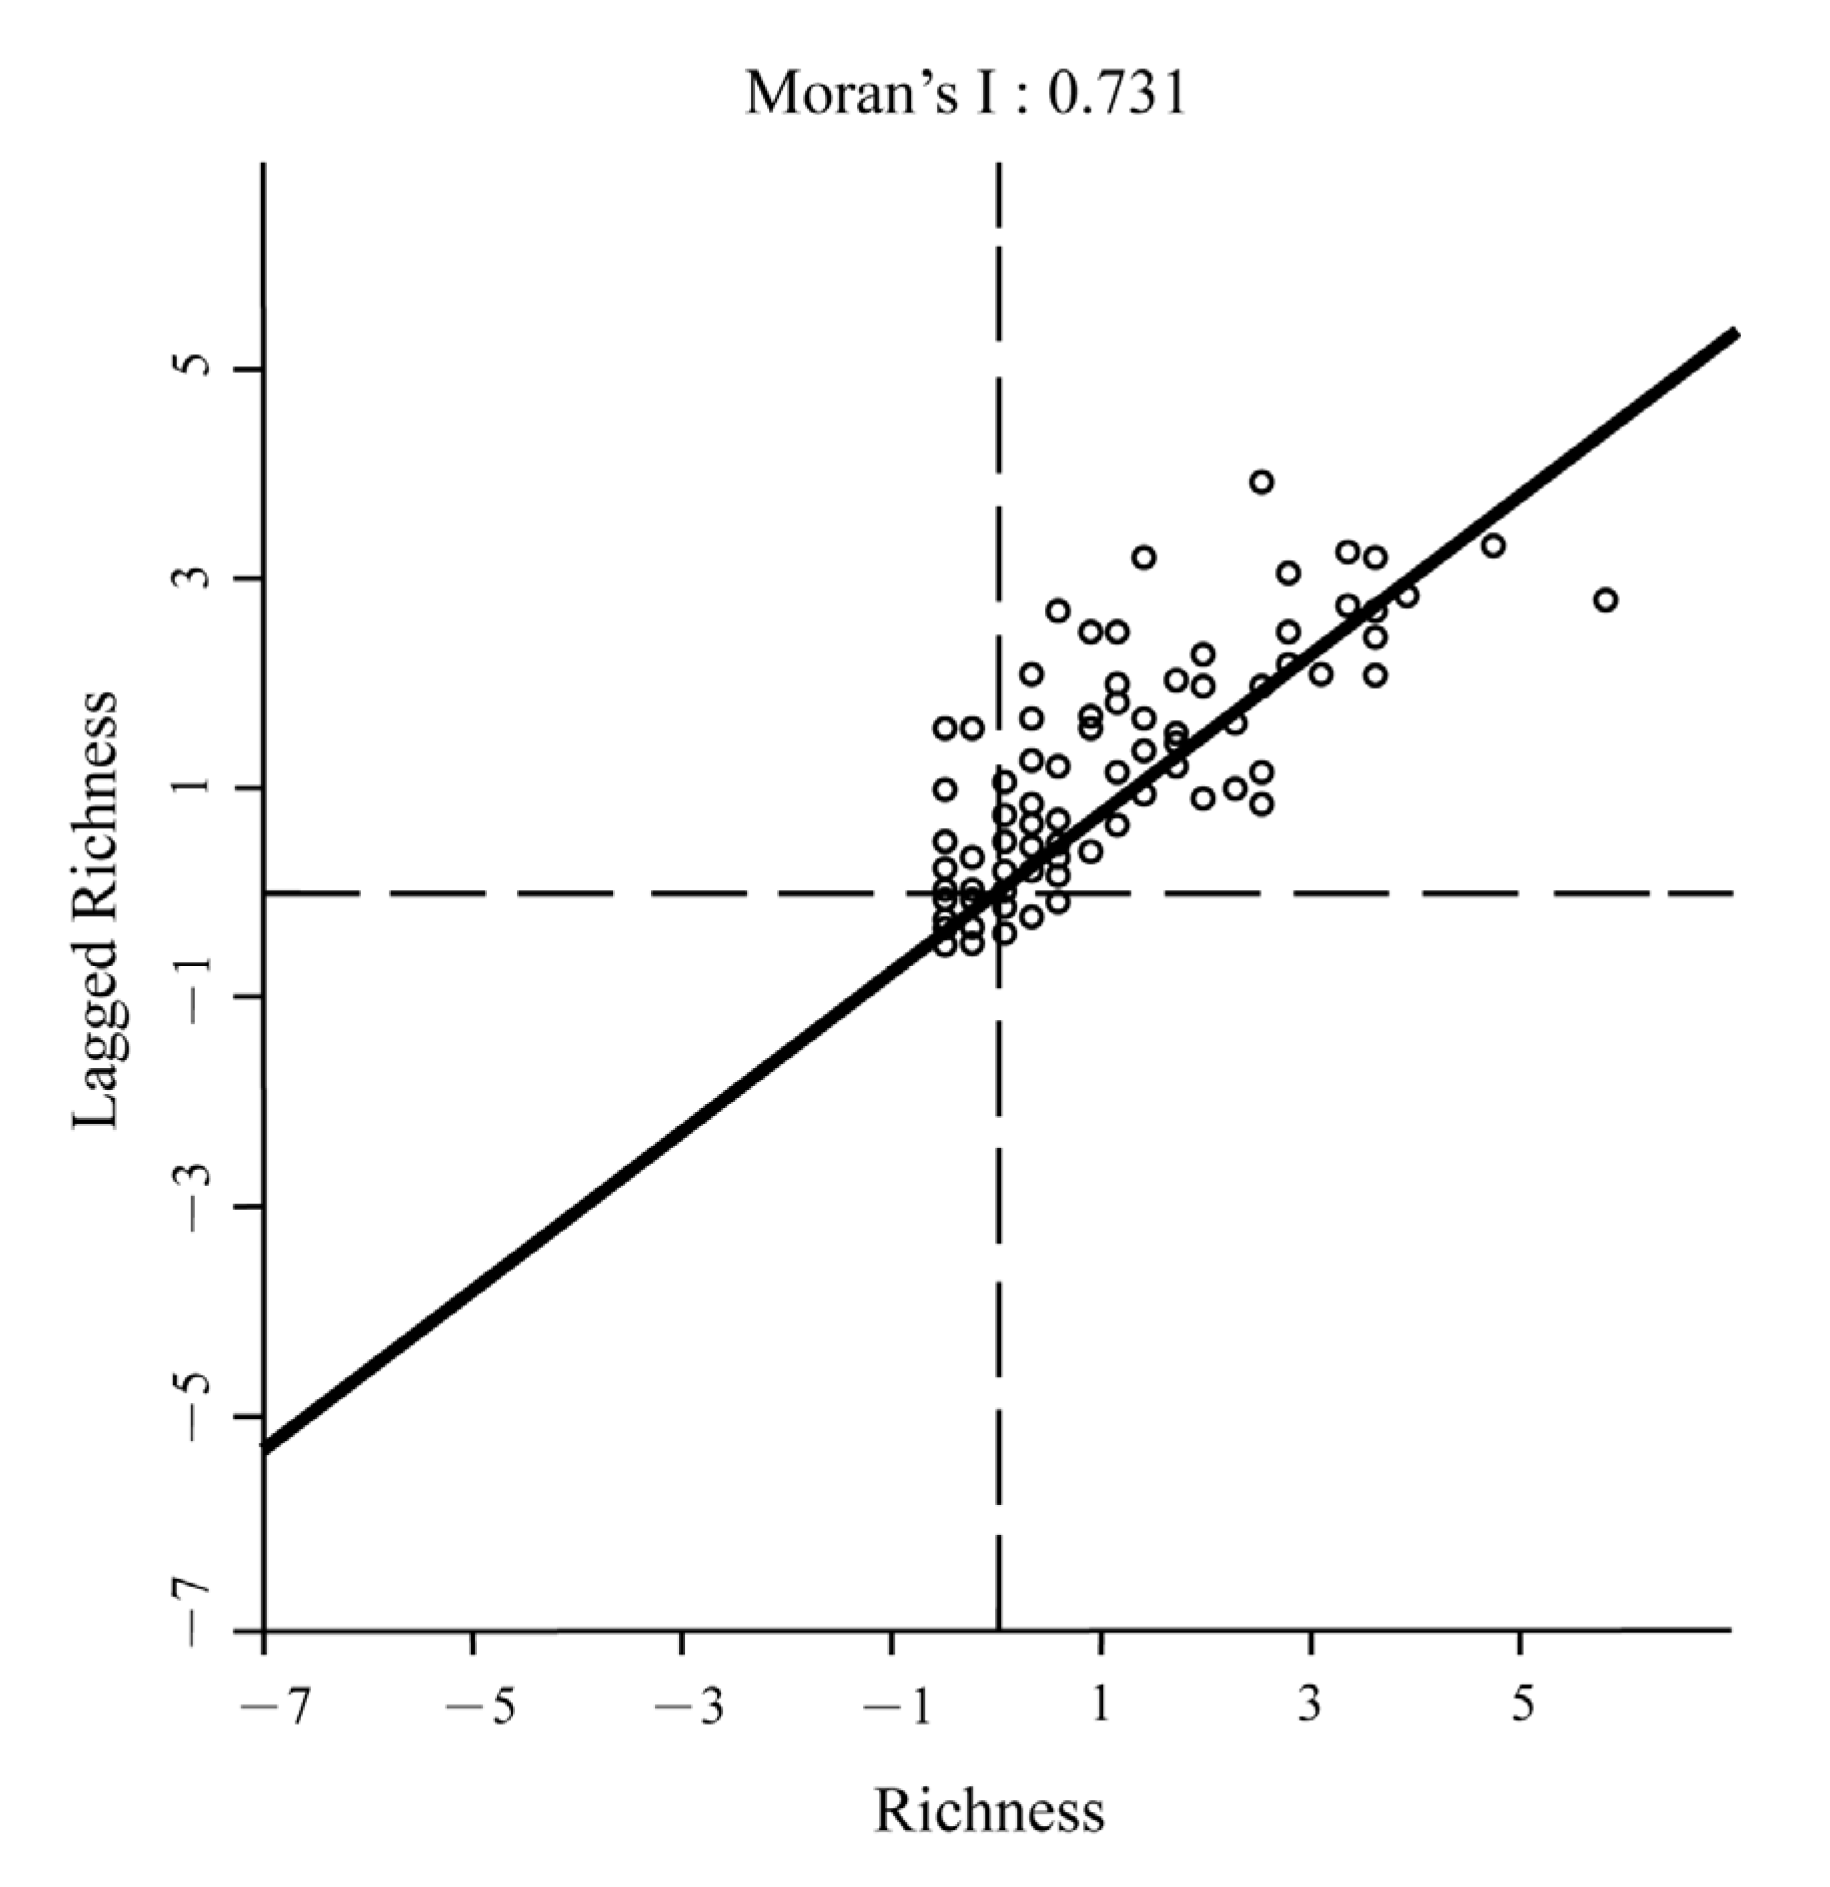
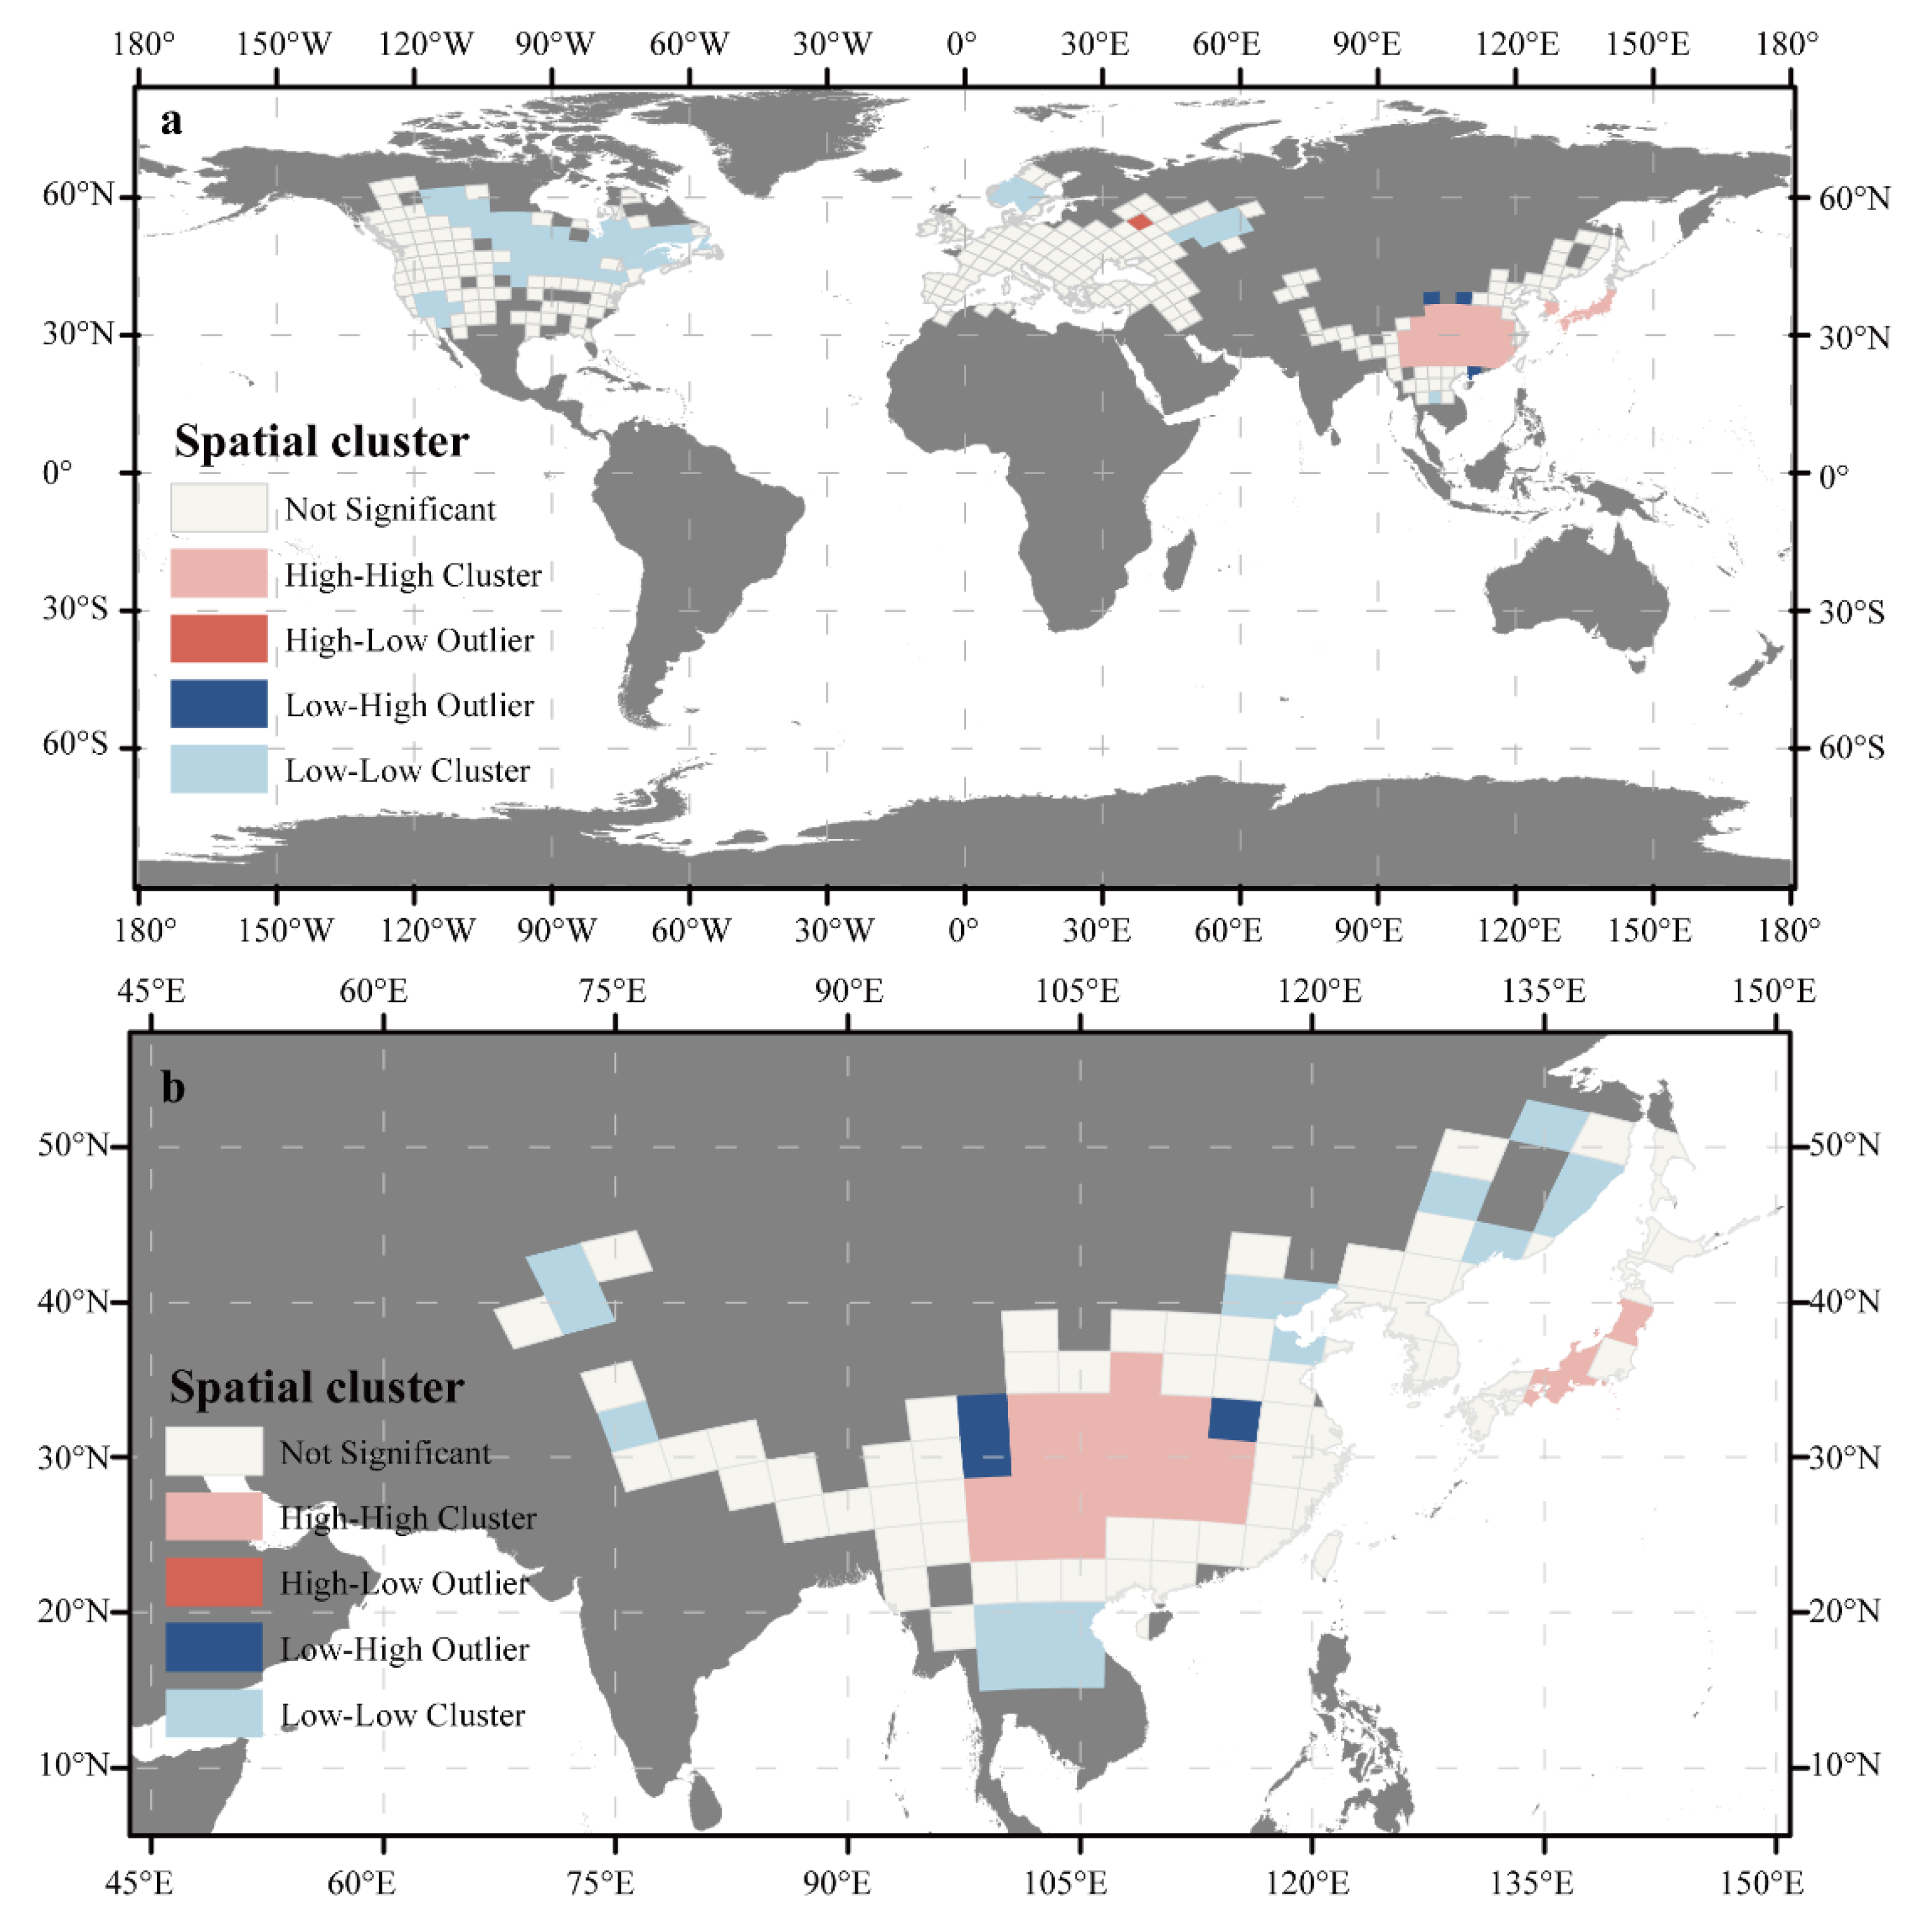
3.1. Global Patterns of Cerasus Species Richness

The Cerasus showed different distributions and species richness patterns in eastern Asia, Europe, and North America (Figure 1). They were widely distributed in Europe and North America, although species richness within each grid cell did not exceed three. Of the 79 cherry plant species, three species were found in Europe, four in North America, and 73 species in Asia. Most species were only found on one continent, with the exception of P. mahaleb, which was found in both Europe and Asia. Over 90% of the species in the subgenus Cerasus occurred in eastern Asia, but about 20 of them had fewer than 10 specimen records.
At the global scale, the Moran’s I was 0.761 (Figure 2), indicating a high degree of spatial autocorrelation in species richness. Spatial cluster analysis at the global scale was performed (Figure 3a). The results showed that the high–high clusters were concentrated in eastern Asia, while low–low clusters were found in northeastern North America, southwestern California, the southern part of the Scandinavia Peninsula, and near the middle reaches of the Volga River. A high–low outlier existed only in Moscow. This result showed that eastern Asia is the center of biodiversity for Cerasus. Therefore, further geographic clustering analysis was carried out in eastern Asia. The results (Figure 3b) suggested that the high–high clusters were concentrated in southwestern China and on Honshu Island in Japan. We speculated that these two regions were the biodiversity centers of Cerasus.
The climate variables for each grid cell were estimated by averaging within that grid, and the climatic environmental range at the highest level of species richness was considered as the optimal distribution range for Cerasus. The environmental data extracted according to the grid cell division was shown in Table 2. Although the maximum species richness was 24, the average species richness within each grid cell was 2.82, coupled with a median of 1. On one hand, it indicated that the Cerasus species richness was low in most distribution regions. On the other hand, only a few regions were highly diverse. The values of MAP and PWQ were higher than the averages, while the AET and PCQ values were lower than the averages. This indicates that regions with abundant precipitation and rain–heat synchronization are suitable for Cerasus growth. The optimal range of climate seasonality was relatively narrow, while the optimal range of ecological heterogeneity was relatively wider. These results indicate that regions with stable seasonal climate variation and a high degree of habitat heterogeneity are suitable for Cerasus growth.

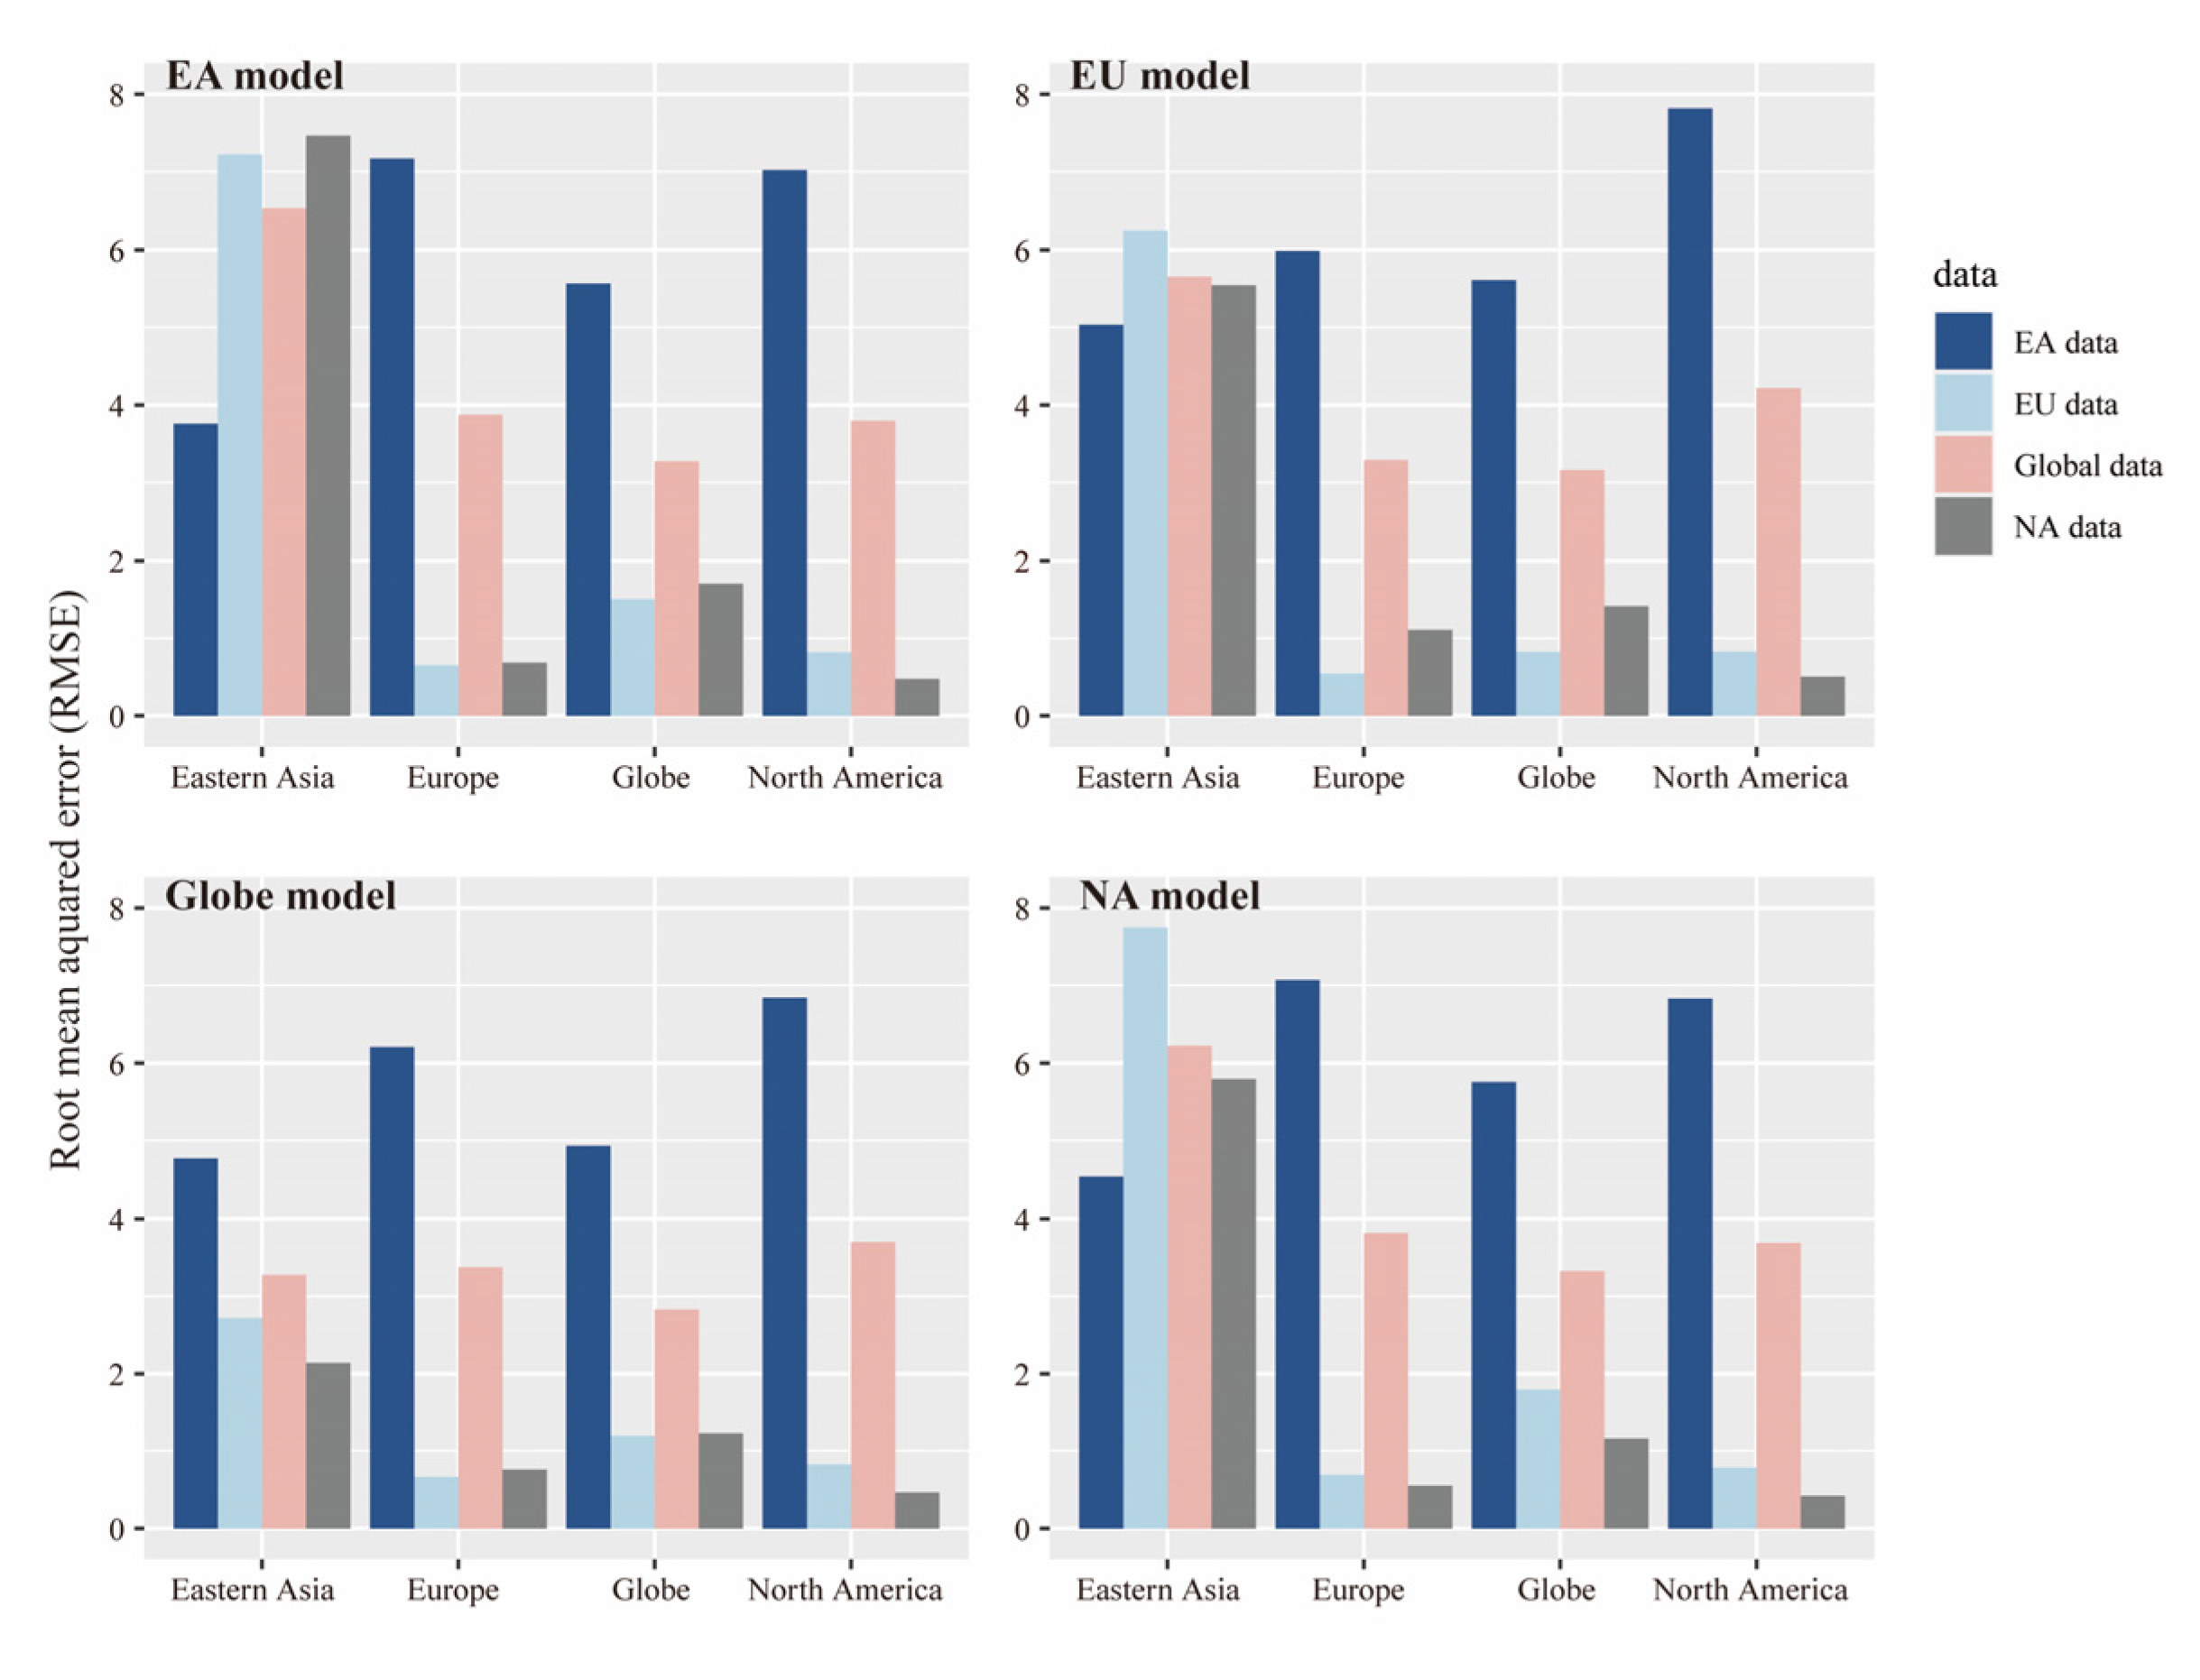
3.2. Richness–Environment Relationships

The species richness of Cerasus was used as the dependent variable and each group variable as the independent variable in a stepwise regression analysis (Table 3). The model produced similar results at all three regional and global scales. At the global scale, the adjusted R2 of the water availability model (adj. R2 = 0.1807) was the highest among every single group of variables. The adjusted R2 of the soil properties model (adj. R2 = 0.0951) was the lowest. However, water availability was not the most essential variable in the three continents. Environmental energy availability was considered as the most important driving factor in these regions. Environmental energy availability was the most explicable single group variable in both eastern Asia (adj. R2 = 0.2066) and Europe (adj. R2 = 0.172). In North America, the environmental energy availability of 33.44% of model interpretation was second only to habitat heterogeneity (adj. R2 = 0.3495). The variable with the lowest explanatory degree varied from continent to continent: water availability in eastern Asia, habitat heterogeneity in Europe, and soil properties in North America, which was consistent with the global scale. The model had low explanatory power and poor fit results when only one group of variables was used to measure the relationship between richness and environment, while the integrated model using just three groups of variables had at least 40% of the explanatory power (adj. R2 ≥ 0.4157).
We calibrated the four integrated models with continental and global data and tested them with other data. The results of all four models were similar by calculating and comparing the RMSE. RMSE was used to evaluate the difference between model prediction and the real value at first, but regardless of whether the model was based on eastern Asia or tested with eastern Asian data, the RMSE was higher than the others (Figure 4). The RMSE of the models calibrated with eastern Asia using European or North American data testing was also at least twice as high as those calibrated with other regions. This phenomenon reflects the anomalies in the eastern Asian data. In this situation, we believe that eastern Asia should be divided into two sections for further discussion: northeast of eastern Asia and southwest of eastern Asia. Similarly, stepwise regression analysis was also performed on the five groups of variables and the integrated model. The adjusted R2 of these two regions was higher than that in eastern Asia (Table 4), but the main single group of variables affecting the two regions was different. The main influencing factor of northeastern Asia was habitat heterogeneity. In addition, the model interpretation of environmental energy availability, water availability, and soil properties could exceed 50%. In the southwest of eastern Asia, the main influencing factor was environmental energy availability, followed by water availability.

4. Discussion

4.1. Supporting Hypothesis

As the distribution of the subgenus Cerasus in Europe and North America has been widely influenced by human activity, we focused on species distributed in Asia to explore the relationship between species richness patterns and environmental variables. We also conducted stepwise regression analysis for each group of variables to find the best model. Integrated models were also constructed using these five groups of variables. These results showed that the richness distribution pattern of Cerasus was influenced by a combination of environmental variables such as energy availability, water availability, and habitat heterogeneity, and that no single environmental factor or hypothesis could explain the richness pattern of the species adequately. Meanwhile, the Cerasus richness patterns supported different kinds of environmental hypotheses. AET represented the actual amount of water transported from the surface to the atmosphere, which could be representative of both solar and moisture influences [33]. Therefore, AET was considered to be the best univariate climate indicator to represent the productivity hypothesis. The species richness of the Cerasus increased with AET. This phenomenon is consistent with the predictions of the productivity hypothesis. In the southwest of eastern Asia, the adjusted R2 for the single group of variables for energy availability or water availability was higher than the other single group, suggesting that the distribution of the subgenus Cerasus also supports the water-energy dynamics hypothesis. The suitable distribution regions of the Cerasus in northeastern Asia were mostly islands or mountains that were isolated from each other. These regions may have distinct habitats from each other, thus facilitating the coexistence of species. Species differentiation processes were facilitated in mutually isolated habitats due to mechanisms such as the founder effect and genetic drift [8]. Therefore, species richness was high where habitat heterogeneity was high. The habitat heterogeneity hypothesis has been validated. In conclusion, the distribution pattern of Cerasus in China supports the productivity hypothesis, while the distribution pattern in Japan supported the habitat heterogeneity hypothesis.

4.2. Geographical Pattern of Cerasus in Eastern Asia

The adjusted R2 of integrated models for three continents and the globe were not high (adj. R2 ≤0.4909), and the RMSE of the model that was tested or calibrated with eastern Asian data was higher than that of the others. Combined with cluster analysis, we proposed that Honshu Island in Japan and southwest China were the centers of biodiversity of Cerasus. As a result, the eastern Asia dataset could be thought of as two different datasets for groups. The main factors influencing the species richness patterns of these two groups were likely to be different. These two datasets may interfere with each other, resulting in a poor model fit. Our regression analysis of the data from these two biodiversity centers concluded that the main environmental variables affecting the two areas were different, because the environments for these two biodiversity centers differed significantly, and therefore the distribution pattern of the two regions cannot be adequately explained by a single model.
To determine whether it is a complex dataset, we attempted to explain using phylogenetics. According to the evolutionary tree constructed by Li et al. [34], Cerasus could be divided into four clades. A clade containing most cherry species occurred in eastern Asia [34]. These species were also grouped according to their distribution. Our hypothesis was partly supported by the results of the article. This phenomenon is also found in other genera. Quercus originated in the temperate zone of North America and diversified southward in parallel as temperatures dropped in the higher latitudes. Now, Quercus has two centers of distribution, the eastern United States and Mexico [35]. However, the available evidence suggests that the differentiation of the Cerasus species was most likely a reticulated process rather than a simple linear process. Therefore, the evolution and dispersal routes of Cerasus species as well as the differentiation of species in eastern Asia still need to be noted in future conservation research.

4.3. Geographical Pattern of Cerasus in Europe and North America

Cherries are important economic and ornamental trees. Despite the exclusion of artificially cultivated specimens during the preliminary data processing, the distribution of the subgenus Cerasus has been influenced to some extent by human activity, especially in Europe and North America. P. avium and P. mahaleb are the principal rootstocks used for sweet and sour cherries worldwide [36]. P. mahaleb is also used in urban greenery [37]. P. pensylvanica is regarded as a wild fruit species with commercial potential and it has been cultivated in regions like Saskatchewan in Canada [38,39]. Therefore, the subgenus Cerasus in Europe and North America is not a good example for exploring the relationship between species richness and environment, as this distribution has been dispersed by the human race.
Peaches, for example, are thought to have originated in China, later being introduced to Persia and then rapidly spreading across Europe [40]. Cultivated trees spread their seeds by birds or other natural forces. The seeds germinated naturally in the wild and were therefore considered wild. This phenomenon has the potential to cause species to break through their original topographical barriers and become intermittently distributed in different regions. The adjusted R2 was lower in both Europe and North America, indicating that these models did not adequately explain the local species richness patterns as well. In summary, we believe that these human activities have influenced the distribution patterns of the Cerasus species to some extent, and played an important role in the pattern formation.

4.4. Differences in Species Richness between North America and East Asia

East Asia and North America share similar environments with comparable latitudes, landforms, and areas, except that of North America having a coastline in the west [41]. Both regions have similar flora origins and are geologically and historically part of the Laurasia. The number of species in the subgenus Cerasus differs considerably between the two continents. The subgenus Cerasus is thought to have originated in East Asia and migrated to North America though the North Atlantic Land Bridge and the Bering Land Bridge [21]. The high species richness of East Asia is often attributed to the unique climate, geomorphological features, and geological history of East Asia [42,43,44,45]. The uplift of the Qinghai–Tibet Plateau has resulted in a complex topography and high ecological heterogeneity in southwestern China [46,47]. At the same time, the unique East Asia monsoon climate and complex topography provide refuge for organisms that have survived dramatic climatic fluctuations since the mid-Cenozoic [47,48]. Therefore, China has a higher angiosperm phylogenetic diversity than America [49]. At the Last Glacial Maximum (LGM), extensive ice sheets in North America may also have had a lasting impact on the relationship between species richness and climate. During this period, Pinus and Quercus migrated south and accelerated their divergence, and after the glacial period, they expanded rapidly northward to form the current centers of diversity [35,50,51]. The genus Prunus originated in East Asia. The Bering Land Bridge is an important migration corridor for the Prunus in eastern Asian and eastern North America. Global cooling event could have resulted in vicariance between the two populations and subsequently brought about the diversification of the North American and eastern Asian lineages [21]. The environment may have driven different patterns of diversification and evolution between East Asia and North America. As a result, we believe that the high species richness of the Cerasus in East Asia is due to the fact that for Cerasus, the environment in East Asia is more conducive to diversification than in North America.

5. Conclusions

This study used data from the global distribution and environmental variables to analyze the distribution patterns of the subgenus Cerasus species richness and the variables that influenced them. (1) Our results indicate that Honshu Island in Japan and southwest China are the biodiversity hotspots of the extant Cerasus. (2) The drivers were different for the two different Cerasus species biodiversity centers: hygrothermal conditions are the main driving factor in the southwest of China, while habitat heterogeneity is the main driving factor in Honshu Island of Japan. (3) The high level of habitat heterogeneity and better hygrothermal conditions may have played an important role in the establishment of the cherries’ globally consistent richness–climate relationship.

Supplementary Materials

The following supporting information can be downloaded at: https://www.mdpi.com/article/10.3390/f14020193/s1, Table S1: List of Cerasus species and distribution.

Author Contributions

Conceptualization, C.-L.F., M.I. and M.L.; Data curation, C.-L.F., C.-P.X., M.I. and X.-G.Y.; Formal analysis, C.-L.F., C.-P.X., X.-G.Y., X.-R.W. and M.L.; Funding acquisition, X.-R.W.; Methodology, C.-L.F., C.-P.X., M.I., X.-R.W. and M.L.; Project administration, M.L.; Software, C.-L.F. and M.L.; Writing—original draft, C.-L.F. and M.L.; Writing—review & editing, C.-L.F. and M.L. All authors have read and agreed to the published version of the manuscript.

Funding

This research was funded by grants from the Key Modern Agriculture Project of Science and Technology Department of Jiangsu Province, China (Grant No. BE2020343).

Data Availability Statement

Not applicable.

Conflicts of Interest

The authors declare no conflict of interest.

References

  1. D’Antraccoli, M.; Roma-Marzio, F.; Carta, A.; Landi, S.; Bedini, G.; Chiarucci, A.; Peruzzi, L. Drivers of floristic richness in the Mediterranean: A case study from Tuscany. Biodivers. Conserv. 2019, 28, 1411–1429. [Google Scholar] [CrossRef]
  2. Gotelli, N.J.; Colwell, R.K. Quantifying biodiversity: Procedures and pitfalls in the measurement and comparison of species richness. Ecol. Lett. 2001, 4, 379–391. [Google Scholar] [CrossRef] [Green Version]
  3. Grytnes, J.A.; Vetaas, O.R. Species richness and altitude: A comparison between null models and interpolated plant species richness along the Himalayan altitudinal gradient, Nepal. Am. Nat. 2002, 159, 294–304. [Google Scholar] [CrossRef]
  4. Krogsgaard Svendsen, I. The Effects that the Current Climate Crisis have on the Biogeography and Environment, Needed Adaptations and Conservation. Am. J. BioScience 2020, 8, 20–27. [Google Scholar] [CrossRef]
  5. Currie, D.J.; Mittelbach, G.G.; Cornell, H.V.; Field, R.; Guegan, J.F.; Hawkins, B.A.; Kaufman, D.M.; Kerr, J.T.; Oberdorff, T.; O’Brien, E.; et al. Predictions and tests of climate-based hypotheses of broad-scale variation in taxonomic richness. Ecol. Lett. 2004, 7, 1121–1134. [Google Scholar] [CrossRef]
  6. Field, R.; O’Brien, E.M.; Whittaker, R.J. Global models for.predicting woody plant richness from climate: Development and evaluation. Ecology 2005, 86, 2263–2277. [Google Scholar] [CrossRef] [Green Version]
  7. O’Brien, E.M.; Field, R.; Whittaker, R.J. Climatic gradients in woody plant (tree and shrub) diversity: Water-energy dynamics, residual variation, and topography. Oikos 2000, 89, 588–600. [Google Scholar] [CrossRef]
  8. Tews, J.; Brose, U.; Grimm, V.; Tielborger, K.; Wichmann, M.C.; Schwager, M.; Jeltsch, F. Animal species diversity driven by habitat heterogeneity/diversity: The importance of keystone structures. J. Biogeogr. 2004, 31, 79–92. [Google Scholar] [CrossRef] [Green Version]
  9. Wang, Z.H.; Fang, J.Y.; Tang, Z.Y.; Lin, X. Patterns, determinants and models of woody plant diversity in China. Proc. R. Soc. B-Biol. Sci. 2011, 278, 2122–2132. [Google Scholar] [CrossRef]
  10. Hawkins, B.A.; Rodriguez, M.A.; Weller, S.G. Global angiosperm family richness revisited: Linking ecology and evolution to climate. J. Biogeogr. 2011, 38, 1253–1266. [Google Scholar] [CrossRef]
  11. Hawkins, B.A.; Field, R.; Cornell, H.V.; Currie, D.J.; Guegan, J.F.; Kaufman, D.M.; Kerr, J.T.; Mittelbach, G.G.; Oberdorff, T.; O’Brien, E.M.; et al. Energy, water, and broad-scale geographic patterns of species richness. Ecology 2003, 84, 3105–3117. [Google Scholar] [CrossRef] [Green Version]
  12. Wang, Z.H.; Tang, Z.Y.; Fang, J.Y. The species-energy hypothesis as a mechanism for species richness pattern. Biodivers. Sci. 2009, 17, 613–624. [Google Scholar] [CrossRef]
  13. Wright, D.H. Species-Energy Theory: An Extension of Species-Area Theory. Oikos 1983, 41, 496–506. [Google Scholar] [CrossRef] [Green Version]
  14. Jetz, W.; Rahbek, C. Geographic range size and determinants of avian species richness. Science 2002, 297, 1548–1551. [Google Scholar] [CrossRef] [Green Version]
  15. Kreft, H.; Jetz, W. Global patterns and determinants of vascular plant diversity. Proc. Natl. Acad. Sci. USA 2007, 104, 5925–5930. [Google Scholar] [CrossRef] [PubMed] [Green Version]
  16. Whittaker, R.J.; Willis, K.J.; Field, R. Scale and species richness: Towards a general, hierarchical theory of species diversity. J. Biogeogr. 2001, 28, 453–470. [Google Scholar] [CrossRef] [Green Version]
  17. Suissa, J.S.; Sundue, M.A.; Testo, W.L. Mountains, climate and niche heterogeneity explain global patterns of fern diversity. J. Biogeogr. 2021, 48, 1296–1308. [Google Scholar] [CrossRef]
  18. Fang, W.J.; Cai, Q.; Zhao, Q.; Ji, C.J.; Zhu, J.L.; Tang, Z.Y.; Fang, J.Y. Species richness patterns and the determinants of larch forests in China. Plant Divers. 2022, 44, 436–444. [Google Scholar] [CrossRef]
  19. Rao, M.D.; Manuel, J.S.; Xiang, X.; Zhang, M.; Mi, X.; Zhang, J.; Ma, K.; Jens-Christian, S. Environmental and evolutionary drivers of diversity patterns in the tea family (Theaceae s.s.) across China. Ecol. Evol. 2018, 8, 11663–11676. [Google Scholar] [CrossRef]
  20. Xu, X.T.; Dimitrov, D.; Shrestha, N.; Rahbek, C.; Wang, Z.H. A consistent species richness-climate relationship for oaks across the Northern Hemisphere. Glob. Ecol. Biogeogr. 2019, 28, 1051–1066. [Google Scholar] [CrossRef]
  21. Chin, S.W.; Shaw, J.; Haberle, R.; Wen, J.; Potter, D. Diversification of almonds, peaches, plums and cherries–Molecular systematics and biogeographic history of Prunus (Rosaceae). Mol. Phylogenetics Evol. 2014, 76, 34–48. [Google Scholar] [CrossRef]
  22. McCune, L.M.; Kubota, C.; Stendell-Hollis, N.R.; Thomson, C.A. Cherries and Health: A Review. Crit. Rev. Food Sci. Nutr. 2010, 51, 1–12. [Google Scholar] [CrossRef] [PubMed]
  23. Wang, Y.; Hu, G.P.; Liu, Z.S.; Zhang, J.; Ma, L.; Tian, T.; Wang, H.; Chen, T.; Chen, Q.; He, W.; et al. Phenotyping in flower and main fruit traits of Chinese cherry Cerasus pseudocerasus (Lindl.) G.Don. Sci. Hortic. 2022, 296, 110920. [Google Scholar] [CrossRef]
  24. Karaat, F.E.; Gunduz, K.; Saracoglu, O.; Yildirim, H. Pomological and phytochemical evaluation of different cherry species: Mahaleb (Prunus mahaleb L.), wild sweet cherry (Prunus avium L.) and wild sour cherry (Prunus cerasus L.), sweet and sour cherry cultivars. Acta Sci. Pol.-Hortorum Cultus 2019, 18, 181–191. [Google Scholar] [CrossRef]
  25. Wang, Y.C.; Bao, W.K.; Wu, N. Shrub island effects on a high-altitude forest cutover in the eastern Tibetan Plateau. Ann. For. Sci. 2011, 68, 1127–1141. [Google Scholar] [CrossRef] [Green Version]
  26. Hernandez, A. Cherry removal by seed-dispersing mammals: Mutualism through commensal association with frugivorous birds. Pol. J. Ecol. 2008, 56, 127–138. [Google Scholar]
  27. Ding, L.; Xu, L.J.; Chu, X.; Yang, L.; Zhu, H.L.; Huang, J.X. Dissimilarity analysis of microbial communities in the rhizosphere and tissues of diseased and healthy cherry trees (Cerasus pseudocerasus). Can. J. Plant Pathol. 2021, 43, 612–621. [Google Scholar] [CrossRef]
  28. Eken, B.U.; Kirdok, E.; Velioglu, E.; Ciftci, Y.O. Assessment of genetic variation of natural populations of wild cherry (Prunus avium L.) via SSR markers. Turk. J. Bot. 2022, 46, 14–25. [Google Scholar] [CrossRef]
  29. Hou, Q.D.; Li, S.; Shang, C.Q.; Wen, Z.; Cai, X.W.; Hong, Y.; Qiao, G. Genome-wide characterization of chalcone synthase genes in sweet cherry and functional characterization of CpCHS1 under drought stress. Front. Plant Sci. 2022, 13, 3054. [Google Scholar] [CrossRef]
  30. Shirasawa, K.; Esumi, T.; Itai, A.; Isobe, S. Cherry Blossom Forecast Based on Transcriptome of Floral Organs Approaching Blooming in the Flowering Cherry (Cerasus x yedoensis) Cultivar ‘Somei-Yoshino’. Front. Plant Sci. 2022, 13, 802203. [Google Scholar] [CrossRef]
  31. Shirasawa, K.; Esumi, T.; Hirakawa, H.; Tanaka, H.; Itai, A.; Ghelfi, A.; Nagasaki, H.; Isobe, S. Phased genome sequence of an interspecific hybrid flowering cherry, ‘Somei-Yoshino’ (Cerasus x yedoensis). DNA Res. 2019, 26, 379–389. [Google Scholar] [CrossRef] [PubMed]
  32. Tobler, W. A Computer Movie Simulating Urban Growth in the Detroit Region. Econ. Geogr. 1970, 46, 234–240. [Google Scholar] [CrossRef]
  33. Clarke, A.; Gaston, K.J. Climate, energy and diversity. Proc. R. Soc. B-Biol. Sci. 2006, 273, 2257–2266. [Google Scholar] [CrossRef] [Green Version]
  34. Li, M.; Song, Y.F.; Sylvester, S.P.; Wang, X.R. Comparative analysis of the complete plastid genomes in Prunus subgenus Cerasus (Rosaceae): Molecular structures and phylogenetic relationships. PLoS ONE 2022, 17, e0266535. [Google Scholar] [CrossRef]
  35. Hipp, A.L.; Manos, P.S.; González-Rodríguez, A.; Hahn, M.; Kaproth, M.; McVay, J.D.; Avalos, S.V.; Cavender-Bares, J. Sympatric parallel diversification of major oak clades in the Americas and the origins of Mexican species diversity. New Phytol. 2018, 217, 439–452. [Google Scholar] [CrossRef] [PubMed] [Green Version]
  36. Moghadam, E.G.; Khalighi, A. Relationship between vigor of Iranian Prunus mahaleb L. selected dwarf rootstocks and some morphological characters. Sci. Hortic. 2007, 111, 209–212. [Google Scholar] [CrossRef]
  37. Bujdosó, G.; Hrotkó, K. Cherries: Botany, Production and Uses; Quero-Garcia, J., Iezzoni, A., Pulawska, J., Lang, G., Eds.; Cherry production; CABI International: Wallingford, UK, 2017; pp. 1–13. [Google Scholar]
  38. Shiell, K.J.; St-Pierre, R.G.; Zatylny, A.M. Timing, magnitude and causes of flower and immature fruit loss in pin cherry and choke cherry. Can. J. Plant Sci. 2002, 82, 157–164. [Google Scholar] [CrossRef] [Green Version]
  39. St-Pierre, R.G.; Zatylny, A.M.; Tulloch, H.P. Evaluation of growth, yield, and fruit size of chokecherry, pincherry, highbush cranberry, and black currant cultivars in Saskatchewan. Can. J. Plant Sci. 2005, 85, 659–664. [Google Scholar] [CrossRef]
  40. Lurie, S.; Crisosto, C.H. Chilling injury in peach and nectarine. Postharvest Biol. Technol. 2005, 37, 195–208. [Google Scholar] [CrossRef]
  41. Qian, H. A comparison of the taxonomic richness of temperate plants in East Asia and North America. Am. J. Bot. 2002, 89, 1818–1825. [Google Scholar] [CrossRef]
  42. Qian, H. A comparison of generic endemism of vascular plants between East Asia and North America. Int. J. Plant Sci. 2001, 162, 191–199. [Google Scholar] [CrossRef]
  43. Qian, H.; Jin, Y.; Ricklefs, R.E. Phylogenetic diversity anomaly in angiosperms between eastern Asia and eastern North America. Proc. Natl. Acad. Sci. USA 2017, 114, 11452–11457. [Google Scholar] [CrossRef] [PubMed] [Green Version]
  44. Yin, X.; Qian, H.; Sui, X.H.; Zhang, M.H.; Mao, L.F.; Svenning, J.C.; Ricklefs, R.E.; He, F.L.; Hurlbert, A. Effects of climate and topography on the diversity anomaly of plants disjunctly distributed in eastern Asia and eastern North America. Glob. Ecol. Biogeogr. 2021, 30, 2029–2042. [Google Scholar] [CrossRef]
  45. Zuo, Y.J.; Wen, J.; Zhou, S.L. Intercontinental and intracontinental biogeography of the eastern Asian-Eastern North American disjunct Panax (the ginseng genus, Araliaceae), emphasizing its diversification processes in eastern Asia. Mol. Phylogenetics Evol. 2017, 117, 60–74. [Google Scholar] [CrossRef]
  46. Molnar, P.; Boos, W.R.; Battisti, D.S. Orographic Controls on Climate and Paleoclimate of Asia: Thermal and Mechanical Roles for the Tibetan Plateau. Annu. Rev. Earth Planet. Sci. 2010, 38, 77–102. [Google Scholar] [CrossRef] [Green Version]
  47. Xing, Y.W.; Ree, R.H. Uplift-driven diversification in the Hengduan Mountains, a temperate biodiversity hotspot. Proc. Natl. Acad. Sci. USA 2017, 114, E3444–E3451. [Google Scholar] [CrossRef] [PubMed] [Green Version]
  48. Wen, J.; Zhang, J.Q.; Nie, Z.L.; Zhong, Y.; Sun, H. Evolutionary diversificatons of plants on the Qinghai-Tibetan Plateau. Front. Genet. 2014, 5, 4. [Google Scholar] [CrossRef] [Green Version]
  49. Hu, H.H.; Ye, J.F.; Liu, B.; Mao, L.F.; Smith, S.A.; Barrett, R.L.; Soltis, P.S.; Soltis, D.E.; Chen, Z.D.; Lu, L.M. Temporal and spatial comparisons of angiosperm diversity between eastern Asia and North America. Natl. Sci. Rev. 2022, 9, nwab199. [Google Scholar] [CrossRef] [PubMed]
  50. Norris, J.R.; Betancourt, J.L.; Jackson, S.T. Late Holocene expansion of ponderosa pine (Pinus ponderosa) in the Central Rocky Mountains, USA. J. Biogeogr. 2016, 43, 778–790. [Google Scholar] [CrossRef] [Green Version]
  51. Zinck, J.W.; Rajora, O.P. Post-glacial phylogeography and evolution of a wide-ranging highly-exploited keystone forest tree, eastern white pine (Pinus strobus) in North America: Single refugium, multiple routes. BMC Evol. Biol. 2016, 16, 56. [Google Scholar] [CrossRef]
Figure 1. The map of species richness of subgenus Cerasus included 381 grid cells covering an area of 2.88 × 10⁷ km2. Numbers in brackets indicate how many grid cell there are under that richness class.
Forests 14 00193 g001
Figure 2. The Moran’s I of subgenus Cerasus. The closer the Moran’s I is to 1, the more pronounced the aggregation effect is in the spatial distribution.
Forests 14 00193 g002
Figure 3. (a) Clustering the geographical distribution of species richness at the global scale. (b) Clustering the geographical distribution of the species richness of eastern Asia. High–high cluster means a high value for itself and a correspondingly high value for the adjacent areas; high–low outlier means a high value for itself and a low value for the adjacent areas; low–high outlier means a low value for itself and a high value for the adjacent areas; low–low cluster means a low value for itself and a correspondingly low value for the adjacent areas.
Forests 14 00193 g003
Figure 4. Root mean squared errors of the four integrated models were assessed when they were used to predict the subgenus Cerasus species richness at the global scale and in eastern Asia (EA), North America (NA), and Europe (EU) (color bars). Each of the four models was calibrated separately using eastern Asian data, European data, North American data, and Global data (x-axis).
Forests 14 00193 g004
Table 1. Environment variables and their abbreviations used in the analyses.
GroupsAbbreviationsEnvironmental Variables
Environmental energy availabilityMATMean annual temperature (°C)
MTWQMean temperature of the coldest quarter (°C)
MTCQMean temperature of the warmest quarter (°C)
PETPotential evapotranspiration (mm)
PETminMinimum monthly potential evapotranspiration (mm)
Water availabilityMAPMean annual precipitation (mm)
AETActual evapotranspiration (mm)
WDWater deficit (mm)
PWQPrecipitation of warmest quarter (mm)
PCQPrecipitation of coldest quarter (mm)
Climate seasonalityARTAnnual range of temperature (°C)
TSNTemperature seasonality (standard deviation of monthly mean temperatures × 100)
PSNPrecipitation seasonality (standard deviation of monthly precipitation)
Habitat heterogeneityRELERange of elevation (m) within each grid cell
RMATRange of mean annual temperature (°C) within each grid cell
RMAPRange of mean annual precipitation (mm) within each grid cell
Soil propertiesAWCAvailable water storage capacity
RBDReference bulk density (kg/dm3)
USDAThe relative proportion of different grain sizes of mineral particles in soil
OCOrganic carbon (% weight)
CECCation exchange capacity (cmol/kg)
TEBTotal exchange bases (cmol/kg)
pHHydrogen ion concentration
ECEElectrical conductivity (dS/m)
Table 2. Descriptive statistics of species richness and environmental factors in the subgenus Cerasus.
MinMaxMeanMedianSDOptimal Range
Lower LimitUpper Limit
Richness1242.8213.61
MAT/°C−7.0626.308.588.356.826.1315.14
MTWQ/°C6.8133.1619.1418.874.9113.4724.41
MTCQ/°C−33.8215.78−8.56−7.4410.55−9.851.17
PET/mm0.892722.321148.621106.17400.82950.811211.56
PETmin/mm0.018.3534.3026.8927.2138.7374.71
MAP/mm167.472540.83848.70698.83456.25869.591307.80
AET/mm250.553649.93934.94792.18524.55634.04811.49
PWQ/mm0.491435.15285.58240.03210.53483.20571.81
PCQ/mm5.85987.23149.85116.88124.4523.0972.85
ART/°C15.9557.6934.6334.298.6724.1328.64
TSN202.561658.14881.07851.74287.92511.73771.02
PSN11.83127.6350.2246.0226.4862.7991.69
RELE/m86.008614.001982.301737.001562.752630.006691.00
RMAT/°C1.7544.9811.229.887.9212.9932.08
RMAP/mm99.008490.00881.63566.00954.36434.003093.00
Table 3. Stepwise regression models for each group of variables and the integrated model for the globe and three continents.
GlobeEastern AsiaEuropeNorth America
GroupVariablesCoefficientsadj. R2/%VariablesCoefficientsadj. R2/%VariablesCoefficientsadj. R2/%VariablesCoefficientsadj. R2/%
Energy AvailabilityPET−0.5501 ***15.06MTCQ0.5791 ***20.66MAT0.9606 ***17.2MAT−1.561 ***33.44
PETmin0.6606 ***PET−0.647 ***PETmin−0.9306 ***MTCQ1.739 ***
Water AvailabilityPWQ0.4176 ***18.07PCQ0.2055 *3.33MAP0.4799 **8.303PWQ−0.3228 ***19.31
PCQ−0.06357 PCQ−0.5705 ***PCQ0.3884 ***
Climate SeasonalityART−0.2589 ***12.6PSN−0.3501 ***11.44TSN−0.1827 *11.53TSN−0.4314 ***18.04
PSN0.2524 *** PSN−0.3031 ***
Habitat heterogeneityRELE0.3942 ***11.82RELE0.3432 **13.82RMAT0.020422.422RELE0.3614 ***34.95
RMAP−0.106RMAP−0.2756 ** RMAP0.3051 ***
Soil PropertiesAWC−0.2775 ***9.51AWC−0.4068 ***17.2ECE−0.2647 **10.56CEC1.43 **8.575
RBD−0.3013 ***ECE−0.3796 ***pH0.2899 **OC−1.226 ***
TEB−0.5197 *
Integrated ModelMAT0.4973 ***41.92PSN−0.4908 ***49.09MAT0.9697 ***41.57TSN−0.3282 ***46.74
PET−0.4985 ***RELE0.5464 ***PETmin−0.3074RELE0.5731 ***
PWQ0.3547 ***RMAP−0.2916 ***PCQ−0.4467 ***PETmin2−0.3609 ***
RELE0.6054 ***AWC−0.435 ***PWQ0.6929 ***ECE−0.2127 ***
RMAP−0.4847 ***
Note: *** p-value < 0.001; ** p-value < 0.01; * p-value < 0.05.
Table 4. Stepwise regression models for each group of variables and integrated model for two regions in eastern Asia.
Northeast of Eastern AsiaSouthwest of Eastern Asia
GroupVariablesCoefficientsadj. R2/%VariablesCoefficientsadj. R2/%
Energy AvailabilityMTCQ0.7711 ***58.11MAT0.4706 ***45.75
PET−0.933 ***
Water AvailabilityAET0.5359 ***61.23AET−1.393 ***41.94
PCQ0.3455 *WD−1.211 ***
Climate SeasonalityTSN−0.7013 ***47.48PSN−0.4478 ***18.98
Habitat heterogeneityRELE0.2682 *66.93RELE1.727 ***19.06
RMAP0.6717 ***RMAT−1.621 ***
Soil PropertiesAWC−0.5726 ***50.26CEC0.7867 ***20.99
TEB−0.8255 ***USDA−0.7061 ***
Integrated ModelRELE0.4514 ***84.33AET−0.5839 ***62.81
MAT0.6081 ***PSN−0.6329 ***
PCQ0.2175 *RELE0.5193 ***
RMAP−0.2326 **
Note: *** p-value < 0.001; ** p-value < 0.01; * p-value < 0.05.
Disclaimer/Publisher’s Note: The statements, opinions and data contained in all publications are solely those of the individual author(s) and contributor(s) and not of MDPI and/or the editor(s). MDPI and/or the editor(s) disclaim responsibility for any injury to people or property resulting from any ideas, methods, instructions or products referred to in the content.

