
Quantification of Root Systems and Soil Macropore Networks Association to Soil Saturated Hydraulic Conductivity in Forested Wetland Soils


Abstract
1. Introduction
2. Materials and Methods
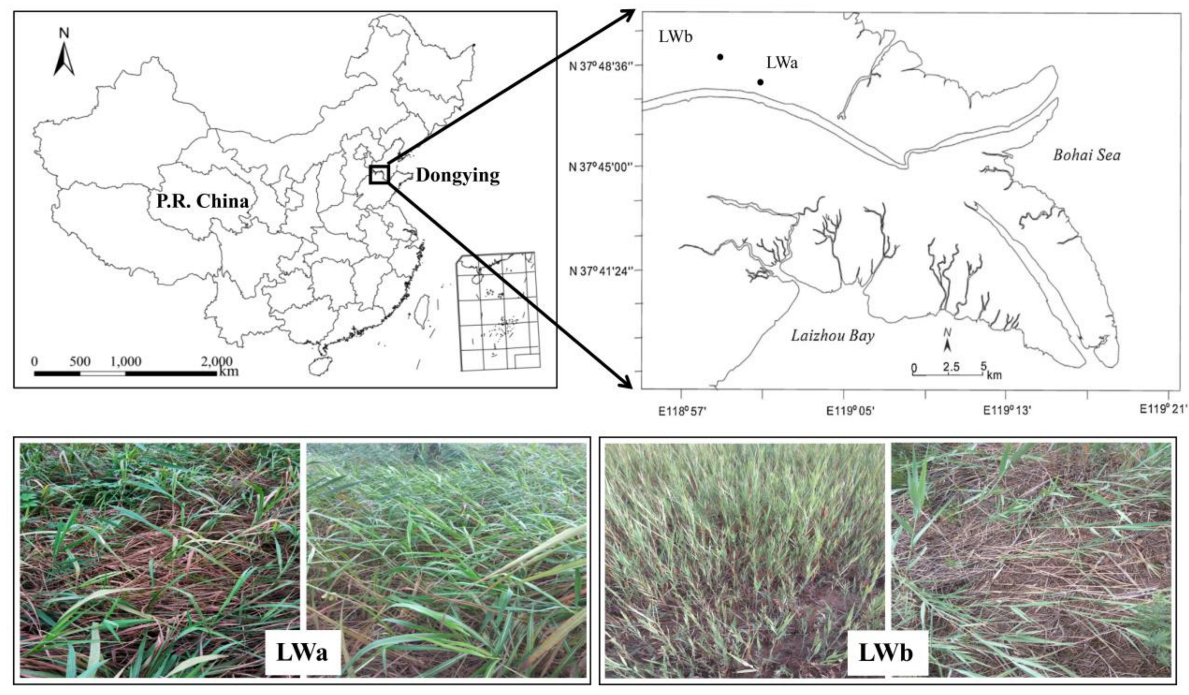
2.1. Study Area
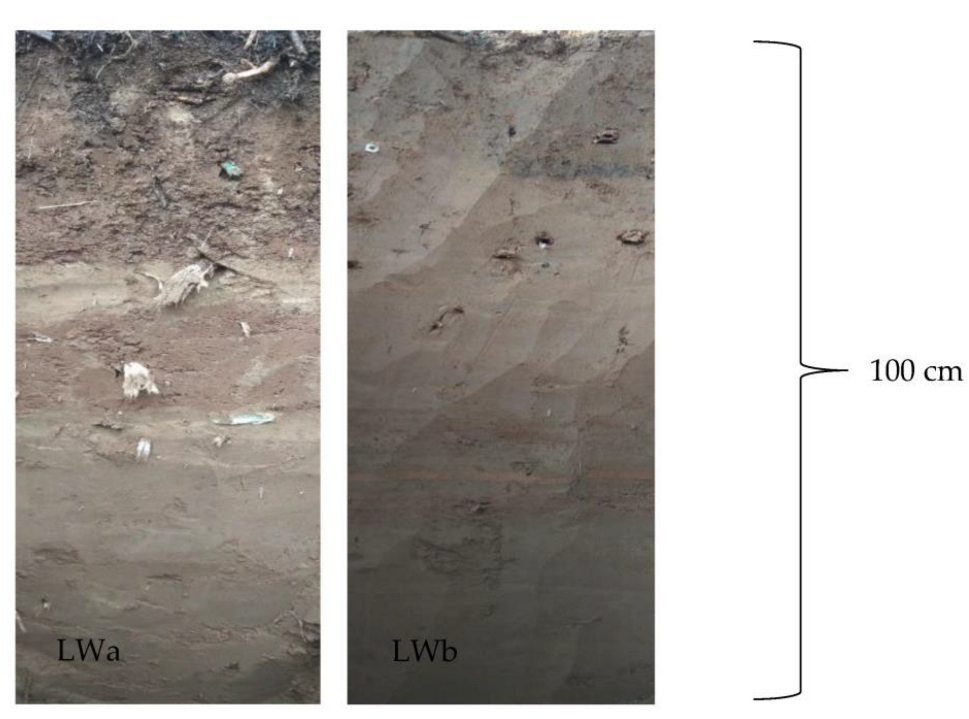
2.2. Soil Sampling
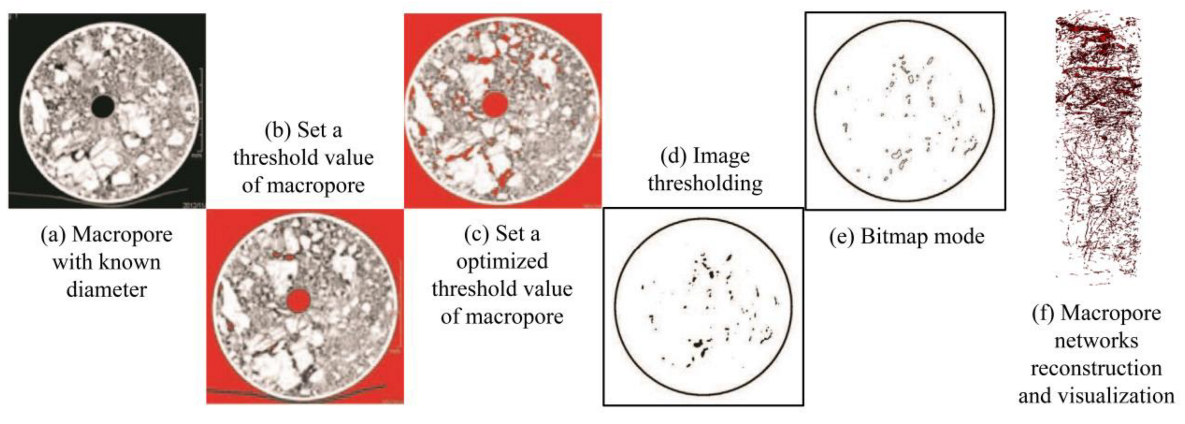
2.3. CT Scanning and Macropore Data Acquisition
2.4. Root Systems Data Acquisition
2.5. Determination of Soil Saturated Hydraulic Conductivity (Ks)
2.6. Statistical Analysis
3. Results
3.1. Characterization between Root Systems and Soil Macropores
3.2. Quantification between Root Systems, Soil Macropores, and Soil Saturated Hydraulic Conductivity
4. Discussion
4.1. Effects of Forested Wetland Conditions on Root Systems Distribution
4.2. Effects of Forested Wetland Conditions on Soil Macropores
4.3. Effects of Forested Wetland Conditions on Soil Saturated Hydraulic Conductivity
5. Conclusions
Author Contributions
Funding
Acknowledgments
Conflicts of Interest
References
- Kochiieru, M.; Lamorski, K.; Feiza, V.; Feiziene, D.; Volungevicius, J. Quantification of the relationship between root parameters and soil macropore parameters under different land use systems in Retisol. Int. Agrophysics 2020, 34, 301–308. [Google Scholar] [CrossRef]
- Chirol, C.; Spencer, K.L.; Carr, S.J.; Möller, I.; Evans, B.; Lynch, J.; Brooks, H.; Royse, K.R. Effect of vegetation cover and sediment type on 3D subsurface structure and shear strength in saltmarshes. Earth Surf. Process. Landf. 2021, 46, 2279–2297. [Google Scholar] [CrossRef]
- Evans, B.; Brooks, H.; Chirol, C.; Kirkham, M.; Möller, I.; Royse, K.; Spencer, K.; Spencer, T. Vegetation interactions with geotechnical properties and erodibility of salt marsh sediments. Estuar. Coast. Shelf Sci. 2022, 265, 107713. [Google Scholar] [CrossRef]
- Zhang, Y.H.; Chen, J.H.; Zhang, J.C.; Zhang, Z.; Zhang, M. Novel indicator for assessing wetland degradation based on the index of hydrological connectivity and its correlation with the root-soil interface. Ecol. Indic. 2021, 133, 108392. [Google Scholar] [CrossRef]
- Engloner, A.I. Structure, growth dynamics and biomass of reed (Phragmites australis)–A review. Flora-Morphol. Distrib. Funct. Ecol. Plants 2009, 204, 331–346. [Google Scholar] [CrossRef]
- Ghestem, M.; Sidle, R.C.; Stokes, A. The influence of plant root systems on subsurface flow: Implications for slope stability. Bioscience 2011, 61, 869–879. [Google Scholar] [CrossRef]
- Hu, X.; Li, X.Y.; Wang, P.; Liu, Y.; Wu, X.C.; Li, Z.C.; Zhao, Y.D.; Cheng, Y.Q.; Guo, L.L.; Lyu, Y.L. Influence of exclosure on CT-measured soil macropores and root architecture in a shrub-encroached grassland in northern China. Soil Tillage Res. 2019, 187, 21–30. [Google Scholar] [CrossRef]
- Chirol, C.; Carr, S.J.; Spencer, K.L.; Moeller, I. Pore, live root and necromass quantification in complex heterogeneous wetland soils using X-ray computed tomography. Geoderma 2021, 387, 114898. [Google Scholar] [CrossRef]
- Bodner, G.; Leitner, D.; Kaul, H.-P. Coarse and fine root plants affect pore size distributions differently. Plant Soil 2014, 380, 133–151. [Google Scholar] [CrossRef]
- Qiao, J.; Liu, X.; Zhu, Y.; Jia, X. Three-dimensional quantification of soil pore structure in wind-deposited loess under different vegetation types using industrial X-ray computed tomography. Catena 2021, 199, 105098. [Google Scholar] [CrossRef]
- Wang, J.; Qin, Q.; Bai, Z. Characterizing the effects of opencast coal-mining and land reclamation on soil macropore distribution characteristics using 3D CT scanning. Catena 2018, 171, 212–221. [Google Scholar] [CrossRef]
- Ben-Hur, M.; Yolcu, G.; Uysal, H.; Lado, M.; Paz, A. Soil structure changes: Aggregate size and soil texture effects on hydraulic conductivity under different saline and sodic conditions. Soil Res. 2009, 47, 688–696. [Google Scholar] [CrossRef]
- Hu, X.; Li, X.Y.; Li, Z.C.; Gao, Z.; Wu, X.C.; Wang, P.; Lyu, Y.L.; Liu, L.Y. Linking 3-D soil macropores and root architecture to near saturated hydraulic conductivity of typical meadow soil types in the Qinghai Lake Watershed, northeastern Qinghai–Tibet Plateau. Catena 2020, 185, 104287. [Google Scholar] [CrossRef]
- Pierret, A.; Capowiez, Y.; Belzunces, L.; Moran, C. 3D reconstruction and quantification of macropores using X-ray computed tomography and image analysis. Geoderma 2002, 106, 247–271. [Google Scholar] [CrossRef]
- Luo, L.; Lin, H.; Halleck, P. Quantifying soil structure and preferential flow in intact soil using X-ray computed tomography. Soil Sci. Soc. Am. J. 2008, 72, 1058–1069. [Google Scholar] [CrossRef]
- Archer, N.; Quinton, J.N.; Hess, T. Below-ground relationships of soil texture, roots and hydraulic conductivity in two-phase mosaic vegetation in South-east Spain. J. Arid Environ. 2002, 52, 535–553. [Google Scholar] [CrossRef]
- Bodhinayake, W.; Cheng Si, B. Near-saturated surface soil hydraulic properties under different land uses in the St Denis National Wildlife Area, Saskatchewan, Canada. Hydrol. Process. 2004, 18, 2835–2850. [Google Scholar] [CrossRef]
- Julich, S.; Kreiselmeier, J.; Scheibler, S.; Petzold, R.; Schwärzel, K.; Feger, K.-H. Hydraulic Properties of Forest Soils with Stagnic Conditions. Forests 2021, 12, 1113. [Google Scholar] [CrossRef]
- Zhang, Y.; Huang, C.; Zhang, W.; Chen, J.; Wang, L. The concept, approach, and future research of hydrological connectivity and its assessment at multiscales. Environ. Sci. Pollut. Res. 2021, 28, 52724–52743. [Google Scholar] [CrossRef]
- Bai, J.; Yu, Z.; Yu, L.; Wang, D.; Guan, Y.; Liu, X.; Gu, C.; Cui, B. In-situ organic phosphorus mineralization in sediments in coastal wetlands with different flooding periods in the Yellow River Delta, China. Sci. Total Environ. 2019, 682, 417–425. [Google Scholar] [CrossRef]
- Zhang, J.M.; Xu, Z.M.; Li, F.; Hou, R.J.; Ren, Z. Quantification of 3D macropore networks in forest soils in Touzhai valley (Yunnan, China) using X-ray computed tomography and image analysis. J. Mt. Sci. 2017, 14, 474–491. [Google Scholar] [CrossRef]
- Hu, X.; Li, Z.C.; Li, X.Y.; Liu, Y. Influence of shrub encroachment on CT-measured soil macropore characteristics in the Inner Mongolia grassland of northern China. Soil Tillage Res. 2015, 150, 1–9. [Google Scholar] [CrossRef]
- Liu, B.; Fan, H.; Han, W.; Zhu, L.; Zhao, X.; Zhang, Y.; Ma, R. Linking soil water retention capacity to pore structure characteristics based on X-ray computed tomography: Chinese Mollisol under freeze-thaw effect. Geoderma 2021, 401, 115170. [Google Scholar] [CrossRef]
- Ferreira, T.R.; Pires, L.F.; Wildenschild, D.; Heck, R.J.; Antonino, A.C. X-ray microtomography analysis of lime application effects on soil porous system. Geoderma 2018, 324, 119–130. [Google Scholar] [CrossRef]
- Luo, L.; Lin, H.; Li, S. Quantification of 3-D soil macropore networks in different soil types and land uses using computed tomography. J. Hydrol. 2010, 393, 53–64. [Google Scholar] [CrossRef]
- Peth, S.; Horn, R.; Beckmann, F.; Donath, T.; Fischer, J.; Smucker, A. Three-dimensional quantification of intra-aggregate pore-space features using synchrotron-radiation-based microtomography. Soil Sci. Soc. Am. J. 2008, 72, 897–907. [Google Scholar] [CrossRef]
- Feng, Y.; Wang, J.; Bai, Z.; Reading, L.; Jing, Z. Three-dimensional quantification of macropore networks of different compacted soils from opencast coal mine area using X-ray computed tomography. Soil Tillage Res. 2020, 198, 104567. [Google Scholar] [CrossRef]
- Gholizadeh-Sarabi, S.; Sepaskhah, A.R. Effect of zeolite and saline water application on saturated hydraulic conductivity and infiltration in different soil textures. Arch. Agron. Soil Sci. 2013, 59, 753–764. [Google Scholar] [CrossRef]
- Ola, A.; Schmidt, S.; Lovelock, C.E. The effect of heterogeneous soil bulk density on root growth of field-grown mangrove species. Plant Soil 2018, 432, 91–105. [Google Scholar] [CrossRef]
- Smith, K.D.; May, P.B.; Moore, G.M. The influence of compaction and soil strength on the establishment of four Australian landscape trees. J. Arboric. 2001, 27, 1–7. [Google Scholar] [CrossRef]
- Cambi, M.; Hoshika, Y.; Mariotti, B.; Paoletti, E.; Picchio, R.; Venanzi, R.; Marchi, E. Compaction by a forest machine affects soil quality and Quercus robur L. seedling performance in an experimental field. For. Ecol. Manag. 2017, 384, 406–414. [Google Scholar] [CrossRef]
- Yue, L.K.; Wang, Y.; Wang, L.; Yao, S.; Cong, C.; Ren, L.; Zhang, B. Impacts of soil compaction and historical soybean variety growth on soil macropore structure. Soil Tillage Res. 2021, 214, 105166. [Google Scholar] [CrossRef]
- Colombi, T.; Torres, L.C.; Walter, A.; Keller, T. Feedbacks between soil penetration resistance, root architecture and water uptake limit water accessibility and crop growth—A vicious circle. Sci. Total Environ. 2018, 626, 1026–1035. [Google Scholar] [CrossRef]
- Lipiec, J.; Horn, R.; Pietrusiewicz, J.; Siczek, A. Effects of soil compaction on root elongation and anatomy of different cereal plant species. Soil Tillage Res. 2012, 121, 74–81. [Google Scholar] [CrossRef]
- Stewart, J.; Moran, C.; Wood, J. Macropore sheath: Quantification of plant root and soil macropore association. Plant Soil 1999, 211, 59–67. [Google Scholar] [CrossRef]
- López-Bucio, J.; Cruz-Ramırez, A.; Herrera-Estrella, L. The role of nutrient availability in regulating root architecture. Curr. Opin. Plant Biol. 2003, 6, 280–287. [Google Scholar] [CrossRef]
- Martínez, M.M.; Ortega, R.; Janssens, M.; Fincheira, P. Use of organic amendments in table grape: Effect on plant root system and soil quality indicators. J. Soil Sci. Plant Nutr. 2018, 18, 100–112. [Google Scholar] [CrossRef]
- Kristoffersen, A.Ø.; Riley, H. Effects of soil compaction and moisture regime on the root and shoot growth and phosphorus uptake of barley plants growing on soils with varying phosphorus status. Nutr. Cycl. Agroecosystems 2005, 72, 135–146. [Google Scholar] [CrossRef]
- Landl, M.; Huber, K.; Schnepf, A.; Vanderborght, J.; Javaux, M.; Glyn Bengough, A.; Vereecken, H. A new model for root growth in soil with macropores. Plant Soil 2017, 415, 99–116. [Google Scholar] [CrossRef]
- Wang, M.; He, D.; Shen, F.; Huang, J.; Zhang, R.; Liu, W.; Zhu, M.; Zhou, L.; Wang, L.; Zhou, Q. Effects of soil compaction on plant growth, nutrient absorption, and root respiration in soybean seedlings. Environ. Sci. Pollut. Res. 2019, 26, 22835–22845. [Google Scholar] [CrossRef]
- Colombi, T.; Braun, S.; Keller, T.; Walter, A. Artificial macropores attract crop roots and enhance plant productivity on compacted soils. Sci. Total Environ. 2017, 574, 1283–1293. [Google Scholar] [CrossRef]
- Zhou, H.; Whalley, W.R.; Hawkesford, M.J.; Ashton, R.W.; Atkinson, B.; Atkinson, J.A.; Sturrock, C.J.; Bennett, M.J.; Mooney, S.J. The interaction between wheat roots and soil pores in structured field soil. J. Exp. Bot. 2021, 72, 747–756. [Google Scholar] [CrossRef]
- Zhang, Y.H.; Jiang, J.; Zhang, J.C.; Zhang, Z.; Zhang, M. Effects of roots systems on hydrological connectivity below the soil surface in the Yellow River Delta wetland. Ecohydrology 2022, 15, e2393. [Google Scholar] [CrossRef]
- Granse, D.; Titschack, J.; Ainouche, M.; Jensen, K.; Koop-Jakobsen, K. Subsurface aeration of tidal wetland soils: Root-system structure and aerenchyma connectivity in Spartina (Poaceae). Sci. Total Environ. 2022, 802, 149771. [Google Scholar] [CrossRef]
- Jiang, X.J.; Liu, W.; Chen, C.; Liu, J.; Yuan, Z.-Q.; Jin, B.; Yu, X. Effects of three morphometric features of roots on soil water flow behavior in three sites in China. Geoderma 2018, 320, 161–171. [Google Scholar] [CrossRef]
- Shi, X.; Qin, T.; Yan, D.; Tian, F.; Wang, H. A meta-analysis on effects of root development on soil hydraulic properties. Geoderma 2021, 403, 115363. [Google Scholar] [CrossRef]
- Zhu, P.; Zhang, G.; Zhang, B. Soil saturated hydraulic conductivity of typical revegetated plants on steep gully slopes of Chinese Loess Plateau. Geoderma 2022, 412, 115717. [Google Scholar] [CrossRef]
- Yu, Y.; Loiskandl, W.; Kaul, H.P.; Himmelbauer, M.; Wei, W.; Chen, L.; Bodner, G. Estimation of runoff mitigation by morphologically different cover crop root systems. J. Hydrol. 2016, 538, 667–676. [Google Scholar] [CrossRef]
- Deguchi, T.; Iwama, K.; Matsumoto, M.; Tanigawa, J. Effect of varietal difference in root system on hydraulic conductance in potatoes under different soil water conditions and planting dates. Potato Res. 2015, 58, 103–119. [Google Scholar] [CrossRef]
- Lu, J.; Zhang, Q.; Werner, A.D.; Li, Y.; Jiang, S.; Tan, Z. Root-induced changes of soil hydraulic properties–A review. J. Hydrol. 2020, 589, 125203. [Google Scholar] [CrossRef]
- Nuttall, J.G.; Davies, S.; Armstrong, R.; Peoples, M. Testing the primer-plant concept: Wheat yields can be increased on alkaline sodic soils when an effective primer phase is used. Aust. J. Agric. Res. 2008, 59, 331–338. [Google Scholar] [CrossRef]
- Gile, L.; Gibbens, R.; Lenz, J. Soils and sediments associated with remarkable, deeply-penetrating roots of crucifixion thorn (koeberlinia spinosazucc.). J. Arid Environ. 1995, 31, 137–151. [Google Scholar] [CrossRef]
- Hao, H.X.; Wei, Y.J.; Cao, D.N.; Guo, Z.L.; Shi, Z.H. Vegetation restoration and fine roots promote soil infiltrability in heavy-textured soils. Soil Tillage Res. 2020, 198, 104542. [Google Scholar] [CrossRef]
- Zhu, P.; Zhang, G.; Wang, H.; Xing, S. Soil infiltration properties affected by typical plant communities on steep gully slopes on the Loess Plateau of China. J. Hydrol. 2020, 590, 125535. [Google Scholar] [CrossRef]
- De Baets, S.; Poesen, J.; Knapen, A.; Barberá, G.G.; Navarro, J. Root characteristics of representative Mediterranean plant species and their erosion-reducing potential during concentrated runoff. Plant Soil 2007, 294, 169–183. [Google Scholar] [CrossRef]
- Ilek, A.; Kucza, J.; Witek, W. Using undisturbed soil samples to study how rock fragments and soil macropores affect the hydraulic conductivity of forest stony soils: Some methodological aspects. J. Hydrol. 2019, 570, 132–140. [Google Scholar] [CrossRef]
- Cheik, S.; Bottinelli, N.; Minh, T.T.; Doan, T.T.; Jouquet, P. Quantification of three dimensional characteristics of macrofauna macropores and their effects on soil hydraulic conductivity in northern Vietnam. Front. Environ. Sci. 2019, 7, 31. [Google Scholar] [CrossRef]
- Borges, J.A.; Pires, L.F.; Cássaro, F.A.; Auler, A.C.; Rosa, J.A.; Heck, R.J.; Roque, W.L. X-ray computed tomography for assessing the effect of tillage systems on topsoil morphological attributes. Soil Tillage Res. 2019, 189, 25–35. [Google Scholar] [CrossRef]
- Beven, K.; Germann, P. Macropores and water flow in soils. Water Resour. Res. 1982, 18, 1311–1325. [Google Scholar] [CrossRef]


| Plots | Soil Depth (cm) | Total Soil Porosity (%) | Soil Capillary Porosity (%) | Soil Non-Capillary Porosity (%) | Sand | Silt | Clay | Soil Bulk Density (g/cm3) | Soil Organic Matter (g/kg) | Soil Total Nitrogen (g/kg) | Soil Total Phosphorus (g/kg) | Soil Available Phosphorus (mg/kg) |
|---|---|---|---|---|---|---|---|---|---|---|---|---|
| LWa | 0–10 | 0.563 ± 0.024 | 0.520 ± 0.049 | 0.043 ± 0.037 | 0.211 ± 0.082 | 0.563 ± 0.115 | 0.226 ± 0.044 | 0.912 ± 0.094 | 21.039 ± 9.265 | 1.345 ± 0.631 | 0.614 ± 0.033 | 3.927 ± 1.933 |
| 10–20 | 0.483 ± 0.011 | 0.468 ± 0.010 | 0.014 ± 0.008 | 0.170 ± 0.041 | 0.623 ± 0.123 | 0.207 ± 0.135 | 1.304 ± 0.052 | 5.050 ± 0.503 | 0.358 ± 0.043 | 0.569 ± 0.055 | 2.398 ± 1.031 | |
| 20–40 | 0.479 ± 0.016 | 0.471 ± 0.012 | 0.009 ± 0.005 | 0.327 ± 0.120 | 0.561 ± 0.122 | 0.112 ± 0.032 | 1.384 ± 0.002 | 3.857 ± 1.257 | 0.270 ± 0.094 | 0.538 ± 0.045 | 1.792 ± 0.111 | |
| 40–60 | 0.464 ± 0.029 | 0.454 ± 0.021 | 0.011 ± 0.015 | 0.521 ± 0.130 | 0.413 ± 0.127 | 0.067 ± 0.006 | 1.427 ± 0.177 | 2.692 ± 0.709 | 0.183 ± 0.039 | 0.518 ± 0.038 | 1.655 ± 0.231 | |
| LWb | 0–10 | 0.478 ± 0.016 | 0.472 ± 0.015 | 0.006 ± 0.002 | 0.202 ± 0.053 | 0.669 ± 0.069 | 0.129 ± 0.019 | 1.406 ± 0.061 | 11.244 ± 2.839 | 0.694 ± 0.038 | 0.694 ± 0.073 | 3.576 ± 0.279 |
| 10–20 | 0.468 ± 0.017 | 0.463 ± 0.016 | 0.004 ± 0.001 | 0.193 ± 0.071 | 0.688 ± 0.077 | 0.113 ± 0.007 | 1.388 ± 0.021 | 2.781 ± 0.693 | 0.200 ± 0.033 | 0.582 ± 0.003 | 1.749 ± 0.181 | |
| 20–40 | 0.468 ± 0.013 | 0.461 ± 0.018 | 0.007 ± 0.005 | 0.387 ± 0.067 | 0.542 ± 0.060 | 0.071 ± 0.010 | 1.418 ± 0.039 | 2.535 ± 1.072 | 0.159 ± 0.073 | 0.584 ± 0.021 | 2.552 ± 0.746 | |
| 40–60 | 0.491 ± 0.006 | 0.490 ± 0.005 | 0.001 ± 0.001 | 0.243 ± 0.172 | 0.656 ± 0.145 | 0.101 ± 0.036 | 1.467 ± 0.058 | 2.126 ± 1.340 | 0.188 ± 0.052 | 0.576 ± 0.027 | 2.781 ± 0.292 |
| Plots | Equivalent Diameter (mm) | Number of Soil Macropores |
|---|---|---|
| LWa | 0.05 < D < 0.5 | 7072 ± 562 aA |
| 0.5 < D < 1 | 6502 ± 783 aA | |
| 1 < D < 3 | 2837 ± 612 aB | |
| 3 < D < 5 | 772 ± 122 aC | |
| D > 5 | 505 ± 101 aC | |
| LWb | 0.05 < D < 0.5 | 280 ± 92 bC |
| 0.5 < D < 1 | 454 ± 68 bB | |
| 1 < D < 3 | 3383 ± 534 aA | |
| 3 < D < 5 | 84 ± 10 bD | |
| D > 5 | 22 ± 12 bE |
Disclaimer/Publisher’s Note: The statements, opinions and data contained in all publications are solely those of the individual author(s) and contributor(s) and not of MDPI and/or the editor(s). MDPI and/or the editor(s) disclaim responsibility for any injury to people or property resulting from any ideas, methods, instructions or products referred to in the content. |
© 2023 by the authors. Licensee MDPI, Basel, Switzerland. This article is an open access article distributed under the terms and conditions of the Creative Commons Attribution (CC BY) license (https://creativecommons.org/licenses/by/4.0/).
Share and Cite
Zhang, Y.; Wang, L.; Zhang, W.; Zhang, Z.; Zhang, M. Quantification of Root Systems and Soil Macropore Networks Association to Soil Saturated Hydraulic Conductivity in Forested Wetland Soils. Forests 2023, 14, 132. https://doi.org/10.3390/f14010132
Zhang Y, Wang L, Zhang W, Zhang Z, Zhang M. Quantification of Root Systems and Soil Macropore Networks Association to Soil Saturated Hydraulic Conductivity in Forested Wetland Soils. Forests. 2023; 14(1):132. https://doi.org/10.3390/f14010132
Chicago/Turabian StyleZhang, Yinghu, Lu Wang, Wenqi Zhang, Zhenming Zhang, and Mingxiang Zhang. 2023. "Quantification of Root Systems and Soil Macropore Networks Association to Soil Saturated Hydraulic Conductivity in Forested Wetland Soils" Forests 14, no. 1: 132. https://doi.org/10.3390/f14010132
APA StyleZhang, Y., Wang, L., Zhang, W., Zhang, Z., & Zhang, M. (2023). Quantification of Root Systems and Soil Macropore Networks Association to Soil Saturated Hydraulic Conductivity in Forested Wetland Soils. Forests, 14(1), 132. https://doi.org/10.3390/f14010132