Article

Optimizing Bucking Decisions in Korean Red Pine: A Dynamic Programming Approach to Timber Profitability

1
Department of Agriculture, Forestry and Bioresources, Seoul National University, Seoul 08826, Republic of Korea
2
Division of Forest Policy and Economics, National Institute of Forest Science, Seoul 02445, Republic of Korea
3
Research Institute of Agriculture and Life Sciences, Seoul National University, Seoul 08826, Republic of Korea
*
Author to whom correspondence should be addressed.
This work was part of the Master thesis of the first author, Yoonkoo Jung. Master program at Seoul National University, Republic of Korea.
Forests 2023, 14(12), 2450; https://doi.org/10.3390/f14122450
Submission received: 13 November 2023 / Revised: 11 December 2023 / Accepted: 14 December 2023 / Published: 15 December 2023
(This article belongs to the Section Forest Economics, Policy, and Social Science)

Abstract

:
Poor bucking decisions in forest stands can result in underestimating the profitability of timber sales. This study focuses on Pinus densiflora, commonly known as a red pine in Korea, which has often been underutilized as pulp and chips, leading to reduced profit margins. This study aimed to improve bucking decisions for red pine by analyzing the potential values in different log types and the profitability of manufacturing lumber products compared to pulp chips. A log sawing simulation model was developed using dynamic programming. This study optimized sawing patterns and estimated net profits for varying log sizes within the lumber market in Korea. The findings reveal that manufacturing lumber products from 3.6 m and 2.7 m logs can yield net profits 861% and 723% higher, respectively, than producing pulp chips from 1.8 m logs. Notably, sawing 3.6 m logs resulted in an average net profit 24% higher than from 2.7 m logs. These results advocate for more strategic bucking decisions based on potential timber sale profits and the end-uses of logs, especially in trees with large diameters at breast height (DBH), which can produce high-quality logs and should be bucked into long sawlogs whenever possible. Additionally, the study emphasizes the importance of practicing timber cruise to appraise the stumpage value of forest stands more accurately, moving beyond mere volume estimation to include tree type and expected volume. By implementing these practices, timber sale profits and the overall value of forest stands in Korea can be significantly enhanced. This approach not only benefits the economic aspect of forestry but also encourages sustainable and efficient resource management.

1. Introduction

The quantity of growing stock in Korea has increased as the country’s forest stand has matured since successful reforestation efforts in the 1970s and 1980s [1]. However, many of the harvested trees, regardless of species or large diameter at breast height (DBH), are bucked into short logs and traded as pulp sticks due to poor bucking decisions made by loggers. These loggers prioritize minimizing harvesting costs over maximizing timber sale profits, resulting in the production of short logs for higher production efficiency. These inconsiderate bucking practices have caused a loss of potential profits in timber sales and have led to the underestimation of the stumpage value of Korea’s forestland [2].
Pinus densiflora, commonly known as red pine in Korea, covers 64% of the entire forest area in the country [1] but is undervalued due to current bucking practices. Historically, due to its mechanical and chemical characteristics, which are similar to those of Douglas fir (Pseudotsuga menziesii) and Western Hemlock (Tsuga heterophylla), and its symbolic significance in Korean culture, red pine was highly valued as a sawlog for Hanok, a traditional Korean house structure, as well as for traditional furniture and other wood products, such as cutting boards, bowls, and utensils [3].
Despite its high value as a sawlog material, pine trees are mostly bucked into pulp-sticks, resulting in lower timber sale profits. Poor bucking practices, without considering end-uses and the potential premium within the pine timber, have led to an underestimation of the value of individual pine trees and the stumpage value of pine stands in Korea. This issue has even caused private forest landowners to switch their forest management objectives to non-timber forest products, such as crop tree cultivation [4]. To address this problem, it is necessary to estimate the value recovery from lumber manufacturing using pine sawlogs and compare it to the value generated from chipping pine pulp sticks.
Large efforts have been made to estimate lumber yield from log sawing and optimize sawing patterns for maximum value recovery. The estimation of lumber yield and optimization of sawing patterns are integral components of the wood supply chain, which extends from forest growth to the distribution of final products. Advancements in digital technologies, as evidenced by the research of Scholz et al. [5], have significantly enhanced the efficiency of these processes.
The significance of these advancements is further highlighted in the studies of roundwood and biomass by Vaatetinen et al. [6]. They emphasize the importance of integrated management for enhancing the efficiency and sustainability of wood products. Similarly, procurement strategies, including bucking decisions and transportation planning, crucial for economic sustainability and aligning operations with market demands, are discussed by Kogler et al. [7], Kogler and Rauch [8], and Acuna et al. [9].
The early studies on sawing patterns by Peter and Bamping [10], mathematical analysis by Hallock [11], and the transparent overlay procedure by Taylor and Garton [12] laid the foundation for optimizing lumber yield. Additionally, the computer simulation developments by McAdoo [13] further advanced the field, while Hallock’s theoretical model evolved into the Best Opening Face computer program by Hallock and Lewis [14], significantly impacting the field.
Dynamic programming (DP) has become a widely used method in this field, effectively breaking down complex log sawing problems into simpler subproblems for efficient optimization. The foundational theory of DP, as established by Bellman [15], along with other applications by Briggs et al. [16] and Ronnqvist [17], has led to the development of several innovative log sawing simulation models. Notable among these are the models by Geerts [18] and Todoroki and Ronnqvist [19], as well as the integrated bucking and log sawing processes developed by Faaland and Briggs [20] and Reinders and Hendriks [21]. These models have significantly contributed to automating timber harvesting and sawing processes, as highlighted in [22].
In Korea, research related to this field, such as the work of Kwon [23] and Kwon et al. [24], developed a lumber yield estimation model for Pinus koraiensis, Larix kaempferi, and Quercus acutissima based on tree shape analysis. Kwon et al. [25] developed a lumber and residue yield estimation model for Larix kaempferi. Other studies include merchantability analysis on Robinia pseudoacacia and Alnus species [26,27] and lumber yield estimation from Pinus densiflora, Pinus koraiensis, and Larix kaempferi using a portable sawing machine [28].
The main objective of this study was to develop a log sawing simulation model based on DP that maximizes value recovery. Furthermore, a comparative profitability analysis was conducted to evaluate the profitability of manufacturing different forest products, including lumber and pulp chips, from Pinus densiflora logs. These analyses were designed to aid in making optimal bucking decisions by comparing the potential values among different length classes of the pine logs.

2. Materials and Methods

The study commenced by developing a log sawing simulation model, as the value of lumber is directly linked to the worth of a log [29]. The simulation produced optimal sawing patterns to increase the value recovery. To estimate the net profit of lumber production, a field survey was conducted to gather data on various lumber dimensions, prices, and manufacturing costs. Similarly, data on manufacturing costs and pulp chip prices, along with the log-to-chip ratio, were utilized to calculate the net profit in pulp chip production. Finally, the study compared the net profits of producing various forest products, such as lumber and pulp chips, using Pinus densiflora logs of various lengths.

2.1. Development of a Log Sawing Simulation Model

Since most wood product manufacturers in Korea are small-scale businesses [30], manual band-saw machines with a carriage are commonly used to produce various wood products based on customers’ demands. Because of the characteristics of band-saw blades, guillotine-type cuts are made between two opposite edges of a log’s cross-section.
This study examines a two-step process for log breakdown. In the first step, a log of a specific length is broken down into flitches, and then the flitches are further processed into lumber products (Figure 1). Essentially, perpendicular cuts to the x-axis divide a log into flitches, while perpendicular cuts to the y-axis divide the flitches into lumber products. Log bucking before the sawing process was not considered in this study because logs in Korean sawmills are typically pre-cut to specific lengths before arriving in the log yard.
In this study, the problem of determining the optimal sawing pattern for a given log based on the dimensions and prices of lumber products is divided into two subproblems [31] since the log breakdown process involves two steps along the x and y-axes.
The DP algorithm developed by Reinders and Hendrix [32] was adapted for this study. The algorithm was originally based on a three-dimensional space that considered the log’s length (z-axis in Figure 1), width (x-axis in Figure 1), and height of the circular cross-section (y-axis in Figure 1). However, this study only considered the width and height of the cross-section since the logs were assumed to be pre-cut into certain length classes before sawing. Therefore, a two-dimensional DP algorithm was ultimately adopted in this study. A detailed explanation of the algorithm is presented below.
Assuming a cut is made on the circular cross-section of a log at point x on the x-axis, let ϕ x be the width of the resulting flitch. At the x-level, the decision to be made is the width ( ϕ x ) of the flitch that maximizes the value XF(x). Decisions are made for every point on the x-axis, from the leftmost point ( x a ) to the rightmost point ( x ϖ ) of the cross-section’s width (Figure 2), considering the circular cross-section of the log. The value of the flitch cut between x and ϕ x , G(x, ϕ x ) is then determined at the next level based on the value of the lumber products, YFxy, that can be produced from it. If optimum decisions were made at all previous points on the x-axis, the solution X F x ϕ x is stored. Thus, the DP algorithm for the x -level can be formulated as follows:
X F x = max { G x , ϕ x + X F x ϕ x } x a x x ω , ϕ x x , G x ,   ϕ x = Y F x y
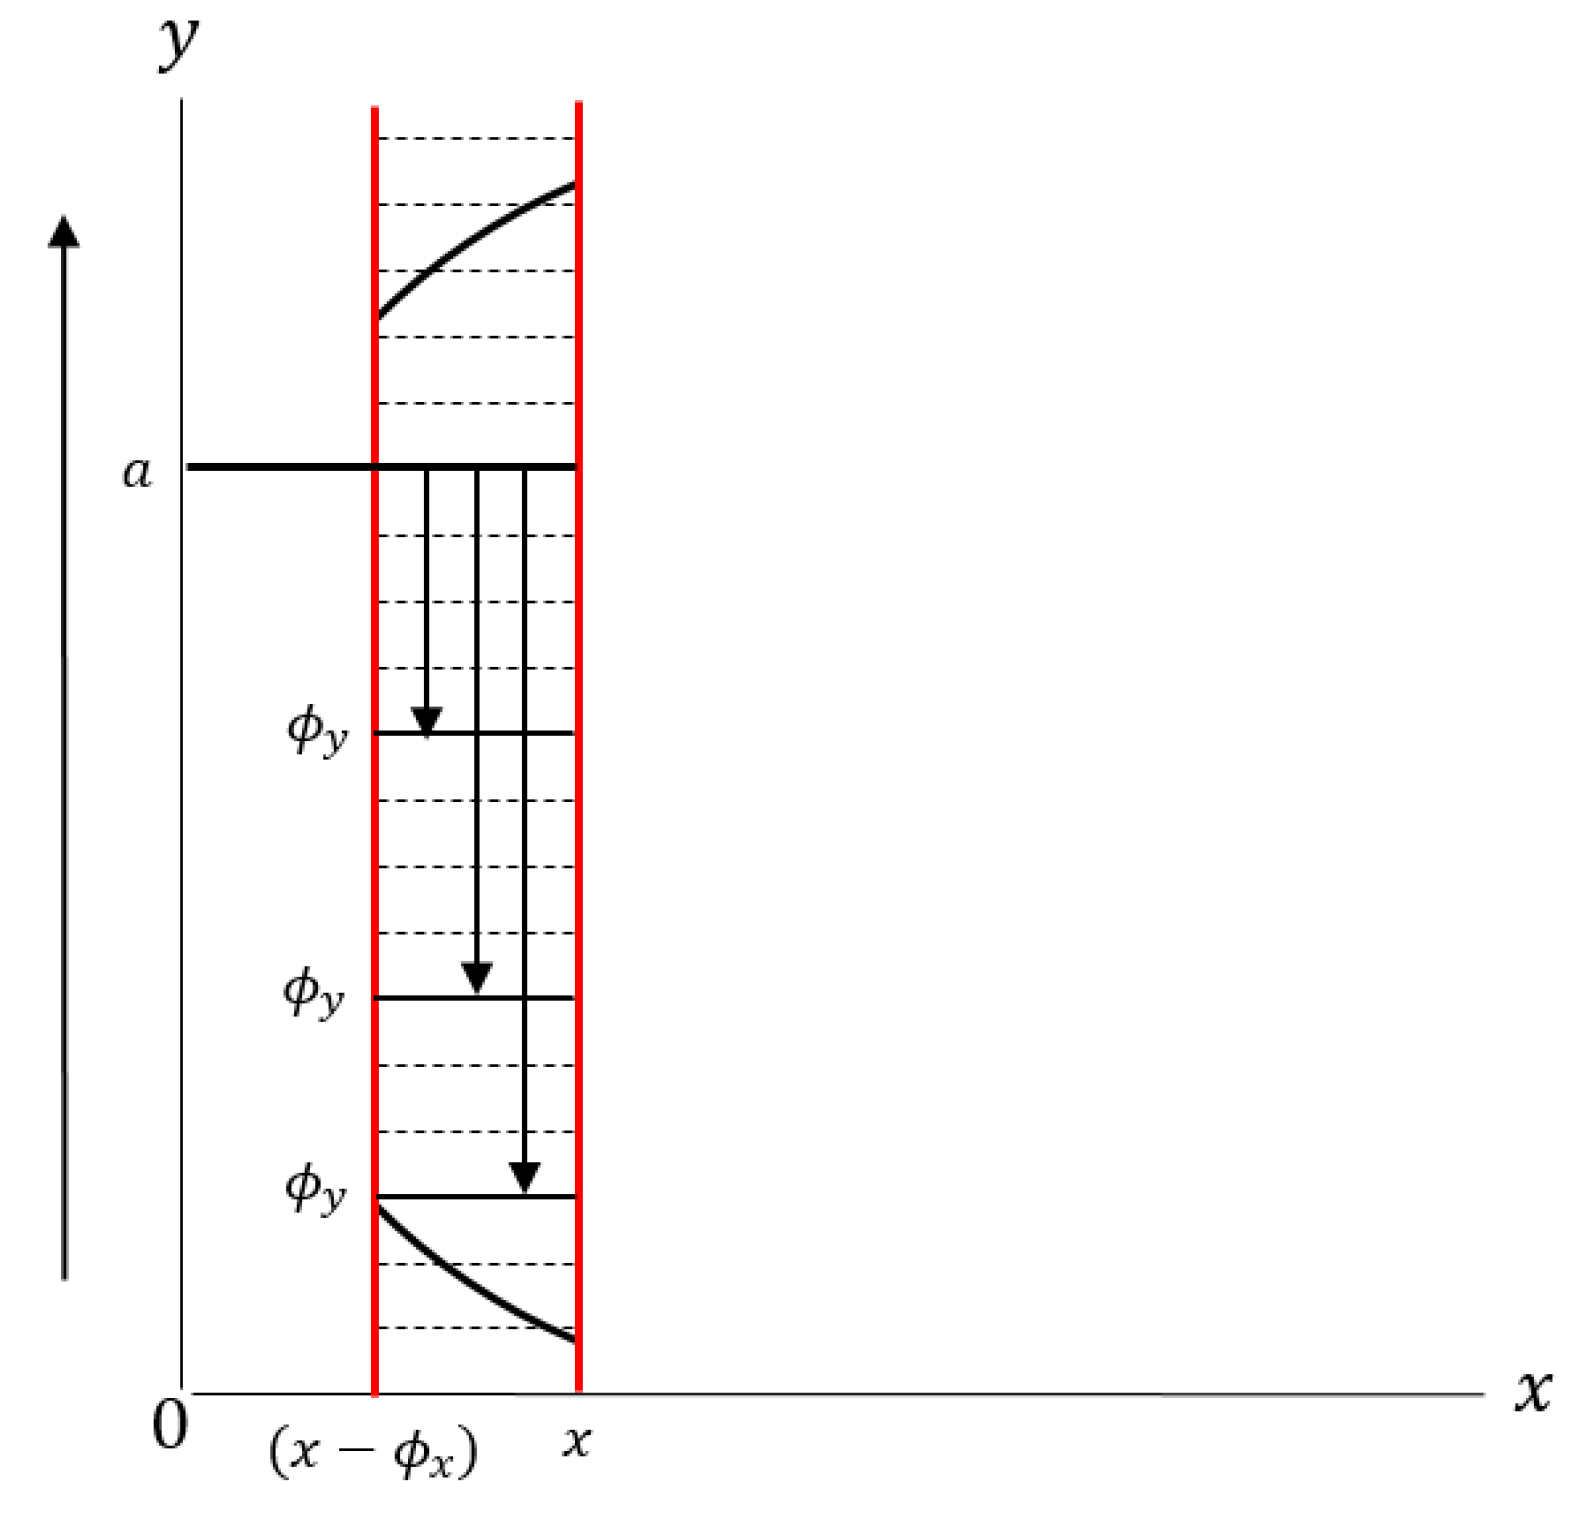
In the y -level, the goal is to maximize the value of lumber products ( Y F x y ) cut from the flitch. The decision to be made at this level is the height ( ϕ y ) of the cross-section of the log starting from the point y on the y-axis (Figure 3). In other words, the type of lumber product ( n ) with a value of ( v ) to be cut, either rotated (90°) or not, from the flitch is determined. The range of y, in this case, goes from the very bottom of the circular cross-section of the log ( y β ) where y = 0 to the effective height of the flitch ( y γ ), which is determined by the function of the flitch width in the x-level ( ϕ x ). The decision on the type of lumber product ( n ) and whether to rotate the product or not is made based on the value of the lumber products v(n) cut from the flitch. If optimum decisions were made at all the previous points on the y-axis, the solution Y F x y ϕ y is saved. Thus, the DP algorithm for the y-level can be formulated as follows:
YF x Y = max   H y , ϕ y + Y F x y ϕ y y β ϕ x y y γ ϕ x , ϕ y y , H y ,   ϕ y = v n
The optimization process involves using the output of the y-level, which is the value of lumber products, Y F x y , as the input to the x-level to determine the optimal width of a flitch, ϕ x . The algorithm then backtracks the decisions made at each level until the optimal solution is found. The mathematical algorithm was programmed using Python 3.6 and executed on an Intel® Core™ (Santa Clara, CA, USA) i7-3770 CPU @ 3.40 GHz.

2.2. Data Collection

To simulate the production of lumber from pine (Pinus densiflora) logs, this study gathered information on the dimensions and prices of lumber products currently traded in the domestic market as of 2022, sourced from the National Forestry Cooperative Federation in Korea. The market offers two length types (3.6 m and 2.7 m) with varying dimensions. The 3.6 m types consist of 9 different products, including two board-type products (type 1 and 2), which are defined as lumber products with a width at least three times longer than their thickness. Meanwhile, the 2.7 m types consist of 13 different products, including five board-type products. Table 1 provides detailed information on the dimensions and prices of each lumber product.
For pulp chip production, all logs less than or equal to 1.8 m long are considered pulp sticks according to the log grading system in Korea (Table 2).
In wood manufacturing businesses, the total production cost consists of various cost components that depend on the production process, including log receiving, sorting, debarking, sawing, edging, drying, and more [32]. However, for the purpose of this study, the cost of purchasing logs and the cost of sawing logs (including debarking, sawing, and edging) were considered as the main factors affecting lumber production costs.
The cost of sawing logs was obtained from seven sawmills located in three different regions of Korea (three in Incheon, two in Gangwon-province, and two in Gyeonggi-province) that produce lumber products. The sawmills provided the average cost of sawing 1 m 3 of lumber, which varied from $47 to $65.8. For this study, an average cost of $56.4 per m 3 was applied.
Regarding log purchasing prices, the “Quarterly Market Prices of Domestic Timber”, published by the Korea Forestry Promotion Institute in 2022, was consulted. This publication provides log prices for different species based on their grading system. Table 2 shows the prices of pine logs based on their grades.
For pulp chip production, the raw data were collected from three wood-chipping facilities, one located in Gangwon province and two in Gyeongbuk province, to obtain information regarding pulp chip production and the raw materials used. The manufacturing process of pulp chips involves debarking and chipping. During the debarking process, the bark portion is removed to extract the wood fibers, and the heartwood of the log is then chipped to produce pulp chips. The cost of both the debarking and chipping processes was included in the total chipping cost, which was $15 per m3, according to the facilities.
The production yield of pulp chips from logs was estimated as 2.5 m3 per 1 ton of logs, according to the data provided by the three facilities, and a log buying price of $58.4 per m3 was applied.

2.3. Profitability Analysis

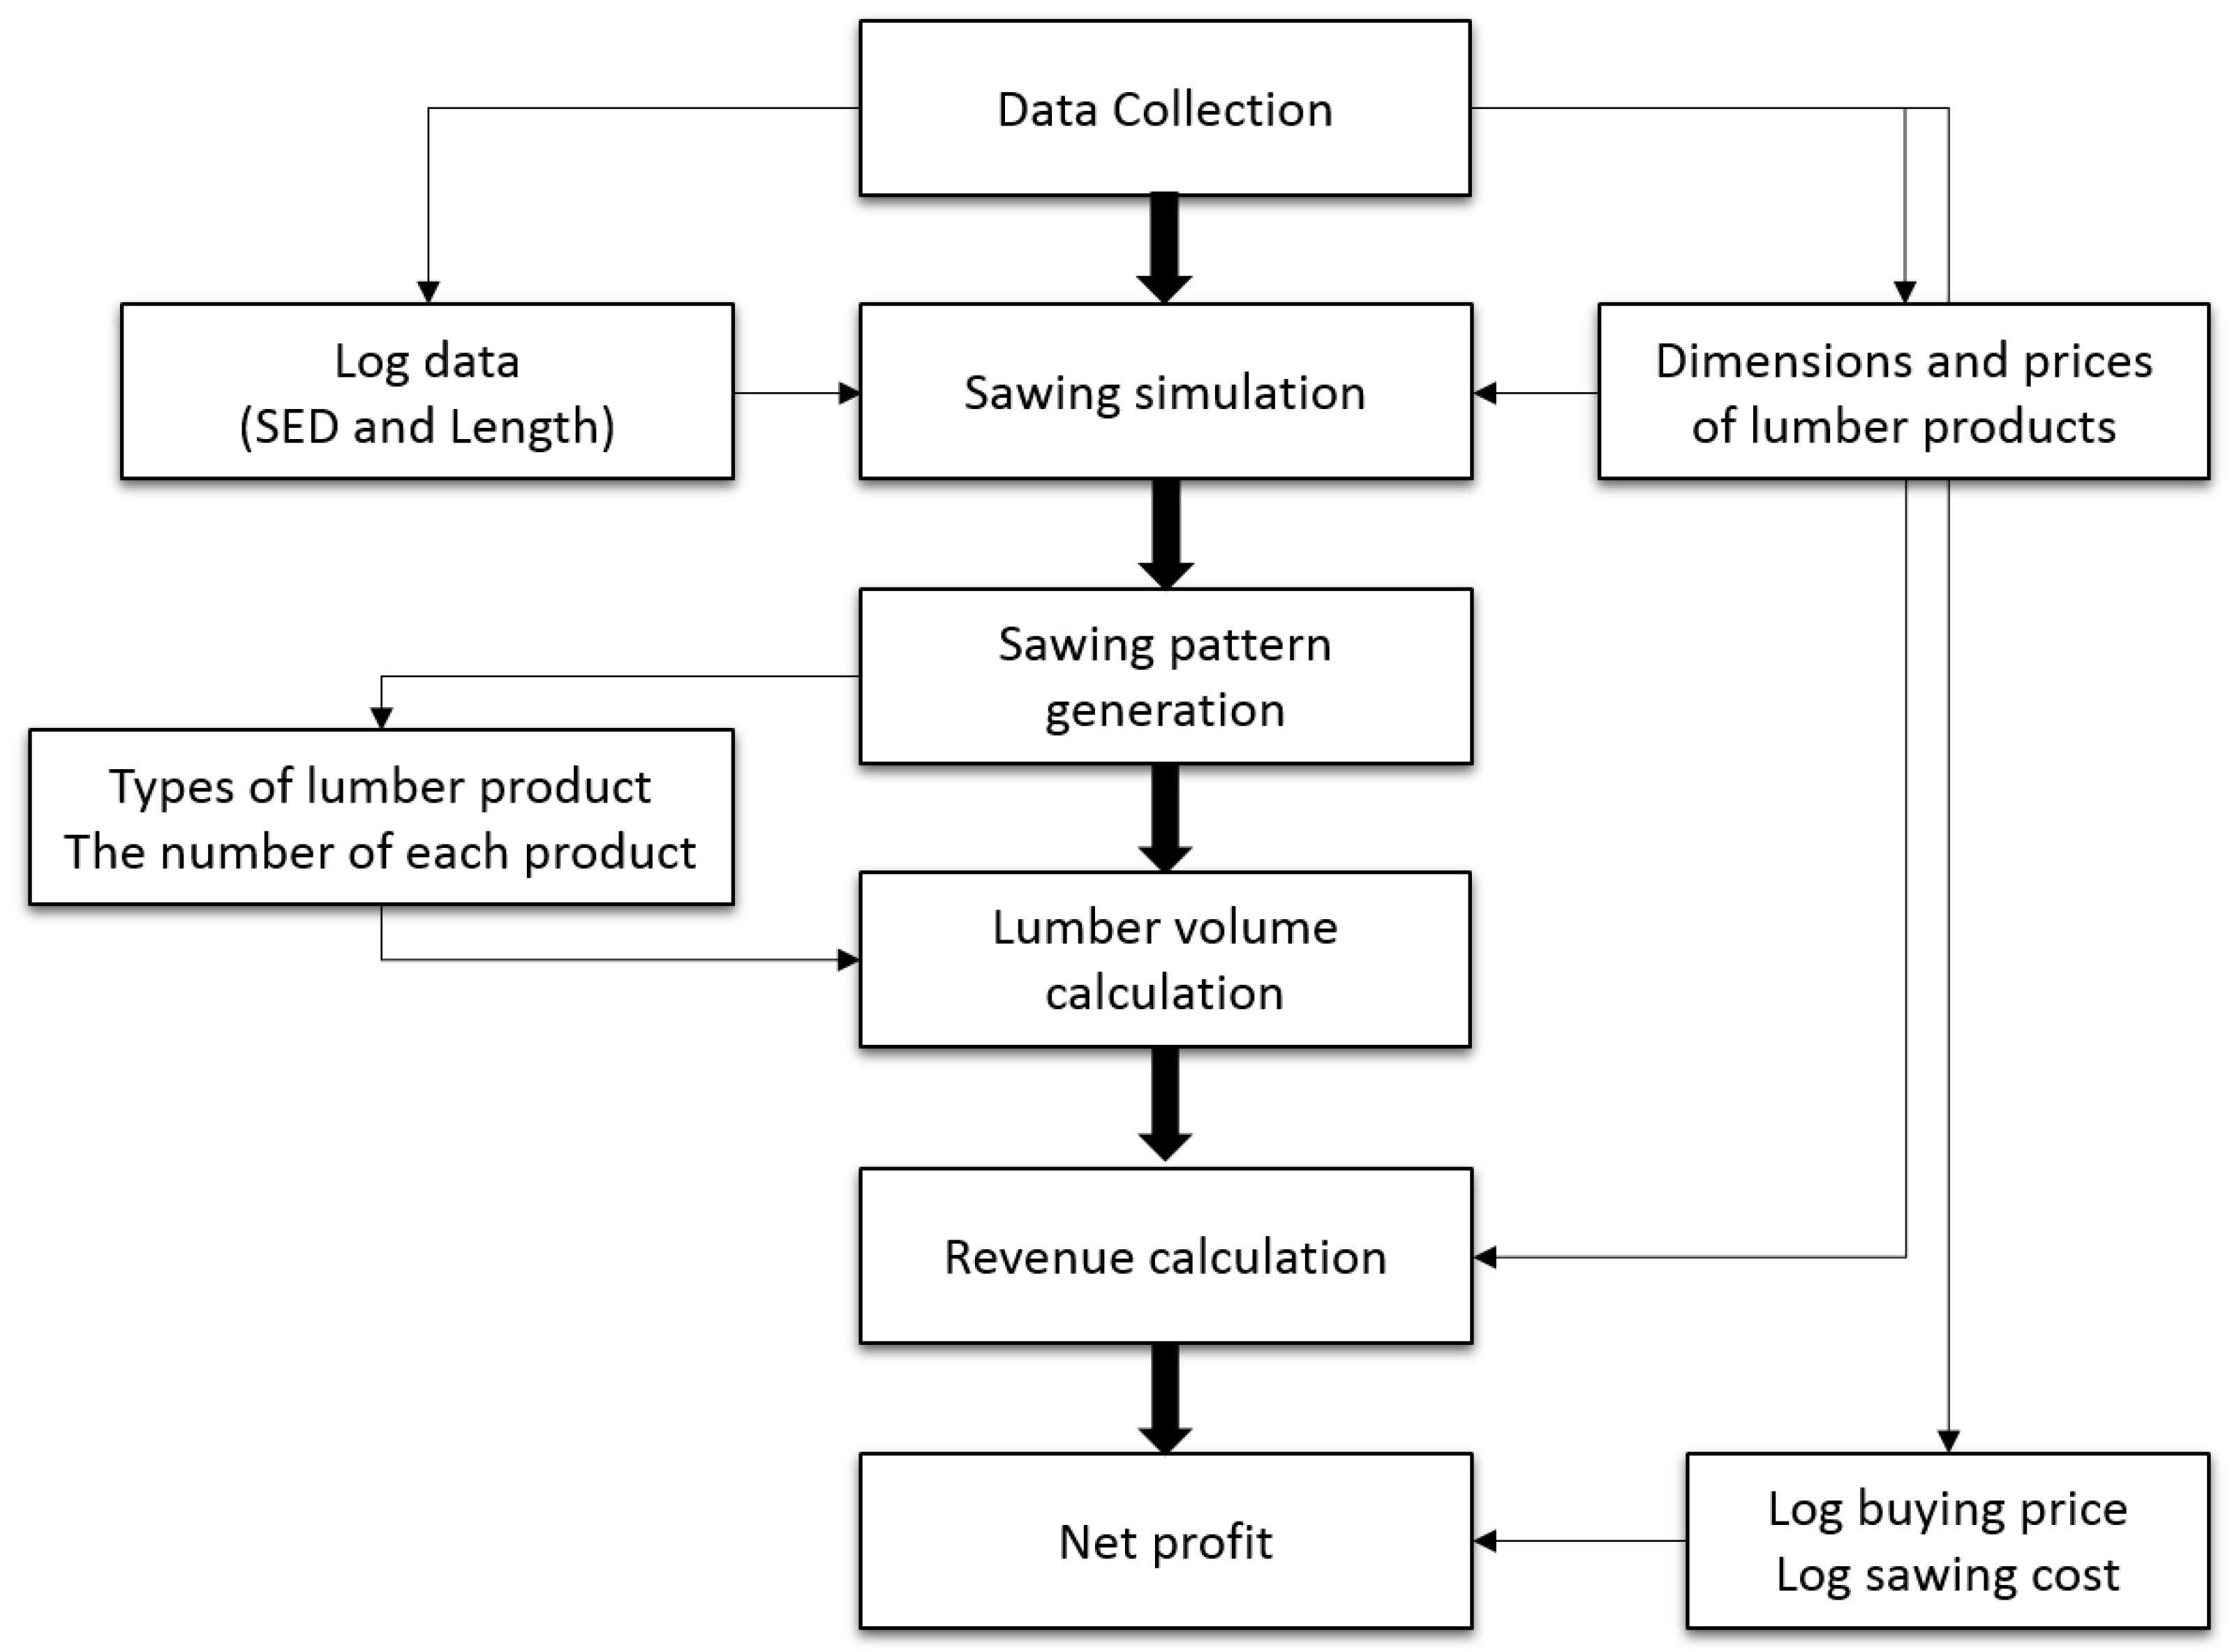
The profitability analysis was carried out on the pine logs, which had diameters ranging from 6 cm to 40 cm, and were divided into two length types of lumber products, as shown in Table 1. The log volume for each type was determined using the log volume table published by the Korea Forest Research Institute in 2011. Figure 4 illustrates the procedure followed to analyze the profitability of lumber production, and a detailed explanation of the process is provided below.
The simulation generated an optimal sawing pattern for maximizing value recovery, as well as the types and quantities of lumber products resulting from the simulation model. To calculate the volume of lumber yield, the number of each product type was multiplied by the volume of each product type adjusted for the length of the logs. However, as the log sawing simulation model only provides two-dimensional results, the log length was also multiplied for the volume calculation. The recovery rate of the lumber yield was determined by dividing the total lumber yield by the volume of the log.
The revenue generated from log sawing was calculated by multiplying the volume of each product type sold by its corresponding price. Finally, the net profit of log sawing was determined by subtracting the total lumber production cost, including the log-buying price and sawing cost, from the revenue generated. The log-buying price was calculated by multiplying the volume of each log by its market price according to its dimensional grades, as shown in Table 2.
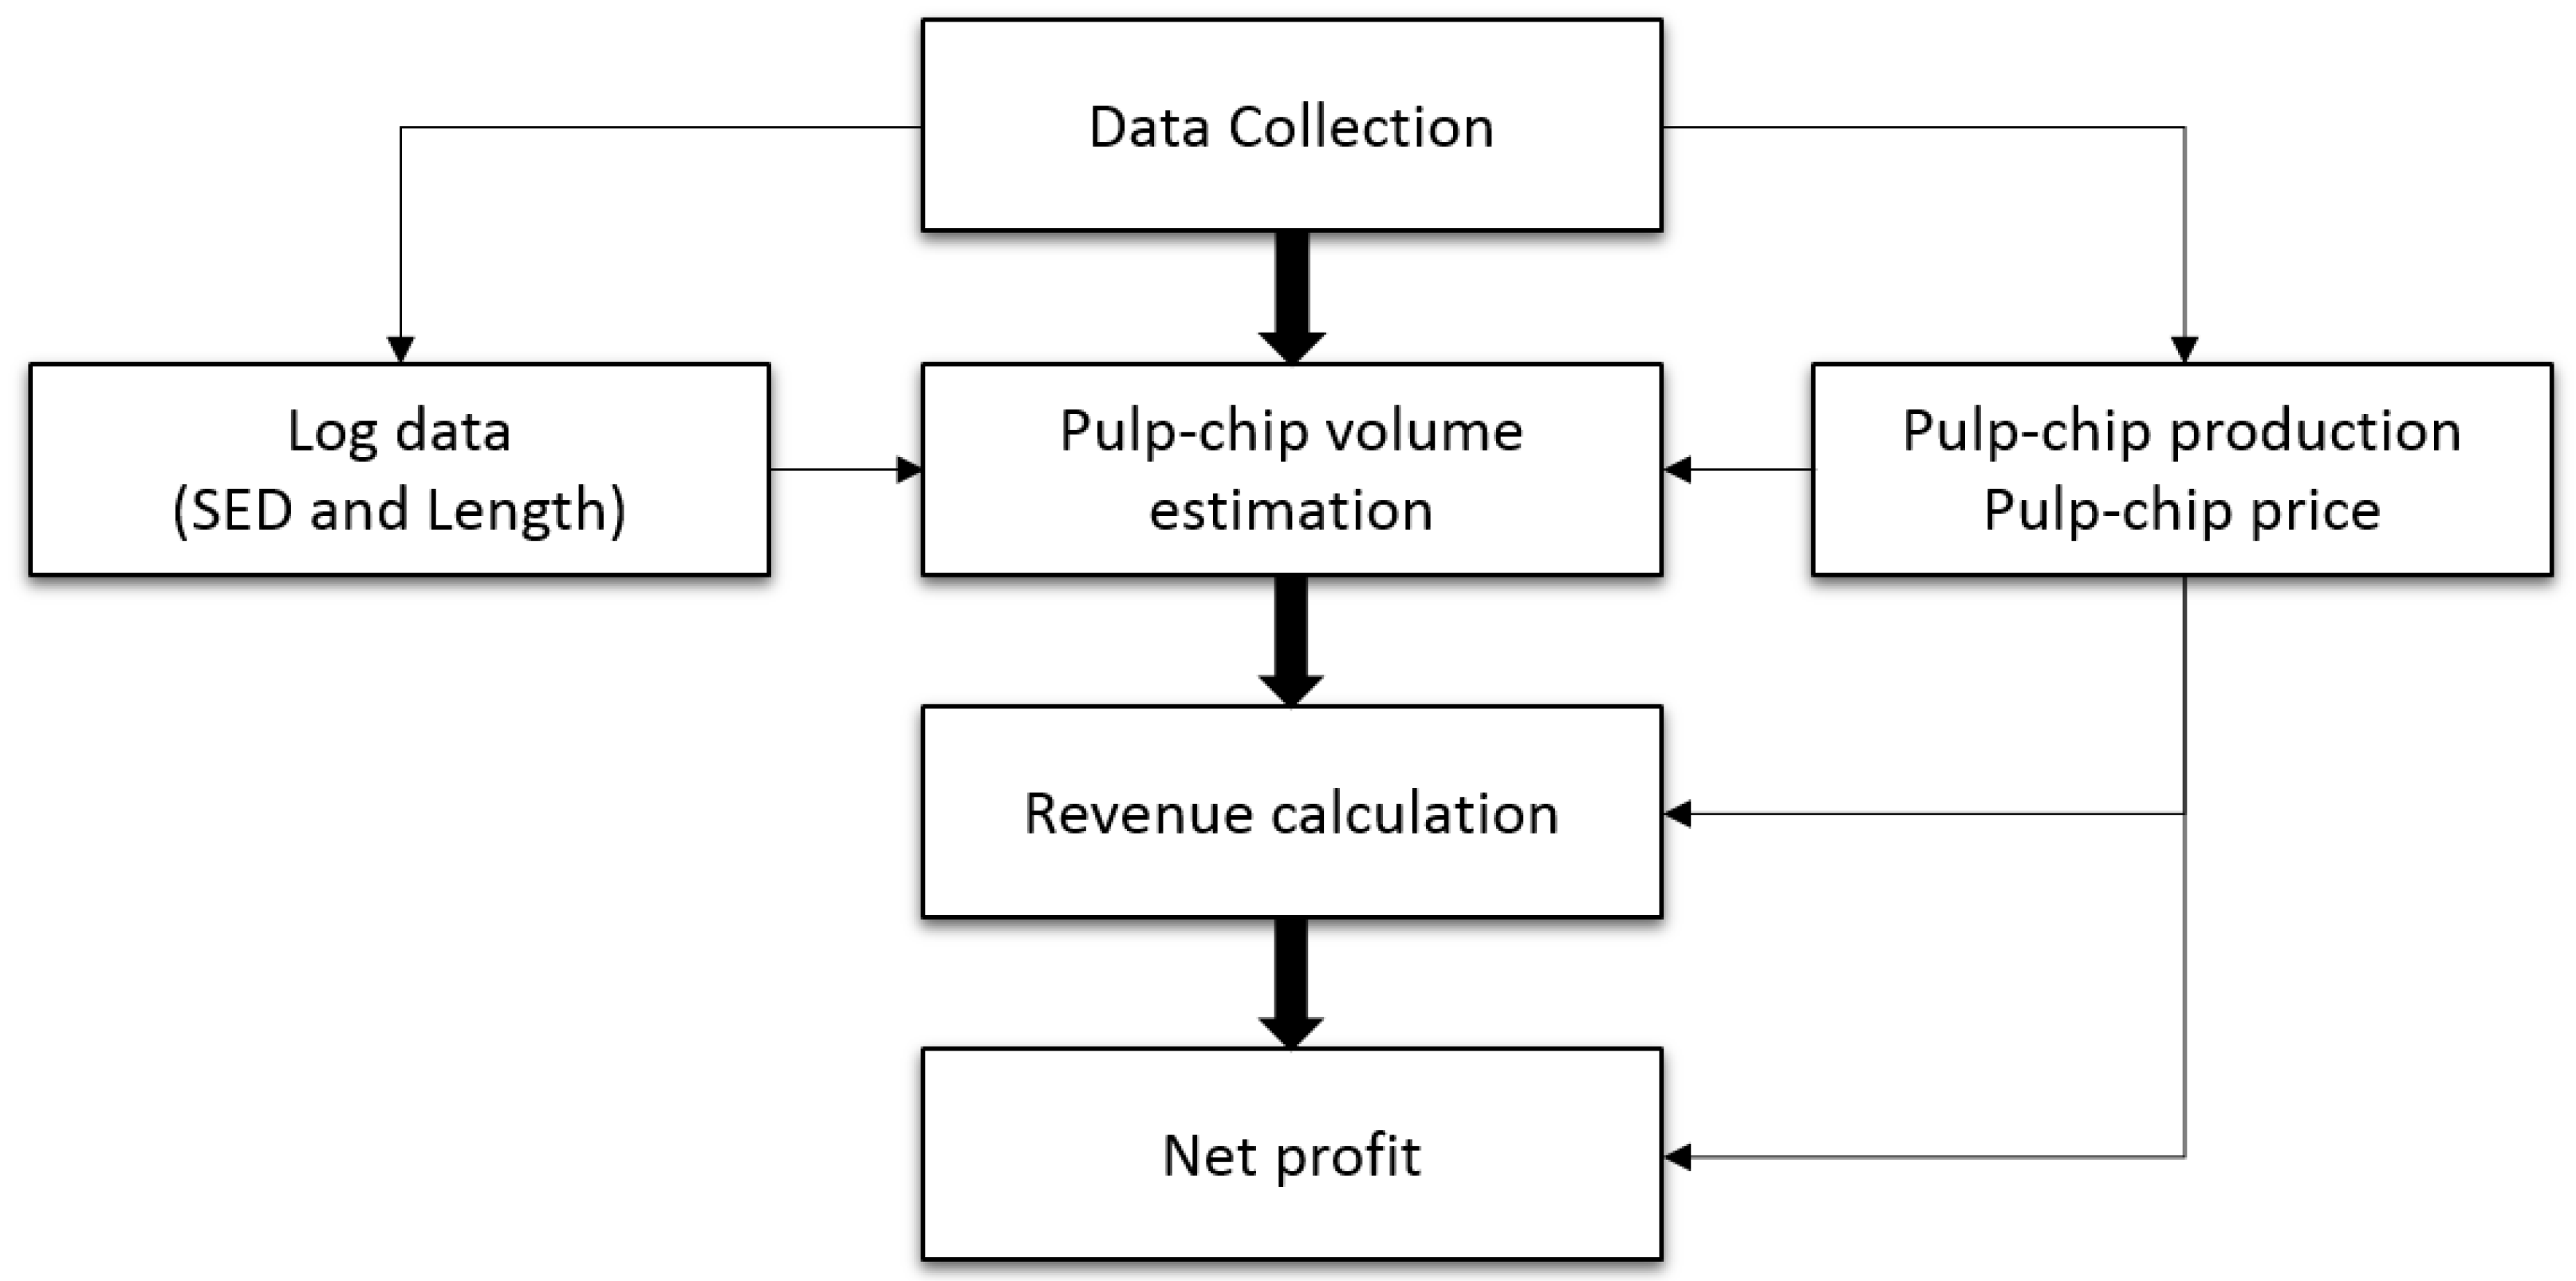
The process of analyzing the profitability of pulp chip production is depicted in Figure 5. The analysis involved gathering data on the price of pulp chips, manufacturing costs, and the types of logs used in their production. Using this information, the volume of pulp chips obtained from each log and the resulting net profit of the production process were calculated.
Pulp chips are typically traded in volume (m3) rather than weight (ton), as their moisture content may vary depending on weather conditions. The average market price of pulp chips was obtained from the three facilities, which was $61 per m3 for this study. To ensure comparability with the lumber production scenario, logs that were 1.8 m or shorter were used in the profitability analysis. The same diameter classes (6–40 cm) were applied for comparison purposes, and the volume of each log was estimated from the log volume table [34].
To calculate the volume of pulp chips produced from each log, the weight of the log was multiplied by the yield rate of 2.5 m3 per ton. The weight of the log was estimated using the green weight equation, which takes into account the moisture content, dry weight, and log volume. The moisture content and dry weight of Pinus densiflora (1.15 and 0.44, respectively) were obtained from Wood Science [35], and the log volume was estimated using the log scaling table [34].
The revenue generated from pulp chip production was then calculated by multiplying the volume of pulp chips produced by the market price of pulp chips. Finally, the net profit was calculated by subtracting the total pulp chip production cost, which includes the log-buying price and chipping cost, from the revenue.

3. Results

3.1. Lumber Yield and Recovery Rate of Sawing 3.6 m and 2.7 m Logs

The study meticulously analyzed the optimal sawing patterns for 3.6 m and 2.7 m Pinus densiflora logs across various diameter classes (Table 3 and Table 4). In smaller diameter classes (less than 24 cm), the sawing patterns predominantly produced smaller lumber types, such as types 1, 2, and 3. As the diameter class increased, these patterns began to incorporate larger and more diverse lumber products, such as type 5, 8, and 9 for 3.6 m logs and board-type lumber products (types 4–7) for 2.7 m logs. These findings indicate a significant shift in product type with log size, which directly impacts value recovery and overall lumber yield.
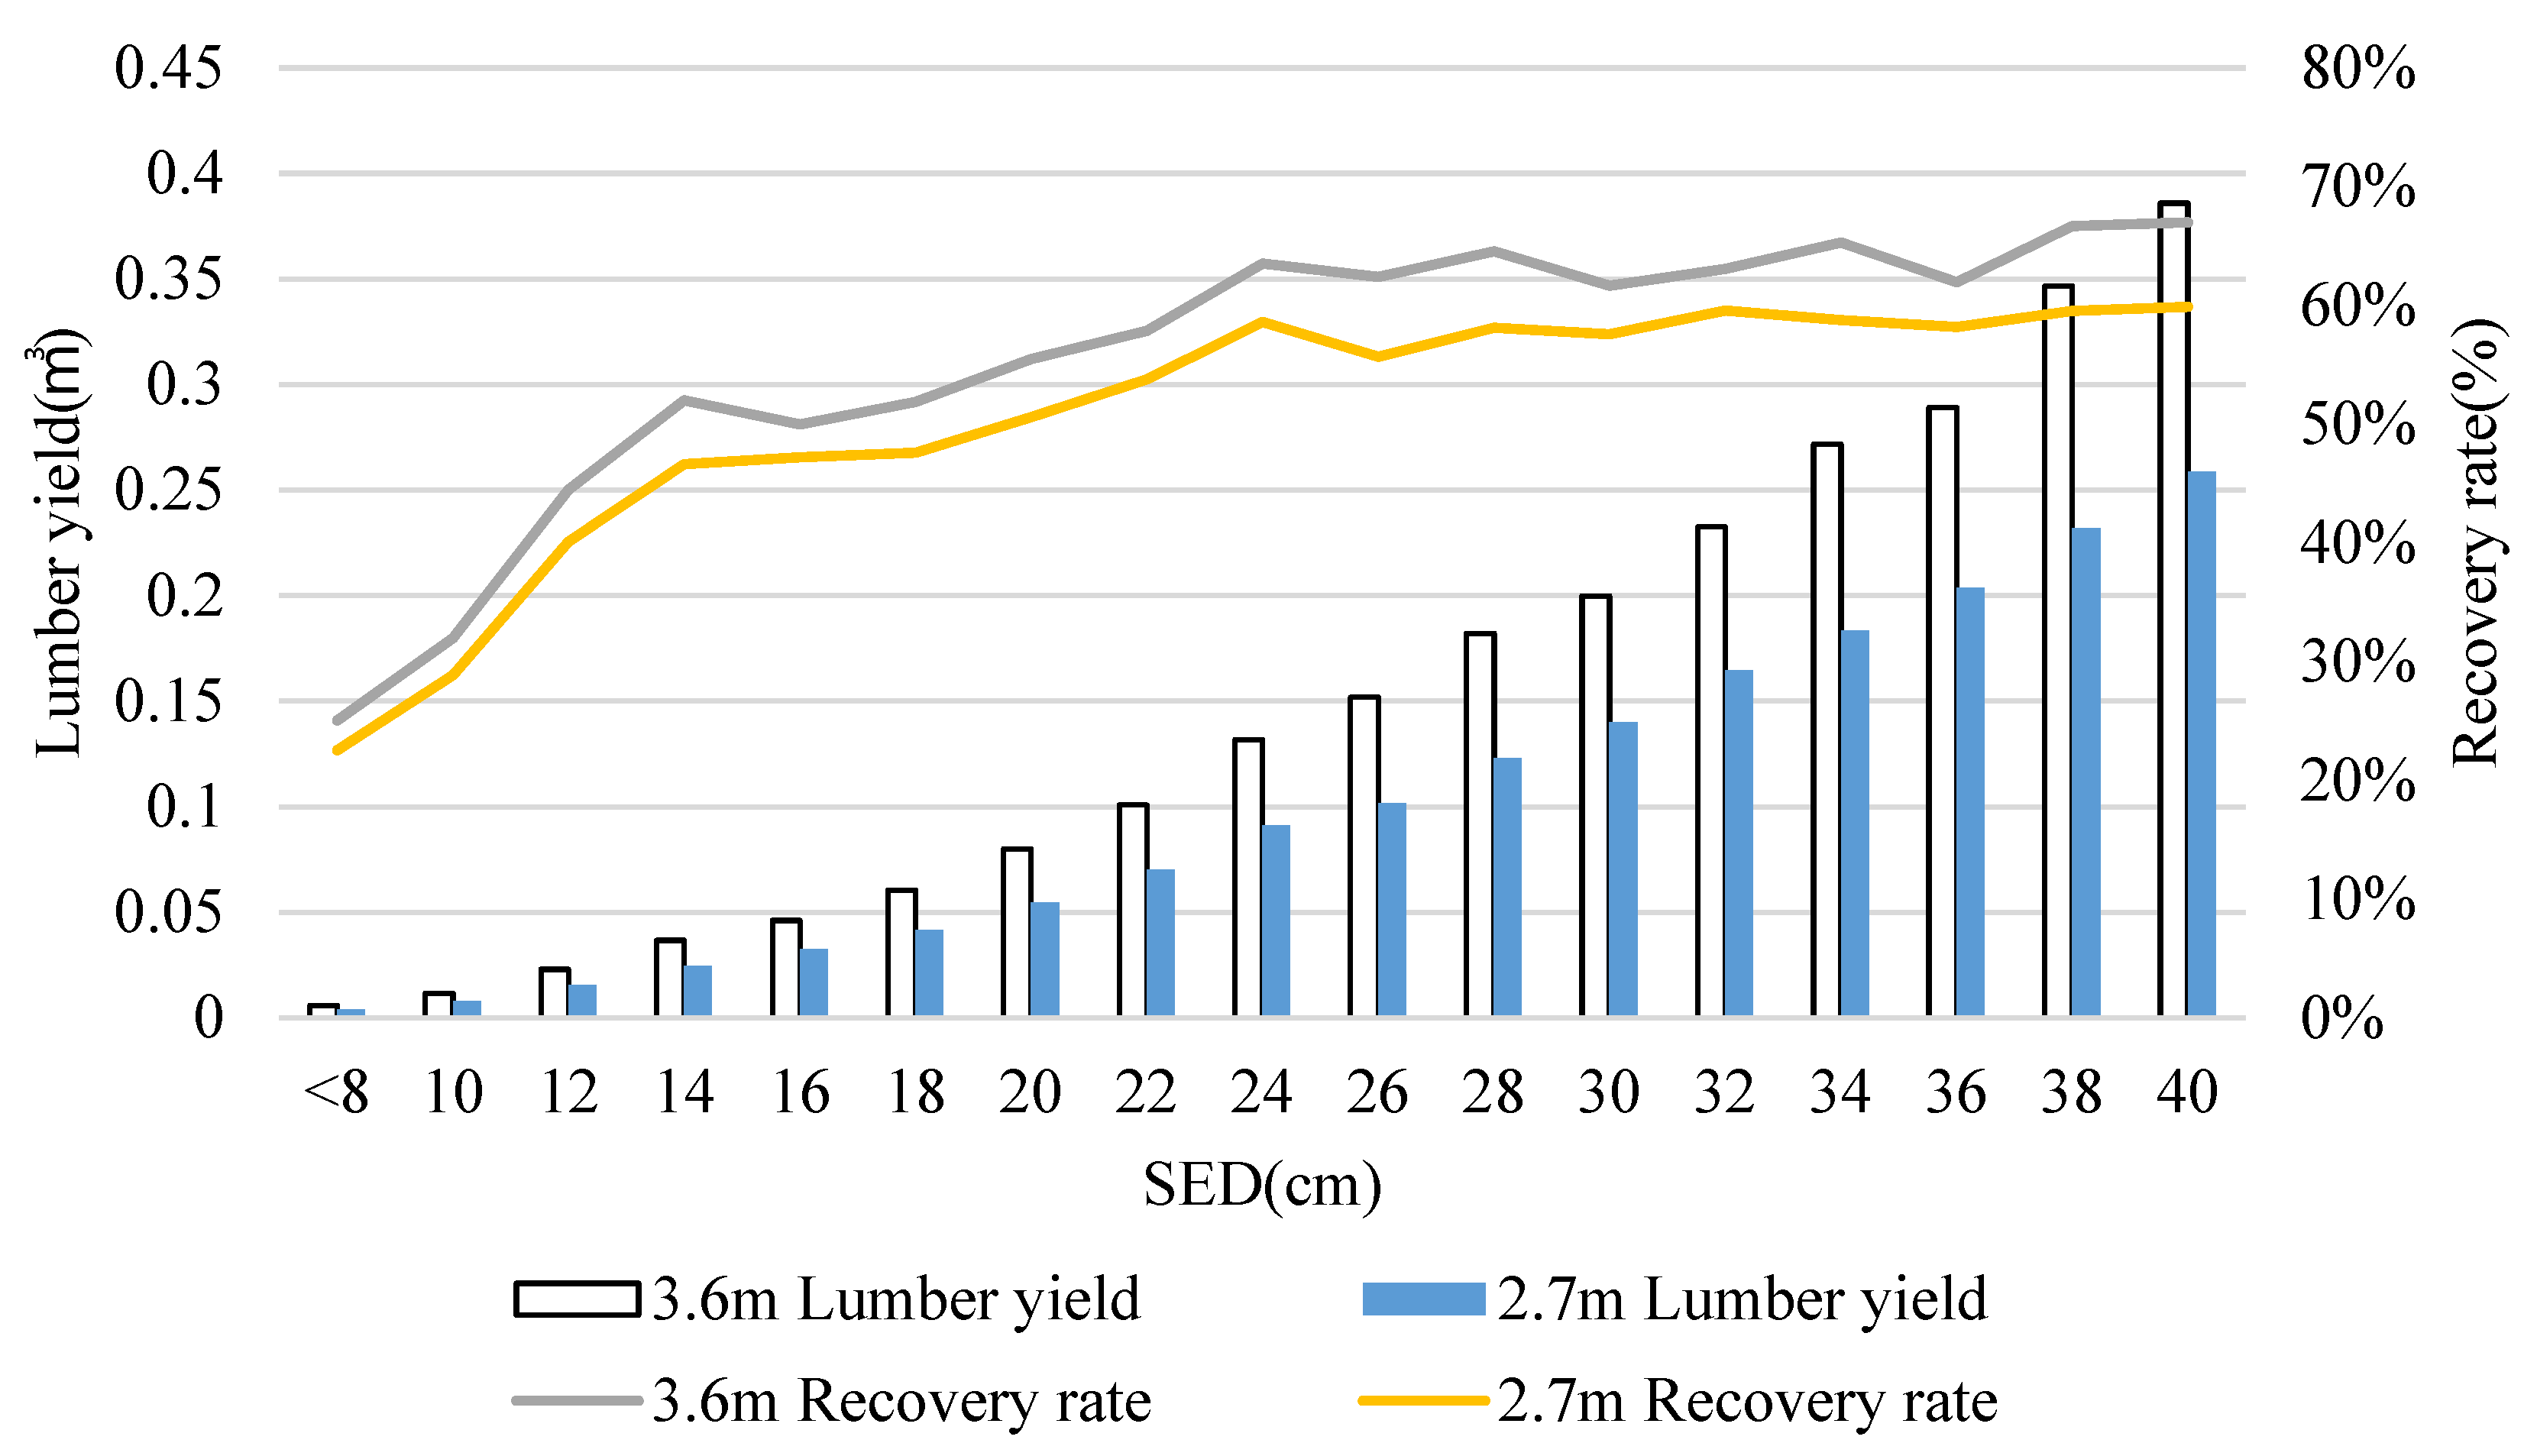
The average recovery rate for 3.6 m logs was 55%, peaking at 67% for logs with a diameter of 40 cm. For 2.7 m logs, the average rate was 50%, with a similar peak at 60% for the same diameter (Figure 6). The study highlights the dimensional limitations of smaller logs, which restrict sawing patterns to smaller lumber products, resulting in lower recovery rates. In contrast, larger logs provide more options for lumber products, leading to higher recovery rates.
The volume yield from both sawing cases gradually increased as the diameter class increased, with the volume of 3.6 m lumber products increasing from 0.006 m3 at a diameter of 6 cm to 0.386 m3 at 40 cm, and the volume of 2.7 m lumber products increasing from 0.004 m3 to 0.259 m3. The difference in volume yield between the two cases was 32% on average, with the volume of 3.6 m lumber products being higher in every diameter class.

3.2. Pulp Chip Yield from Chipping 1.8 m Logs

The results of pulp chip production using 1.8 m logs are presented in Table 5. The table indicates a gradual increase in the volume of pulp chip production, ranging from 0.015 m3 to 0.681 m3 as the diameter class increased. It is important to note that the production was estimated based on the assumption that 1 ton of logs would yield 2.5 m3 of pulp chip, resulting in a consistent recovery rate of 237% across all diameter classes.

3.3. Net Profit Comparison between Lumber Production and Pulp Chip Production

Table 6 presents the results of net profit estimation for lumber production using pine logs with lengths of 3.6 m and 2.7 m, as well as for pulp chip production using logs with a length of 1.8 m. The data shows that the net profits generated by lumber production were consistently higher than those from pulp chip production across all diameter classes. The average net profit from sawing 3.6 m logs was 832%, and sawing 2.7 m logs was 679% higher than chipping 1.8 m logs. The difference between lumber production and pulp chip production increased as the diameter class increased, with net profits from lumber production being over nine times higher than pulp chip production from a diameter of 28 cm (Figure 7).

4. Discussion

The findings from this study offer substantial insights for forestry and timber production, particularly in the Korean context. The higher recovery rates for longer logs, notably the 3.6 m logs, challenge conventional timber industry practices, suggesting that a shift towards producing longer logs could enhance resource efficiency and profitability. This is further substantiated by the observation that 3.6 m logs, despite primarily including smaller lumber products, resulted in higher recovery rates due to their dimensional advantages. This contrasts with the expected variety and recovery rates from 2.7 m log sawing.
In Korea, board-type lumber products, characterized by their thin thickness and width at least three times wider than the thickness, command higher prices compared to square lumber products of the same thickness. This study’s simulation model, which incorporated these board-type lumber products in the log sawing patterns, achieved higher value recovery. This suggests that considering the unique dimensional characteristics of different lumber types, such as board-type products, can significantly influence recovery rates and overall profitability.
Comparisons with other studies, including Geerts [13] and Pinto et al. [36], as well as the insights from Väätäinen et al. [6] and Kogler et al. [7], provide a broader context and validation for these findings. The integrated supply chain management approach and the focus on coordinated cost-saving strategies, as discussed by Kogler et al., align with our study’s implications for optimizing timber production. The comprehensive review by Acuna et al. [9] on optimization techniques for forest biomass supply chains also echoes the need for a multifaceted approach to managing complex supply chains, emphasizing the importance of integrating various aspects, such as quality, market conditions, and economic factors.
However, the study is limited by its focus on a single tree species and specific log sizes, which may affect the generalizability of the findings to other species or market conditions. Factors such as lumber quality, log grade, and log profile, which could significantly influence recovery rates, were not considered in the simulation model. This limitation points to the need for more comprehensive research incorporating these variables.
Additionally, the analysis highlights the relatively low profitability of pulp chip production. Despite lower costs, the net profit from manufacturing pulp chips was significantly less than that from sawing longer logs for lumber products. This finding suggests that optimizing production methods, particularly in pulp chip production, could lead to improved financial outcomes.
Overall, the study underscores the need for a nuanced and strategic approach to timber production, considering factors like log size, product type, and market dynamics. It also highlights the potential benefits of incorporating by-products such as wood slabs and sawdust from log sawing into profitability calculations. The importance of further research to fully understand and capitalize on the potential of different timber production methods is evident, especially in enhancing the economic viability of the timber industry in Korea.

5. Conclusions

This study analyzed pine logs of three different lengths to assess their potential value as lumber or pulp-sticks. It considered its end-users to suggest a bucking pattern that maximizes the value of end products.
The result emphasizes the importance of strategic bucking patterns, especially for logs with large diameters at breast height (DBH) that can yield high-quality lumber. This study highlights the need to consider the end-uses and potential value of different types of logs, as these can significantly impact the value of each log and, by extension, the entire tree. Furthermore, the study advocates for a timber cruise during harvest planning to accurately appraise the stumpage value of forest stands. While this study offers valuable insights for timber management in Korea, its focus on single tree species and specific market conditions underscores the necessity for research to explore the applicability of these findings to other species and markets.
The approach of this study, emphasizing value recovery from lumber manufacturing in contrast to pulp chip production, contributes to a more informed and profitable forest management strategy, potentially influencing timber appraisal and bucking decisions in Korea. By adopting these findings, not only can timber sale profits increase and the overall value of forest stands in Korea be maximized, but it also holds the potential to maximize the value of forest resources in other countries.

Author Contributions

Conceptualization, Y.J. and H.H.; data curation, Y.J., J.Y. and D.K.; funding acquisition, H.H. and Y.C.; investigation, Y.J., H.H., J.Y. and D.K.; methodology, Y.J. and D.K.; project administration, H.H. and Y.C.; supervision, H.H.; validation:, Y.J. and H.H.; writing—original draft preparation, Y.J. and H.H.; writing—review and editing, H.H. and Y.C. All authors have read and agreed to the published version of the manuscript.

Funding

This research was funded by the National Institute of Forest Science of Republic of Korea (grant number FM0200-2023-01-2023 and FM0200-2022-02-2023).

Data Availability Statement

The data presented in this study are available on request from the corresponding author.

Acknowledgments

This study was carried out with the support of ‘R&D Program for Forest Science Technology (Project No. 2023474B10-2325-BB01)’ provided by Korea Forest Service (Korea Forestry Promotion Institute).

Conflicts of Interest

The authors declare no conflict of interest.

References

  1. Korea Forest Service. Statistical Yearbook of Forestry; Korea Forest Service: Daejeon, Republic of Korea, 2016.
  2. Seol, A.; Han, H.; Jung, Y.; Chung, H.; Chung, J. Analyzing the Comparative Economic Efficiency of Short-wood Woodgrab Logging and Whole-tree Cable Logging Operations. J. Korean Soc. For. Soc. Sci. 2016, 105, 231–237. [Google Scholar]
  3. Korea Forest Research Institute. Pine Tree, the Economical Tree Species; Korea Forest Research Institute: Seoul, Republic of Korea, 2011. [Google Scholar]
  4. Han, H.; Seol, A.; Jung, Y.; Chung, J. Maintaining long-rotation forestry: A new challenge for sustained yield of timber resources in South Korea. Int. For. Rev. 2018, 20, 199–205. [Google Scholar] [CrossRef]
  5. Scholz, J.; Meyer, A.D.; Marques, A.S.; Pinho, T.M.; Boaventura-Cunha, J.; Orshoven, J.V.; Rosset, C.; Kunzi, J.; Kaarle, J.; Nummila, K. Digital technologies for forest supply chain optimization: Existing solutions and future trends. Environ. Manag. 2018, 62, 1108–1133. [Google Scholar] [CrossRef] [PubMed]
  6. Vaatainen, K.; Anttila, P.; Eliasson, L.; Enstrom, J.; Laitila, J.; Prinz, R.; Rouata, J. Roundwood and biomass logistics in Finland and Sweden. Croat. J. For. Eng. 2021, 42, 24. [Google Scholar] [CrossRef]
  7. Kogler, C.; Schimpfhuber, S.; Eichberger, C.; Rauch, P. Benchmarking procurement cost saving strategies for wood supply chains. Forests 2021, 12, 1086. [Google Scholar] [CrossRef]
  8. Kogler, C.; Rauch, P. Lead time and quality driven transport strategies for the wood supply chain. Res. Transp. Bus. Manag. 2023, 47, 100946. [Google Scholar] [CrossRef]
  9. Acuna, M.; Sessions, J.; Zamora, R.; Boston, K.; Brown, M.; Ghaffariyan, M.R. Methods to manage and optimize forest biomass supply chains: A review. Curr. For. Rep. 2019, 5, 124–141. [Google Scholar] [CrossRef]
  10. Peter, R.K.; Bamping, J.H. Theoretical sawing of pine logs. For. Prod. J. 1962, 12, 549–557. [Google Scholar]
  11. Hallock, H. Mathematical Analysis of the Effect of Kerf Width on Lumber Yield from Small Logs; USDA, Forest Service, Forest Products Laboratory: Madison, WI, USA, 1962.
  12. Taylor, F.W.; Garton, M.W. The Systematic Evaluation of a Pine Sawmilling Operation. Master’s Thesis, The Mississippi State University, Lee Blvd, MS, USA, 1970. [Google Scholar]
  13. McAdoo, J. Computer simulation of small-log mill processing. For. Prod. J. 1969, 19, 34–35. [Google Scholar]
  14. Hallock, H.; Lewis, D.W. Increasing Softwood Dimension Yield from Small Logs-Best Opening Face; USDA, Forest Service, Forest Products Laboratory: Madison, WI, USA, 1971.
  15. Bellman, R. The Theory of Dynamic Programming. Bull. Am. Math. Soc. 1954, 60, 503–515. [Google Scholar] [CrossRef]
  16. Briggs, D.G. A Dynamic Programming Approach to Optimizing Stem Conversion. Ph.D. Thesis, The University of Washington, Washington, DC, USA, 1980. [Google Scholar]
  17. Rönnqvist, M. Optimization in forestry. Math. Program. 2003, 97, 267–284. [Google Scholar] [CrossRef]
  18. Geerts, J.M.P. Mathematical solution for optimizing the sawing pattern of a log given its dimensions and its defect core. N. Z. J. For. Sci. 1984, 14, 124–134. [Google Scholar]
  19. Todoroki, C.L.; Ronnqvist, E.M. Secondary log breakdown optimization with dynamic programming. J. Oper. Res. Soc. 1997, 48, 471–478. [Google Scholar] [CrossRef]
  20. Faaland, B.; Briggs, D. Log Bucking and Lumber Manufacturing Using Dynamic Programming. Manag. Sci. 1984, 30, 245–257. [Google Scholar] [CrossRef]
  21. Reinders, M.P.; Hendriks, T.H.B. Lumber production optimization. Eur. J. Oper. Res. 1989, 42, 243–253. [Google Scholar] [CrossRef]
  22. Puumalainen, J. Optimal cross-cutting and sensitivity analysis for various log dimension constraints by using dynamic programming approach. Scand. J. Forest. Res. 1998, 13, 74–82. [Google Scholar] [CrossRef]
  23. Kwon, S.D. Development of a Simulation Model for Stand-Level Forest Management. Ph.D. Thesis, The Seoul National University, Seoul, Republic of Korea, 2003. [Google Scholar]
  24. Kwon, S.D.; Kim, H.H.; Chung, J.S. Estimation of Merchantable Volume and Yield Using A Stem Shape Simulation. J. Korean Soc. For. Soc. Sci. 2007, 96, 362–368. [Google Scholar]
  25. Kwon, K.B.; Han, H.; Seol, A.R.; Chung, H.J.; Chung, J.S. Development of a Wood Recovery Estimation Model for the Tree Conversion Processes of Larix kaempferi. J. Korean Soc. For. Soc. Sci. 2013, 102, 484–490. [Google Scholar] [CrossRef]
  26. Lee, C.T.; Chung, D.J.; Lee, Y.D.; Jo, J.M. A Study on Utilization of the Sawed Products from Black Locust; Korea Forest Research Institute: Seoul, Republic of Korea, 1985. [Google Scholar]
  27. Lee, C.T.; Chung, D.J.; Park, J.H. A Study on Utilization of Furniture Parts from Alnus; Korea Forest Research Institute: Seoul, Republic of Korea, 1986. [Google Scholar]
  28. Lee, C.T.; Kwon, J.T.; Han, G.J. A Demonstration Test of the Domestic Timber Using Movable Sawing Machine; Korea Forest Research Institute: Seoul, Republic of Korea, 1989. [Google Scholar]
  29. Bobrowski, P.M. The Effect of Modeling on Log Bucking Solution Techniques. J. Oper. Res. Soc. 1994, 45, 624–634. [Google Scholar] [CrossRef]
  30. Korea Forest Service. Report on the State of Forest Products Utilization; Korea Forest Service: Daejeon, Republic of Korea, 2015.
  31. Bellman, R. Dynamic-Programming and the Numerical-Solution of Variational-Problems. Oper. Res. 1957, 5, 277–288. [Google Scholar]
  32. Korpunen, H.; Mochan, S.; Uusitalo, J. An activity-based costing method for sawmilling. For. Prod. J. 2010, 60, 420–431. [Google Scholar] [CrossRef]
  33. Korea Forestry Promotion Institute. The Quarterly Market Prices of Domestic Timber; Korea Forestry Promotion Institute: Seoul, Republic of Korea, 2022. [Google Scholar]
  34. Korea Forest Research Institute. Tree, Log and Biomass Volume and Yield Table; Korea Forest Research Institute: Seoul, Republic of Korea, 2011. [Google Scholar]
  35. Jung, H.S. Wood Science; Seoul National University Press: Seoul, Republic of Korea, 1998. [Google Scholar]
  36. Pinto, I.; Usenius, A.; Song, T.C.; Pereira, H. Sawing simulation of maritime pine (Pinus pinaster Ait.) stems for production of heartwood-containing components. For. Prod. J. 2005, 55, 88–96. [Google Scholar]
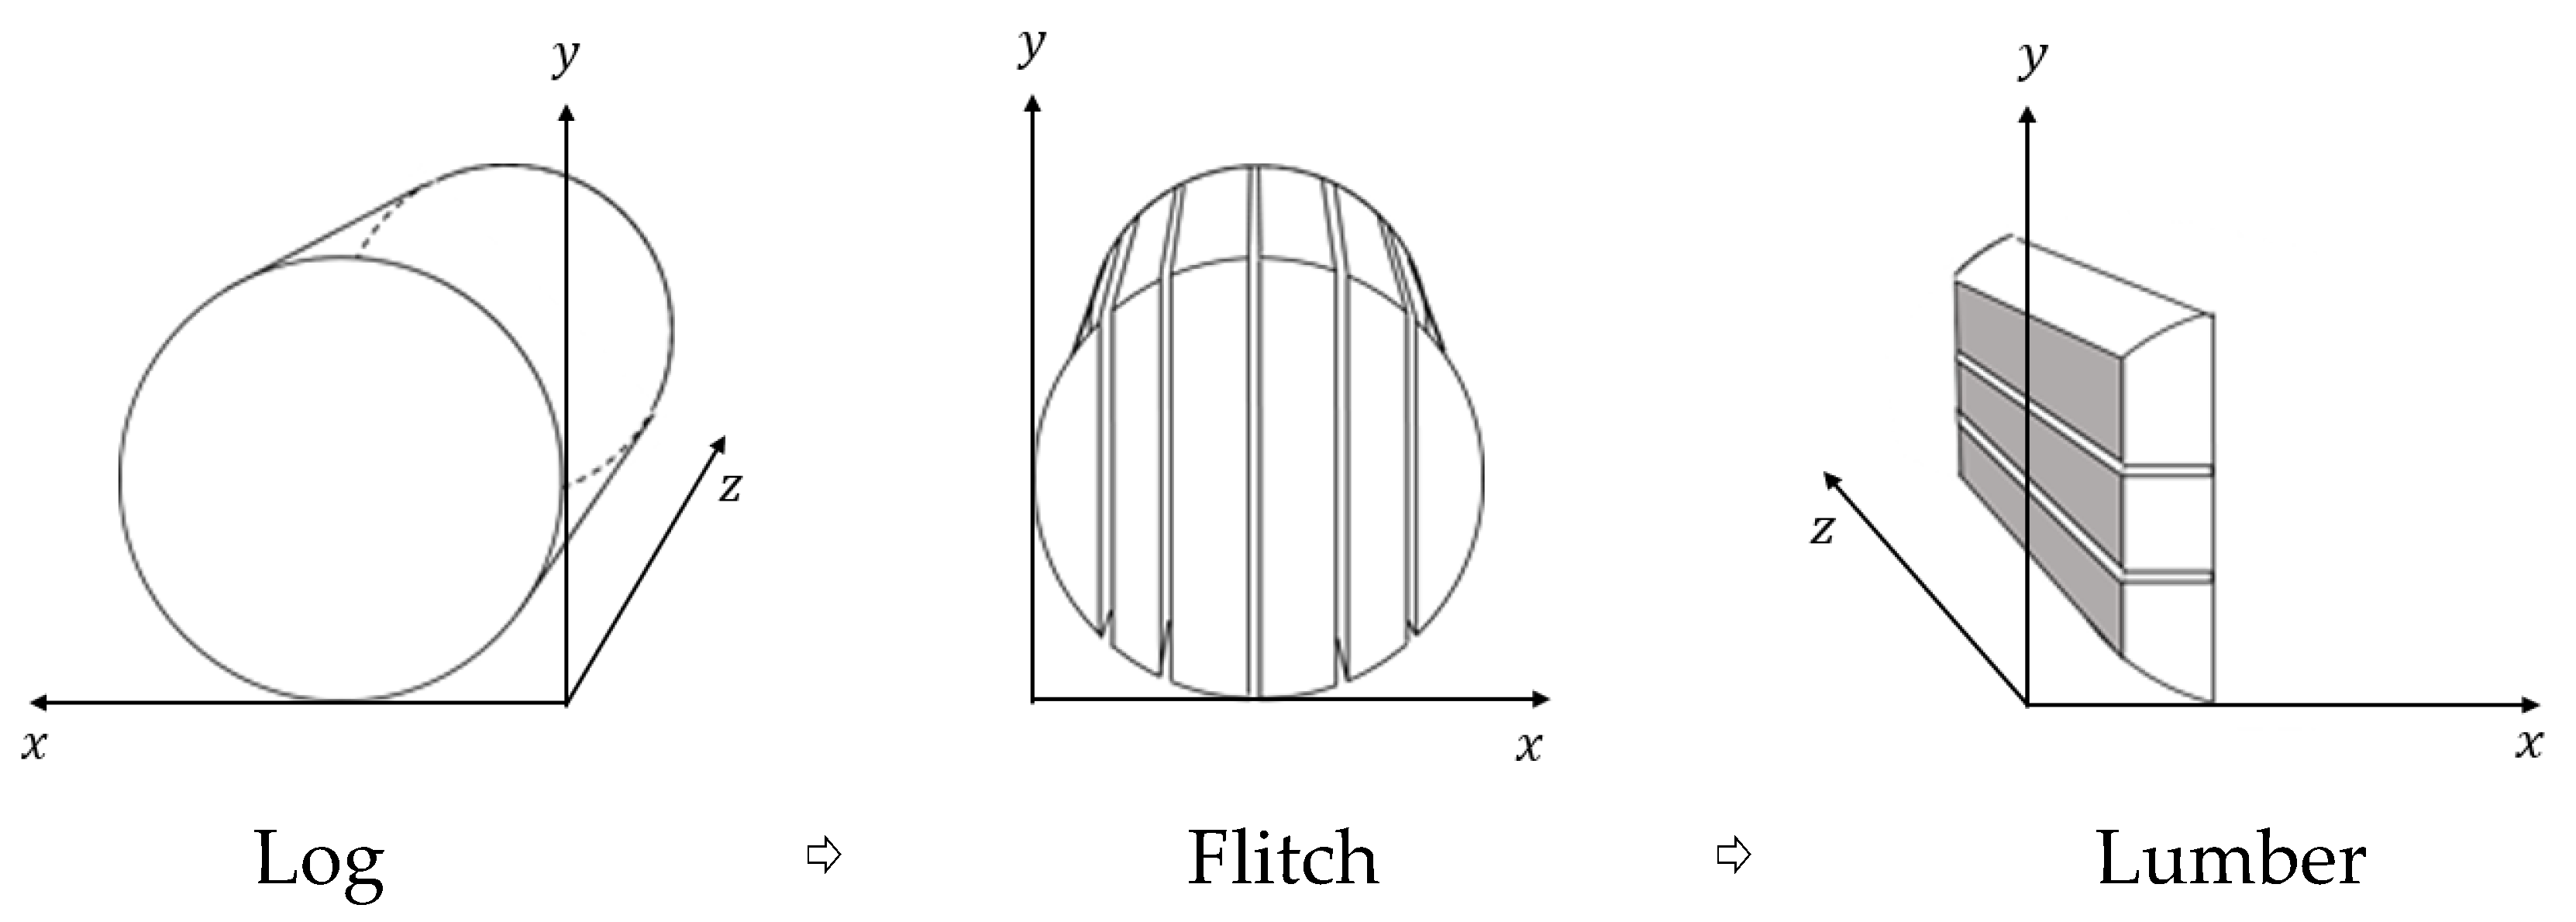
Figure 1. A two-step process for Log breakdown is commonly applied in sawmills in Korea. The x-axis and y-axis represent the width and height of the log’s circular cross-section, respectively, while the z-axis represents the log’s length.
Forests 14 02450 g001
Figure 2. Diagram of possible decisions on width when x = a .
Forests 14 02450 g002
Figure 3. Diagram of possible decisions on height when y = a .
Forests 14 02450 g003
Figure 4. The process of analyzing the profitability of sawing pine (Pinus densiflora) logs.
Forests 14 02450 g004
Figure 5. The process of analyzing the profitability of pulp chip production with the pine (Pinus densiflora) logs.
Forests 14 02450 g005
Figure 6. Volume yield and recovery rate of 3.6 m and 2.7 m lumber production.
Forests 14 02450 g006
Figure 7. Net profit was generated from the two lumber production cases, and net profit was generated from the pulp chip production.
Forests 14 02450 g007
Table 1. Dimensions and prices of lumber products in Korea as of 2022.
TypeLumber Products (3.6 m Type)Lumber Products (2.7 m Type)
Dimensions (mm)Price ($)Dimensions (mm)Price ($)
127 × 89827 × 896.1
238 × 385.238 × 384
338 × 8912.438 × 899.3
438 × 14017.838 × 14013.3
589 × 8927.938 × 18419.5
6140 × 1406438 × 23529.3
7180 × 18010838 × 28536
8200 × 200145.690 × 9020.1
9250 × 250234.990 × 14033.5
10--140 × 14048
11--180 × 18081
12--200 × 200109.3
13--250 × 250176.1
Table 2. Market prices of the pine (Pinus densiflora) logs by grade [33].
Supreme1st2nd3rdBoltPulp
SED * (cm)>42>27>21>18>12>6
Length (m)>2.1>3.6>3.6>2.1>2.4>1.8
Price ($/ m 3 )392.5215.2183.4166.916258.4
* SED: Small end diameter.
Table 3. The number of lumber products produced from 3.6 m pine (Pinus densiflora) logs by product types and small end diameter.
No.DimensionsSED * (cm)
6810121416182022242628303234363840
127 × 89----2--2-22212221-
238 × 3811243-664658-5521013
338 × 89-----22266892-1512015
438 × 140-----1------12-11-
589 × 89--------------1--4
6140 × 140------------------
7180 × 180------------------
8200 × 200------------11----
9250 × 250---------------1--
* SED: Small end diameter.
Table 4. The number of lumber products produced from 2.7 m pine (Pinus densiflora) logs by product types and small end diameter.
No.DimensionsSED * (cm)
6810121416182022242628303234363840
127 × 89----2--2-212---132
238 × 3811243-66116-----117
338 × 89-----222361---21--
438 × 140-----1------12--1-
538 × 184----------221--1 1
638 × 235----------23222221
738 × 285------------234456
890 × 90------------------
990 × 140------------------
10140 × 140------------------
11180 × 180------------------
12200 × 200------------------
13250 × 250------------------
* SED: Small end diameter.
Table 5. Pulp chip yield from a given log (1.8 m) weight.
SED *
(cm)
Green Weight of a Log
(ton)
Pulp Chip Yield
( m 3 )
60.0060.015
80.0110.027
100.0170.043
120.0250.061
140.0330.083
160.0440.109
180.0550.138
200.0680.170
220.0820.206
240.0980.245
260.1150.288
280.1330.334
300.1530.383
320.1740.436
340.1970.492
360.2210.552
380.2460.615
400.2720.681
* SED: Small end diameter.
Table 6. Net profit comparison between lumber and pulp chip production with pine (Pinus densiflora) logs.
SED *
(cm)
Net Profit ($)
LumberPulp Chip
3.6 m Log2.7 m Log1.8 m Log
<81.80 (120%) **1.43 (76%)0.82
104.92 (285%)3.88 (203%)1.28
1212.51 (581%)9.75 (431%)1.84
1420.24 (708%)15.65 (525%)2.50
1627.75 (748%)20.95 (540%)3.27
1836.62 (785%)28.09 (579%)4.14
2047.97 (839%)36.80 (620%)5.11
2261.24 (891%)46.22 (648%)6.18
2480.62 (996%)61.42 (735%)7.36
2693.30 (981%)77.70 (800%)8.63
28113.23 (1031%)97.89 (878%)10.01
30132.63 (1054%)116.21 (911%)11.49
32148.37 (1035%)139.28 (965%)13.08
34170.98 (1058%)160.37 (986%)14.76
36197.18 (1091%)173.32 (947%)16.55
38219.05 (1088%)198.03 (974%)18.44
40246.70 (1107%)220.08 (977%)20.43
* SED: Small end diameter. ** ( ) indicates an increase in net profit from sawing 3.6 m and 2.7 m logs, respectively.
Disclaimer/Publisher’s Note: The statements, opinions and data contained in all publications are solely those of the individual author(s) and contributor(s) and not of MDPI and/or the editor(s). MDPI and/or the editor(s) disclaim responsibility for any injury to people or property resulting from any ideas, methods, instructions or products referred to in the content.