Article

Impact of Temperature and Moisture on the Decomposition of Peat-Forming Plants: Results of a Two-Year Incubation Experiment

by
Liliya Nikonova
1,*,
Irina Kurganova
2,3,
Valentin Lopes de Gerenyu
2,3,
Olga Rogova
4 and
Evgeniya Golovatskaya
1
1
Institute of Monitoring of Climatic and Ecological Systems, Siberian Branch of the Russian Academy of Sciences, 634055 Tomsk, Russia
2
Institute of Physicochemical and Biological Problems in Soil Science, Russian Academy of Sciences, 142290 Pushchino, Russia
3
Centre for Isotope Biogeochemistry, State University, 625003 Tyumen, Russia
4
V.V. Dokuchaev Soil Science Institute, 119017 Moscow, Russia
*
Author to whom correspondence should be addressed.
Forests 2023, 14(12), 2355; https://doi.org/10.3390/f14122355
Submission received: 23 October 2023 / Revised: 22 November 2023 / Accepted: 27 November 2023 / Published: 30 November 2023
(This article belongs to the Special Issue Greenhouse Gas Dynamics and Balance in Forest-Peatland Ecosystem)

Abstract

:
The decomposition rate of plant residues is determined by both abiotic (temperature, moisture) and biotic factors (biochemical composition). To separate the contribution of each factor to the decomposition process, long-term incubation experiments under controlled conditions are required. Two-year incubation experiments were conducted with various types of peat-forming plants (Sphagnum fuscum, Chamaedaphne calyculata, Eriophorum vaginatum, and a mixed sample consisting of 60% Sphagnum fuscum and 40% Chamaedaphne calyculata). The experiments were carried out at temperatures of 2, 12, and 22 °C, with varying moisture levels (W = 30, 60, and 90% of their water-holding capacity). In all plant samples, the highest rates of C(CO2) emission (DecR) were observed in the initial stages of decomposition. The cumulative carbon loss (Ccum) during the experiment ranged from 45 to 196 mgC/g of plant material at 22 °C and 23 to 156 mgC/g of plant material at 2 °C. The decay constant (k) for all plant samples increased with rising temperature. The results of the three-way ANOVA showed that the influence of the examined factors on the cumulative losses of C(CO2) decreased in the following order: the type of plant > temperature > moisture. Throughout the experiment, the influence of the type of plant and moisture on DecR increased, while the effect of temperature decreased. The highest temperature sensitivity (Q10 = 0.71–6.19) was observed in the low-temperature range (2–12 °C) during months 4 to 6 of incubation. These results are relevant for modeling and predicting the rate of transformation of peat organic matter under changing climatic conditions.

1. Introduction

Bog ecosystems play an important role in the global organic carbon (Corg) cycle due to the prevalence of productive processes (accumulation of organic matter in plant tissues and peat deposit formation) over destructive ones (decay of organic matter in plant residues). This leads to the accumulation of vast reserves of organic matter in bogs around the world. The largest carbon reserves, in the form of peat deposits, total approximately 22 billion tons and are located in Western Siberia [1]. The study of organic matter transformation processes in peatlands becomes increasingly important in light of current climate changes, which impact the hydrothermal regime of peat soils and the activity of microorganisms [2,3,4,5,6]. Changes in climatic conditions lead to disruptions and irregularities in the peat formation process due to a decrease in precipitation. This is particularly relevant for oligotrophic bogs, which primarily rely on atmospheric precipitation for nutrient input [7,8,9].
According to several studies conducted in natural conditions [3,10,11], the decomposition processes of peat-forming plant residues are most intense in the initial stages of degradation. The most significant influence of moisture and substrate temperature on the decomposition rate is observed during this phase [12,13]. Elevated temperatures generally stimulate microbial activity, thereby accelerating the decomposition process [9,14,15,16,17,18]. The optimal temperature for plant residue decomposition is approximately 28 °C; the lower temperatures typically reduce the activity of microbial processes and their minimal rate was observed near 0 °C [19,20]. In contrast to temperature, a decrease in the moisture content in the upper layers of the peat deposit, caused by a drop in the water table level, accelerates the peat decomposition process. Sometimes, high water tables suppress the activity of aerobic microflora and significantly reduce the influence of temperature [3,21]. The coupled effect of temperature and moisture is not always easy to assess under field conditions, so long-term model experiments are preferable. For example, during a 1-year experiment on plant debris decomposition using the litter bag approach in drier hummocks and wet hollows, vegetation type was found to play a more significant role than the effect of moisture [22]. It was also found that the moisture of plant residues significantly alters the temperature dependence of their decomposition rate, making it difficult to identify these relationships when processing data from field studies [23]. Therefore, the effect of moisture on organic matter transformation processes remains less understood than the effect of temperature.
The rate of decomposition of plant residues in a peat deposit is mainly determined by the individual characteristics of peat-forming plants, particularly their biochemical composition [3,4,8,22,24,25]. The residues of peat-forming plants can be divided into two groups based on their resistance to decomposition: (1) the rapidly decomposing fraction, which is not fixed in the botanical composition of the organic layer of peat soils (including leaves of Chamaedaphne calyculata, Menyanthes trifoliata, and other grasses), and (2) the stable fraction, which is permanently fixed in the botanical composition of peat (encompassing all fractions of most shrubs, roots of grasses like Carex (sedges), Scheuchzeria (Scheuchzeria), Eriophorum (cotton grass), and all sphagnum mosses) [9,22,25,26,27]. Of particular interest is the non-additive effect that arises when the residues of different plant species is mixed [28,29].
Under natural conditions, the aforementioned factors, such as temperature, moisture, and plant species, exert a combined influence on the decomposition rate of plant residues. Identifying the specific contribution of each factor to the processes of organic matter transformation is possible only through model experiments conducted under controlled conditions of moisture and temperature. Since the processes of decomposition of plant materials in the bogs of Western Siberia are slowed down, the long-term incubation experiments on their decomposition are necessary. In a 600-day incubation experiment, we planned to separate the impact of main abiotic and biotic factors and their emergent properties on the plant residue decomposition process under carefully controlled humidity and temperature regimes. Therefore, the novelty of our study considers two points—the high duration and multifactorial of experiment on peat-forming plants’ decomposition and as well as the determination of their decay constant and temperature coefficients Q10 during the various stages of decomposition at different combinations of temperature-moisture conditions.
The primary objective of our laboratory study was to quantify the impact of abiotic factors, namely temperature and moisture, on the decomposition rate of the principal peat-forming plants found in the oligotrophic bogs of the southern taiga subzone in Western Siberia. Within the framework of our long-term incubation experiment, we pursued the following specific goals: (i) to document the dynamics of decomposition rate (DecR) for the primary peat-forming plants across different temperature and moisture combinations over the 600-day incubation period; (ii) to assess the relative contributions of all examined factors to DecR during various stages of our experiment; (iii) to evaluate the decay constants and temperature sensitivity of DecR for the primary peat-forming plants at different temperature and moisture combinations during different stages of the experiment.
We hypothesize that the most important factors affecting the decomposition rate of the examined peat-forming plants throughout all stages of the experiments are temperature and type of plant residues. However, their respective contributions to the dynamic of DecR can vary as the incubation progresses. The temperature sensitivity of DecR is expected to change over the course of the experiment due to changes in the biochemical composition of plant residues and the development of their resistance to microbial degradation. When the litter from different plant species is mixed, the decomposition rate of plant residues may increase due to the non-additive effect.

2. Materials and Methods

2.1. Study Region and Characteristics of Plant Samples

Plant samples were collected at the field station “Vasyuganye” (Institute of Monitoring of Climatic and Ecological Systems, Siberian Branch of the Russian Academy of Sciences) within the oligotrophic bog “Bakcharskoe” (Bakchar district, Tomsk Oblast, 56°58′ N, 82°36′ E) in September 2017. The study area is located in the southern taiga subzone of Western Siberia and is characterized by a continental climate. The mean annual temperature is 0.50 °C, with an annual precipitation of 497 mm for the years 1991–2020. The average air temperatures for January and July are −18.8 °C and 18.2 °C, respectively.
For our experiment, we collected litter from three dominant plant species in the pine-shrub-sphagnum oligotrophic bog: Chamaedaphne calyculata Moench. (Ericaceae Juss), Eriophorum vaginatum L. (Cyperaceae Juss), and Sphagnum fuscum Klinggr. (Sphagnaceae Martynov). In addition, we prepared a mixed sample consisting of 60% Sphagnum fuscum and 40% Chamaedaphne calyculata, reflecting the proportional representation of each species in the plant litter of the pine-scrub-sphagnum phytocenosis. In the laboratory, the plant samples were air-dried at room temperature.
The following properties of plant samples were determined before incubation: ash content [30], pH values in both water and salt (1M KCl) extracts (using a litter-to-solution ratio of 1:25) [31], the content of hygroscopic moisture, and water-holding capacity (WHC), which corresponds to the moisture level of a completely saturated plant sample after gravity moisture has drained [32,33].
The carbon (C) and nitrogen (N) contents of the plant samples were analyzed using an automatic CHNS analyzer (LECO Corporation, St. Joseph, MI, USA). The content of ethanol-soluble compounds (Eth-Ext), including aromatic and aliphatic carbohydrates, terpenes, carbolic acids, resins, fatty acids, essential oils, fats, and phytosterols, as well as cellulose (Cel), lignin, and lignin-like substances (Lig), were determined in plant samples before and after the experiment using a gravimetric method (J. Klasson, K. Kurschner) [34,35].
The biochemical composition of plant samples was assessed in the Analytical Laboratory of the Forest Institute (Karelian Research Center of the Russian Academy of Sciences, Petrozavodsk) [36]. Lignin and biogenetically related ligands and flavonoids were determined after removing bituminous substances and treating the samples with 72% sulfuric acid, with evaluation conducted by gravimetric method (J. Klasson, K. Kurschner) [34,35]. Cellulose was extracted using a mixture of concentrated nitric acid and ethanol in a volume ratio of 1:4. Biochemical analyses, determination of ash content, and pH values were not replicated. The obtained values are comparable with those acquired previously for similar plant samples [4,37,38].

2.2. Experimental Design and Measurement of the Peat-Forming Plant Decay Rates

Air-dried plant samples (1–3 g) were placed into 110 mL glass flasks and moistened until they reached moisture levels equivalent to 30, 60, and 90% of their WHC. In total, 108 flasks were prepared for the experiment (Figure 1). The moistening process utilized bog water with native microflora collected from the vicinity where the studied plants were naturally grown. These flasks, containing the plant samples, underwent a pre-incubation phase for 7 days at room temperature [39,40], following which they were transferred to thermostats with various temperatures (2, 12, and 22 °C) and incubated for 600 days (or roughly 20 months). To maintain a consistent moisture level in the plant samples, a certain quantity of bog water was added to each flask every 2–3 weeks based on their initial weight. The experiment was carried out in triplicate.
The decomposition rates of peat-forming plants were assessed through C-CO2 emission rates, which were measured 2–5 times per week during the first month of the incubation experiment, 2 times per week in the second month, and weekly throughout the subsequent 18 months. Between measurements, the flasks containing the plant samples were covered with polyethylene air-permeable, moisture-impermeable films and stored in thermostats. Roughly 2–3 h before each DecR measurement, the flasks were hermetically sealed with rubber plugs (Figure 1) to accumulate C-CO2. Subsequently, samples of the gas phase were extracted from the flasks using a syringe, and the increases in CO2 concentrations within each flask were measured using an infrared gas analyzer (LiCor 820, Li-COR Biosciences, Lincoln, NE, USA).
DecR (µg C/g of plant substrate/hour) was calculated using the following equation [41,42]:
D e c R = d C × M ( C ) × V f × 10 m × V m × t
where dC—is the change in CO2 concentration in the flask (volumetric %); M(C)—is the molar mass of carbon (12 g/mol); Vf—is the flask volume (mL); m—is the weight of the absolute dry sample (g); Vm—is the molar volume of the gas (22.4 L/mol); t—is the incubation time (hours); 10—is the conversion factor.

2.3. Thermal Analyses of Plant Samples

The initial plant samples and plant substrates that underwent a 600-day incubation at 22 °C and moisture level corresponding to 90% of their WHC (conditions which are favorable to the most significant C loss) were analyzed using thermogravimetric analysis (TGA) and differential calorimetric spectrometry (DSC). To determine the thermal characteristics of organic matter decomposition, including the percentage of mass loss and the specific heat (J) of the decomposition process, synchronous thermal analysis (STA) was employed, spanning from room temperature to 1650 °C.
Prior to analysis, the equipment was temperature-calibrated using a standard set of 99.99% pure metal samples (NETZSCH-Gerätebau GmbH). These metal samples included indium, aluminum, tin, zinc, and gold, covering a temperature range of 80 °C to 1150 °C. Calibration was performed in a grade 6.0 helium atmosphere (99.9999% He). Helium was used both as a primary gas and as an inert gas to prevent combustion products from entering the balance. In addition, 99.9% oxygen (O2) was used to purge the PTA of condensed pyrolysis products between analyses (Centrogaz, Moscow, Russia). All plant samples were measured using the same Al2O3 crucible, taking into account weight changes and phase transitions within the temperature range of 30 °C to 900 °C.
Based on the position of the extrema of the first derivative of the DSC curves, we identified six temperature ranges corresponding to the thermal oxidation of compounds with different structures, compositions, and thermal characteristics. The thermal oxidation of organic materials represents the process of sequential destruction of components with increasing thermal stability. We used the following temperature ranges, which were previously used to analyze the thermal oxidation of Eriophorum vaginatum [43]: 30–150 °C corresponds to the release of water and easily degradable compounds, 150–265 °C—hemicellulose and alcohol soluble fractions (Eth-Extr), 265–380 °C—cellulose, 380–495 °C—lignin. The 495–610 °C and 610–725 °C ranges correspond to the oxidation of the most condensed aromatic and artifact carbonaceous thermostable compounds.
The temperatures at which 50% of the energy is released (T50q) and 50% of the weight of the plant substrate is lost (T50w) were also determined.

2.4. Data Processing and Statistical Analyses

The total C losses from plant substrates (Ccum, g C/kg of plant substrate) during the experiment were estimated from the cumulative curves of DecR for each treatment during the 600 days of incubation according to the equation:
C c u m = C c u m P + D e c R p + D e c R t M ( C ) d t d P
where CcumP is cumulative C-CO2 loss at the time of the previous measurement (µg C/g of plant substrate); DecRp and DecRt are rates of C(CO2) emission of the previous measurement and on the day of measurement (µg C/g of plant substrate/hour); M(C) is the molar mass of carbon (12 g/mol); dt is date of measurement; dP is date of the previous measurement.
The decay constant for peat-forming plants (k, 1/year) was estimated by fitting a single exponential model [44,45]:
C c u m = C o × 1 e k × t
where Ccum is the cumulative C-CO2 loss due to microbial decay (g C/kg of plant substrate), Co—is the initial content of total C in the plant sample (g C/kg of plant), k—is the decay constant, 1/year; t is the incubation time (years).
The temperature sensitivity of the DecR of the peat-forming plants was expressed as a Q10 function, which indicates the change in the DecR for a 10 °C increase in temperature. The Q10 value was calculated using the formula [46]:
Q 10 = D e c R 2 D e c R 1 10 T 2 T 1
where DecR2 and DecR1 are the average decomposition rates of the plant substrates at temperatures T2 (higher temperature) and T1 (lower temperature).
The temperature coefficient Q10 in our experiment was determined for two temperature intervals: 2–12 °C and 12–22 °C.
A two (or three) way analysis of variance (ANOVA) was used to evaluate the effect of temperature (T), humidity (W), and plant type (P) on DecR and Ccum (cumulative loss of C(CO2) during the experiment). The distribution of the residuals was checked for normality and a test for homogeneity of variances was performed. Statistical analyses were performed using STATISTICA 6 software. All statistical analyses were performed at a significance level of α = 0.05. In the figures and tables, data are presented as arithmetic means with standard errors.

3. Results and Discussion

3.1. Changes in Chemical Properties and Biochemical Composition of Peat-Forming Plants after the Experiment

The properties and biochemical composition of the examined plant substrates exhibited significant variation (Table 1 and Table 2). The Sphagnum fuscum sample had notably low pH values, as well as lower contents of C, N, cellulose, and ash. However, it showed high values for WHC and HM, C/N and Lig/N ratios, and lignin-like and Eth-Ext content compared to all other plant substrates studied. An acidic environment is generally unfavorable for the activity of microbial decomposers [7,19,23] and thus significantly inhibits the decomposition of organic matter. In addition, substrates with high C/N and Lig/N ratios tend to undergo slow mineralization, a phenomenon observed here in the case of Sphagnum fuscum. In contrast, the leaves of Chamaedaphne calyculata were richer in both C and N, with correspondingly lower C/N and Lig/N ratios. The properties and composition of the Eriophorum vaginatum sample were generally between those of Sphagnum fuscum and Chamaedaphne calyculata, but it was characterized by the highest cellulose content.
Remarkable changes in the biochemical composition of the plant substrates were observed during the experiment due to microbial degradation (Figure 2). A significant decrease in the content of Eth-Ext substances was noted across all the studied samples, with losses ranging from 0.2% to 33%. The maximum losses were seen in Eriophorum vaginatum at 22 °C with 30% of WHC moisture (33.3%), and in the mixed sample at 12 °C with 60% of WHC moisture (32.6%). Changes to the content of cellulose and lignin-like substances were quite pronounced and influenced by all the factors under investigation: plant substrate, temperature, and moisture level. For instance, the content of lignin and lignin-like substances in Chamaedaphne calyculata increased by 3.2% to 26.6% after 600 days of incubation for all moisture levels at 22 °C. The relative changes to the cellulose content at the end of the experiment varied among the investigated plant substrates and were attributed to the effects of temperature and moisture (Figure 2). The most significant losses of cellulose (19%–20% of the initial value) were observed for Eriophorum vaginatum at 22 °C with a moisture content of 90% of WHC and for Eriophorum vaginatum at 12 °C with a moisture content of 30% of WHC.
Therefore, Chamaedaphne calyculata has a biochemical composition that provides less resistance to decomposition, whereas Sphagnum fuscum shows the highest stability due to its biochemical characteristics.

3.2. Changes in Thermal Characteristics of Peat-Forming Plants after the Experiment

The highest weight losses of all initial peat-forming plants were observed at 265−380 °C (mostly associated with cellulose) and varied from 33.8% in Chamaedaphne calyculata to 46.5% in Eriophorum vaginatum (Table 3). Weight losses at 380–495 °C in the initial samples, presumably corresponding to the oxidation of lignin and lignin-like substances, were lowest in Chamaedaphne calyculata (18.1%) and ranged from 27.3 to 33.1% in the other plant samples. Chamaedaphne calyculata was characterized by the highest weight loss (27.7%) in the high-temperature ranges (495–725 °C), indicating the presence of remarkable amounts of thermostable compounds. In other plants, the content of thermostable compounds in the total weight loss did not exceed 5% (Table 3).
After 600 days of incubation, we observed a slight decrease (by 2%–3%) of two thermolabile groups oxidizing at 30–150 °C and 150–265 °C in all peat-forming plants, while the content of the fraction oxidizing at 265–380 °C increased by 0.9%–4.2%. In the sample of Chamaedaphne calyculata we observed a remarkable increase in the proportion of lignin and lignin-like substances to the total weight loss, while the content of aromatic and other thermostable components decreased by 5.8%. In other plant samples, the changes to the content of thermostable components, including aromatic compounds, did not exceed 1.2%.
According to the DSC data, the total amount of energy required for the decomposition of the initial peat-forming plants was approximately the same, ranging from 10.5 to 10.9 kJ/g of plant substrate (Figure 3). Thermal oxidation of the studied plants after a 600-day incubation required higher energy costs. The increase was 16.3% for Chamaedaphne calyculata and 2.1%–5.5% for other plant substrates. The temperature at which 50% of the total plant weight is lost, known as T50w and indicative of the content of thermostable components, was highest for Chamaedaphne calyculata (378 °C), while for the other peat-forming plants, it ranged between 322 and 333 °C. Following the experiment, the T50w index increased by 12 °C for Chamaedaphne calyculata and exhibited negligible changes (by 1–3 °C) in the other plant substrates.

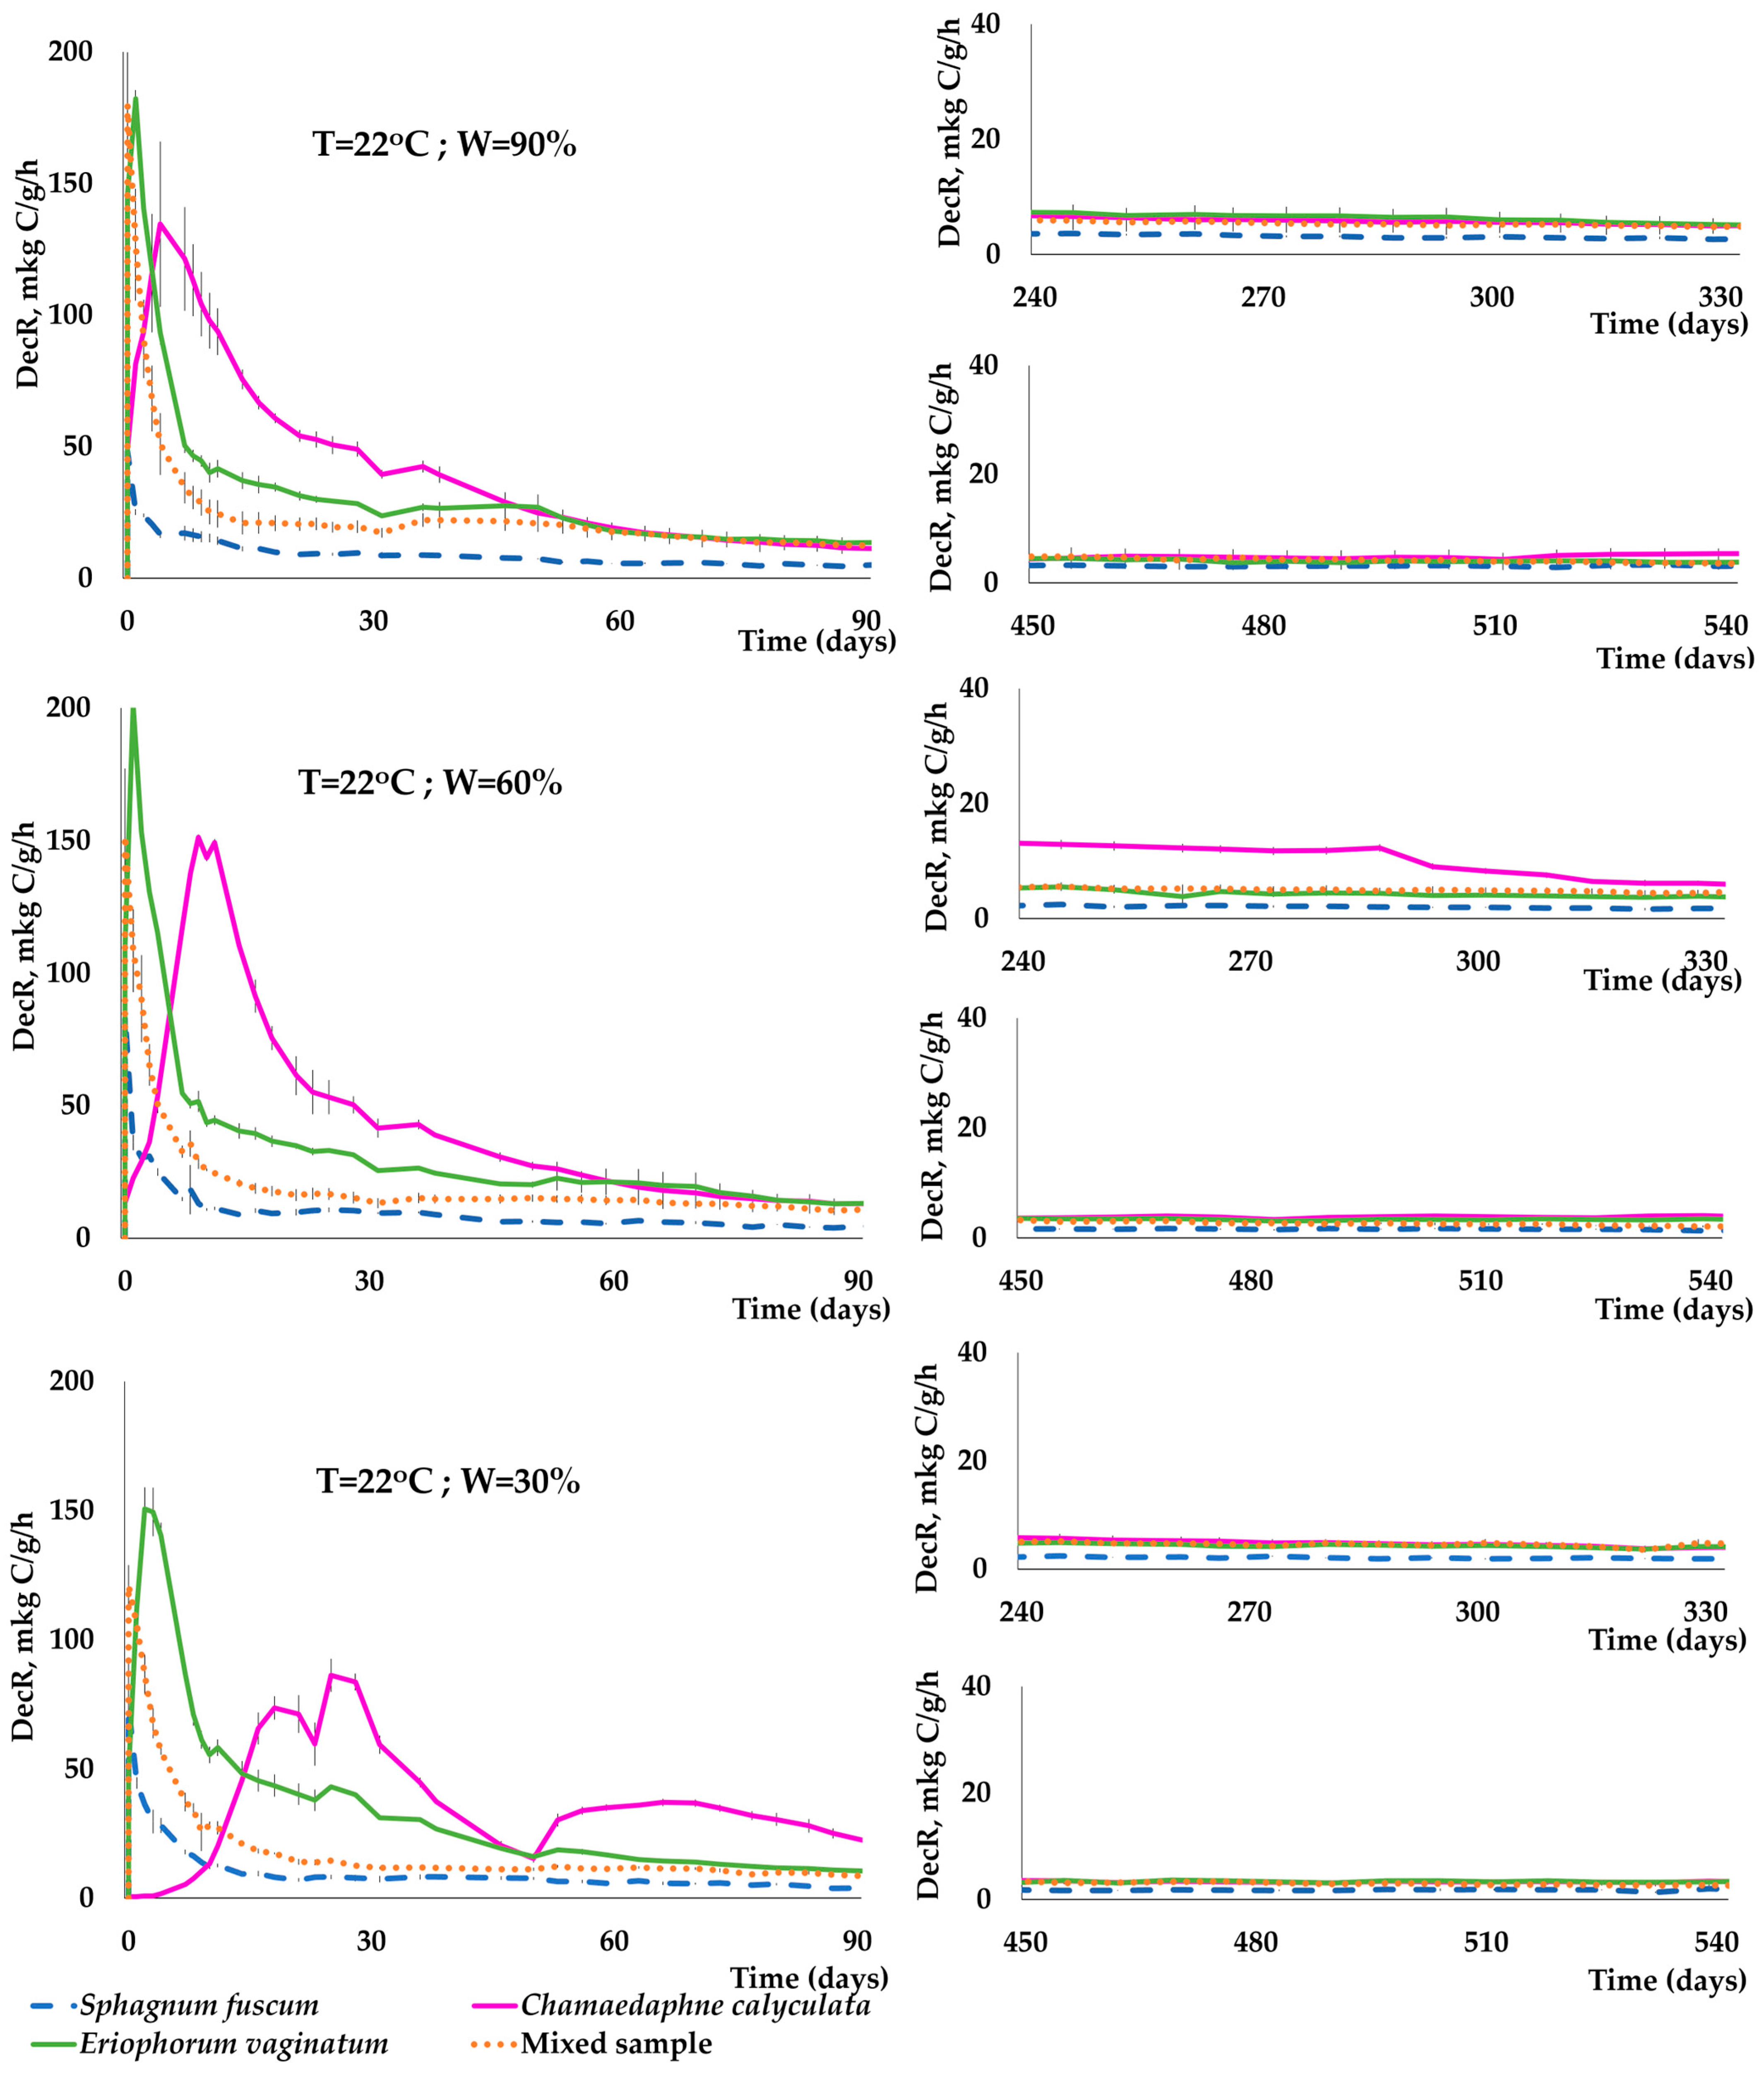
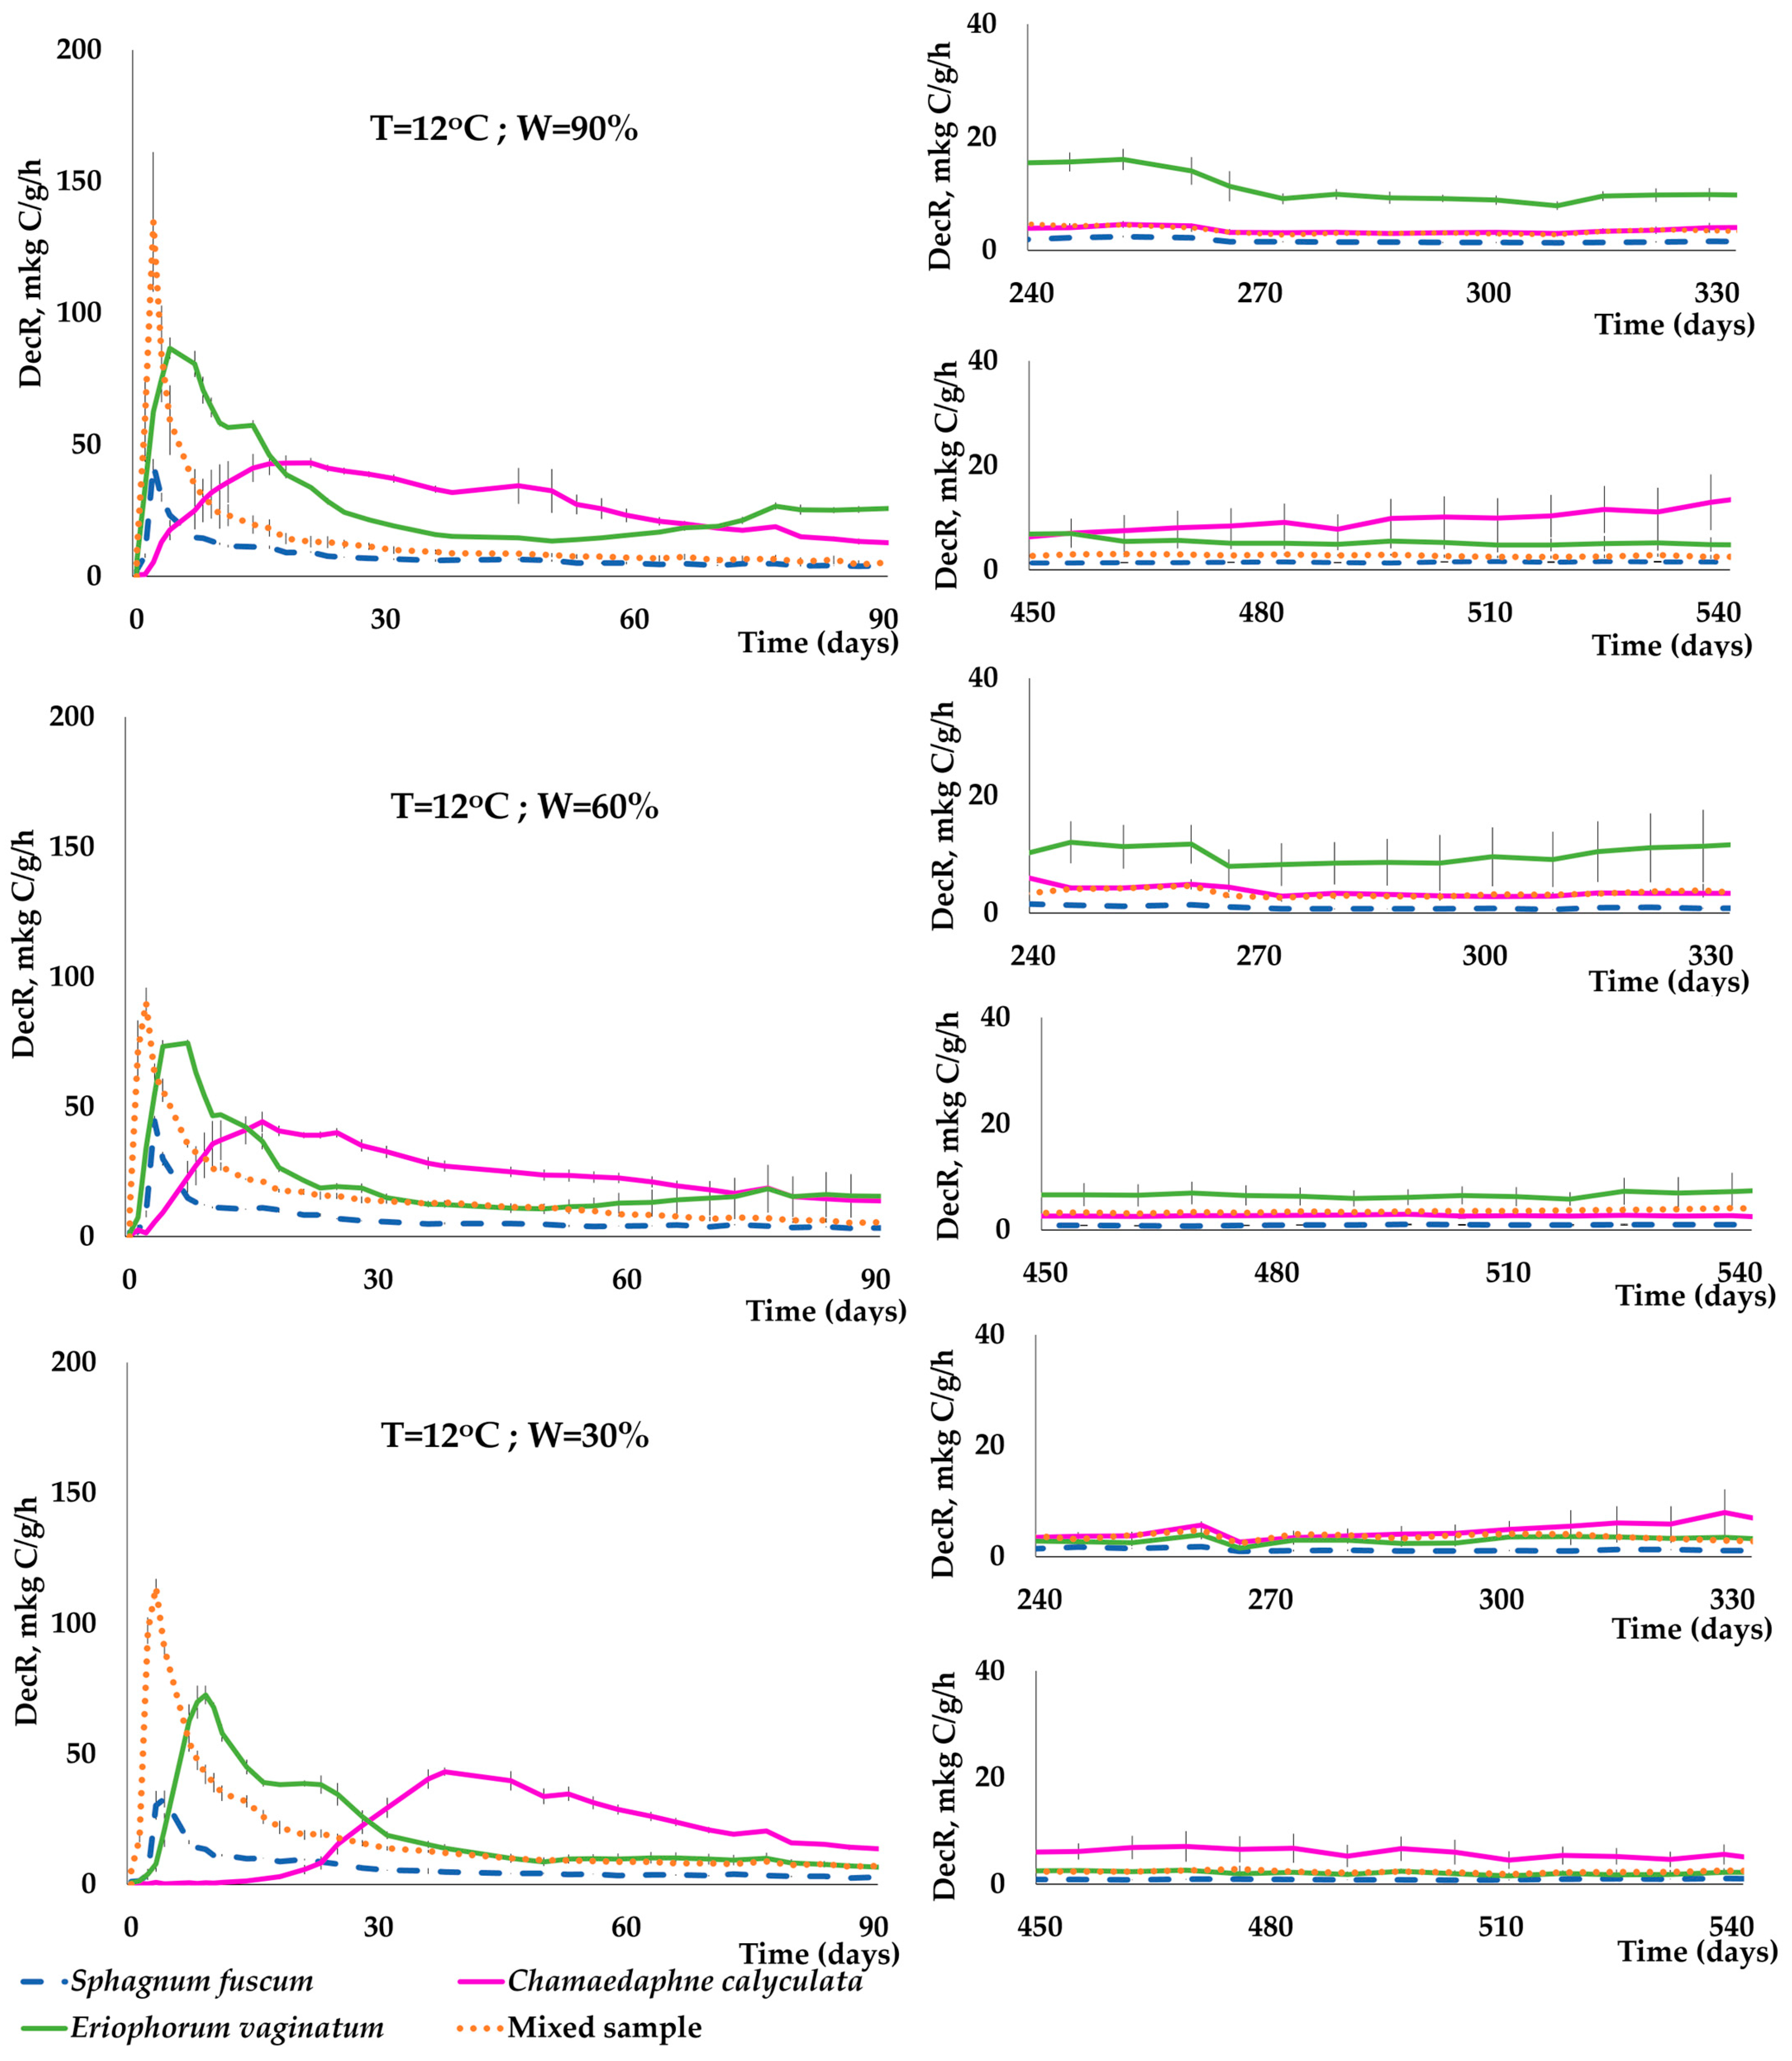
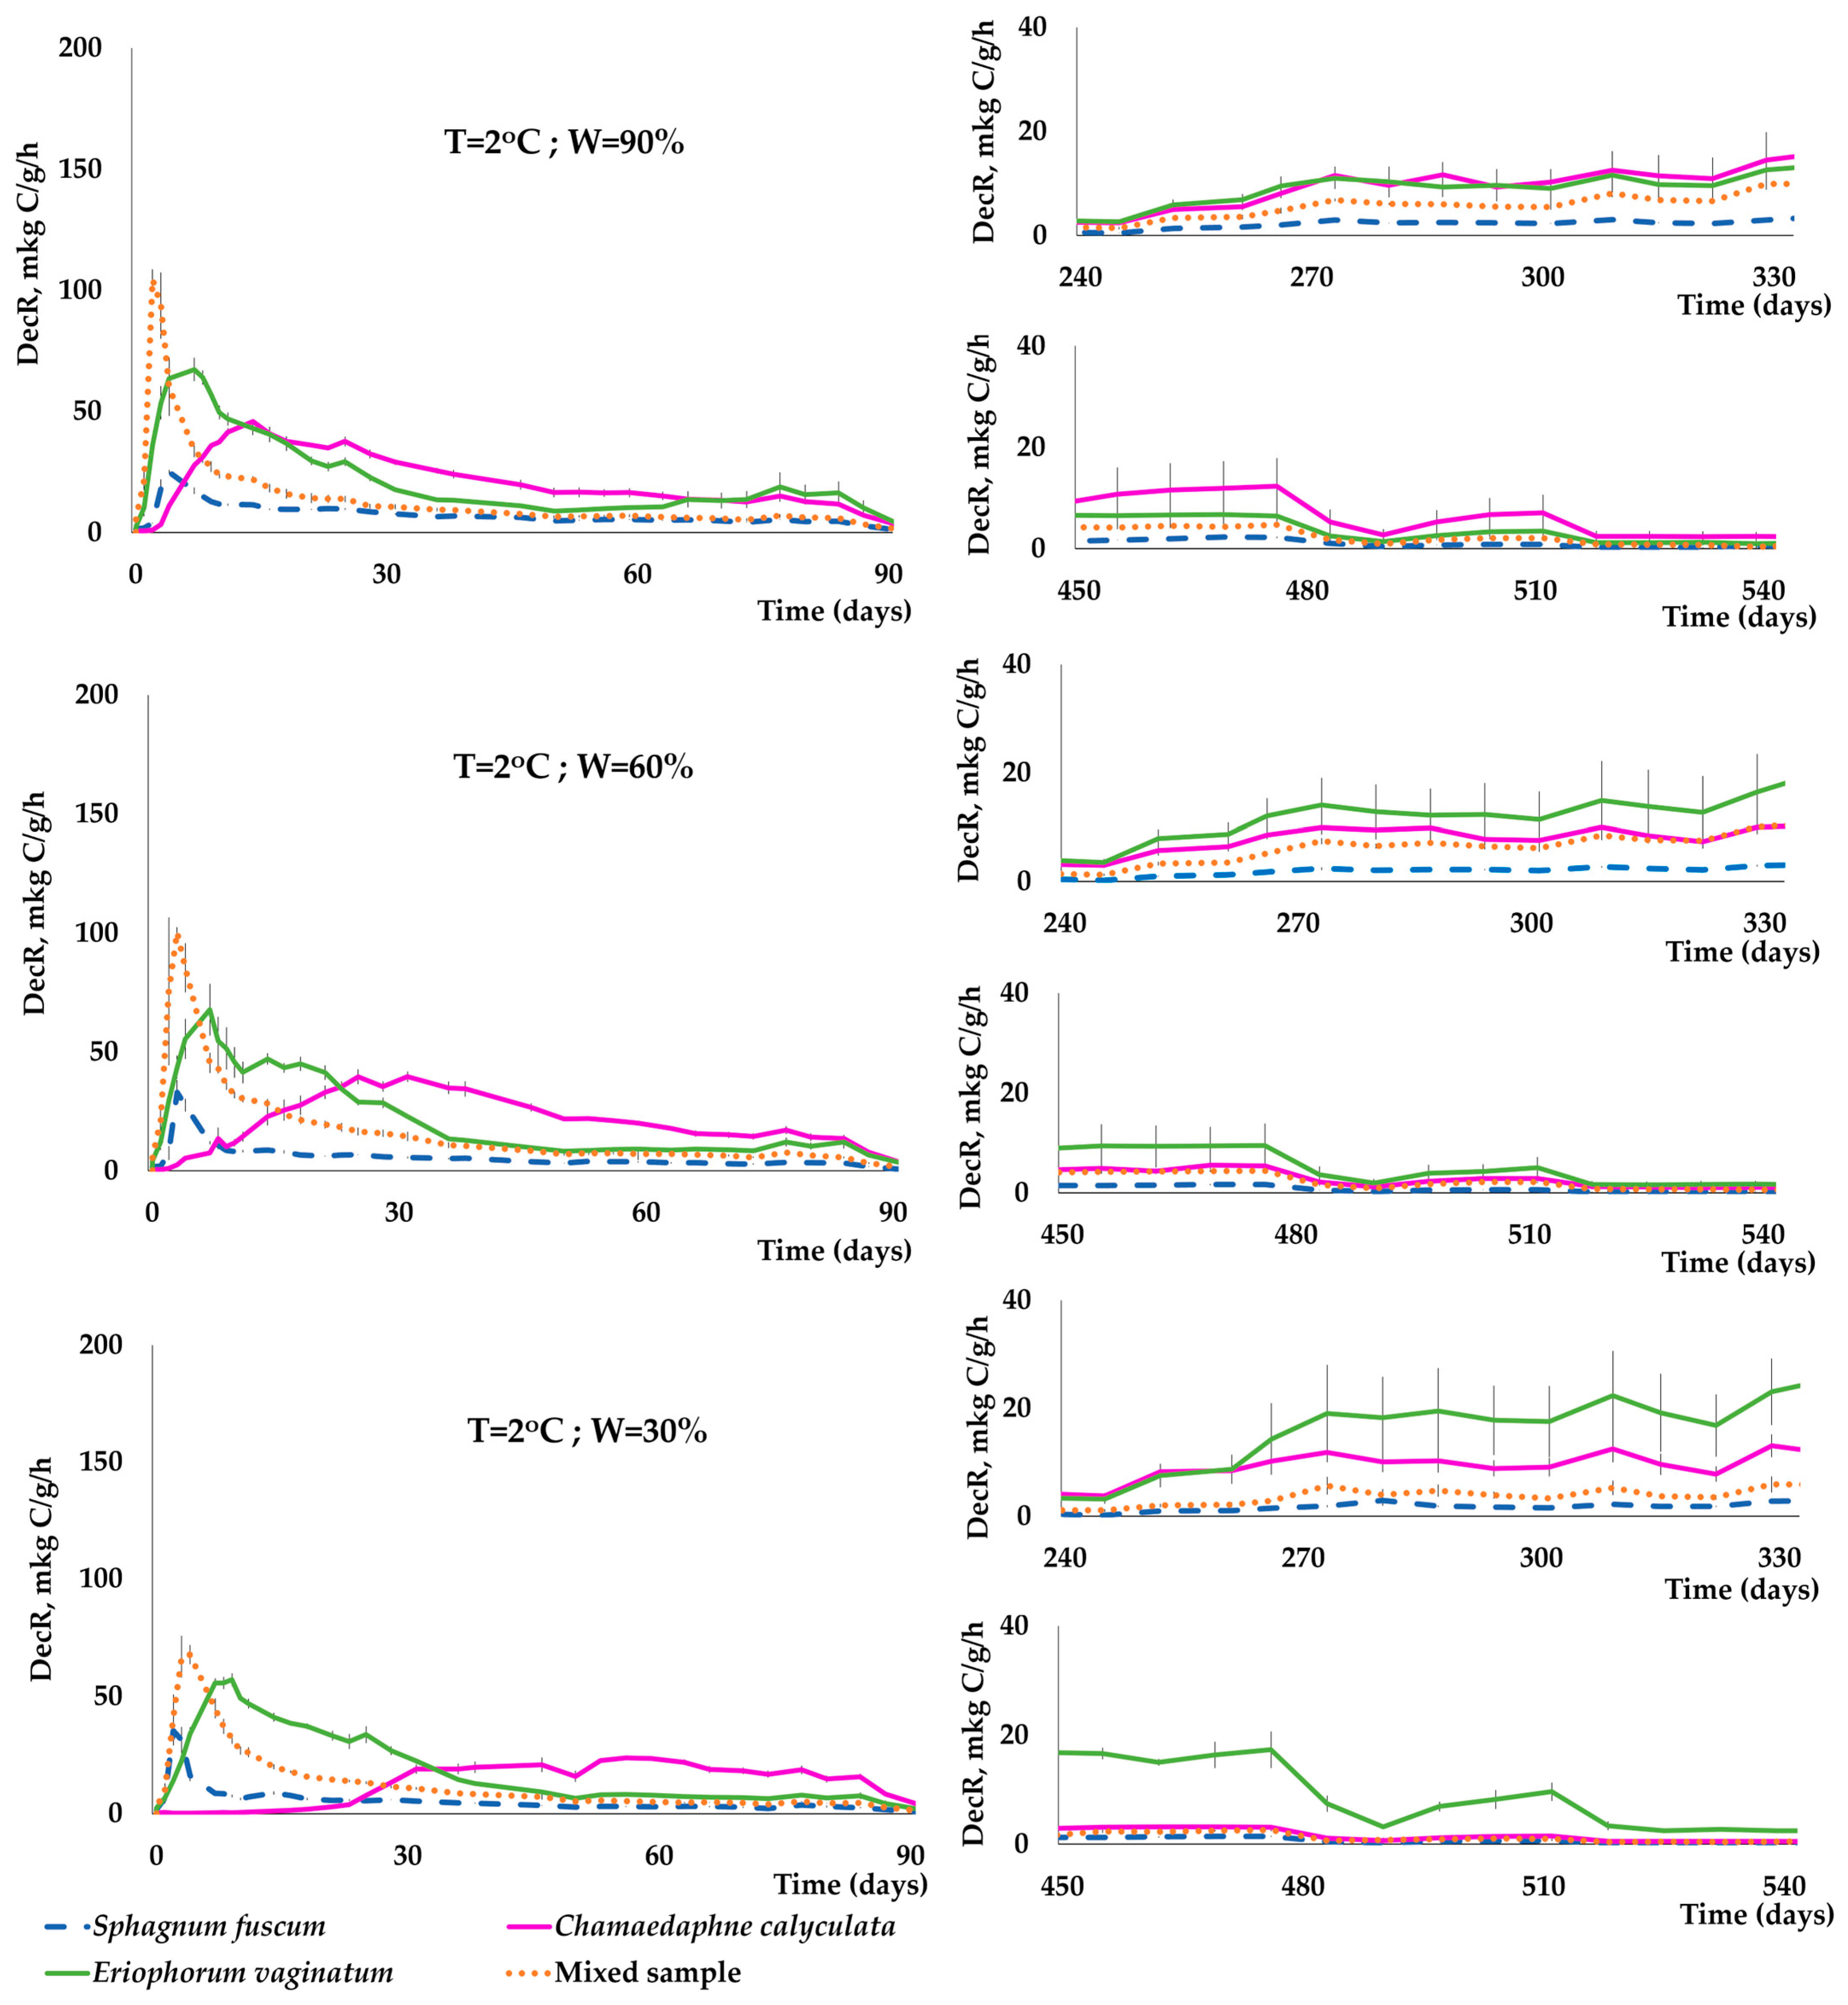
3.3. Dynamics of C(CO2) Release during the Decomposition of Peat-Forming Plants

The dynamics of DecR over 600 days of incubation were determined by the temperature and moisture during the experiment and also depended on the type of plant substrate (Figure 4, Figure 5 and Figure 6). The pattern of the DecR value dynamics for Eriophorum vaginatum during the experiment was identical for all given temperatures and moisture levels. The highest DecR values were observed during the first 1–4 weeks of the experiment and reached 150–200 µg C/g/h at 22 °C, and 55–85 µg C/g/h at 12 and 2 °C. The period with the highest DecR values lasted 1–5 days at 22 °C and was much longer (25–30 days) at lower temperatures. The period of high DecR values became longer at lower moisture levels. After 30–35 days of incubation, the intensity of decomposition of Eriophorum vaginatum reached a steady level with a further gradual and slow decrease of the DecR values, which did not exceed 5–25 µg C/g/h at the end of the experiment.
The decomposition of Chamaedaphne calyculata showed the highest dependence on incubation temperature and moisture. At 22 °C and moisture contents of 60 and 90% of their WHC, DecR values reached their peak values (50–150 μg C/g/h) within the first 2 weeks of the experiment.
A decrease in temperature and moisture during incubation resulted in a decrease in the maximum DecR values (reaching as low as 25–40 µg C/g/h), as well as an extension of the period during which relatively high DecR values were sustained (Figure 5 and Figure 6). For Chamaedaphne calyculata, DecR reached a stable level (10–20 µg C/g/h) after 120 days of incubation at 22 °C with moisture levels of 30 and 90% of WHC. Under conditions of 60% moisture, this stability was reached after 300 days (Figure 4). At 12 °C, the plateau phase was observed after 240 days at 60% moisture and after 150 days at 30% moisture (Figure 5).
The period of most active decomposition for Sphagnum fuscum was significantly shorter than that observed for all other samples, not exceeding 5 days. The peak DecR during this phase ranged from 25 to 85 µg C/g/h, depending on the temperature and moisture content. The release of C(CO2) from the mixed sample showed similarities with that of Sphagnum fuscum. However, the main difference was in the intensity of the decomposition rate. For the mixed sample, it was 2–3 times higher compared to Sphagnum fuscum during the first 1.5 months of the experiment. This trend was consistently observed across different temperatures and moisture levels.
Increased C(CO2) release was observed in all plant samples during the early stages of decomposition. The increase in C(CO2) release was first detected at a temperature of 22 °C, whereas it took 1 to 2 weeks before an increase was observed at 2 °C. The increase in DecR at 2 °C was much slower than at 22 °C. For example, the maximum DecR values for Eriophorum vaginatum decomposition at 22 °C were reached on the next day after the start of the experiment, while at 2 °C the maximum DecR value was not reached until the 7th day after the start of the experiment. The maximum DecR value for the mixed sample exceeded the corresponding values for Chamaedaphne calyculata and Sphagnum fuscum by an average of 67–72 µg C/g/hr. In general, maximum DecR values at similar temperatures were observed at higher moisture levels (60% and 90%).
The elevated degradation rates observed in the early phase of the experiment can be explained as follows: fresh plant litter contains a significant amount of water-soluble and easily hydrolysable substances (Table 2), which are primarily utilized by microbial degraders [7,8,25,26]. Subsequently, the concentration of readily available components within carbohydrate and polypeptide complexes decreases (see Figure 2). Consequently, the loss of organic matter decreases and a slower decomposition process involving more resistant components of the plant litter is initiated [23,47,48,49].
In contrast to the release dynamics of C(CO2) at 12 °C and 22 °C, two distinct periods of relatively high microbial activity were observed at 2 °C across all moisture levels. The first period, characterized by maximum DecR values of 25–104 µg C/g/h, depending on the type of plant sample, extended over the first 3 months. The second period, characterized by DecR values of 4–25 µg C/g/h, occurred between 240 and 480 days into the experiment. During the intervals between these periods, a relatively consistent and low C(CO2) release was observed for all plant species (Figure 6).

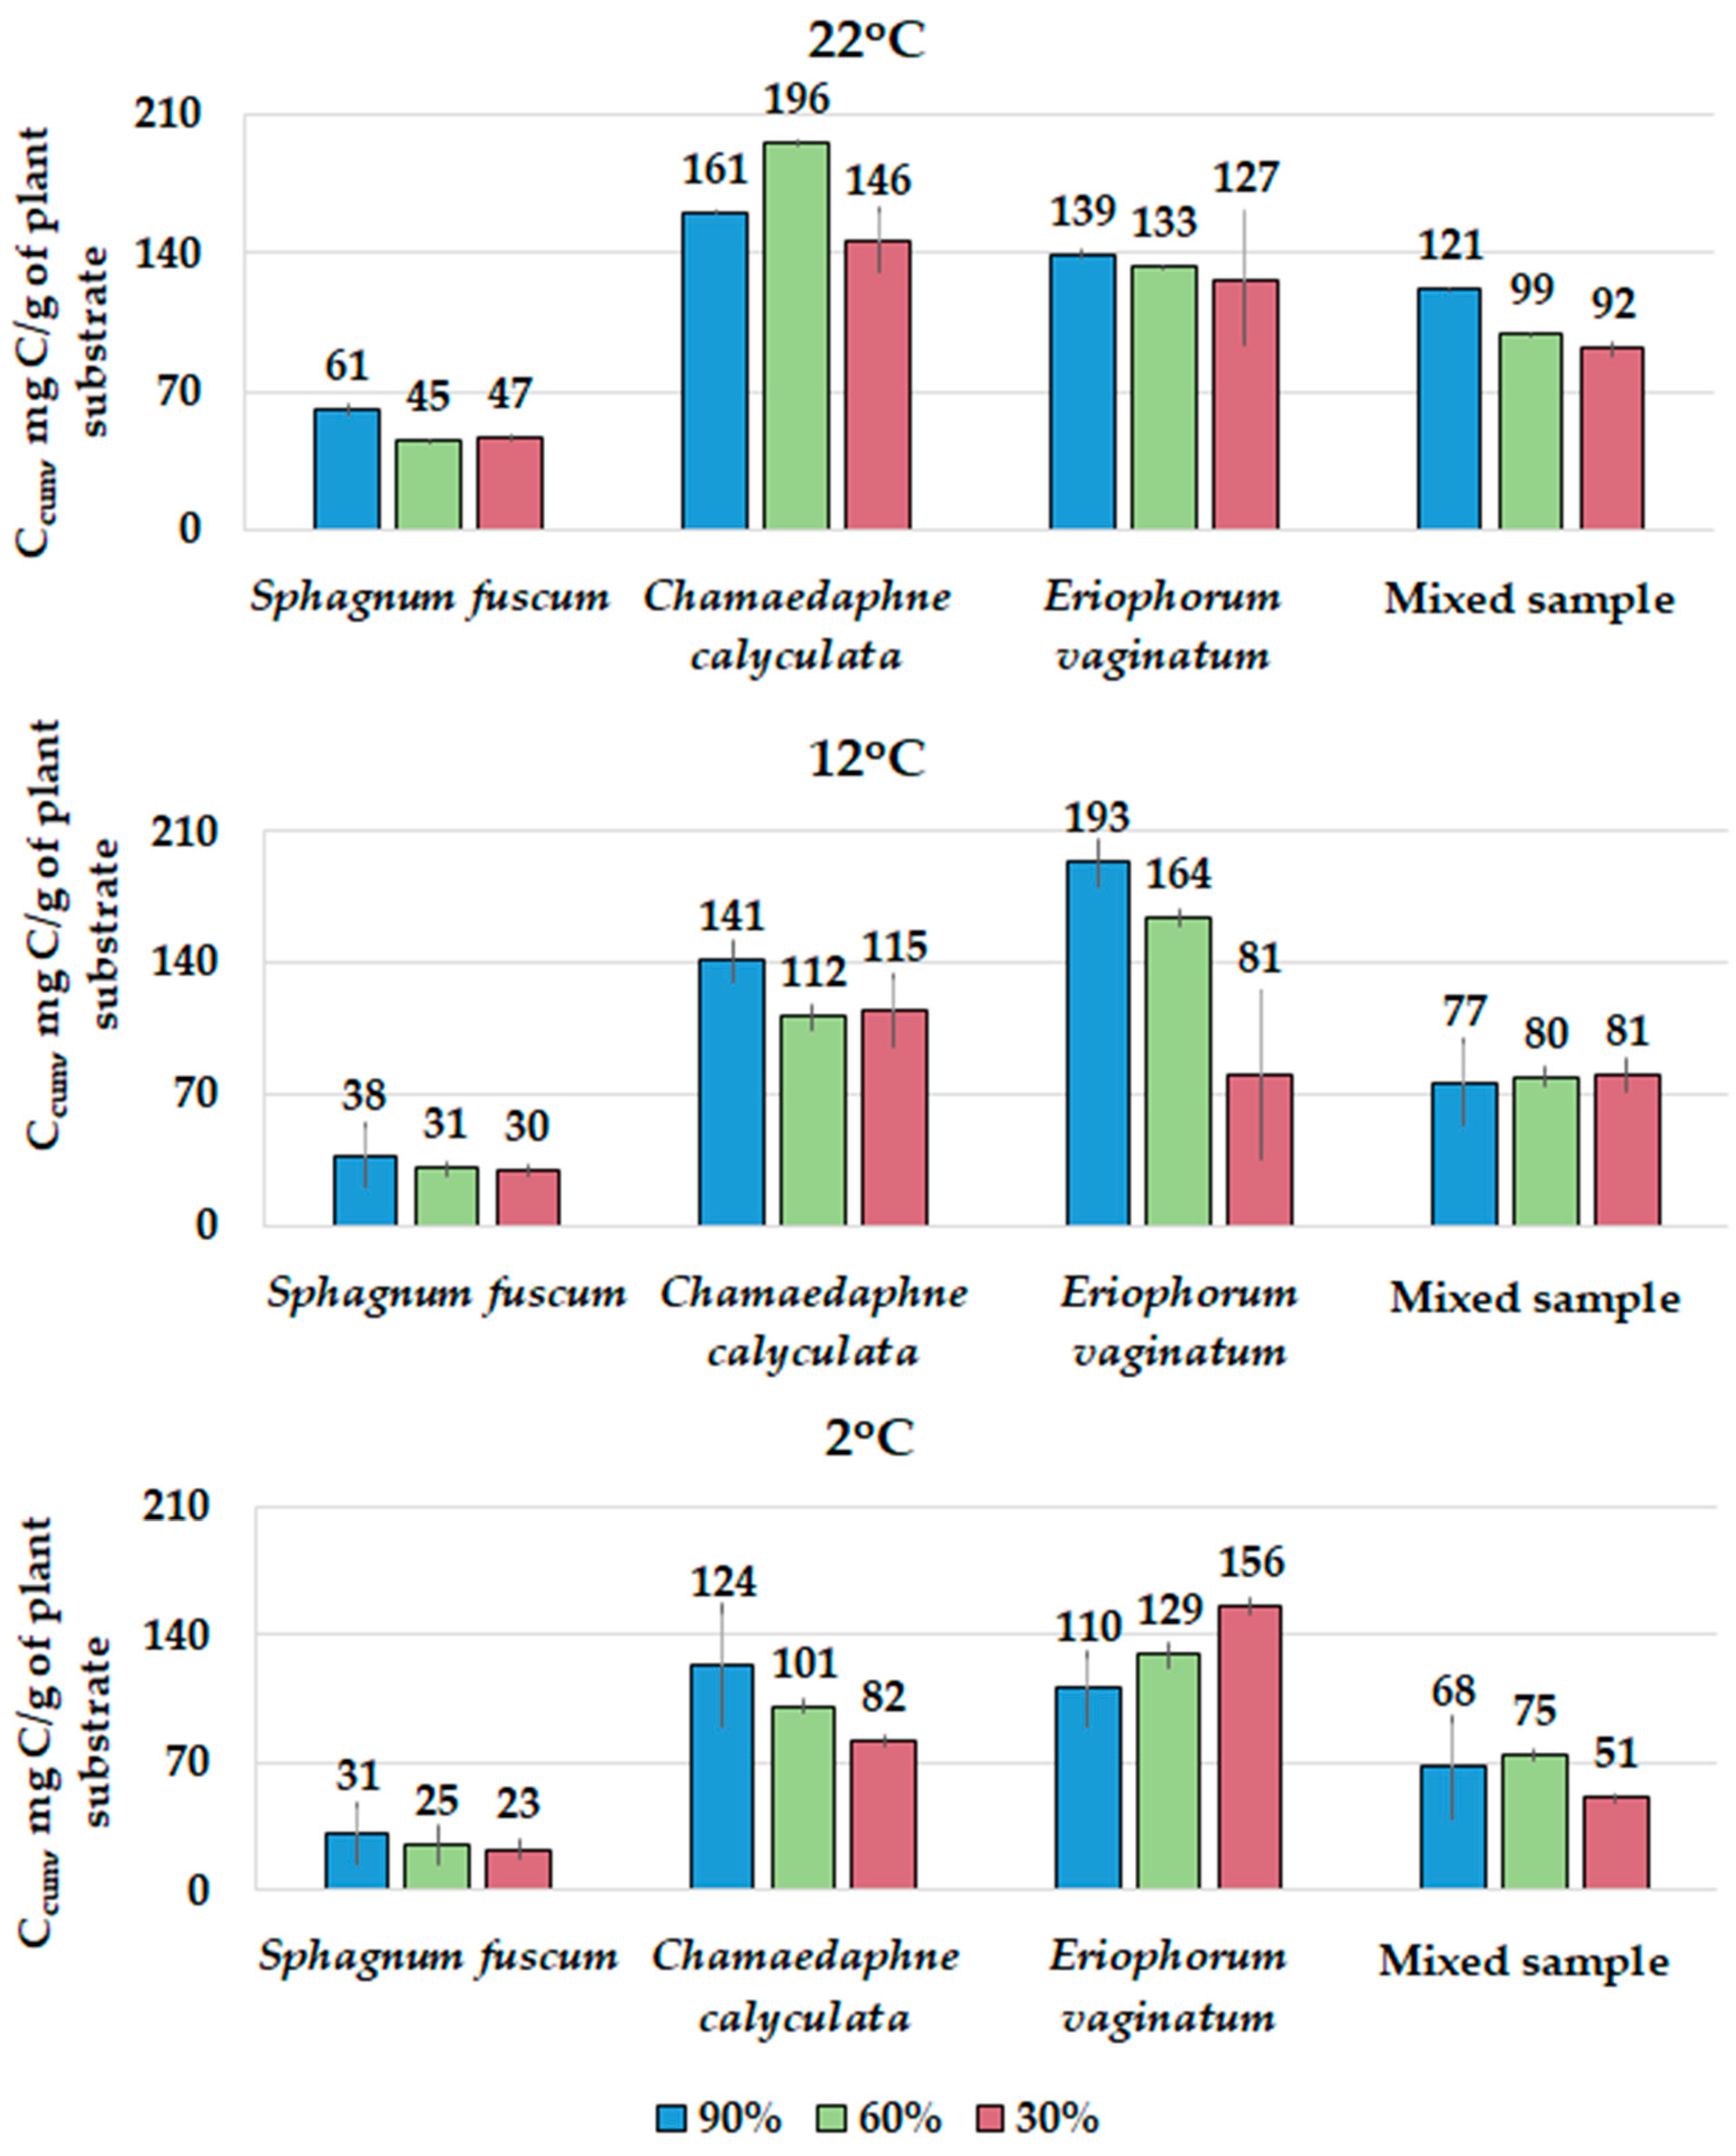
3.4. Cumulative Losses of C(CO2) during the Experiment

The cumulative loss of carbon in the form of CO2 (Ccum) was 45–196 mg C/g plant substrate at 22 °C and 23–156 mg C/g plant substrate at 2 °C, depending on the moisture level during the experiment (Figure 7). The changes in Ccum values caused by the different hydrothermal conditions during the experiment were most remarkable for Chamaedaphne calyculata and Eriophorum vaginatum.
Typically, the decrease in temperature and moisture led to a decrease in Ccum values during the decomposition process. The most significant decrease in Ccum value was observed in Chamaedaphne calyculata (about 1.5 times) when the incubation temperature was reduced from 22 to 2 °C (Figure 7). As expected, samples of Sphagnum fuscum showed the highest resistance to decomposition, with Ccum values at 22 °C remaining almost independent of moisture levels and ranging from 47 to 61 mg C/g. The lowest C(CO2) losses (23–31 mg C/g) were observed for Sphagnum fuscum at 2 °C. The Ccum value for the mixed sample fell between the C(CO2) losses recorded for its individual components (Sphagnum fuscum and Chamaedaphne calyculata) and generally decreased at lower temperatures. Reducing the moisture content of the samples had different effects on the Ccum value at different temperature regimes. For Eriophorum vaginatum, decreasing the moisture content resulted in a decrease in the Ccum value at 22 °C, while it increased at 12 °C.
The amount of C(CO2) released throughout the experiment was also estimated as a ratio (in %) relative to the initial amount of C in the plant samples. Depending on the temperature and moisture, Sphagnum fuscum samples lost only 5%–14% of the initial C content, the mixed sample lost a little more—11%–27%, while the loss of C(CO2) from Chamaedaphne calyculata and Eriophorum vaginatum ranged from 17 to 42% of the initial carbon content. Maximum carbon losses were observed for Eriophorum vaginatum at 12 °C, and for Chamaedaphne calyculata at 22 °C.
Therefore, in descending order of cumulative carbon losses, the analyzed samples ranked as follows: Chamaedaphne calyculata > Eriophorum vaginatum > mixed sample > Sphagnum fuscum. C(CO2) losses in Chamaedaphne calyculata and Eriophorum vaginatum samples displayed variations depending on moisture and temperature. However, they consistently exceeded the values observed in the mixed sample and the moss litter.
Our data, obtained within the framework of a model experiment, align with the findings of a field experiment on plant litter decomposition [37]. Specifically, depending on moisture conditions, the decomposition of Sphagnum fuscum resulted in less carbon loss compared to the decomposition of Chamaedaphne calyculata and Eriophorum vaginatum. Similar decay rate constants were observed between Sphagnum fuscum and Eriophorum vaginatum during a field experiment in the Timiryazevskoe bog (Tomsk Oblast) [37]. An experiment involving the decomposition of plant samples in peat from the Kukushkino bog (Khanty-Mansiysk) also reported the highest decomposition rates in the initial stages of decay, followed by a significant decline in the decomposition rate of the plant samples. This trend was accompanied by a reduction in the range of variation in the decay constants [50].
In addition, the study of Larionova et al. [23] found that the decay rate constant of leaf litter, as determined in a long-term model experiment, increased with temperature. However, higher moisture contents generally led to a decrease in k values, with this effect being most pronounced at the highest temperature, 22 °C.
Under natural conditions, a peat deposit comprises residues from different plant species. In our study, the response of the decomposition processes in the mixed sample to environmental changes during decomposition significantly differed from that of its individual components. This phenomenon is mediated by nutrient exchange between plant residues, and as mentioned in references [28,51,52,53,54], it can either accelerate or slow down the decomposition process.

3.5. Decay Constants of the Main Peat-Forming Plants under Different Combinations of Abiotic Factors

Cumulative curves of C(CO2) loss over the 600-day experiment were fitted using an exponential regression model (Equation (2)). This approach allowed us to calculate the decay constants (k) of the plant substrates under different combinations of temperature and moisture for both the first 90 days and the entire 600-day period (Figure 8). The values of k were dependent on the time frame for which they were calculated. Specifically, the decay constants during the initial stages of decomposition (the first 90 days of incubation) were 2–5 times higher than the k values observed for the entire incubation period.
The lowest k values (0.0001–0.0002 day−1) for the 600-day incubation period were typical for Sphagnum fuscum at temperatures of 12 and 2 °C. This observation is consistent with the minimal cumulative loss of C(CO2) during the decomposition of Sphagnum fuscum. In contrast, the decomposition of Eriophorum vaginatum and Chamaedaphne calyculata at all temperatures was characterized by consistently high values of decay constants among the studied plant samples (k = 0.0003–0.0009 day−1; Figure 8). A significant increase in k values was observed for all plant species as the temperature increased from 12 to 22 °C. However, the k values remained relatively stable within the temperature range of 2 to 12 °C. Interestingly, Eriophorum vaginatum showed higher k values at 12 °C compared to 22 °C at a moisture level of 90% of WHC and at 2 °C compared to 12 °C at a moisture level of 30% WHC.
The effect of moisture on k was influenced by both plant species and temperature conditions. For example, we did not observe a consistent trend of reduction of the decay constant in the early stages of decomposition (within the first 90 days of incubation) at 12 and 2 °C for Eriophorum vaginatum and Chamaedaphne calyculata. However, this effect was observed toward the end of the incubation period, specifically for Chamaedaphne calyculata at 2 °C and for Eriophorum vaginatum at 22 °C and 12 °C. Conversely, an opposite effect of moisture on k was observed for the mixed sample, both after 90 days and over the full 600-day incubation period, with a decrease in k at 22 °C and an increase at 12 °C as moisture levels were changed.

3.6. Temperature Sensitivity of DecR of Peat-Forming Plants

Given the variation in peak carbon fluxes observed at different times during decomposition and under varying temperature and moisture conditions, the temperature sensitivity of Q10 was evaluated for specific time intervals: 0–60, 61–120, 121–180, 181–365, and 366–600 days. The highest Q10 values were recorded in the lower temperature range, specifically between 121 and 180 days of incubation for Sphagnum fuscum (Q10 = 6.19) and Eriophorum vaginatum (Q10 = 5.25) at moisture levels of 30 and 90%, respectively. In the temperature range of 12–22 °C, the highest Q10 values varied depending on the plant substrate and the incubation time: for Sphagnum fuscum, the highest Q10 values occurred between 366 and 600 days (Q10 = 2.35) at 90% moisture, while for Eriophorum vaginatum, the highest Q10 values were observed during the initial stages of decomposition (0–60 days) at 30% moisture (Q10 = 2.07). For Chamaedaphne calyculata and mixed samples, the highest temperature sensitivity of DecR in the high-temperature range was observed between 61 and 120 days of incubation, with Q10 values of 3.31 and 2.24 at 30 and 90% moisture, respectively (Figure 9).
The temperature coefficient Q10 during the initial stages of decomposition (within the first 60 days of incubation) showed variability depending on the plant substrate and its moisture content, ranging from 0.58 to 1.25 in the lower temperature range of 2–12 °C and from 0.91 to 2.07 in the temperature range of 12–22 °C (Figure 9).
According to the calculations, the temperature coefficient Q10 was lower than the typical values of the Vant-Goff constant characteristic of chemical reactions (Q10 = 2–3). Usually, during the initial stages of plant litter decomposition, the microflora does not experience a shortage of mineral nutrients because plant residues contain a sufficient amount of easily decomposable organic substances. For this reason, the rate of mineralization of organic matter is not always clearly dependent on temperature. Q10 for the decomposition rate of soil organic matter and some plant substrates generally decreases with increasing temperature and increases with the decomposition of stable organic compounds [23,55,56]. The increase in Q10 with time was observed here in the low-temperature range for all samples, probably due to the decomposition of hard-to-access compounds. In our experiment, the decrease in Q10 with increasing temperature was not observed, and the Q10 calculated for most samples in the range of 12–22 °C was higher than that in the low-temperature range of 2–12 °C. This finding can be explained by differences in the chemical composition of the organic substrates tested. Furthermore, temperature coefficients calculated for the decomposition rate of an aspen bark-based substrate [42] are also higher in the 12–22 °C range than in the 2–12 °C range and are similar to the Q10 values obtained in the present study.
The temperature sensitivity of organic substrates during long-term incubation (≥12 months) typically decreases over time, with the highest Q10 values generally observed in the first month of the experiment [23,42]. As degradation progresses and the microbial community adapts to the prevailing hydrothermal conditions during long-term incubation, the temperature sensitivity of the degradation rate tends to decrease. For example, a study of long-term incubation of leaf litter showed that the decomposition rate of organic matter is more sensitive to changes in temperature and moisture during the early months of decomposition [23,57,58]. In later stages, the decomposition rate of organic matter shows a weaker correlation with temperature [26,59].

3.7. Evaluating the Impact of Abiotic Factors on Peat-Forming Plant Decomposition in a Model Experiment

Using 3-way analysis of variance (ANOVA), it was determined that all the factors (temperature, moisture, and the type of plant material) significantly contributed to the variability in the total carbon loss (Table 4). The primary factor affecting the cumulative C(CO2) losses for 600 days of experiment was the type of plant material, accounting for 75.9% of the total variance in Ccum. Temperature and moisture explained 12.4% and 4.6% of the variance, respectively. Different combinations of the examined factors also had a notable but relatively weak impact on cumulative C(CO2) losses in plant samples, except for the interaction of temperature with moisture (Table 4).
The data revealed that after 180 days of incubation, the influence of temperature and moisture increased while the effect of the plant material type decreased. However, over time, the influence of the plant residies type and moisture on the decomposition rate increased again, while the influence of temperature declined. In addition, existing literature suggests that climatic conditions have a more pronounced impact during the initial stages of decomposition, with their influence becoming less significant as the process progresses [26,51].
The results of our 2-way analysis of variance for each plant sample individually revealed that over the 600-day degradation period, temperature explained 74%–82% of the variance in Ccum and was significant for all the plant species except for Eriophorum vaginatum. The interaction of temperature and moisture had the most substantial impact on the decomposition rate of Eriophorum vaginatum, accounting for 57% of the variance. The decomposition rate of Sphagnum fuscum was affected by temperature, moisture, and their interaction (Table 5).
Thus, the importance of environmental factors affecting the rate of decomposition of plant residues can be ranked as follows: the species of plant residues > temperature > moisture. Substrate moisture has a significant influence, but it is not a limiting factor under bog conditions. The influence of the species of plant residues strengthens with time.

4. Conclusions

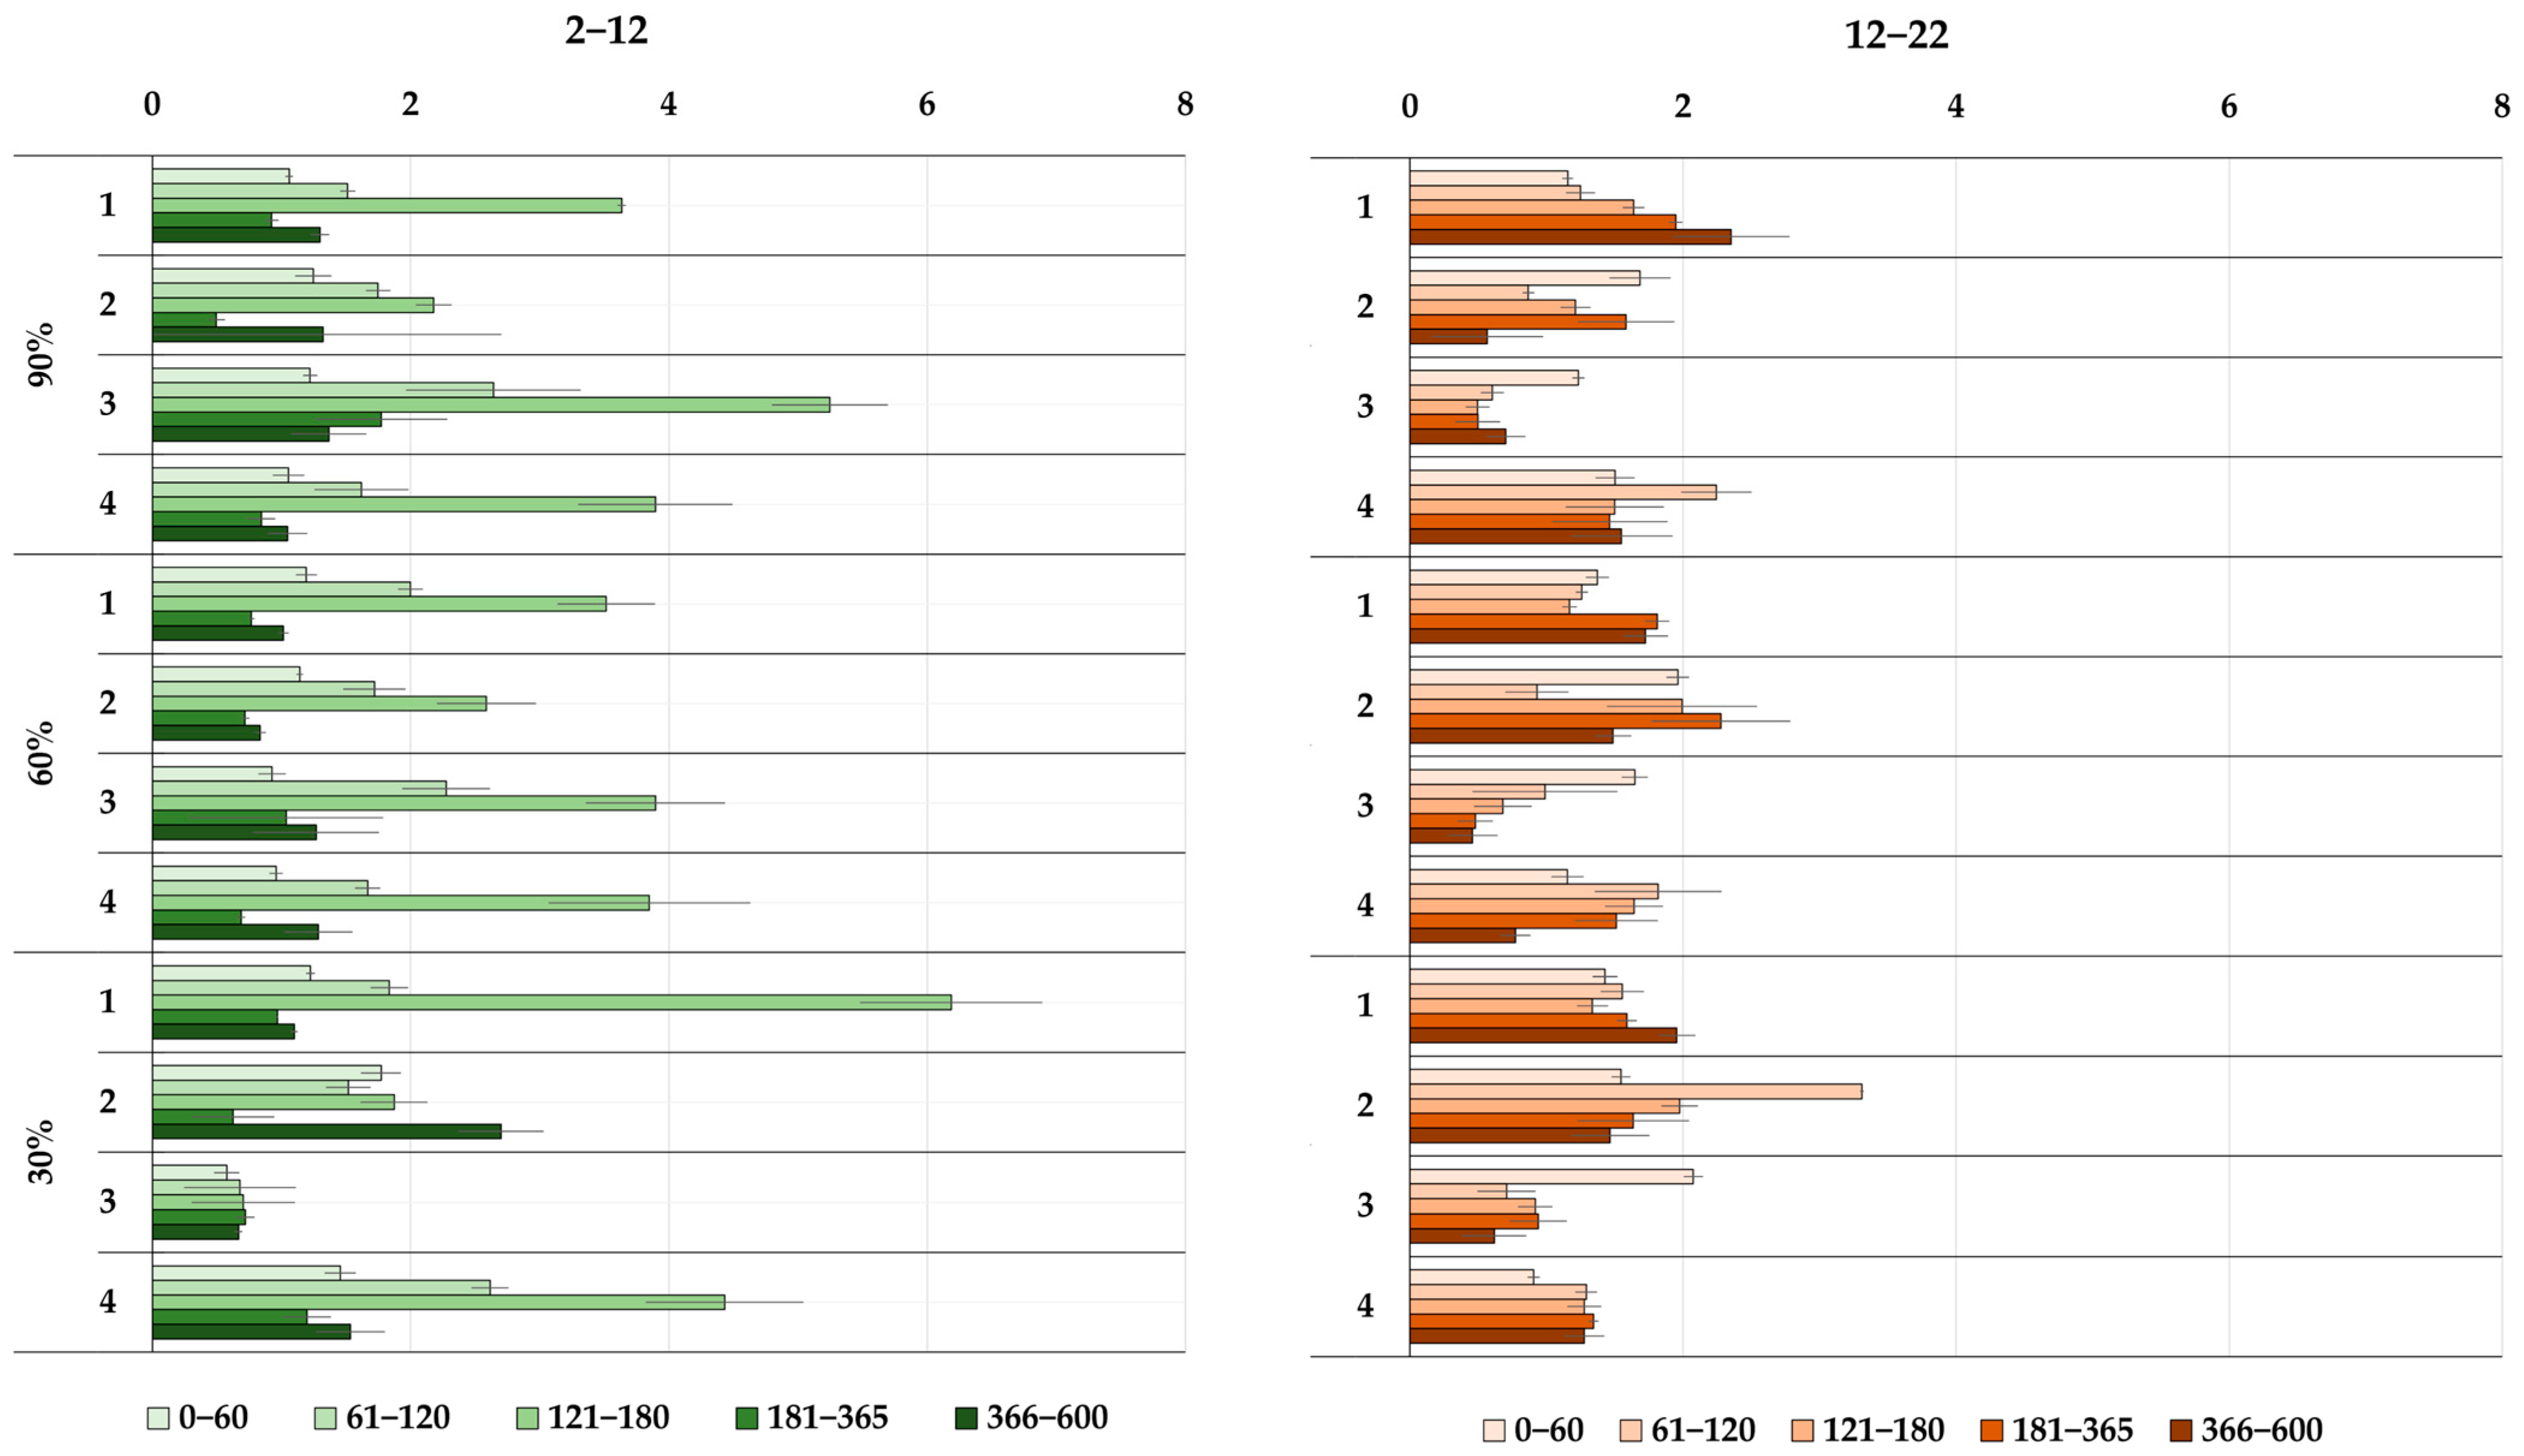
  • Temperature, moisture, and the species of plant residues had a significant impact on the dynamics and intensity of C(CO2) release during a two-year incubation experiment. In the early stages of plant sample decomposition, there was a significant increase in C(CO2) release. This increase was rapid at 22 °C, occurring within the first few days of the experiment. At 2 °C, this increase took longer to become evident, typically appearing after 1–2 weeks. Conversely, the decrease in the rate of decomposition of plant residues occurred much faster at 22 °C than at 2 °C.
  • Sphagnum fuscum was characterized by the lowest decay rate constant. The decay rate constant increased with temperature for all species of plant substrate, except for Eriophorum vaginatum. Furthermore, the effect of moisture on the decay rate constant of the studied peat-forming plants varied, and depending on temperature and the plant substrate species, it could have different directions. Overall, during long-term decomposition, the decay rate constant diminished.
  • The primary factors affecting the decomposition rate of peat-forming plants were the species of plant substrate (accounting for 76% of the total variance) and temperature (contributing 12% of the total variance). As time progressed, the influence of temperature diminished while the impact of the plant sample type increased. The moisture content of the substrate also had an effect but was not a decisive factor in bog conditions, exerting a comparatively lower impact (5%). In the case of mixed plant sample decomposition, the decay rate increased due to the non-additive effect.
  • The highest temperature sensitivity of DecR of peat-forming plants was noted in the low-temperature range during the period from day 121 to day 180 of incubation and varied from 0.71 to 6.19. The highest Q10 values of DecR were observed for Sphagnum fuscum (Q10 = 6.19) and Eriophorum vaginatum (Q10 = 5.25) at 30% and 90% moisture levels, respectively.

Author Contributions

Conceptualization, I.K. and E.G.; Methodology, V.L.d.G. and I.K.; Software, V.L.d.G.; Validation, V.L.d.G. and I.K.; Formal analysis, L.N. and I.K.; Investigation, L.N., V.L.d.G. and O.R.; Resources, L.N., I.K. and O.R.; Data curation, V.L.d.G.; Writing—original draft preparation, L.N.; Writing—review and editing, I.K. and E.G.; Visualization, L.N. and O.R.; Supervision, V.L.d.G. and I.K.; Project administration, I.K.; Funding acquisition, I.K., E.G. and L.N. All authors have read and agreed to the published version of the manuscript.

Funding

This work was supported by the Ministry of Science and Higher Education of the Russian Federation within the framework of the state assignment “Development of a system for monitoring and integrated analysis of pools and flows of greenhouse gases in wetland and forest ecosystems of Western Siberia” (FWRG—2022-0001, grant number 122111400002-2) and project No. 075-15-2021-610 “Stability and functions of soil carbon in agroecosystems of Russia (CarboRus)”, and by the Tyumen Oblast Government, as part of the West-Siberian Interregional Science and Education Center’s project grant number 89-DON (1).

Data Availability Statement

The data presented in this study are available on request from the corresponding author.

Acknowledgments

We thank our colleagues from the Analytical Laboratory of the Forestry Institute of the KarRC RAS (Petrozavodsk) for determining the biochemical composition of plants. We are grateful to Vasily Zhmurin for his help in conducting the incubation experiment. We are very thankful to both anonymous reviewers for their valuable comments.

Conflicts of Interest

The authors declare no conflict of interest.

References

  1. Inisheva, L.I. Torfyanye resursy i ikh kharakteristika [Peat resources and their characteristics]. In Bolota Zapadnoy Sibiri—Ikh rol’ v Biosfere [Bogs of Western Siberia—Their Role in the Biosphere], 2nd ed.; Zemtsov, A.A., Ed.; Tomsk State University SibNIIT Publisher: Tomsk, Russia, 2000; 72p. [Google Scholar]
  2. Guo, X.; Lu, X.; Tong, S.; Dai, G. Influence of environment and substrate quality on the decomposition of wetland plant root in the Sanjiang Plain, Northeast China. J. Environ. Sci. 2008, 20, 1445–1452. [Google Scholar] [CrossRef] [PubMed]
  3. Peltoniemi, K.; Strakova, P.; Fritze, H.; Iraizoz, P.A.; Pennanen, T.; Laiho, R. How water-level drawdown modified litter-decomposing fungal and actinobacterial communities in boreal peatlands. Soil Biol. Biochem. 2012, 51, 20–34. [Google Scholar] [CrossRef]
  4. Golovatskaya, E.A.; Nikonova, L.G. Influence of the level of bog waters on the processes of transformation of sphagnum mosses in peat soil of oligotrophic bogs. Eurasian Soil Sci. 2017, 5, 580–588. [Google Scholar] [CrossRef]
  5. Pastukhov, A.; Kovaleva, V.; Kaverin, D. Microbial Community Structure in Ancient European Arctic Peatlands. Plants 2022, 11, 2704. [Google Scholar] [CrossRef] [PubMed]
  6. Benavides, J.C.; Vitt, D.H.; Cooper, D.J. The High-Elevation Peatlands of the Northern Andes, Colombia. Plants 2023, 12, 955. [Google Scholar] [CrossRef] [PubMed]
  7. Denisenkov, V.P. Osnovy Bolotovedeniya [Basics of Swamp Science]; St. Petersburg University Publisher: St. Petersburg, Russia, 2000; 224p. [Google Scholar]
  8. Dobrovol’skaya, T.G.; Golovchenko, A.V.; Zvyagintsev, D.G. Analysis of ecological factors limiting the destruction of high-moor peat. Eurasian Soil Sci. 2014, 47, 182–193. [Google Scholar] [CrossRef]
  9. Drzymulska, D. Peat decomposition–shaping factors, significance in environmental studies and methods of determination; a literature review. Geologos 2016, 22, 61–69. [Google Scholar] [CrossRef]
  10. Mironycheva-Tokareva, N.P.; Kosykh, N.P.; Vishnyakova, E.K. Production and destruction processes in peatland ecosystems of Vasugan region. Environ. Dyn. Glob. Clim. Change 2013, 4, 1–9. [Google Scholar]
  11. Vishnyakova, E.K.; Koronatova, N.G.; Mikhaylova, E.V. Transformation of carbon and macroelements compounds in mire peat deposits of different nutritional status. Interekspo Geo-Sib.—Interexpo Geo Sib. 2017, 4, 137–140. [Google Scholar]
  12. Koronatova, N.G. An investigation of the peat decomposition in mires using method of incubation of dry and wet samples. Environ. Dyn. Glob. Clim. Chang. 2010, 1, 77–84. [Google Scholar]
  13. Filippova, N.V.; Glagolev, M.V. Short-term standard litter decomposition across three different ecosystems in middle taiga zone of West Siberia. IOP Conf. Ser. Earth Environ. Sci. 2018, 138, 012004. [Google Scholar] [CrossRef]
  14. Domisch, T.; Finer, L.; Laine, J.; Laiho, R. Decomposition and nitrogen dynamics of litter in peat soils from two climatic regions under different temperature regimes. Eur. J. Soil Biol. 2006, 42, 74–81. [Google Scholar] [CrossRef]
  15. Vanhala, P.; Karhu, K.; Tuomi, M.; Björklöf, K.; Fritze, H.; Liski, J. Temperature sensitivity of soil organic matter decomposition in southern and northern areas of the boreal forest zone. Soil Biol. Biochem. 2008, 40, 1758–1764. [Google Scholar] [CrossRef]
  16. Preston, M.D.; Smemo, K.A.; McLaughlin, J.W.; Basiliko, N. Peatland microbial communities and decomposition processes in the James Bay Lowlands, Canada. Front. Microbiol. 2012, 3, 70. [Google Scholar] [CrossRef] [PubMed]
  17. Kluber, L.A.; Johnston, E.R.; Allen, S.A.; Hendershot, J.N.; Hanson, P.J.; Schadt, C.W. Constraints on microbial communities, decomposition and methane production in deep peat deposits. PLoS ONE 2020, 15, e0223744. [Google Scholar] [CrossRef] [PubMed]
  18. Mastný, J.; Bárta, J.; Kaštovská, E.; Picek, T. Decomposition of peatland DOC affected by root exudates is driven by specific r and K strategic bacterial taxa. Sci. Rep. 2021, 11, 18677. [Google Scholar] [CrossRef] [PubMed]
  19. Kozlovskaya, L.S.; Medvedeva, V.M.; Piavchenko, N.I. Dinamika Organicheskogo Veshhestva v Processe Torfoobrazovanija [Dynamics of Organic Matter in the Process of Peat Formation]; Nauka LO Publisher: Leningrad, Russia, 1978; 172p. [Google Scholar]
  20. Kukharenko, O.S.; Pavlova, N.S.; Dobrovol’skaya, T.G.; Golovchenko, A.V.; Pochatkova, T.N.; Zenova, G.M.; Zvyagintsev, D.G. The influence of aeration and temperature on the structure of bacterial complexes in high-moor peat soil. Eurasian Soil Sci. 2010, 43, 573–579. [Google Scholar] [CrossRef]
  21. Hogg, E.H.; Lieffers, V.J.; Wein, R.W. Potential carbon losses from peat profiles: Effects of temperature, drought cycles, and fire. Ecol. Appl. 1992, 2, 298–306. [Google Scholar] [CrossRef]
  22. Barreto, C.; Lindo, Z. Decomposition in peatlands: Who are the players and what affects them? Front. Young Minds 2022, 8, 138–146. [Google Scholar] [CrossRef]
  23. Larionova, A.A.; Maltseva, A.N.; Lopes de Gerenyu, V.O.; Kvitkina, A.K.; Bykhovets, S.S.; Zolotareva, B.N.; Kudeyarov, V.N. Effect of temperature and moisture on the mineralization and humification of leaf litter in a model incubation experiment. Eurasian Soil Sci. 2017, 4, 422–431. [Google Scholar] [CrossRef]
  24. Chernova, I.Y. (Ed.) Functioning of Microbial Complexes in Upland Peat Bogs—Analysis of the Causes of Slow Destruction of Peat; The Partnership of Scientific Publications KMK Publisher: Moscow, Russia, 2013; 128p. [Google Scholar]
  25. Vishnyakova, E.K.; Mironycheva-Tokareva, N.P.; Kosykh, N.P. Decomposition Dynamics of Plants of Bogs (Data: Vasyugan Bog). Tomsk. State Pedagog. Univ. Bull. 2012, 7, 88–93. [Google Scholar]
  26. Berg, B. Decomposition patterns for foliar litter: A theory for influencing factors. Soil Biol. Biochem. 2014, 78, 222–232. [Google Scholar] [CrossRef]
  27. Nikonova, L.G.; Golovatskaya, E.A.; Kur’ina, I.V.; Kurganova, I.N. Decomposition rate of peat-forming plants in oligotrophic bogs of the southern taiga subzone of Western Siberia: Assessment of the effect of water table level and peat deposit temperature. Eurasian Soil Sci. 2019, 52, 1101–1111. [Google Scholar] [CrossRef]
  28. Leroy, F.; Gogo, S.; Buttler, A.; Bragazza, L.; Laggoun-Defarge, F. Litter decomposition in peatlands is promoted by mixed plants. J. Soils Sediments 2018, 18, 739–749. [Google Scholar] [CrossRef]
  29. Zhou, G.; Cao, W.; Bai, J.; Xu, C.; Zeng, N.; Gao, S.; Rees, R. Non-additive responses of soil C and N to rice straw and hairy vetch (Vicia villosa Roth L.) mixtures in a paddy soil. Plant Soil 2019, 436, 229–244. [Google Scholar] [CrossRef]
  30. Durynina, E.P.; Egorov, V.S. Agrochemical Analysis of Soil, Plants, Fertilizers; Moscow State University Publisher: Moscow, Russia, 1998; 113p. [Google Scholar]
  31. Vorob’eva, L.A.; Ladonin, D.V.; Lopukhina, O.V.; Rudakova, T.A.; Kiryushin, A.V. Chemical Soil Analysis. Questions and Answers; Moscow State University Publisher: Moscow, Russia, 2012; 186p. [Google Scholar]
  32. Giglev, V.Y. Physics of Soils; Perm State University Publisher: Perm, Russia, 2012; 37p. [Google Scholar]
  33. Kaurichev, I.S. Practical Work on Soil Science; Kolos Publisher: Moscow, Russia, 1980; 272p. [Google Scholar]
  34. Browning, B.L. Methods of Wood Chemistry; Intersci P Publisher: New York, NY, USA, 1967; Volume 2, 498p. [Google Scholar]
  35. Dence, C.W. The determination of lignin. In Methods of Lignin Chemistry; Springer Publisher: Berlin, Germany, 1992; pp. 33–61. [Google Scholar]
  36. Obolenskaya, A.V.; El’nitskaya, Z.P.; Leonovich, A.A. Laboratory Work on the Chemistry of Wood and Cellulose; Ekologiya Publisher: Moscow, Russia, 1991; 320p. [Google Scholar]
  37. Golovatskaya, E.A.; Nikonova, L.G. Decomposition of plant residues in peat soils of oligotrophic peatlands. Tomsk. State Univ. J. Biol. 2013, 3, 137–151. [Google Scholar]
  38. Nikonova, L.G.; Golovatskaya, E.A.; Terechshenko, N.N. Decomposition rate of peat-forming plants in the oligotrophic peatland at the first stages of destruction. IOP Conf. Ser. Earth Environ. Sci. 2018, 138, 012013. [Google Scholar] [CrossRef]
  39. Huang, Y.; Zou, J.; Zheng, X.; Wang, Y.; Xu, X. Nitrous oxide emissions as influenced by amendment of plant residues with different C:N ratios. Soil Biol. Biochem. 2004, 36, 973–981. [Google Scholar] [CrossRef]
  40. Ananyeva, N.D.; Susyan, E.A.; Ryzhova, I.M.; Bocharnikova, E.O.; Stolnikova, E.V. Microbial biomass carbon and the microbial carbon dioxide production by soddy-podzolic soils in postagrogenic biogeocenoses and in native spruce forests of the southern taiga (Kostroma oblast). Eurasian Soil Sci. 2009, 42, 1029–1037. [Google Scholar] [CrossRef]
  41. Kurganova, I.N.; Lopes de Gerenyu, V.O.; Gallardo Lancho, J.F.; Oehm, C.T. Evaluation of the rates of soil organic matter mineralization in forest ecosystems of temperate continental, mediterranean, and tropical monsoon climates. Eurasian Soil Sci. 2012, 45, 68–79. [Google Scholar] [CrossRef]
  42. Kurganova, I.; Lopes de Gerenyu, V.; Galibina, N.; Kapitsa, E.; Shorohova, E. Coupled effect of temperature and mineral additions facilitates decay of aspen bark. Geoderma 2018, 316, 27–37. [Google Scholar] [CrossRef]
  43. Kosheleva, Y.P.; Trofimov, S.Y. Characteristics of the biochemical composition of plant litter at different stages of decomposition (according to thermal analysis data). Biol. Bull. 2008, 35, 64–69. [Google Scholar] [CrossRef]
  44. Olson, J.S. Energy storage and the balance of producers and decomposers in ecological systems. Ecology 1963, 44, 322–331. [Google Scholar] [CrossRef]
  45. Kätterer, T.; Reichstein, M.; Andren, O. Temperature dependence of organic matter decomposition: A critical review using literature data analyzed with different models. Biol. Fertil. Soils 1998, 27, 258–262. [Google Scholar] [CrossRef]
  46. Chen, H.; Harmon, M.E.; Griffiths, R.P.; Hicks, W. Effects of temperature and moisture on carbon respired from decomposing woody roots. Ecol. Manag. 2000, 138, 51–64. [Google Scholar] [CrossRef]
  47. Bambalov, N.N.; Horuzhik, A.V.; Lukoshko, E.S.; Strigutsky, V.P. Transformation of dead plants in marsh biogeocenoses. In Experiment and Mathematical Modeling in the Study of Biogeocenoses of Forests and Bog; Nauka Publisher: Moscow, Russia, 1990; pp. 53–63. [Google Scholar]
  48. Hajek, T. Habitat and species controls on Sphagnum production and decomposition in a mountain bog. Boreal Environ. Res. 2009, 14, 947–958. [Google Scholar]
  49. Fioretto, A.; Di Nardo, C.; Papa, S.; Fuggi, A. Lignin and cellulose degradation and nitrogen dynamics during decomposition of three leaf litter species in a Mediterranean ecosystem. Soil Biol. Biochem. 2005, 37, 1083–1091. [Google Scholar] [CrossRef]
  50. Kosyh, N.P.; Mironycheva-Tokareva, N.P.; Parshina, E.K. Phytomass, production and decomposition of plant residues in oligotrophic bogs of the middle taiga of Western Siberia. Tomsk. State Pedagog. Univ. Bull. 2009, 3, 63–68. [Google Scholar]
  51. Gartner, T.B.; Cardon, Z.G. Decomposition dynamics in mixed-species leaf litter. Oikos 2004, 104, 230–246. [Google Scholar] [CrossRef]
  52. Hättenschwiler, S.; Tiunov, A.V.; Scheu, S. Biodiversity and litter decomposition in terrestrial ecosystems. Annu. Rev. Ecol. Evol. Syst. 2005, 36, 191–218. [Google Scholar] [CrossRef]
  53. Gessner, M.O.; Swan, C.M.; Dang, C.K.; McKie, B.G.; Bardgett, R.D.; Wall, D.H.; Hättenschwiler, S. Diversity meets decomposition. Trends Ecol. Evol. 2010, 25, 372–380. [Google Scholar] [CrossRef] [PubMed]
  54. Vos, V.C.; van Ruijven, J.; Berg, M.P.; Peeters, E.T.; Berendse, F. Leaf litter quality drives litter mixing effects through complementary resource use among detritivores. Oecologia 2013, 173, 269–280. [Google Scholar] [CrossRef]
  55. Fierer, N.; Craine, J.M.; McLauchlan, K.; Schimel, J.P. Litter quality and the temperature sensitivity of decomposition. Ecology 2005, 86, 320–326. [Google Scholar] [CrossRef]
  56. Davidson, E.A.; Janssens, I.A. Temperature sensitivity of soil carbon decomposition and feedbacks to climate change. Nature 2006, 440, 165–173. [Google Scholar] [CrossRef] [PubMed]
  57. Preston, C.M.; Nault, J.R.; Trofymov, J.A.; Smyth, C. Chemical changes during 6 years decomposition of 11 litters in some Canadian forest sites. Ecosystems 2009, 12, 1053–1077. [Google Scholar] [CrossRef]
  58. Prescott, C. Litter decomposition: What controls it and how can we alter it to sequester more carbon in forest soils. Biogeochemistry 2010, 101, 133–149. [Google Scholar] [CrossRef]
  59. Trofimov, S.Y.; Botner, P.; Kutu, M.M. Decomposition of organic matter of organogenic horizons of forest soils under laboratory conditions. Eurasian Soil Sci. 1998, 12, 1480–1488. [Google Scholar]
Figure 1. Samples of peat-forming plants (A) and glass flasks with samples for the incubation experiment (B,C).
Forests 14 02355 g001
Figure 2. Changes in the content of some biochemical components (∆, %) relative to their initial content in the peat-forming plants after 600 days of incubation experiments at different temperatures (22, 12, and 2 °C) and moisture levels (30, 60, and 90% of their water holding capacity). Eth-Ext—ethanol-soluble compounds, Cel—cellulose, Lig—lignin and lignin-like substances.
Forests 14 02355 g002
Figure 3. Total energy cost for thermal oxidation of peat-forming plants at 160–610 °C (A) and the T50w index (temperature at which 50% of the total plant weight is lost); (B) before (initial) and after a 600-day incubation experiment at 22 °C and moisture level corresponding to 90% of their WHC. 1—Sphagnum fuscum; 2—Eriophorum vaginatum; 3—Chamaedaphne calyculata; 4—Mixed sample.
Forests 14 02355 g003
Figure 4. Dynamics of the decomposition rate (DecR) of different peat-forming plants at a temperature of 22 °C and different moisture levels (W): 30, 60, and 90% of their water-holding capacity. Arithmetic mean and standard error are shown for each point.
Forests 14 02355 g004
Figure 5. Dynamics of decomposition rate (DecR) of different peat-forming plants at a temperature of 12 °C and different moisture levels (W): 30, 60, and 90% of their water-holding capacity. Arithmetic mean and standard error are shown for each point.
Forests 14 02355 g005
Figure 6. Dynamics of the decomposition rate (DecR) of different peat-forming plants at a temperature of 2 °C and different moisture levels (W): 30%, 60%, and 90% of their water-holding capacity. Arithmetic mean and standard error are shown for each point.
Forests 14 02355 g006
Figure 7. Cumulative losses of C(CO2) (Ccum; mg C/g plant substrate) from peat-forming plants at different temperatures (2, 12, 22 °C) and moisture levels corresponding to 30, 60, and 90% of their WHC. Arithmetic mean and standard error are shown for each sample.
Forests 14 02355 g007
Figure 8. The decay constant (k, day−1) of the main peat-forming plants under different combinations of temperature (2, 12, 22 °C) and moisture levels corresponding to 30, 60, and 90% of their WHC: 1—Sphagnum fuscum, 2—Chamaedaphne calyculata, 3—Eriophorum vaginatum, 4—mixed sample. Arithmetic mean and standard error are shown.
Forests 14 02355 g008
Figure 9. Temperature coefficient Q10 for the average DecR of various plant substrates in the temperature ranges of 2–12 and 12–22 °C and moisture levels corresponding to 30, 60, and 90% of their WHC over the various stages of incubation (0–60, 61–120, 121–180 days) 1—Sphagnum fuscum, 2—Chamaedaphne calyculata, 3—Eriophorum vaginatum, 4—mixed sample. The arithmetic for the mean and standard error for each sample are shown.
Forests 14 02355 g009
Table 1. Some properties of peat-forming plants before the experiment.
IndexAsh, %pHHM, %WHC 1, %
Plant 1M KClH2O
Sphagnum fuscum0.74 2.53.4 13.7 2541 ± 241
Eriophorum vaginatum2.25 4.3 4.8 3.9178 ± 3
Chamaedaphne calyculata2.234.5 4.97.6244 ± 1
Mixed sample1.533.73.0 9.3 1203 ± 55
1 Arithmetic mean ± standard error (SE), 3 replicates. HM is hygroscopic moisture, WHC is the water-holding capacity.
Table 2. Biochemical composition of peat-forming plants before the experiment.
IndexC *, %N *, %C/N *Eth-Ext 1, %Cel 2, %Lig 3, %Lig/N
Plant
Sphagnum fuscum44.0 ± 0.60.37 ± 0.01118 ± 13.925.312.232
Eriophorum vaginatum45.4 ± 0.40.93 ± 0.0149 ±0.111.335.320.322
Chamaedaphne calyculata51.8 ± 1.11.15 ± 0.0345 ± 133.412.128.524
Mixed sample46.2 ± 0.70.66 ± 0.0170 ± 019.219.220.832
* Arithmetic mean ± SE (5 replicates), 1 ethanol extracts; 2 cellulose; 3 lignin and lignin-like substances.
Table 3. Weight loss (%) of peat-forming plants before (initial) and after a 600-day incubation experiment at 22 °C and moisture level corresponding to 90% of their WHC in the different temperature ranges during the thermal decomposition.
PlantVariantTemperature Range, °C
35–150150–265265–380380–495495–610610–725
Sphagnum fuscumInitial10.3914.1539.5532.411.21-
Post-exper.8.2314.0642.3831.950.52-
∆, %−2.16−0.092.83−0.46−0.69-
Eriophorum vaginatumInitial6.969.6446.5227.34.710.18
Post-exper.5.228.4247.7528.285.970.07
∆, %−1.74−1.221.230.981.26−0.11
Chamaedaphne calyculataInitial6.969.6233.8018.1717.3410.33
Post-exper.6.517.7134.7422.4816.584.58
∆, %−0.45−1.910.944.31−0.76−5.75
Mixed sampleInitial8.9012.5939.6033.092.070.28
Post-exper.7.9811.6743.7929.41.80.47
∆, %−0.92−0.924.19−3.69−0.270.19
∆ is the difference between the mass loss of peat-forming plants after incubation experiments and their initial samples.
Table 4. The variance percentage (η,%) is explained by the influence of the type of plant material (P), temperature (T), moisture level (W), or their interactions on the cumulative loss of C(CO2).
Factor90 Days of Incubation180 Days of Incubation360 Days of Incubation600 Days of Incubation
η, %Fpη, %Fpη, %Fpη, %Fp
P61.0450<0.000154.7204<0.000168.8125<0.000175.995.8<0.0001
T31.2230<0.000136.6136<0.000120.237<0.000112.415.6<0.0001
W2.115<0.00013.112<0.00014.070.0014.65.80.004
P × T4.332<0.00013.613<0.00013.26<0.00012.63.20.007
P × W0.640.0010.730.0181.020.1170.30.40.858
T × W0.320.1290.310.3750.710.3040.91.20.329
P × T × W0.430.0010.730.0051.630.0022.53.10.001
UV0.1 0.3 0.6 0.8
UV: unexplained variance.
Table 5. The variance percentage (η, %) is explained by the influence of temperature (T), moisture level (W), or their interaction (T × W) on the cumulative loss of C(CO2) in samples of various peat-forming plants during 600 days of degradation.
FactorSphagnum fuscumChamaedaphne calyculataEriophorum vaginatumMixed Sample
η, %pη, %pη, %pη, %p
T82.06<0.000173.93<0.00016.120.7074.85<0.0001
W16.31<0.000113.560.0819.930.3310.290.27
T × W1.300.027.910.1957.270.037.450.43
UV0.33 4.61 16.68 7.41
UV: unexplained variance; a significant influence of a factor(s) is highlighted in bold (p < 0.05).
Disclaimer/Publisher’s Note: The statements, opinions and data contained in all publications are solely those of the individual author(s) and contributor(s) and not of MDPI and/or the editor(s). MDPI and/or the editor(s) disclaim responsibility for any injury to people or property resulting from any ideas, methods, instructions or products referred to in the content.

