1. Introduction
In the face of a rapidly changing climate, there is an ever-present and pressing need for an unparalleled global effort to mitigate its adverse impacts. Densely urbanized and populated cities stand at the forefront of this crucial endeavor [
1].
Even though cities occupy a mere sliver of the Earth’s surface (less than 2%), they house over half of the global population, a number that is on the rise [
2,
3,
4]. The shift in urban land use, coupled with industrial operations, traffic movement, and other city activities, has intensified carbon dioxide emissions [
5]. These factors are often viewed as primary catalysts for global climate shifts [
6,
7].
With the significant growth of urban populations, urban green infrastructure (GI) [
8,
9], particularly trees, has been suggested as the most viable option for approaching thermal regulation [
10]. Green infrastructure (GI) has thus been emerging as a key strategy to enhance the adaptive capabilities of cities to climate change, as it can alleviate urban heat islands and consequently reduce thermal stress for the population [
11]. In this context, this article focuses on the role of urban green spaces in regulating temperatures within urban environments, examining how various spatial configurations influence thermal characteristics.
As cities expand and natural terrains are supplanted by artificial structures, diverse urban patterns emerge. Grasping these evolving urban ecosystems and their climatic implications is essential, demanding a comprehensive and cohesive approach. As articulated by [
12], cities represent intricate adaptive systems, interlinking socio-economic–political, ecological–biophysical–climatic, and technological infrastructural dimensions. Echoing Lévi-Strauss, a city epitomizes the zenith of human creativity, standing at the crossroads of nature and artifice [
13] (p. 137), [
14] (p. 3). Within this framework, these interlaced systems exhibit dynamism, often manifesting unpredictably and non-linearity. The unpredictability inherent to urban planning, governance, and ecology offer opportunities to elevate urban living standards and overall city habitability [
5,
15]. This vision aligns with the aspiration for sustainable urban landscapes, shaped by a society cognizant of its transformative influence on spaces [
16,
17].
In this environment, the prominence of “urban heat islands” (UHIs), indicative of localized heating in urban areas relative to their rural counterparts, becomes understandable. While their basic definition makes UHIs a focal point of urban climate research, the intricacies within gray, green, and blue urban zones often elude many researchers and experts not deeply engaged in urban climate studies within the realms of planning and design [
6,
18,
19,
20,
21,
22]. Hence, addressing UHI effects through strategic green space layouts and eco-friendly urban designs is gaining traction as a pivotal climate change response [
21,
23,
24].
Although urban ecologists collaborate in growing numbers with researchers from other scientific areas—engineers, geographers, designers, architects, planners, and industrial ecologists [
4]—there is a need for a more holistic study on sustainable urbanism, or even for what can be named climate-resilient urban planning and design [
5]. Research on urban morphology focuses on the search for instruments that support the planning and designing of a city, and the relationship that can be observed between the different components of a city—grey, green, and blue. The way in which the organization of different spaces in a city, and the imperviousness of large urban areas, lead to the modification of urban climates, with a particular impact on the air temperature [
21,
25], is the focus of the present work.
Urban forests are networks and systems of woodlands, groups of trees, and individual trees in both urban and peri-urban areas, including street trees, trees in parks and gardens, as well as those in derelict spaces, which play a pivotal role in green infrastructure [
26]. Together with water features, these urban forests are highly effective in modulating urban microclimates, thereby providing a tangible adaptive capacity to urban challenges [
26]. As part of the green/blue infrastructure, they provide resilience to urban climate change [
24,
25]. Furthermore, they play a role in providing shade, facilitating evapotranspiration, moderating wind speeds, offering protection during severe weather episodes, decreasing water runoff, mitigating flooding, and enhancing air purity [
27,
28].
As urbanization intensifies, the importance of “Urban Green Infrastructure”—a concept that has gained increasing prominence in academic research, urban planning, and landscape design—becomes more pronounced [
29]. This is particularly relevant in the European context, where such infrastructure is integral to sustainable urban development strategies. In Portugal, this approach aligns with the principles of the National Ecological Structure, exemplifying a commitment to preserving and enhancing ecological networks within urban environments [
30]. Understanding the distinct thermal behaviors within urban green zones aids in fine-tuning spatial layouts that ought to be emphasized in eco-friendly urban design and in managing a city’s thermal balance [
20,
25,
31].
This contributes to the development of an interdisciplinary and holistic approach to the process of planning, designing, and building humanized and sustainable cities [
29]. Starting at the early planning stages, such an approach can be decomposed into the different physical and environmental components that substantiate the complex global systems [
32]. The research agenda in the context of urban sustainability should therefore embrace the unique knowledge derived from urban ecosystems, while always ensuring the integration of human and natural components, and incorporating science with urban design and governance [
33,
34]. This approach leads to a better design of urban environments, supported by the evidence provided in scientific research.
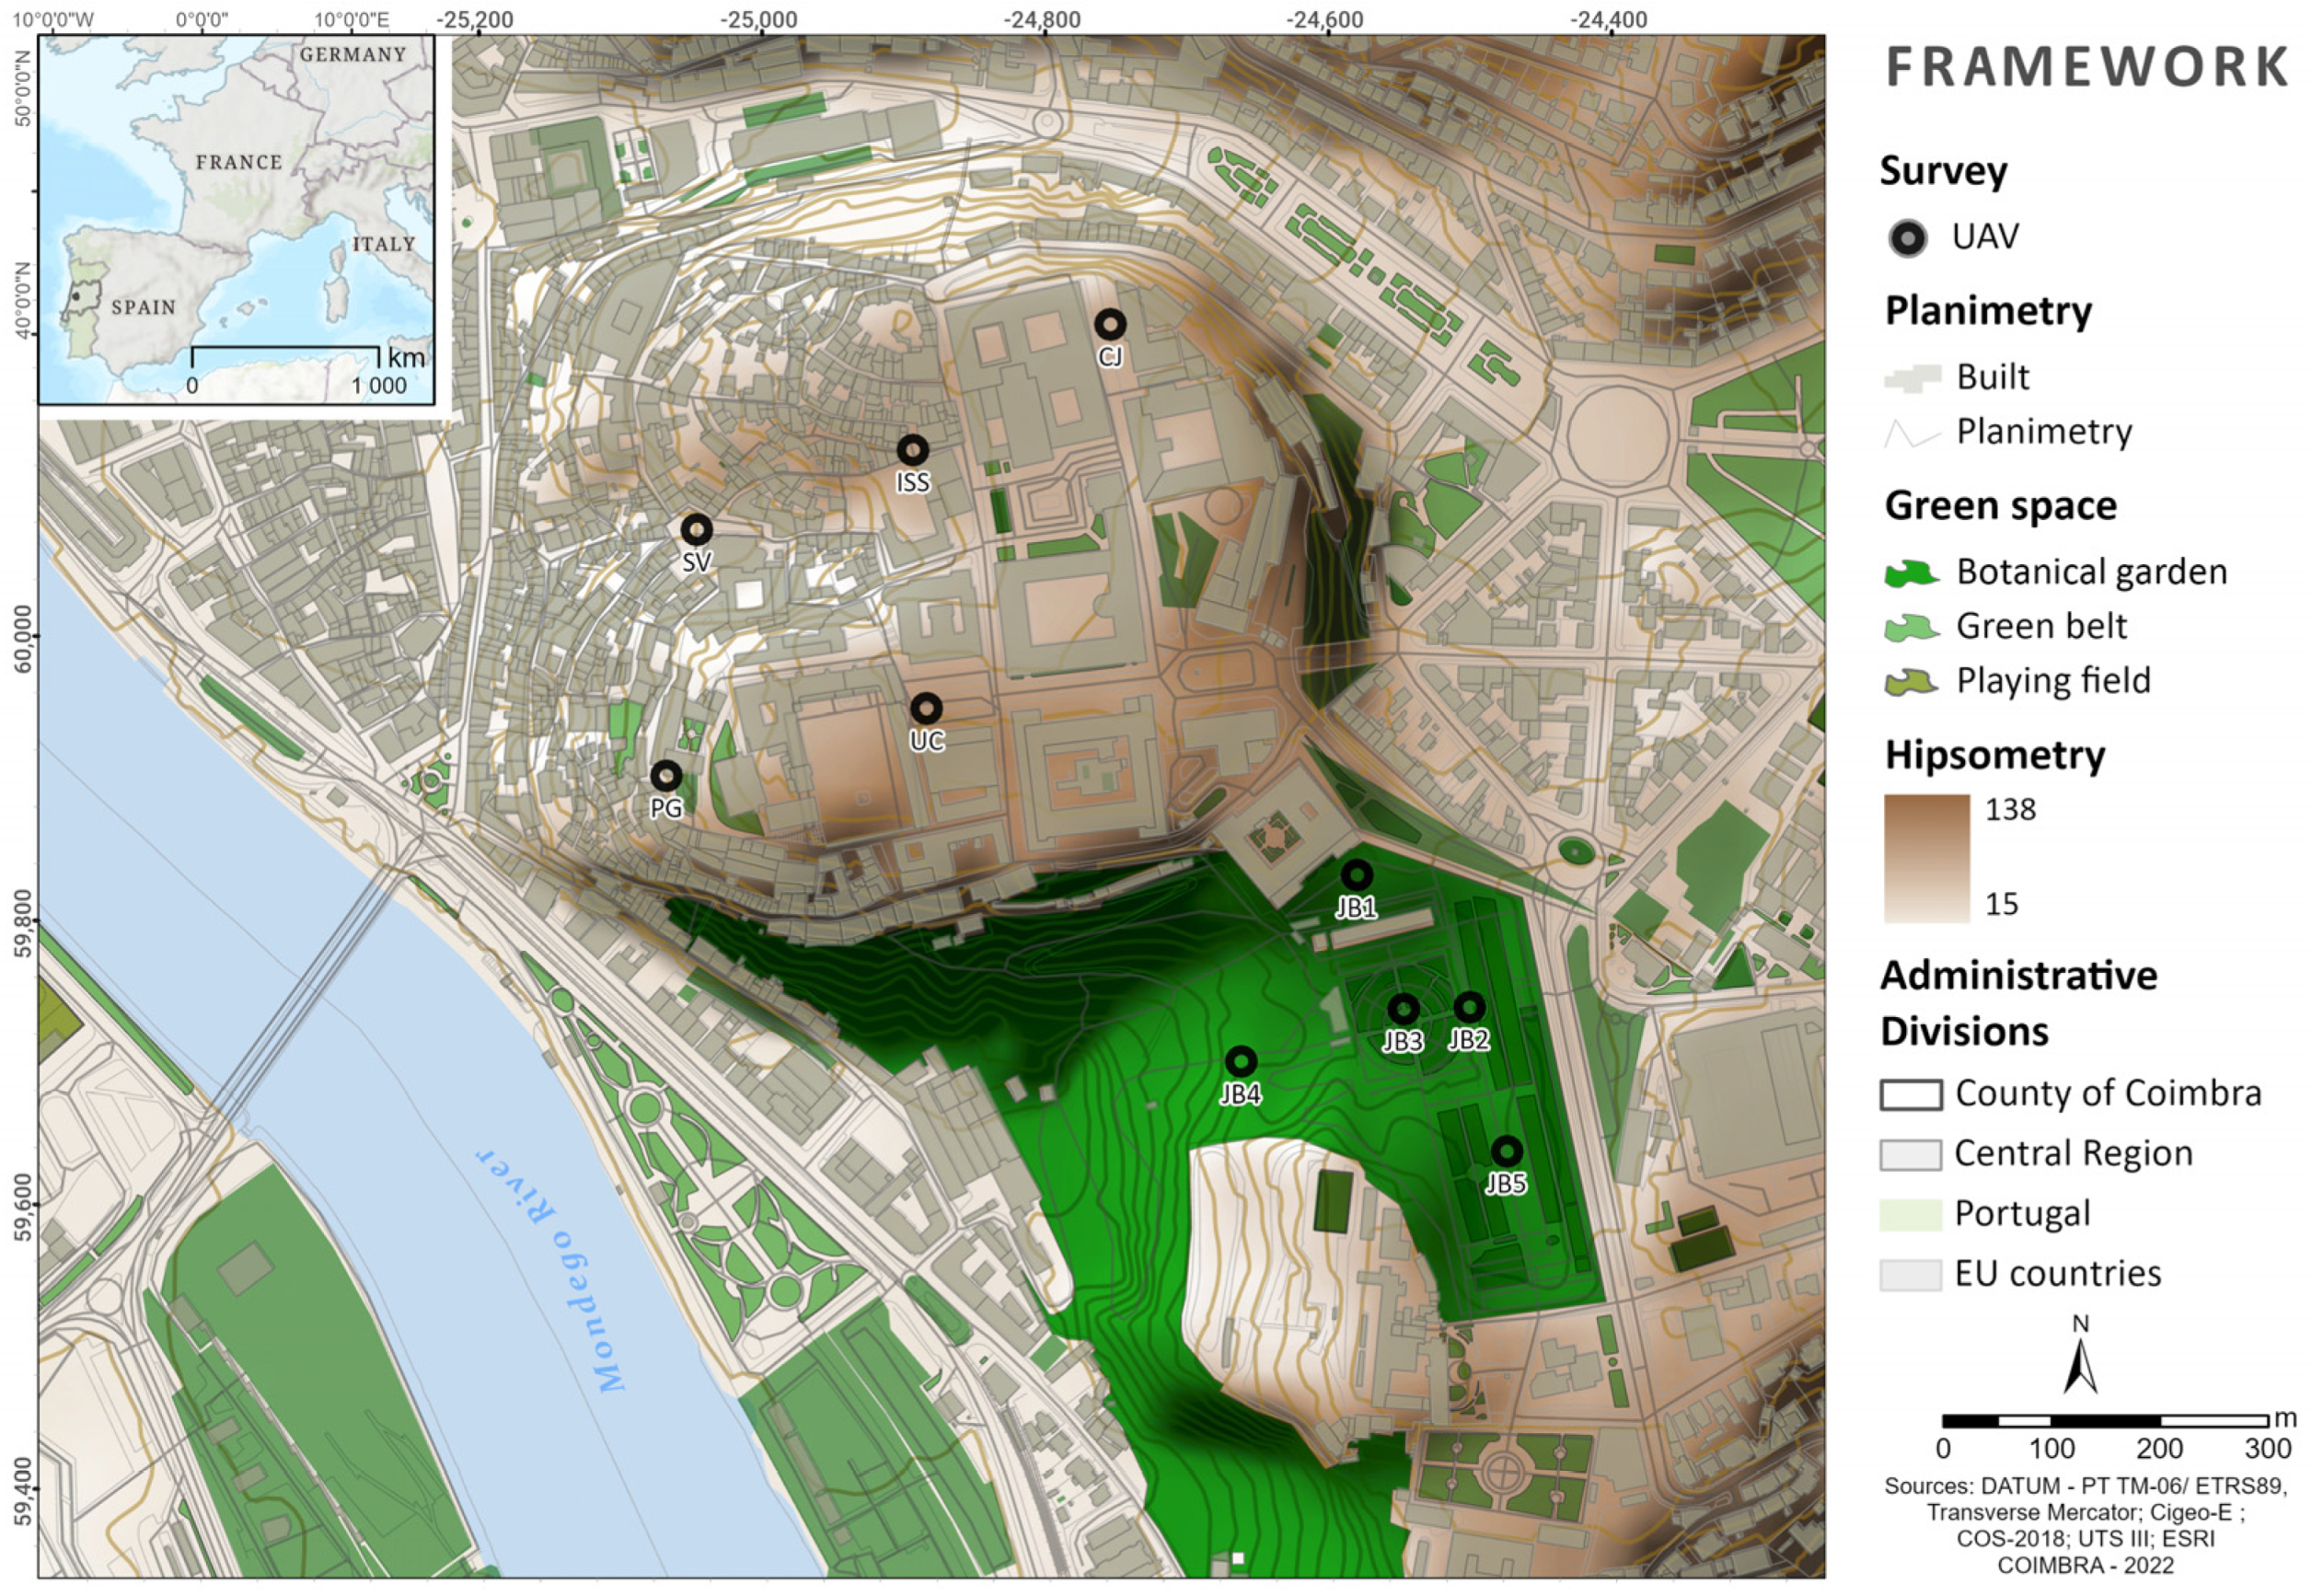
Therefore, aiming at understanding the extent of the urban heat island (UHI) effect and its relationship with green and blue spaces in a city throughout the day (morning, afternoon, and night), an empirical study was conducted in Coimbra (Portugal), beginning in 2019. This study was initially designed to overcome the challenges met in acquiring nocturnal data, as well as vertical data, from the lower atmosphere, which are limitations often associated with satellite data collection methodologies.
While this study predominantly concentrates on the capacity of urban green spaces to regulate and reduce surface air temperatures, it also delves into discerning the vertical thermal shifts across varied spatial configurations in these green areas. Additionally, the research probes the interplay between these lush urban environments and their neighboring built-up regions, areas where the phenomenon of the urban heat island effect is well-documented [
20,
35,
36,
37]. By identifying the distinct thermal mosaics within a green space, researchers and urban designers can strategize to optimize the spatial configurations that should be prioritized in green infrastructure planning for a sustainable city, with a specific focus on thermal regulation [
34]. Green spaces are recognized for their role in providing bioclimatic comfort and bolstering urban climate resilience, particularly by offering cooler temperatures during periods of elevated heat, such as summer months or heatwaves, which are increasingly prevalent in the context of global climate change [
29,
38,
39,
40]. This study, therefore, provides a crucial underpinning for the development of efficient strategies of urban green space management, aiming at enhancing a city’s climate resilience.
3. Results
3.1. Surface Temperatures at the City of Coimbra
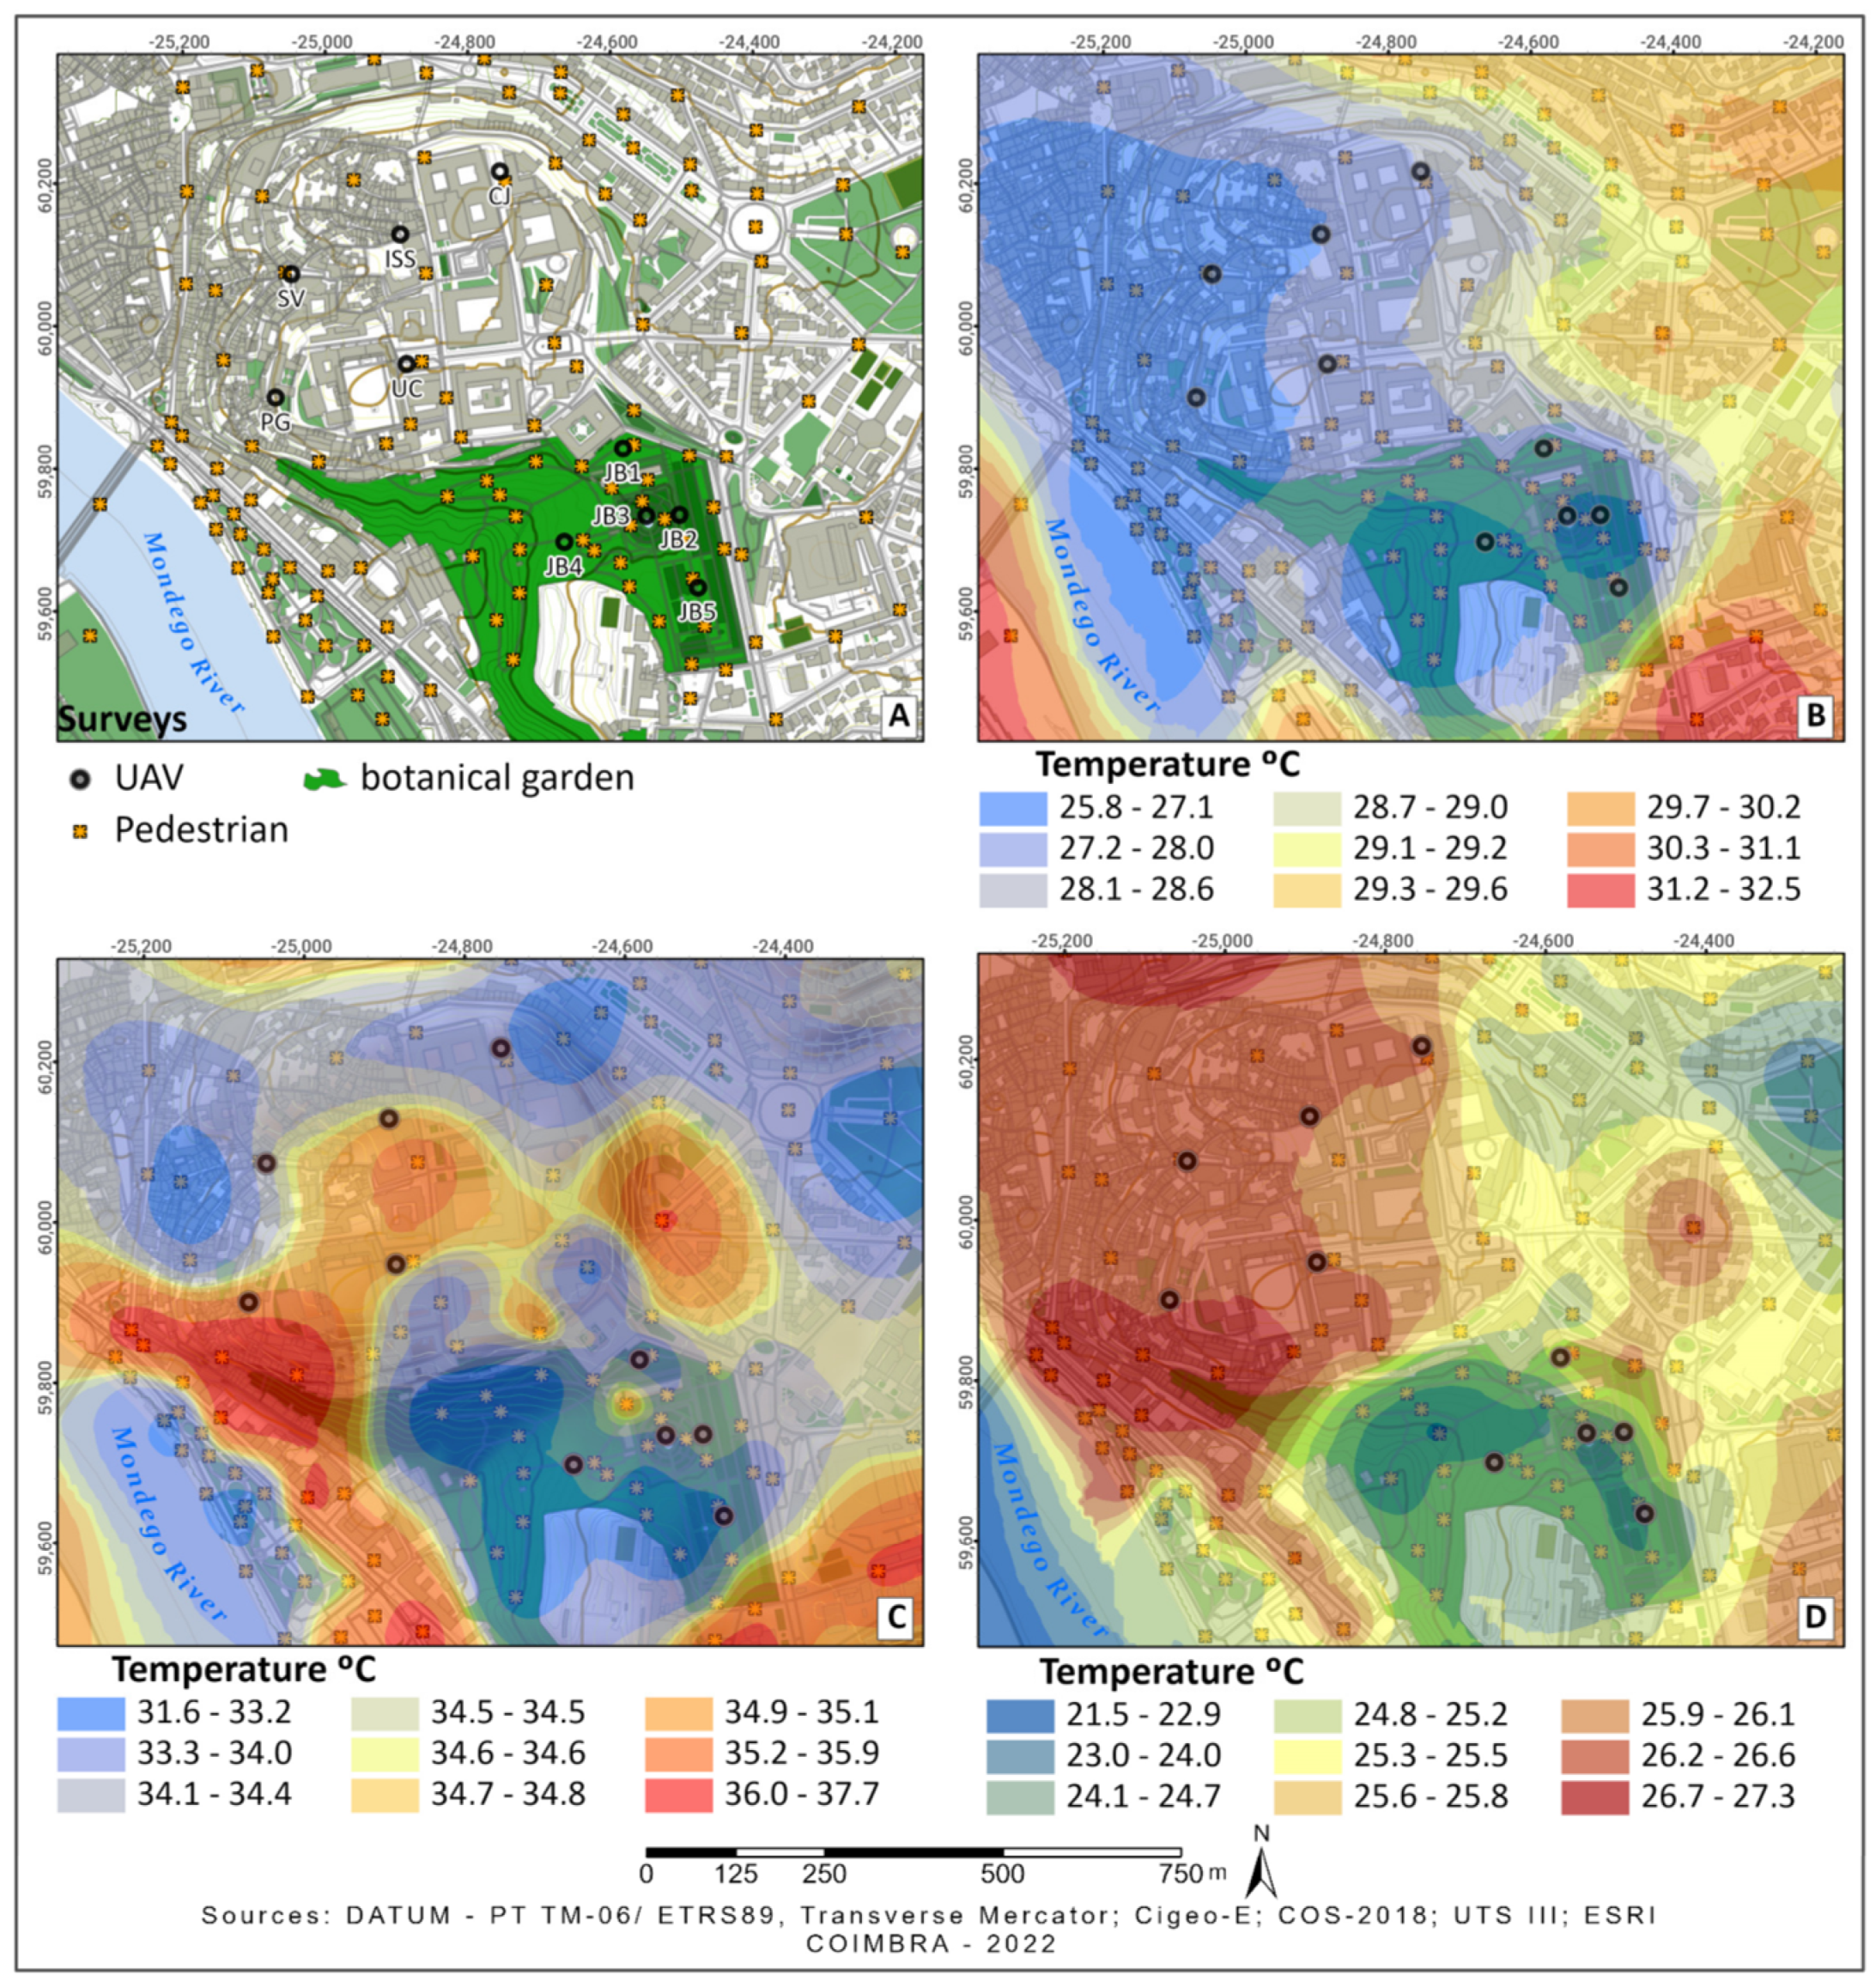
Figure 3 shows the data from one of the surveyed days (27 May 2021). This is a representative day for the surveyed routes, which surveys took place during the spring/summer months. Considering that the analysis was undertaken in the morning (
Figure 3B—09:00), in the afternoon (
Figure 3C—15:00), and at night (
Figure 3D—22:00), it is possible to verify that each surveyed point presents different characteristics, namely, thermal amplitudes. The routes taken during the early morning (
Figure 3B) show the effect of the nocturnal cooling provided by the water table of the river Mondego and by the Botanical Garden. In the same period, the hottest sectors (32 °C) were the ones exposed to the sun from dawn. This is visible in the north and east ridges of the city. Distinctively, the routes taken in the hottest period of the day (
Figure 3C) resulted in a map presenting higher thermal contrasts. It reveals an asymmetry between the surface temperatures measured in densely urbanized areas and in areas with higher prevalence of green spaces, and with increased tree density. In the urban areas, the temperatures measured were around 35 °C, while in the green areas they were around 32 °C (a thermal range of up to 6 °C in both extremes). Following the night survey (
Figure 3D), the map perfectly showcases the urban heat island of Coimbra, the thermal behavior of which was previously identified by Nuno Ganho [
35,
41]. Urbanized and densely built or paved areas are warmer. This behavior is distinctly observed in areas such as University Hill and Conchada Ridge, a finding consistent with preceding survey campaigns. Moreover, the mapping elucidates the critical role of urban green spaces in fostering “fresh air cells”. These cells are prominently identifiable in locations like the Botanical Garden, Santa Cruz, the riverside Urban Green Park, and along the Mondego River itself.
3.2. The Thermal Regulator Role of Selected Urban Green Spaces
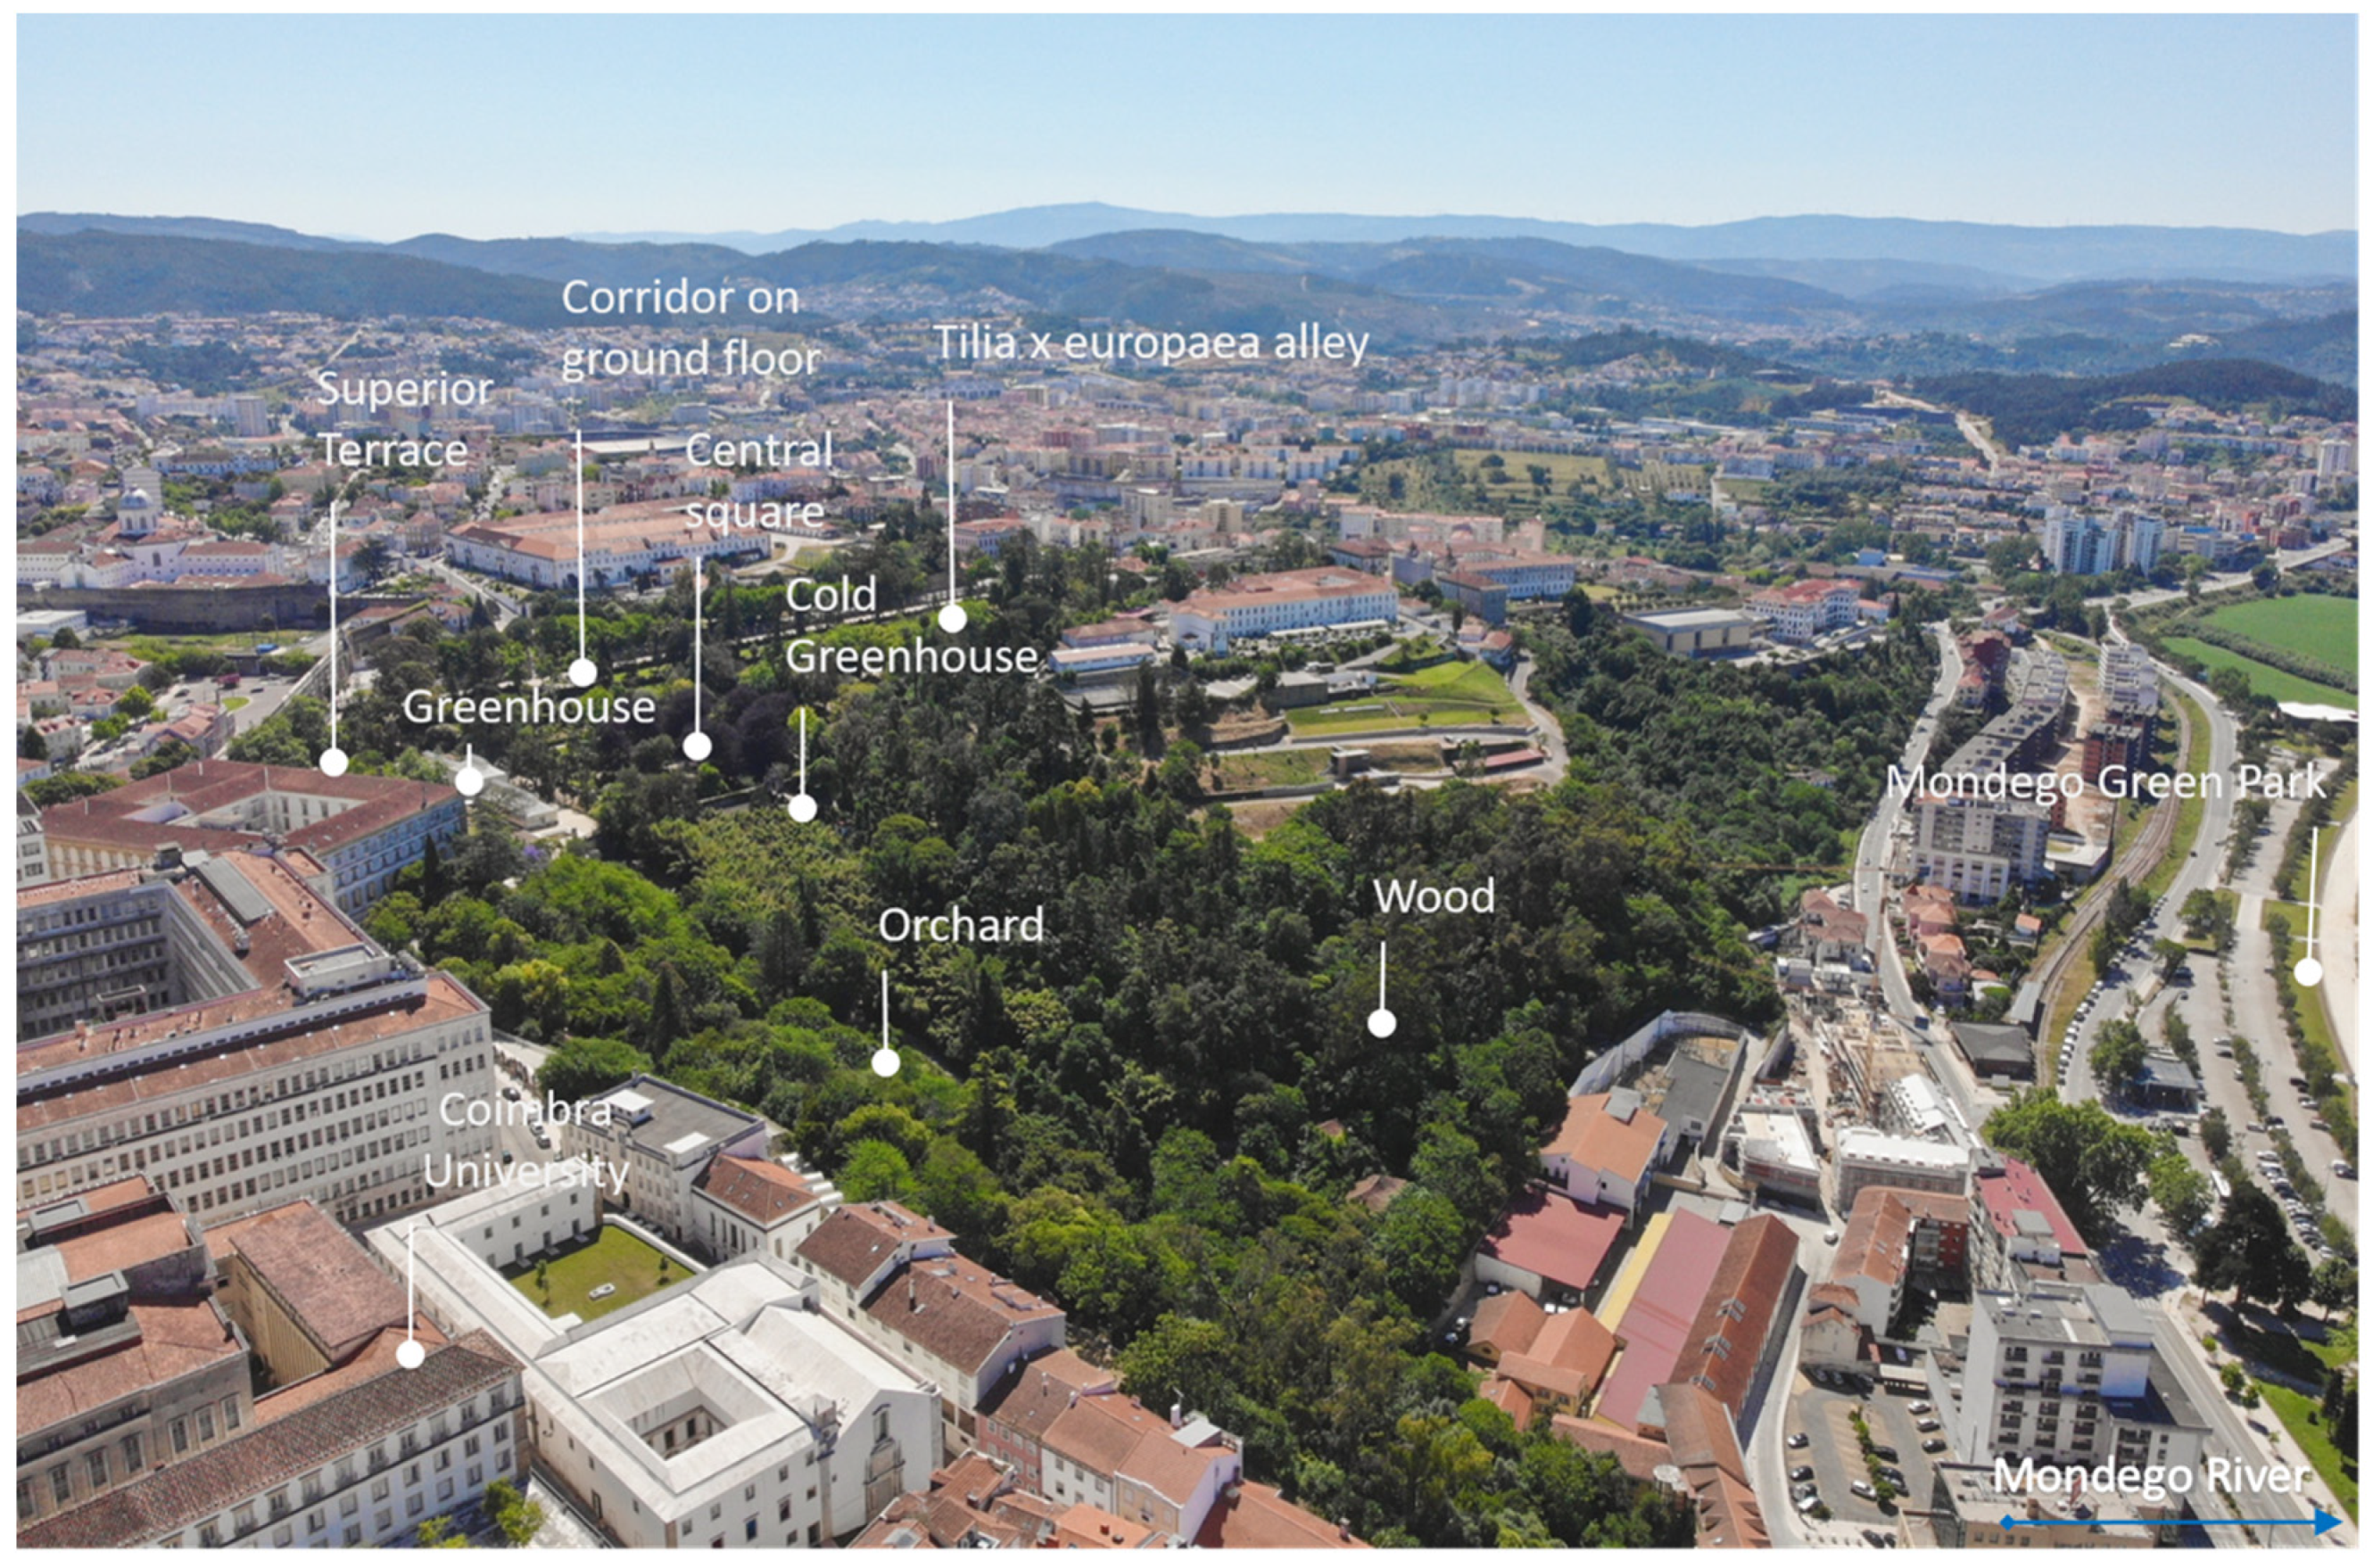
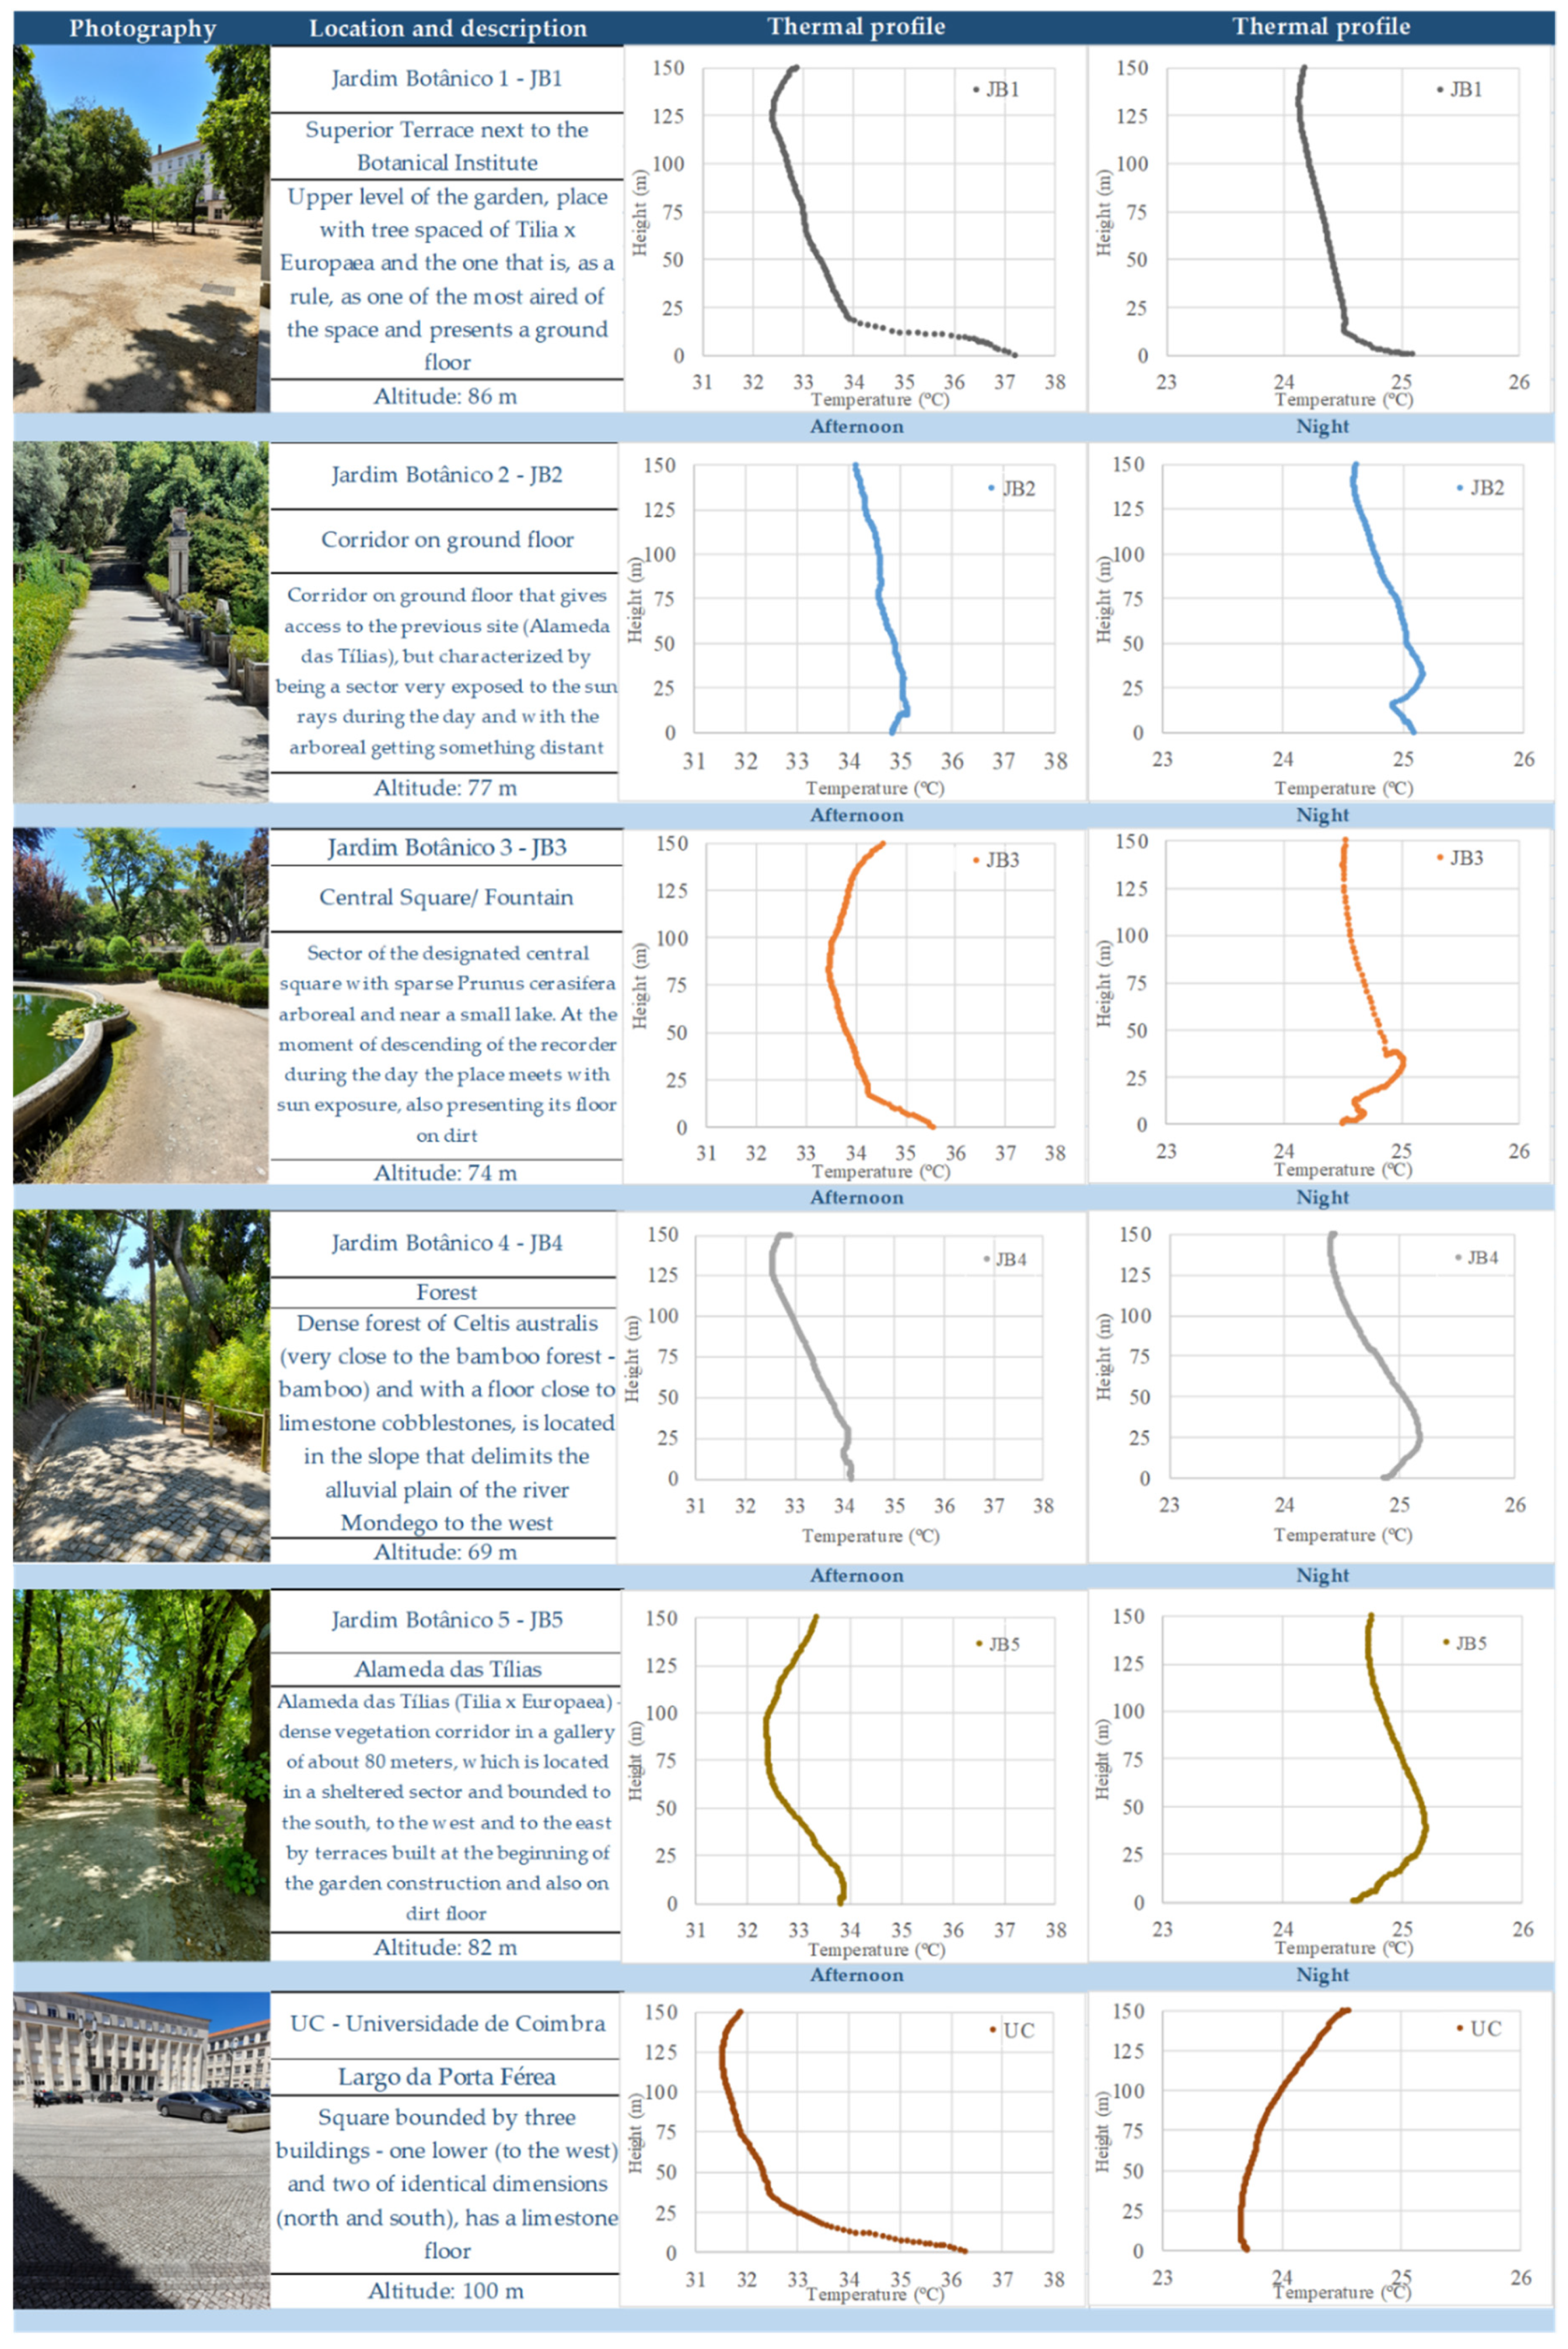
The surface temperature results reveal the potential for a more intricate and smaller-scale study to explore the thermal regulation role of green spaces in Coimbra. Utilizing the Botanical Garden as a “study laboratory” facilitated an understanding of the impacts of varying spatial tree patterns on surface temperatures and temperature variations at different altitudes (
Figure 4). In this second scale of analysis, beyond the Botanical Garden, data were also gathered from other small-scale green spaces, tree-lined streets, and densely urbanized zones to serve as comparative indices.
Sample points were strategically chosen based on data gathered during 2020 and 2021, and by analyzing the city’s various small-scale spatial patterns, with a particular focus on those within the Botanical Garden to ensure a diverse representation of green space types. These sample points aimed to be illustrative of both the similarities and differences observed in the urban green spaces of Coimbra. The selection criteria included factors such as density, typology, topography, ventilation, and surface materials. While species variation within green spaces was considered, it was not a primary parameter in our selection process (
Figure 4,
Figure 5 and
Figure 6).
Through analyses of the vertical temperature profiles (
Figure 7) recorded during the hottest period (15:00), it is possible to verify that, in cases where urban trees are sparse or absent, afternoon profiles show significant and rapid temperature losses in the first 20/30 m (profiles UC, JB1, JB3). This is a consequence of the sun directly heating the exposed surfaces.
However, in cases of higher tree density (profiles JB4, JB5), there is a reduced temperature drop of 1.5 °C in the first 100 m, which is significantly lower than those measured in the areas without trees. This phenomenon can be attributed to the evaporative cooling properties of trees. JB4 is mainly composed of Celtis australlis, and JB5 of Tilia × europaea. From an eco-physiological standpoint, these trees open their leaf stomata throughout the day. This adaptive mechanism facilitates evapotranspiration, enabling the optimal management of water and temperature. Consequently, there is a modest uptick in atmospheric humidity, which accounts for the observed elevated thermal inertia. Because of this, in the first 100 m of the night profiles there are only slight rises in temperature of 0.17 °C and 0.22 °C, respectively.
In the night profiles, the green spaces (profiles JB2, JB3, JB4, JB5) show a small temperature rise at the lower heights. This can also be explained by the greater thermal inertia provided by trees and their evaporative effect, which was functioning during the day. Even though leaf stomata close at night to prevent the trees from losing water, the humidity increase that can be seen during the day is still present in the early hours of the night. In contrast, JB1, an area with low tree density and larger paved areas, shows a continuous increase in temperature, with a profile similar to those of high-urban-density areas, but with smaller thermal variation. The UC profile presents a continuous increase in temperature with altitude, and shows the highest recorded thermal amplitude, thus showcasing the urban heat island effect.
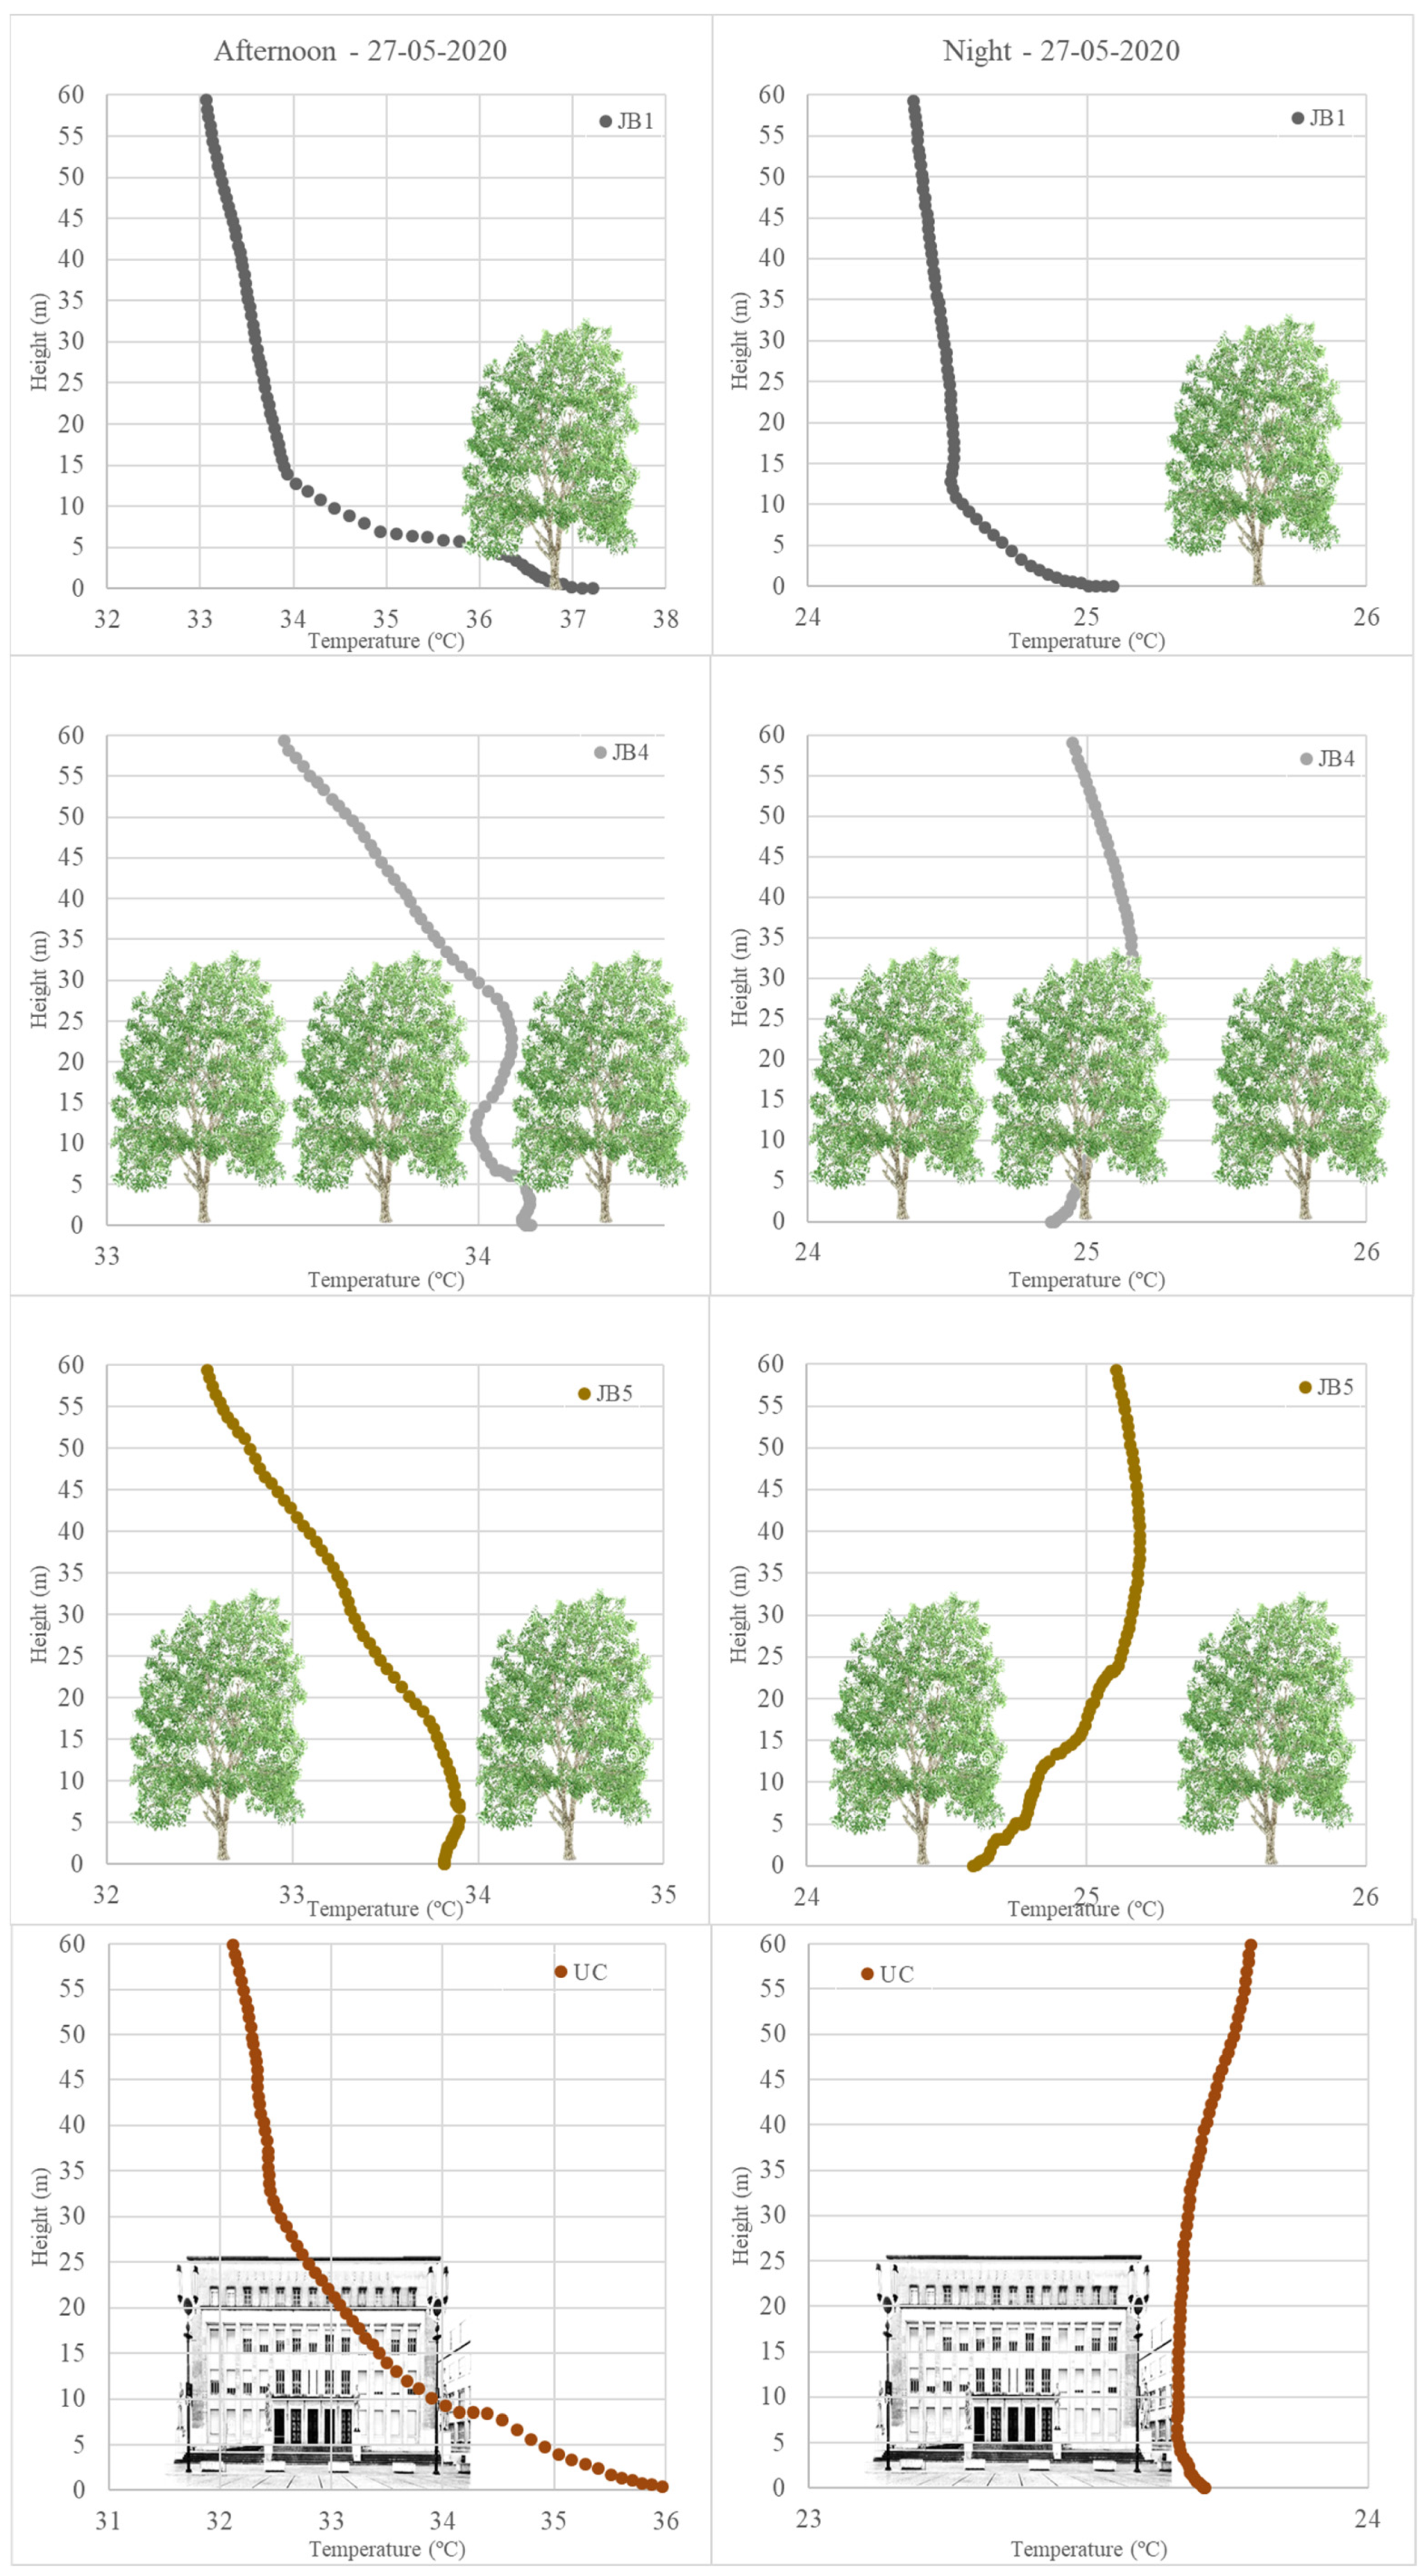
To gain a more nuanced understanding of thermal variations, our analysis was conducted at a detailed level, focusing primarily on the lower strata of the atmosphere—specifically the initial 60 m from the surface. This evaluation considered various thermal profiles, including UC (areas with no trees), JB1 (areas with very sparse trees), JB4 (a dense forest of Celtis australis), and JB5 (a dense tree alley with Tilia × europaea). It is important to acknowledge that the selection of these botanical compositions provides valuable insights into the thermal role of these sets of tree species and densities.
JB1 and UC offered identical profiles in the afternoon: surface temperatures of approximately 37 °C, with rapid temperature losses up to an altitude of 15 m (around 3 °C), and with a further attenuated decrease of 1 °C in the remaining 45 m analyzed. The strong irradiation observed seems to be the main reason for this rapid loss of temperature with altitude. These locations comprise different materials—limestone at UC and stabilized soil at JB1, both of which have strong albedo. Even though there are thermal similarities in the afternoon, the night profiles show differences. These reflect their different locations in the urban context, as was previously mentioned. Profile JB1 shows a temperature decrease below 1 °C across its area that is more significant in the first 10 m (0.5 °C). This is largely due to the irradiation of accumulated heat in the soil throughout the day. In profile UC, after the first 5 m where there is temperature loss due to the release of heat accumulated on the limestone floor, there is a very slight increase in the associated temperature (0.05 °C), similar to that which can be recognized in the profiles of dense urban spaces, where the urban heat island on the surface is measurable (
Figure 3D).
The regions with high tree density in the Botanical Garden (JB4, JB5) exhibit distinct thermal dynamics compared to areas with sparse tree coverage. This distinction arises from the trees’ capacity to absorb, reflect, and modulate solar radiation. In the early-night thermal profiles of JB4 and JB5, there is a noticeable temperature escalation from the ground up to approximately 30 m (the peak tree height). This pattern can be ascribed to the daytime evaporative cooling effect offered by the trees, coupled with the subsequent thermal inertia resulting from evapotranspiration and augmented atmospheric moisture. Beyond the tree canopy’s apex (30 m), stretching to 60 m above the ground, there is a marginal temperature decline.
The thermal regulation measured in the afternoon provided by the higher tree density can be compared to that identified in other studies [
44,
45]. The cooling effects of trees are evident not just from their shading capabilities, by which they intercept solar radiation, but also from their role in reducing energy absorption and storage in urban surfaces [
46,
47].
This can be further elucidated by highlighting evapotranspiration’s contribution to thermal inertia. Such phenomena have been distinctly showcased in the profiles crafted during this research. Specifically, thermal profiles JB4 and JB5 underscore the temperature-moderating properties of urban trees from the ground level upwards. It is apparent that urban green spaces tend to be cooler at the surface compared to predominantly paved regions with fewer trees, a phenomenon termed the park cool island (PCI) effect [
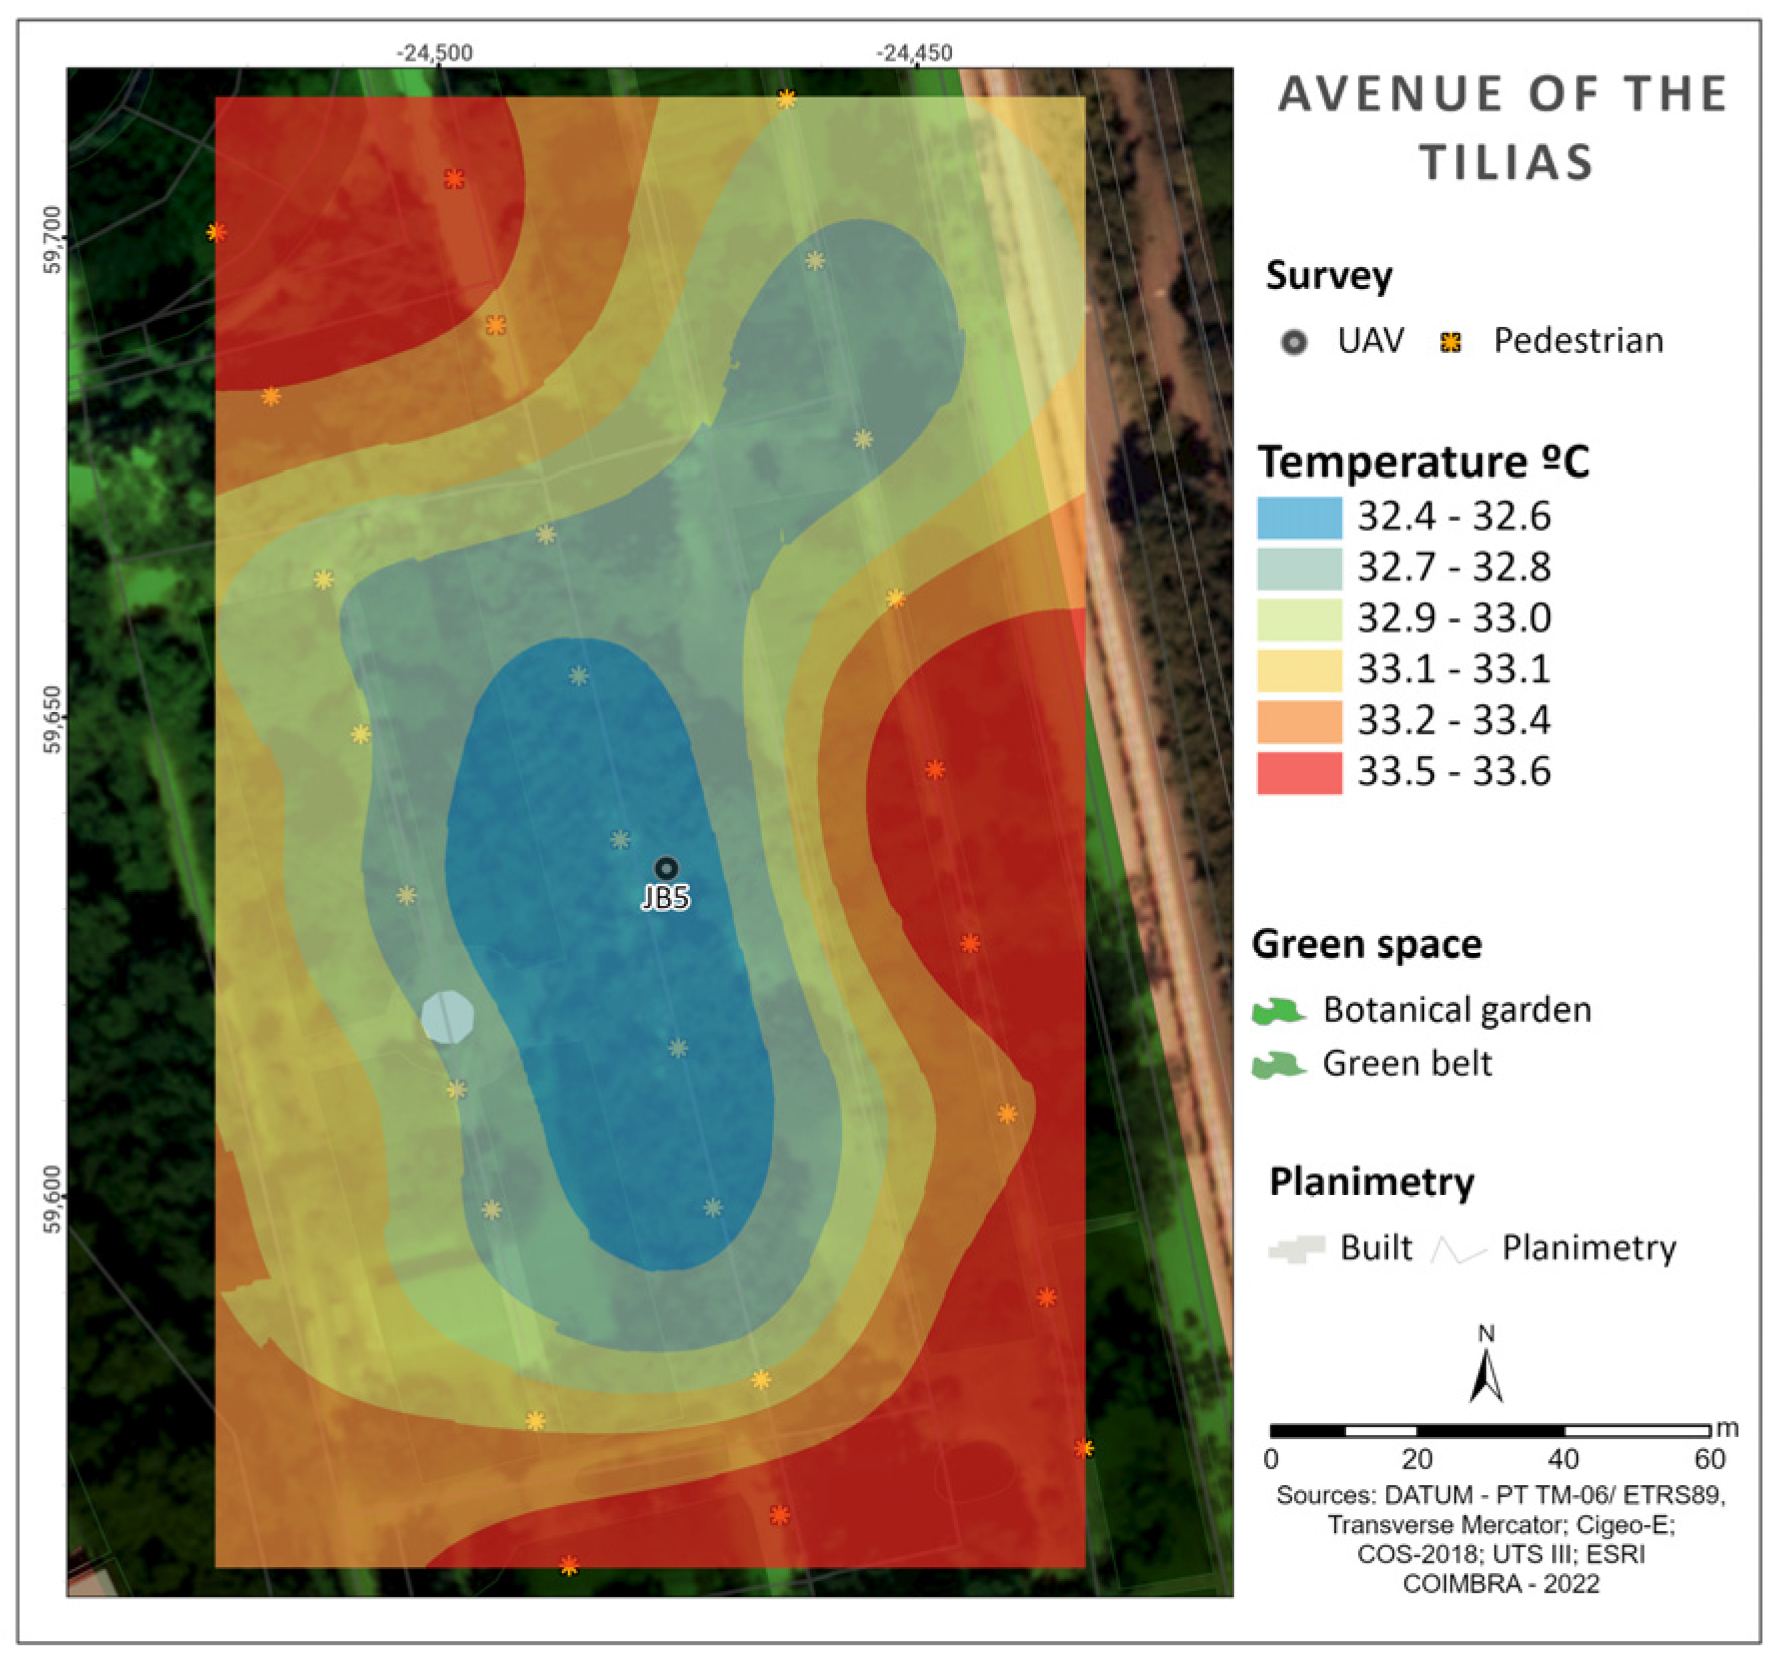
36]. Intriguingly, this cooling difference is even noticeable within green spaces that vary in tree density. As illustrated in
Figure 8, the temperature disparity between densely tree-populated areas and their adjacent, less dense counterparts (separated by less than 20 m) can be as significant as 1.3 °C, as documented in the 29 May 2020 survey at “Tilia alley” (JB5).
4. Discussion
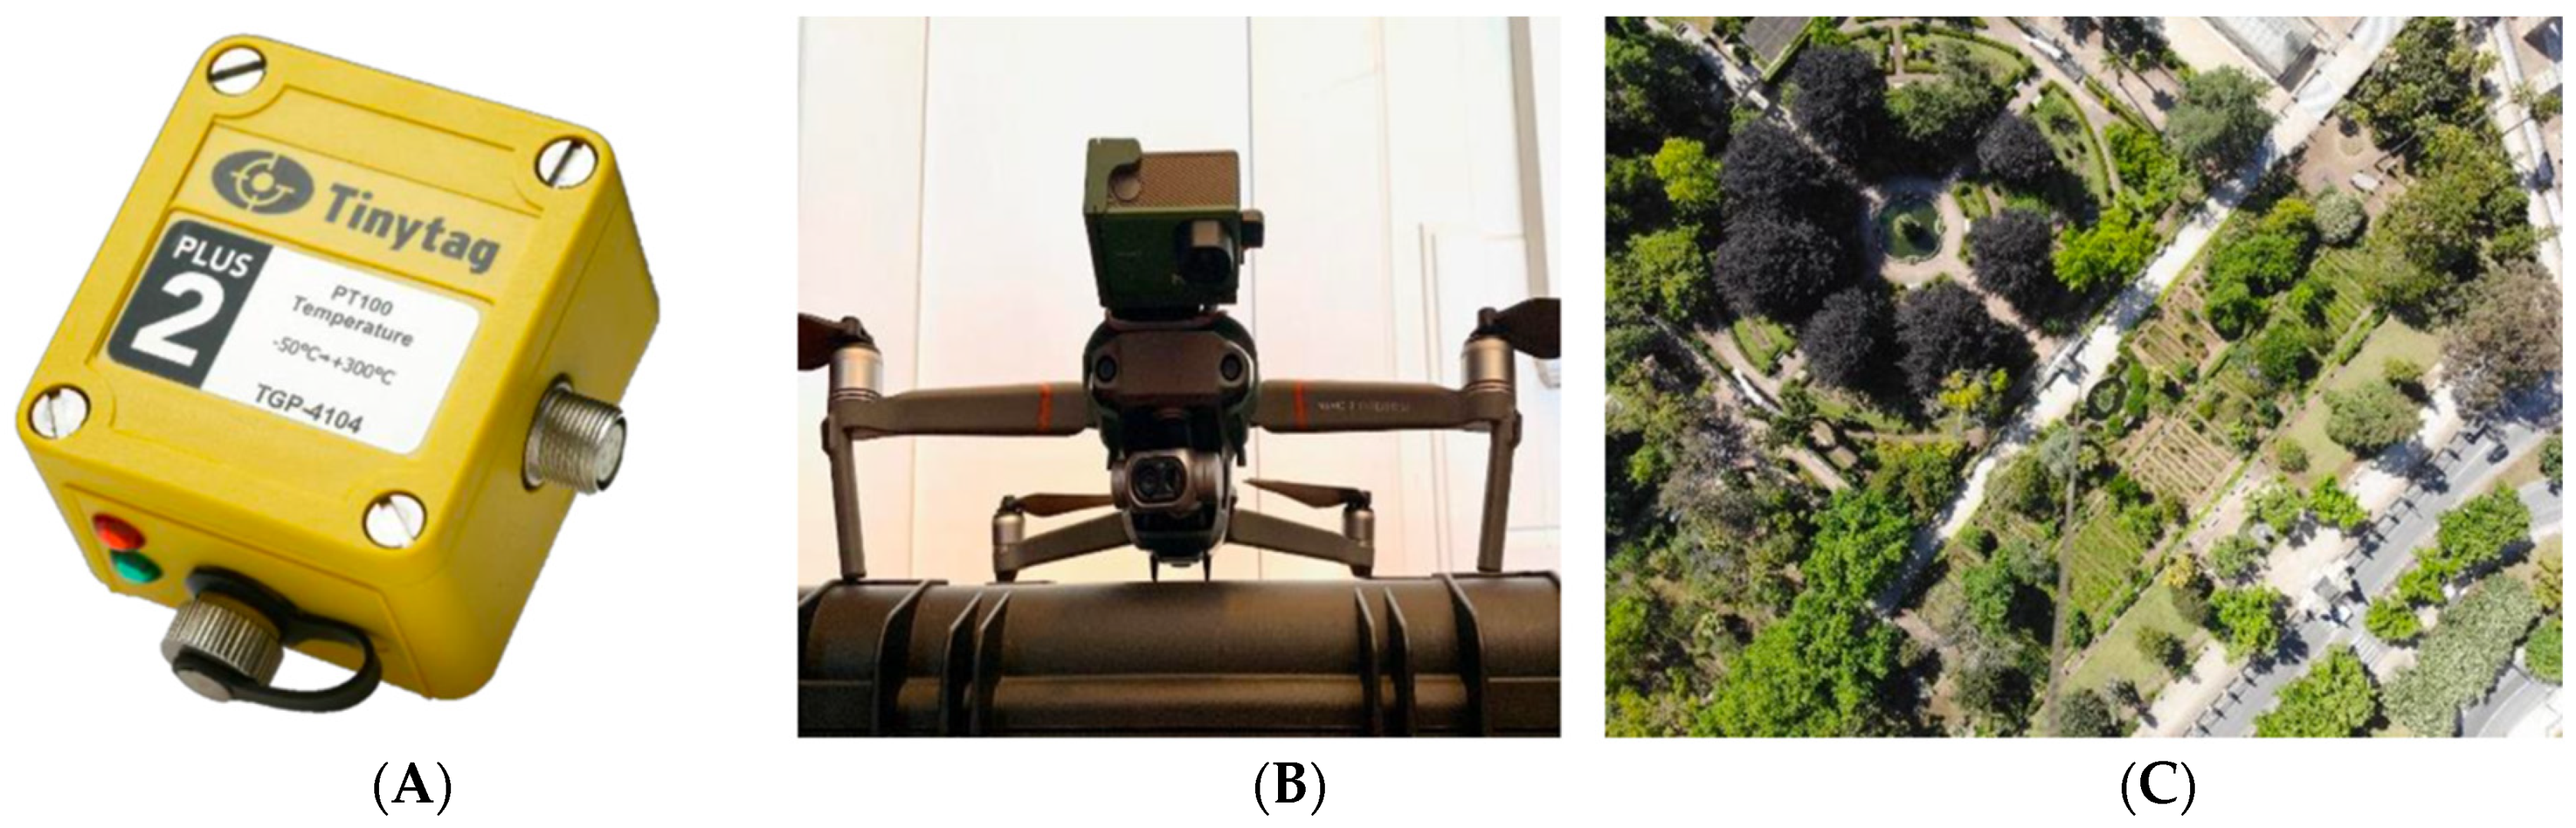
Addressing urban resilience to climate change, along with carbon sequestration, ranks among the most pressing societal issues leading up to 2050. This research embarked on a detailed exploration of how the planning of urban green structures influences thermal conditions, extending from the surface to the vertical layers of the lower atmosphere. The study was conducted during high-temperature anticyclonic days in Coimbra, Portugal. Research was developed through analytical maps using Kriging methods, with data collected at over 183 sample points located 1.5 m above ground level. This study integrated vertical air temperature measurements collected using Unmanned Aerial Vehicles (UAVs), with continuous sampling between 0 and 225/250 m, carried out three times a day—morning, afternoon, and evening; although, in this paper, only the afternoon and evening surveys were analyzed.
For surface temperatures, although this paper was restricted to data collected during one of the 2021 campaigns amid a heatwave (end of May), the cartograms highlight the need for a more refined analysis of urban morphology in certain sectors, particularly in terms of observed thermal contrasts between grey and green areas. In this regard, during the hottest part of the day, we see a temperature variation between the more densely built sectors and green zones that can reach 6 °C, and at night, a stark demarcation of the urban heat island in the hilltop (University of Coimbra) and Botanical Garden areas is noticeable, showing a temperature difference that can reach 4 °C. The factor of tree vegetation is highly decisive here.
However, a particularity that demands further study in the sector between the two analyzed gardens has been observed. Indeed, throughout the campaigns conducted since 2019, evidence has arisen of the reduced spatialization of the influence area of arboreal green spaces, considering the size of these two spaces—a fact emphasized by the existence of a sector quite close to each of them (250 m) with higher temperatures (cf.
Figure 3C). This is a result of the morphology, and arises from the development of these gardens in small valleys separated by a mildly significant interfluve where temperatures are, typically, higher. In this context, and as studies have shown, the green spaces of Coimbra play a fundamental role in substantially diminishing the phenomenon of urban heat islands, a trend noticeable during the day and which is even more pronounced at the beginning of the night, wherein said spaces function as cells of cool air in the urban context.
If the influence of green spaces is evident throughout the day, the influence of blue spaces—the water plan of the Mondego River—on temperature regulation in Coimbra must also be mentioned. In the early morning, the influence of cooler air masses is evident not only in the lower sector near the water sheet but also in the western sector of the hill where the historical center next to the university is located. However, unlike the action of green spaces observed throughout the day, the role of blue spaces seems to have a strong influence in the morning, which becomes less significant as the day progresses.
The analysis of vertical profiles once again seems to reinforce the idea of the importance of urban green spaces to climate regulation. The vertical temperature profiles reveal that in densely urbanized and impermeable areas the situation is quite differentiated: if, at the beginning of the afternoon (the hottest period), a rapid temperature drop occurs—more than 4 °C in less than 125 m—then at night the UHI recorded at the surface will be reinforced at altitude, with the temperature increasing by about 1 °C in the first 150 m of the lower atmosphere. This represents an anomalous situation as regards the expected thermal gradient, and reinforces the idea of a UHI that also develops at altitude. Regarding green spaces, there is also some differentiation. In spaces with higher tree density, at the beginning of the afternoon, the thermal profiles reflect a slight warming in the first 30/40 m, an indication of evapotranspiration (particularly in sectors populated with deciduous trees), while in the more open sectors of the Botanical Garden temperatures decrease in a manner identical to in the grey sectors. At night, the profiles vary according to the presence (or absence) of the arboreal layer. These have a clear thermal regulatory effect, and reflect temperatures that are differentiated at altitude but clearly higher above the treetops.
In fact, a more detailed analysis of the 50 m above the surface (close to what can be considered in these sectors as the Urban Canopy Layer (UCL)) offers results that are more prominent in the different sectors under analysis. In the case of built spaces, there is not much nuance to the trend previously described in the global analysis of the profiles, but in green spaces the situation is made clearer by this approach. One of the main pieces of evidence is the difference that is observed in the profiles constructed for trees of the same species—Tilia trees—but with different densities and spatializations. Thus, in the case of the “Tilia alley” sector, where the density is high, at the beginning of the afternoon, after a slight warming in the trunk sector, a slight decrease is observed between 5 and 15 m, with warming between 15 and 25 m, followed by the usual temperature drop. However, at the beginning of the night, the situation of warming linked to the arboreal sector is evident (evapotranspiration), with the expected cooling due to the thermal gradient in the layer above the canopies. In dispersed arboreal areas (in the upper terrace of the JB), the profiles show very significant decreases in the first 30 m—3.3 °C in the afternoon survey and 0.4 °C at the beginning of the night (resulting from the release of heat by evapotranspiration). In a mixed arboreal zone (of intermediate density), a decrease is observed in the daytime period (with only a slight rise in temperature in the first 5 m, this being due to ground irradiation), while at night an increase in temperature is seen in the first 30 m (canopies), with a slight decrease in temperatures in the remaining recording points.
At the surface level, particularly in urban green spaces with high arboreal density—”Tilia alley”—the goal was to understand the role that arboreal zones play in mitigating temperatures at 1.5 m in altitude. We identified the existence of fresh air cells in these wooded sectors, revealing a temperature lower by about 1.2 °C relative to peripheral spaces with lower tree density but still within the Botanical Garden, and even higher values were observed in other contexts and with other methodologies [
36].
In this study, while the impact of green spaces on urban microclimates was extensively investigated, it is important to acknowledge certain limitations concerning the analysis of plant species. We recognize that different tree species exhibit varying effects on the thermal environment, influenced by their unique morphological characteristics, such as leaf density, leaf size, canopy structure, and overall dimensions (height, width, etc.). However, our study primarily focused on broader categories of green space characteristics, like tree density and canopy coverage, rather than a detailed analysis of individual species and their specific morphologies. Consequently, the findings should be interpreted with the understanding that the intricate variations brought about by specific species were not deeply explored, which suggests a potential avenue for future research to build upon the insights derived from this study.
In the context of Coimbra and its complex morphology, there is a clear relation between urban green spaces and the city’s climatic regulation. It is essential to understand how the reflections drawn from the discussion cannot be ignored in relation to the implications of anthropogenic climate change in different urban structures, with the goal of increasing urban resilience. This study, focused on the spatial patterns of consolidated green spaces and their relationships with built spaces, sought to demonstrate how densely wooded areas contribute to the reduction in direct solar radiation endured by the surface, while increasing thermal inertia through evapotranspiration, which thus functions as an important climatic regulator. These mechanisms, understood as ecosystem services, also facilitate an increase in bioclimatic comfort. The realization that these premises are of essential relevance to sustainable urbanism seems to be a given in the thematic literature, and is here proven in the city of Coimbra. The deliberate expansion of urban green areas should be seriously considered by urban planners and public managers, as these green spaces serve as one of the more critical components in building sustainable cities, while also considering the effects of different species in the same planning process.
This type of study should be seen as fundamental to technicians and politicians in future of cities, as it provides data and guidelines for rethinking the planning of the city via a green structure. There is a clear need for a tree planting plan that mirrors the road network, especially in sectors where higher temperatures are observed (slopes facing southern quadrants). This seems to be a key consideration for the coming times, especially since, at present, municipalities are developing in the opposite direction. Also, creating small-scale vegetation islands as well as creating blue spaces should be considered. Regarding plant species, while considering the climatic characteristics of a city in relation to the observed microclimatic characteristics of green spaces in Coimbra, the orientation should be towards the wider planting of deciduous trees, since this allows greater solar radiation in cold periods and greater protection during the summer [
36].
5. Conclusions
Using the city of Coimbra as a reference point, this study sheds light on and illustrates the capacity for urban green spaces to modulate extreme temperatures within an urban setting, across various scales.
Data collected during anticyclonic days with high temperatures reveal that average temperature differences between dense urban areas and large green spaces can reach up to 6 °C. The effects of green spaces as fresh air cells were measured in various areas with distinctive dimensions.
Vertical temperature profiles recorded using a UAV have revealed that in highly urbanized areas there are rapid and more intense temperature drops when compared to urban green spaces with high tree density. The evaporative cooling effect of trees has been identified. Vertical profiles recorded in green spaces with Celtis australis and Tilia × europaea reveal greater thermal inertia. The thermal variation measured in the first 100 m is lower than that measured in urbanized areas. The relationship between temperature and the surrounding environment highlights the growing importance of trees to atmospheric dynamics at altitudes close (20/30 m) to areas inhabited by living species.
Within the chosen green spaces, variations in thermal behavior patterns were observed. Factors such as tree compositions, densities, canopy structures, and typologies were found to significantly influence air temperature reduction.
This research paper is part of a broader project focused on envisioning climate change resilience in a city influenced by Mediterranean climates, where the increase in heatwaves (and cold air spells) has been intensifying [
36,
41]. The role of tree vegetation in developing cool islands associated with urban forests and the road network itself may prove to be important factors in specifically mitigating the urban heat island located in the old urban core, which is bounded by a large green structure [
36]. The goals of mitigating urban climate change [
29,
48], based on nature-based solutions [
21], and, particularly, through urban design that balances the relationship between grey, green, and blue spaces, as well as a deep understanding of these spaces as regards their interactions with the urban thermal regime, are among the main objectives to be developed.
Therefore, from a critical perspective related to creating sustainable urbanism in Coimbra, and starting with the evidence gathered in this paper (as well as others subsequently published [
36,
41]), the role of green spaces in the climatic regulation of the city can be assumed, particularly in sectors where the urban heat island is a reality throughout the year. As regards short-term development paths, it is therefore also essential to delineate the UHI on the left bank of the water body, understand its role in the spatialization of the UHI on the right bank, and implement a city reforestation plan that will enhance the climate change resilience of this city.


