Article

Determine the Optimal Vegetation Type for Soil Wind Erosion Prevention and Control in the Alpine Sandy Land of the Gonghe Basin on the Qinghai Tibet Plateau

1
Research Institute of Forestry, Chinese Academy of Forestry, Beijing 100091, China
2
Qinghai Gonghe Desert Ecosystem Research Station, Shazhuyu 813005, China
3
Institute of Ecological Conservation and Restoration, Chinese Academy of Forestry, Beijing 100091, China
4
Qinghai Provincial Sand Control Experimental Station, Xining 813099, China
*
Author to whom correspondence should be addressed.
Forests 2023, 14(12), 2342; https://doi.org/10.3390/f14122342
Submission received: 4 November 2023 / Revised: 21 November 2023 / Accepted: 28 November 2023 / Published: 29 November 2023
(This article belongs to the Section Natural Hazards and Risk Management)

Abstract

:
There is a dearth of research regarding the windbreak and sand stabilization functions of Caragana liouana shelter forests in the Gonghe Basin of the Qinghai-Tibet Plateau. Therefore, the aim is to elucidate the patterns of near-surface wind–sand activity in artificial Caragana liouana forests of varying ages and mixed forests of different configurations in alpine sandy areas. Additionally, this research seeks to clarify the windbreak and sand fixation effects of these forests. To this end, we have selected artificial forests of Caragana liouana of varying ages (10-year-old pure Caragana liouana forest (10aZJ-C), 17-year-old pure Caragana liouana forest (17aZJ-C), 37-year-old pure Caragana liouana forest (3aZJ-C)) and shrub mixed forests of different mixing modes (10-year-old Caragana liouana and Caragana korshinskii mixed forest (10aNZ-HJ), 10-year-old Caragana liouana and Artemisia desertorum mixed forest (10aSZ-HJ), an 10-year-old Caragana liouana and Salix cheilophila mixed forest (10aWZ-HJ)) within the Sand Control Station of Shazhuyu Village in the Gonghe Basin of the Qinghai-Tibet Plateau as the research subjects. Naked sand dunes were used as the control plot (CK), and through field observations of the wind speed profile, sand transport rate, and micro-topographic changes of each stand plot, we analyzed the wind–sand flow structure characteristics and sand transport process of Caragana liouana of different ages and their mixed forests, eventually proposing suitable afforestation configuration modes for the alpine sand area of the Gonghe Basin in Qinghai. The findings indicate that the wind speed profile within each stand plot follows a linear distribution pattern. Compared to naked dune land, the windbreak effect of each plot decreases as the height from the ground increases. Among them, the 10aWZ-HJ plot significantly alters the wind speed profile and has a substantial windbreak effect; at a height of 200 cm, the windbreak effect can still reach 41.27%. The sand transport rate of each plot fits into an exponential function relationship, with the correlation coefficients (R2) of the fitting equations for each plot all exceeding 0.95 and significantly lower than the control plot, suggesting vegetation can effectively reduce near-surface sand transport. The sand-fixing effects at the height of 0–45 cm from the ground in each plot are as follows: 37aZJ-C > 17aZJ-C > 10aWZ-HJ > 10aNZ-HJ > 10aZJ-C > 10aSZ-HJ. Overall, all plots indicate a state of accumulation. The 10aWZ-HJ plot has the largest relative accumulation area at 88.00%, and the highest average intensity of wind erosion and accumulation at 1.11. Taking into account the stability of the stand and the total protection time, this study suggests that it is suitable to mainly use mixed forests of Salix cheilophila and Caragana liouana in the alpine sand area of the Qinghai-Tibet Plateau. The results of this study can provide a theoretical basis for the construction of windbreak and sand-fixing forests in alpine sand areas.

1. Introduction

Desertification is one of the most urgent global environmental problems, attracting significant attention from the international community [1,2]. Most areas on the edge of deserts worldwide suffer from severe wind erosion and the resulting increase in dust storms. Approximately 30% of the world is experiencing desertification, leading to severe economic, social, and health consequences, including the loss of productive land [3]. For instance, dune mobility increases the risk of blocking transportation routes, while dust storms caused by wind erosion have a serious adverse impact on air quality in downwind areas, posing a significant threat to human health and quality of life [4,5,6]. Sand fixation is one of the most critical ecosystem services provided in arid and semi-arid regions, representing the ability to prevent wind erosion and reduce sand migration [7]. Sand fixation helps improve human well-being by protecting soil nutrients, reducing air pollution, and lowering the risk of harm to infrastructure, benefiting both local and downwind areas [8]. Common methods include mechanical sand fixation (using obstacles to prevent sand movement, such as straw checkerboard grid fences and sand fences [9]), chemical sand fixation (using various chemicals, such as oil, asphalt, or latex, to form crusts on the soil surface [10]), and biological sand fixation (planting vegetation as windbreaks or creating/forming crusts on the soil surface [11,12]). Therefore, effective vegetation reinforcement, dune restoration, and livelihood improvement through wind and sand control projects are the most attention-grabbing and challenging issues. Because the maintenance capacity of sand fixation measures is limited in sandy areas or deserts, mechanical measures can only serve as temporary and auxiliary means of desert control [13]. The high cost and potential environmental risks make chemical sand fixation less ideal [14]. Research indicates [15] that vegetation can reduce soil wind erosion by increasing aerodynamic roughness and the rate of friction. The most effective measures for windbreak and sand fixation include strengthening surface vegetation [16] and planting agroforestry [17,18]. Seeding a mixture of seeds from feed sub-shrubs and perennial grasses in a strip pattern can effectively ensure the restoration of productivity and plant diversity [19,20]. Zhang et al. [21] found that high-density woody plants, a high proportion of trees, and a wide profile area can effectively reduce the transport of soil wind erosion sediment. Pang et al. [22] have shown that in the Mu Us Sandy Land, Artemisia ordosica can effectively reduce surface wind speed and decrease surface sediment transport.
The Qinghai-Tibet Plateau is known as the “Roof of the World” and the “Third Pole of the Earth”. It is a global biodiversity hotspot and a sensitive area for global climate change, serving as a vital “ecological barrier” in Asia [23]. Influenced by its unique geographical location, altitude, and climate change, the strong winter monsoon leads to frequent frost weathering and intense wind erosion, making the ecological environment in most parts of the plateau increasingly fragile [24,25,26]. Desertification in the Qinghai-Tibet Plateau is primarily concentrated in the Qaidam, Gonghe, Qinghai Lake, and Sanjiangyuan basins [27], the rapid and extensive expansion of desertification not only affects the fragile ecological environment of the plateau but also poses a severe threat to human activities and socioeconomic development. Constructing a highly effective windproof protection forest system according to local conditions is of great significance in mitigating sand and dust disasters and improving the fragile ecological environment of the Qinghai-Tibet Plateau.
Tian et al. [28] found that Hippophae rhamnoides has a significant windproof function in the Qinghai-Tibet Plateau, with a suitable Hippophae rhamnoides spacing density of 1.5 m for alpine desert control projects. Li et al. [29] demonstrated that the artificial forests of Populus cathayana in the northeastern part of the Qinghai-Tibet Plateau contribute to the stability and ecological restoration of the Mugetan Desert, where a 30-year-old artificial forest can form a moss crust on the surface of the sand dunes, thereby stabilizing them. Research by Cao et al. [30] indicated that in the eastern Qaidam Basin of the Qinghai-Tibet Plateau, the sand-trapping capacity of five dominant plants is ranked as Ephedra przewalskii > Calligonum zaidamense > Sympegma regelii > Artemisia desertorum > Krascheninnikovia ceratoides. They further recommended the establishment of a windbreak forest system consisting of fast-growing shrubs and semi-shrubs in the windward direction.
The above studies indicate that plant measures have effectively reduced wind and sand hazards in the Qinghai-Tibet Plateau region. However, research on the windproof mechanisms of sand-fixing plants in the alpine desert is limited to some farmland windbreak forests, specific airflow characteristics around individual plants, and the windproof and sand-fixing benefits of specific forest belts during certain periods [28,30,31,32]. There is relatively little research on typical sand-fixing plants of different ages in the alpine desert area and the micro-topographical changes within differently configured artificial forests, as well as their windproof and sand-fixing functions. The Caragana liouana, a perennial leguminous shrub, is characterized by its drought resistance, cold resistance, wind erosion resistance, and tolerance to sand burial. It also serves ecological functions such as windbreak and sand fixation, soil improvement, and nitrogen fixation [33]. In the Gonghe Basin of the Qinghai-Tibet Plateau, the artificial forests of Caragana liouana are widely distributed. Research on Caragana liouana in the cold desert regions primarily focuses on water utilization strategies [34] and soil improvement effects [35]. The research on the windbreak and sand-fixation function of Caragana liouana is relatively scarce. Therefore, this study aims to analyze the airflow structure characteristics and sand transport processes of Caragana liouana of different ages and its mixed forests. Through field observations of wind speed profiles, sand transport rates, and micro-topographical changes in various forest sample sites, the study intends to explore the windbreak and sand fixation effects of Caragana liouana of different ages and its mixed forests. Our main objectives are to (1) quantitatively evaluate the effects of different configurations of windbreak forests on wind speed profiles, sand transport rates, sand distribution height, and surface wind erosion; and (2) explore how the windbreak and sand fixation effects of different protective systems vary. Ultimately, we aim to propose appropriate afforestation configuration models for the alpine desert area of the Gonghe Basin in Qinghai.

2. Materials and Methods
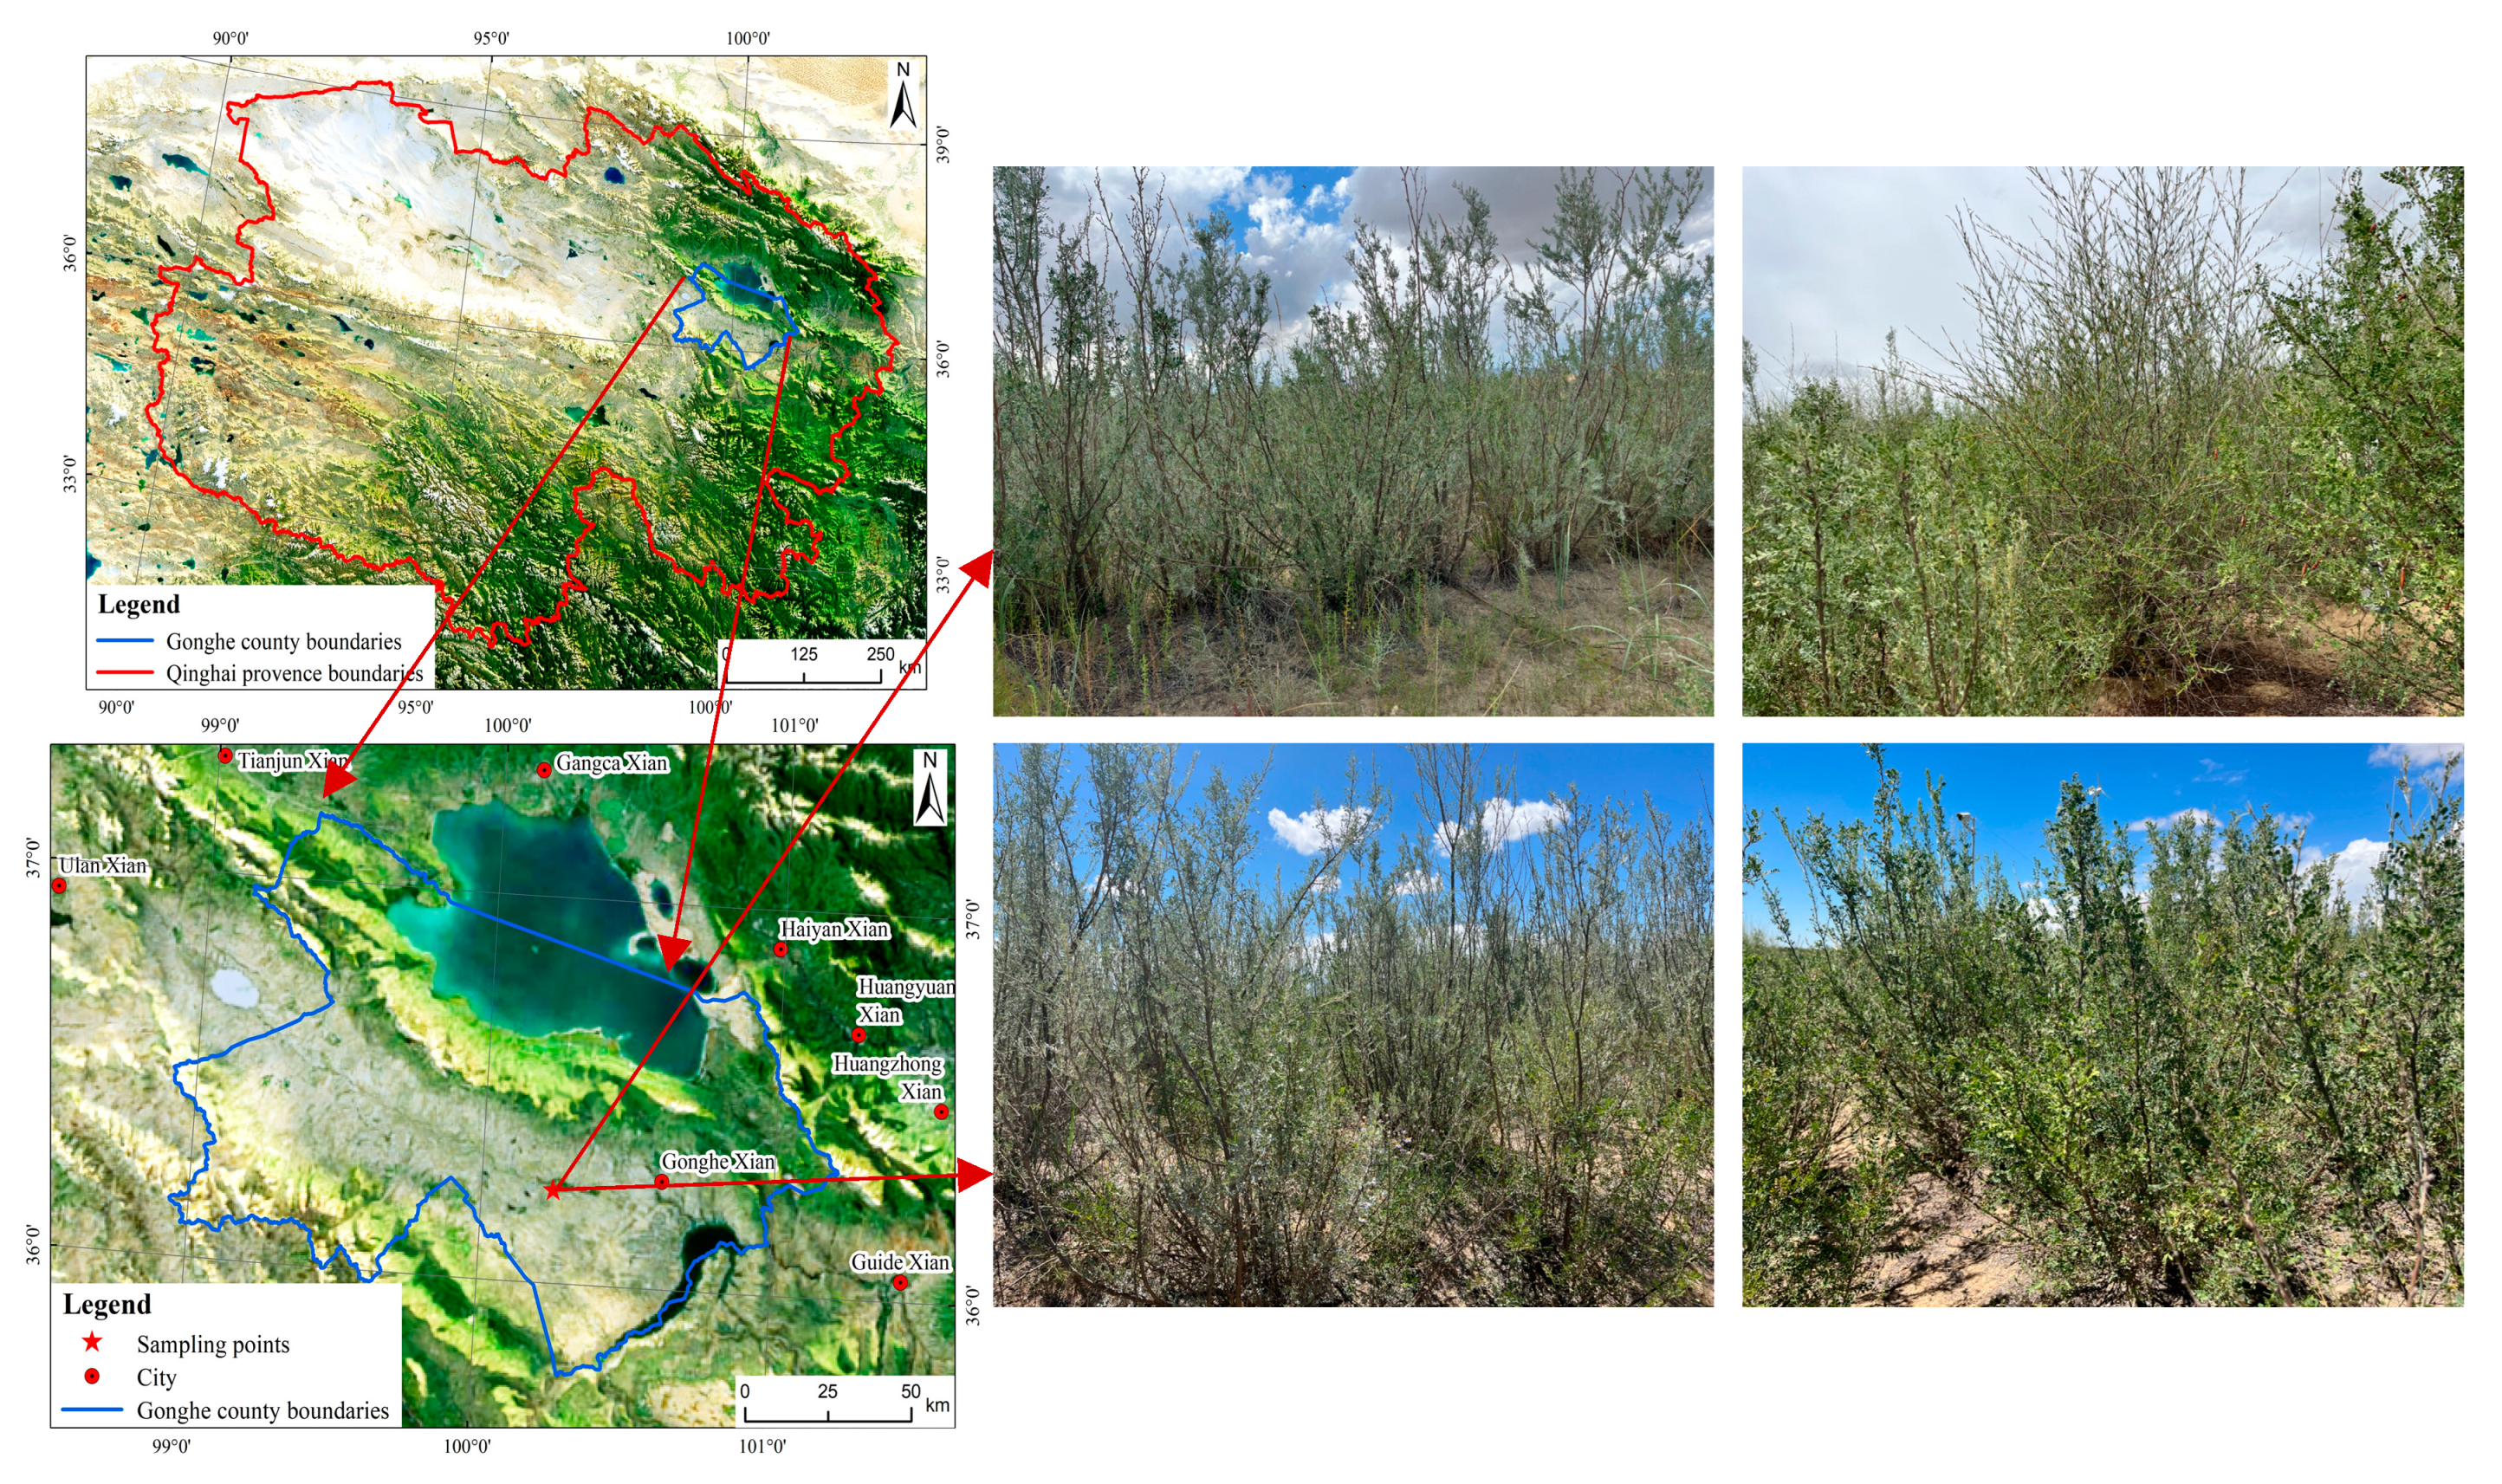
2.1. Study Location

The research area is located in Shazhuyu Township, Gonghe County, Qinghai Province, and relies on the Desert Ecosystem Positioning Research Station (99°45′–100°30′ E, 36°03′–36°40′ N, elevation 2871–3870 m) for experimentation. The area features a typical plateau continental climate, belonging to a high-cold arid and semi-arid region. The average annual temperature is 2.4 °C, with an average annual precipitation of 246.3 mm and an average potential evaporation of 1716.7 mm [36]. The seasonal distribution is uneven, with atmospheric precipitation mainly concentrated from May to September, with around 50% of the annual rainfall occurring in July and August. The dry and wet seasons are quite distinct. The primary soil type in the research area is fine sandy soil. The artificial vegetation mainly includes Caragana liouana, Populus cathayan, Salix cheilophila, Hippophae rhamnoide, Artemisia desertorum, and others (Figure 1).

2.2. Research Method

2.2.1. Sample Site Selection

A total of six types of forest stands were selected for the observational study in the field: 10-year-old Caragana liouana and Caragana korshinskii mixed forest (10aNZ-HJ), 10-year-old Caragana liouana and Artemisia desertorum mixed forest (10aSZ-HJ), 10-year-old Caragana liouana and Salix cheilophila mixed forest (10aWZ-HJ), 10-year-old pure Caragana liouana forest (10aZJ-C), 17-year-old pure Caragana liouana forest (17aZJ-C), and 37-year-old pure Caragana liouana forest (37aZJ-C), were selected as the study objects. The pure and mixed forests of Caragana liouana were initially installed with a plant-row spacing of 1 m × 1 m. The mixed forest employed a ribbon intercropping method, with one row comprising Caragana liouana and the other row populated with intercropped vegetation. Each type of protective woodland area selected spans approximately 2500 m2. The gradients of each forest plot are similar, with the terrain being level and the topsoil loose. The soil predominantly consists of wind-blown sand, with the top layer nearly devoid of crust. The climate conditions across the plots are virtually identical, and each plot is sealed off with artificial management, utilizing bare sand dunes as control plots. Basic information on the forest stands was measured and recorded directly, and the details are presented in Table 1.

2.2.2. Experimental Design

Wind Speed Profile and Sediment Transport Measurement

We have quantified and examined the wind field characteristics of various plots and control sites, thereby evaluating their respective capacities to mitigate wind speed. Each plot is outfitted with an intelligent environmental monitoring station (QY-3000, Channel Tech, Beijing, China)—featuring six wind speeds and one wind direction—to concurrently measure wind speed profiles, all centrally located within the protective forest belt. The cup anemometer (JXBS-7001-FS, Channel Tech, Beijing, China) boasts a measurement accuracy of approximately ±1 m/s under 30 m/s. Wind speed at six different heights above the ground is also simultaneously measured: 10 cm, 20 cm, 50 cm, 100 cm, 150 cm, and 200 cm. The instrument operates with a sampling frequency of every 10 s, recording data every 10 min. We utilized a multi-channel omnidirectional rotating sand collector to quantify sediment transport at five different elevations: 0–5 cm, 10–15 cm, 20–25 cm, 30–35 cm, and 40–45 cm. The sand collector, with an inlet height of 5 cm, a channel width of 5 cm, and a channel length of 15 cm, was independently stationed within seven distinct plots. To ensure the accuracy of measurements and avert interference between instruments, we maintained a distance of over 3 m between the intelligent environmental monitoring station (QY-3000) and each sand collector. Throughout the field observation phase, we executed three sets of sediment transport observations, with each set accumulating sand over a 24-h period. Afterward, the samples were transported indoors, recorded, and weighed using an electronic scale sensitive to 1/1000 g. The sediment transport rate was expressed as total sediment transport per unit time and width within the monitored height. We assessed the sediment transport of the aeolian sand flow from 0–45 cm and its distribution pattern along the height gradient. Throughout the observation phase, the prevailing wind was from the northwest, which is the primary wind direction for this region. We placed the sand collector at the leeward edge of the protective forest belt, and during each observation, the position of the sand collector and anemometer remained constant, ensuring the consistency of the data and the reliability of the results.

Wind Erosion Depth Measurement

In each plot, 25 stakes were placed at relatively flat positions in the area, with an area of 1 m × 1 m. The coordinate origin for the stakes was set at the northwest corner. The spacing between the stakes was approximately 20 cm. Using the northwest corner as the origin for the probe coordinates, 25 probes were placed (spaced approximately 20 cm apart) within each area. The probes have a diameter of 0.5 cm and a length of 60 cm, with markings at 1.0-cm intervals. During the initial observation (on 21 March 2023), the probes were inserted 20 cm below the ground and extended 40 cm above the ground (yielding an effective measurement height of 40 cm). A steel ruler (with the starting point at 0 on the scale) was used to measure the wind erosion and deposition, with an accuracy of 1 mm. During each observation, only the height of the probes above the ground was measured and the relative coordinates of each probe were recorded. The depth of wind erosion or deposition (denoted as H) was calculated using the formula H = 40 − h (where h is the height of the probe above the ground), with H > 0 indicating deposition, H < 0 indicating erosion, and H = 0 indicating an equilibrium of erosion and deposition. The average value of the observed wind erosion and deposition depth from the 25 probes in each sample area was taken for analysis.

2.2.3. Index Calculation

Windbreak Effect

E f = V C K V a V C K × 100 %
In the equation, E f represents the windbreak effect of the community plot, measured in percentage (%). V C K and V a represent the average wind speeds at the same height in the control plot and the forest plot, respectively, measured in meters per second (m·s−1).

The Sediment Transport Rate

Q = i = 1 50 q i B × t
In the equation, Q represents the sediment transport rate, measured in grams (g·cm−2·h−1); q i is the sediment transport quantity at the i-th layer; B is the inlet area of the sediment sampler, measured in square centimeters (cm2); and t is the collection time, measured in hours (h).

Sand Fixation Effect

E g = Q d Q z Q d × 100 %
In the equation, E g represents the sand-fixing effect of the forest sample site, measured in percentage (%). Q d and Q z represent the total sediment transport rate per unit time at each height layer of the control site and the forest sample site, respectively.

Erosion Intensity

The erosion, transportation, and deposition of aeolian materials constitute a dynamic and continuous process that occurs over vast spaces, interacting with the aeolian materials of the surrounding areas. The accretion status of regional aeolian materials is determined by the input and output of sand materials, namely, by the accretion balance of aeolian materials. Assuming the aeolian input quantity during a certain period in the region is M e , and the output quantity is M o . The aeolian accretion balance W e in the region can be expressed by the formula [37]:
W e = M e M o
When W e > 0 , the region has a net input of sand material, indicating accumulation. When W e < 0 , the region has a net output of sand material, representing erosion. When W e = 0 , the output and input of sand materials in the region are equal, signifying an aeolian accretion balance.
During the observation process, the sand material density ρ and the region area S remain approximately constant. The aeolian erosion balance W e within different observation stages t can be replaced by the aeolian erosion intensity R e (or the erosion rate), which is formulated as
R e = W e ρ S t .
It can be simplified as
R e = H t .
In the formula, H represents the accretion depth (cm), a shorthand for aeolian accretion depth, which can be measured using the stake method [38]. t is the observation period (d). When R e > 0 , the region experiences a net input of sand material, resulting in accretion; when R e < 0 , the region experiences a net output of sand material, indicating erosion; when R e = 0 , the input and output of sand material are equal, signifying an aeolian equilibrium.

2.3. Data Processing and Analysis

With the aid of Surfer 15 software, and employing the Kriging interpolation method, we simulated the three-dimensional landscape within each plot based on the measured relative erosion and deposition depth data and their corresponding coordinates. Furthermore, we computed the areas within the grid that were occupied by varying ranges of relative erosion and deposition depths within the forest. The raw data related to wind speed and sediment transport rate were preliminarily organized and calculated using Microsoft Office Excel 2017. After necessary corrections and processing, the data were subjected to a Kolmogorov–Smirnov Test using SPSS 26 statistical software. Then, the data were further analyzed and graphed using Origin2021.

3. Results and Analysis

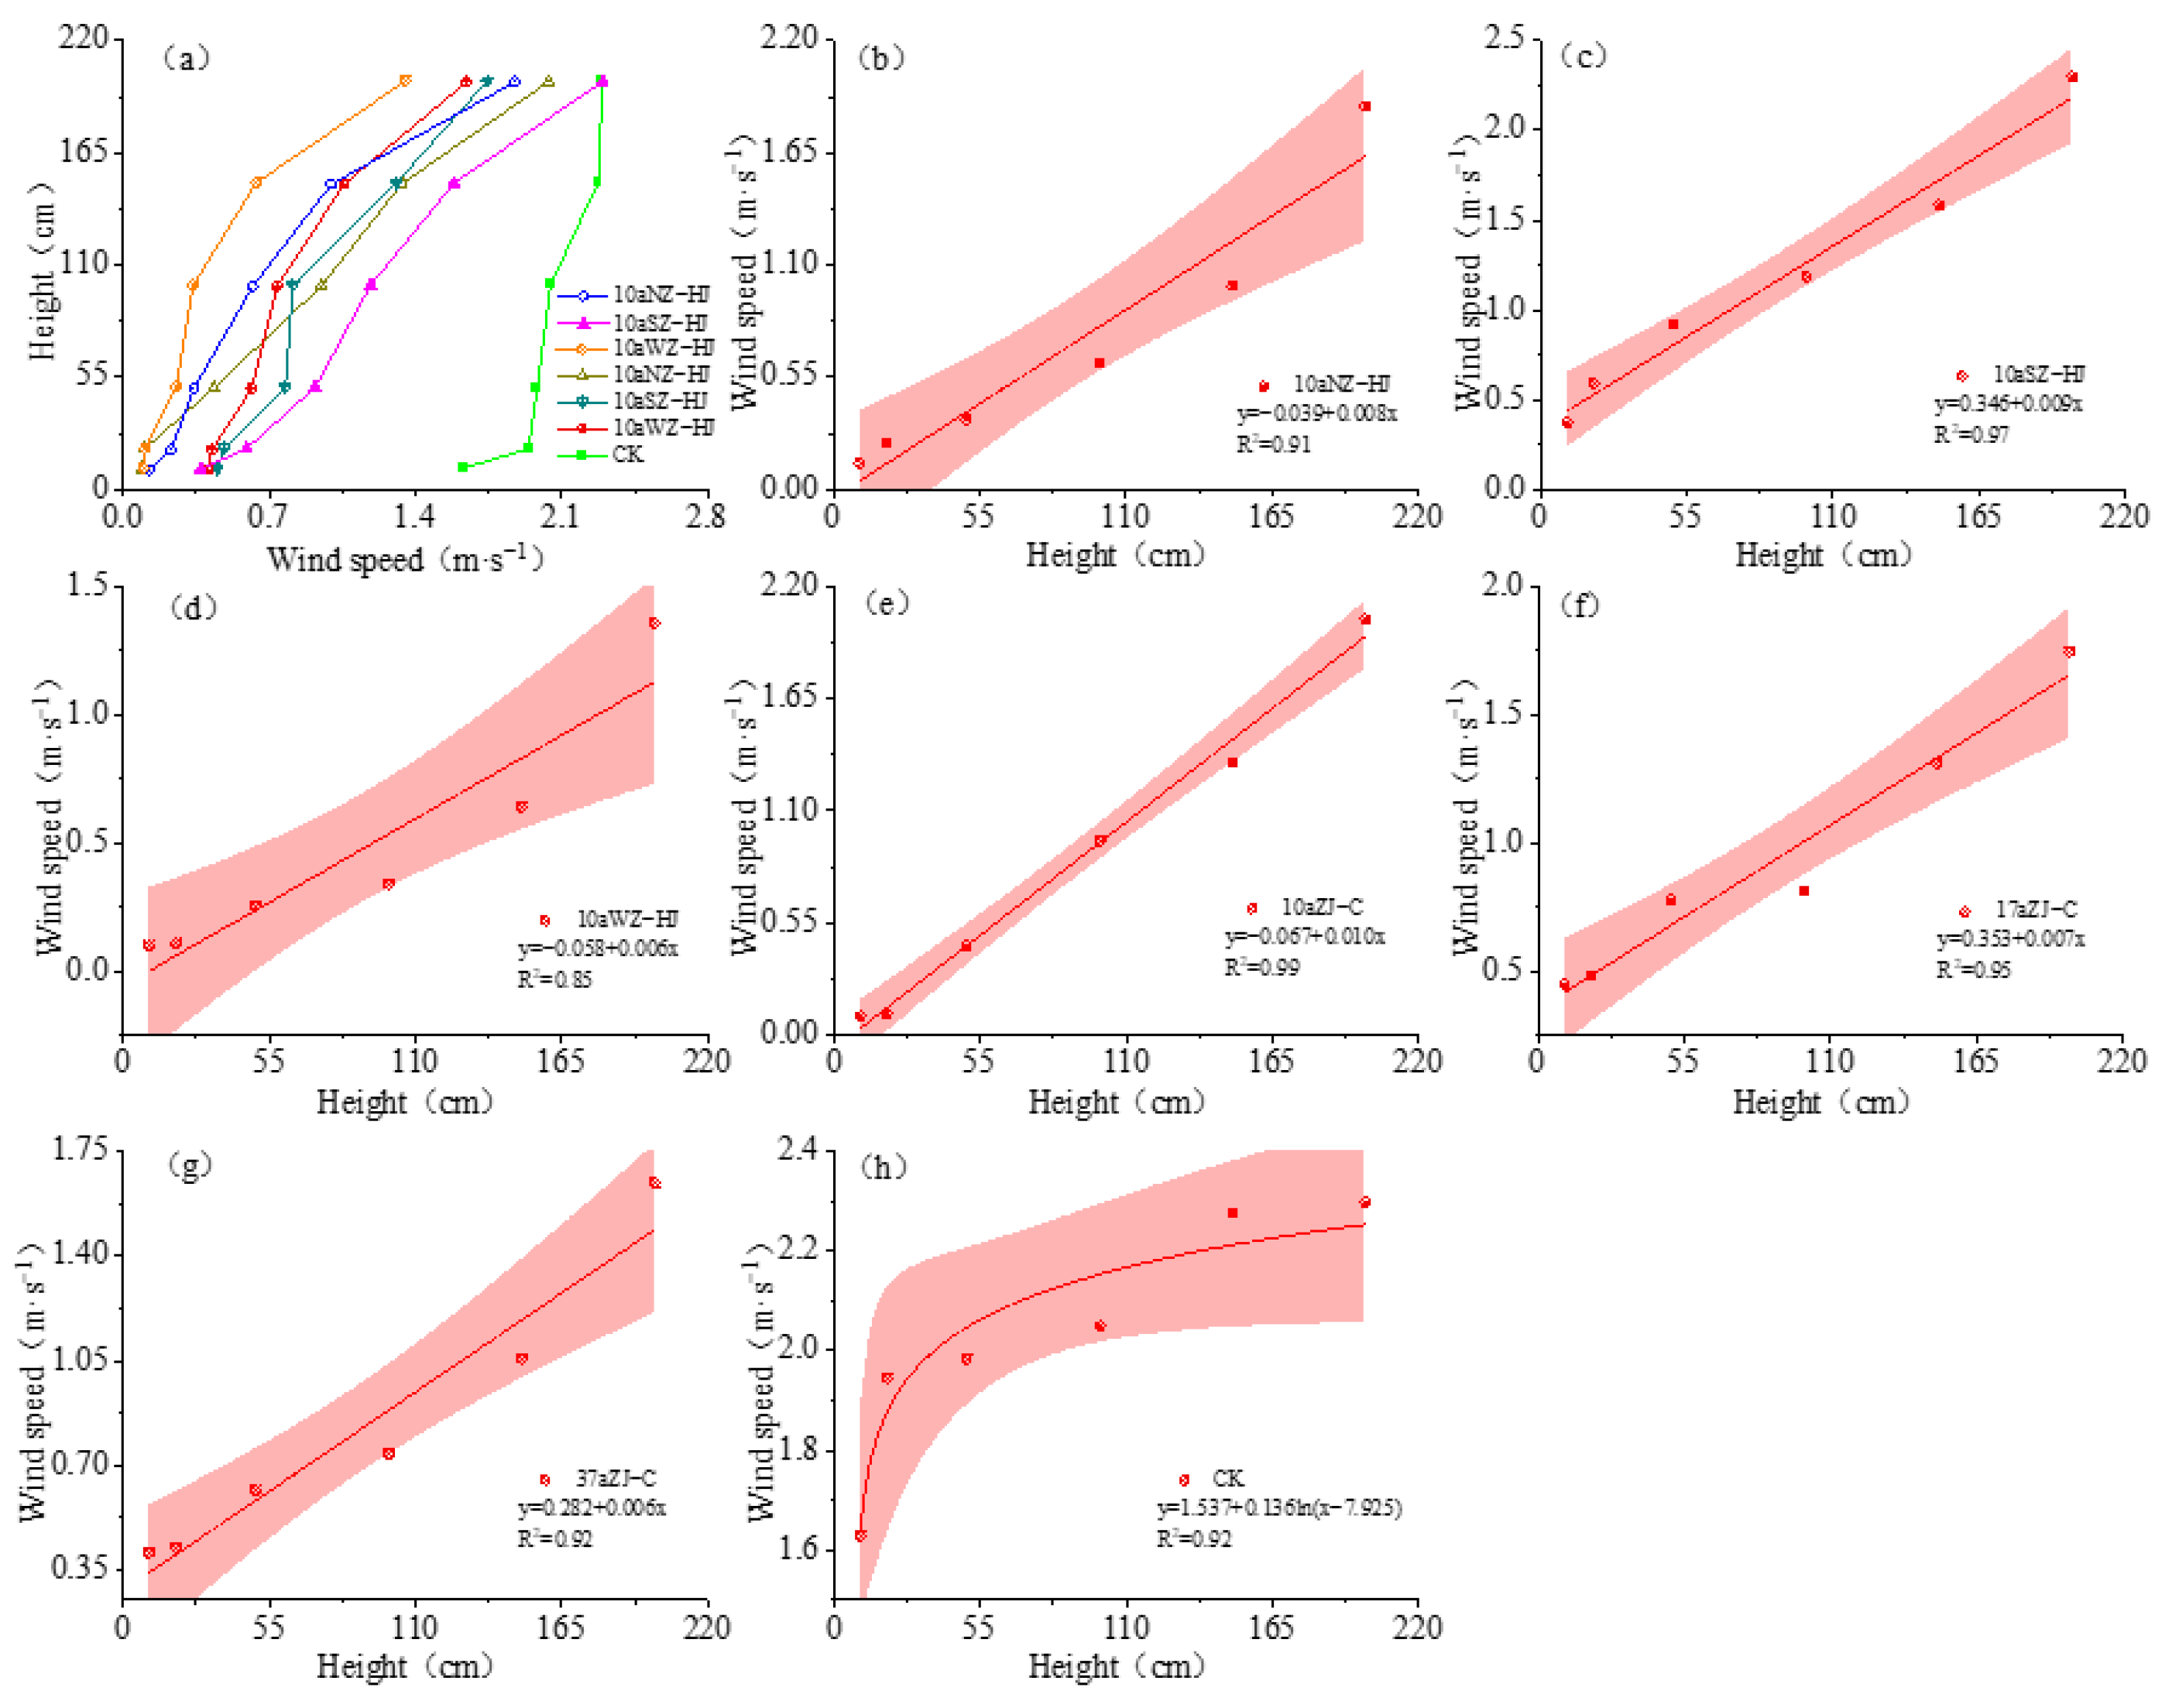
3.1. Characteristics of Wind Speed Profile Variation and Its Windproof Effect in Protective Forests

The surface vegetation alters the wind speed profile by modifying the near-surface spatial structure, thereby reducing wind erosion of the soil [39]. The characteristics of near-surface wind speed and the wind speed profile along the vertical height conform to logarithmic rules [40]. As depicted in Figure 2, except for the wind speed at the flow dune site, which follows a logarithmic distribution (Rh2 = 0.92), the wind speeds in all other sites do not conform to logarithmic relationships. When the underlying surface is covered by vegetation, the near-surface wind speed decreases vertically due to the obstructive and weakening effect of the vegetation on the airflow, thereby disrupting the logarithmic rule of wind speed variation near the surface in the absence of vegetation [40]. The wind speed profiles of the 10aNZ-HJ (Rb2 = 0.91), 10aSZ-HJ (Rc2 = 0.97), 10aWZ-HJ (Rd2 = 0.85), 10aZJ-C (Re2 = 0.99), 17aZJ-C (Rf2 = 0.95), and 37aZJ-C (Rg2 = 0.92) sites have all undergone significant changes, showing a linear distribution relationship where wind speed increases with height. The mixed forests and pure forests of different ages all play an obstructive and weakening role in the movement of wind speed. In the 10aSZ-HJ and 10aZJ-C sites, wind speeds increase rapidly overall below 20 cm, while in the 10aNZ-HJ, 10aWZ-HJ, 17aZJ-C, and 37aZJ-C sites, the overall increase is faster below 50 cm. Within the mixed forests, the wind speed profile of the Caragana liouana and Salix cheilophila mixed forest changes significantly, indicating that the Caragana liouana and Salix cheilophila mixed forest has the most significant obstructive and weakening effect on wind speed. In the pure forests, as the age of the Caragana liouana increases, the wind speed profile of the Caragana liouana changes more noticeably. This suggests that the Caragana liouana pure forest has a greater obstructive and weakening effect on wind speed with increasing age.
Windproof efficiency is an important indicator reflecting the effective reduction of wind speed by surface vegetation. By comparing windbreak efficiencies at six different heights, we assessed the impact of mixed forests and pure forests of various ages on wind speed reduction at different heights above the ground. Figure 3 reveals that as height increased, windbreak efficiencies decreased across all plots. Within the range of plant heights, the windbreak effect was rather effective. Beyond the plant height range, the windbreak effect lessened, yet it remained somewhat functional. The maximum windbreak efficiency was observed at the near-surface height of 10 cm in the 10aNZ-HJ and 10aSZ-HJ plots, with the former showing significantly higher windbreak efficiency than the latter (p < 0.05). These efficiencies reached 92.13% and 77.44%, respectively. In the 10aWZ-HJ, 10aZJ-C, 17aZJ-C, 37aZJ-C plots, the maximum windbreak efficiency was seen at the near-surface height of 20 cm. Of these, the 10aWZ-HJ and 10aZJ-C plots displayed significantly higher windbreak efficiency than the 17aZJ-C and 37aZJ-C plots (p < 0.05), with efficiencies of 94.52%, 94.74%, 75.21%, and 78.21%, respectively. The 10-year-old mixed forest plot of Caragana liouana and Salix cheilophila demonstrated the most effective windbreak performance. At heights between 10-20 cm, the windbreak efficiency consistently exceeded 90%. Even at a height of 200 cm, its windbreak efficiency still reached 41.27%, significantly surpassing the windbreak and sand-fixing efficiencies of the other plots (p < 0.05).

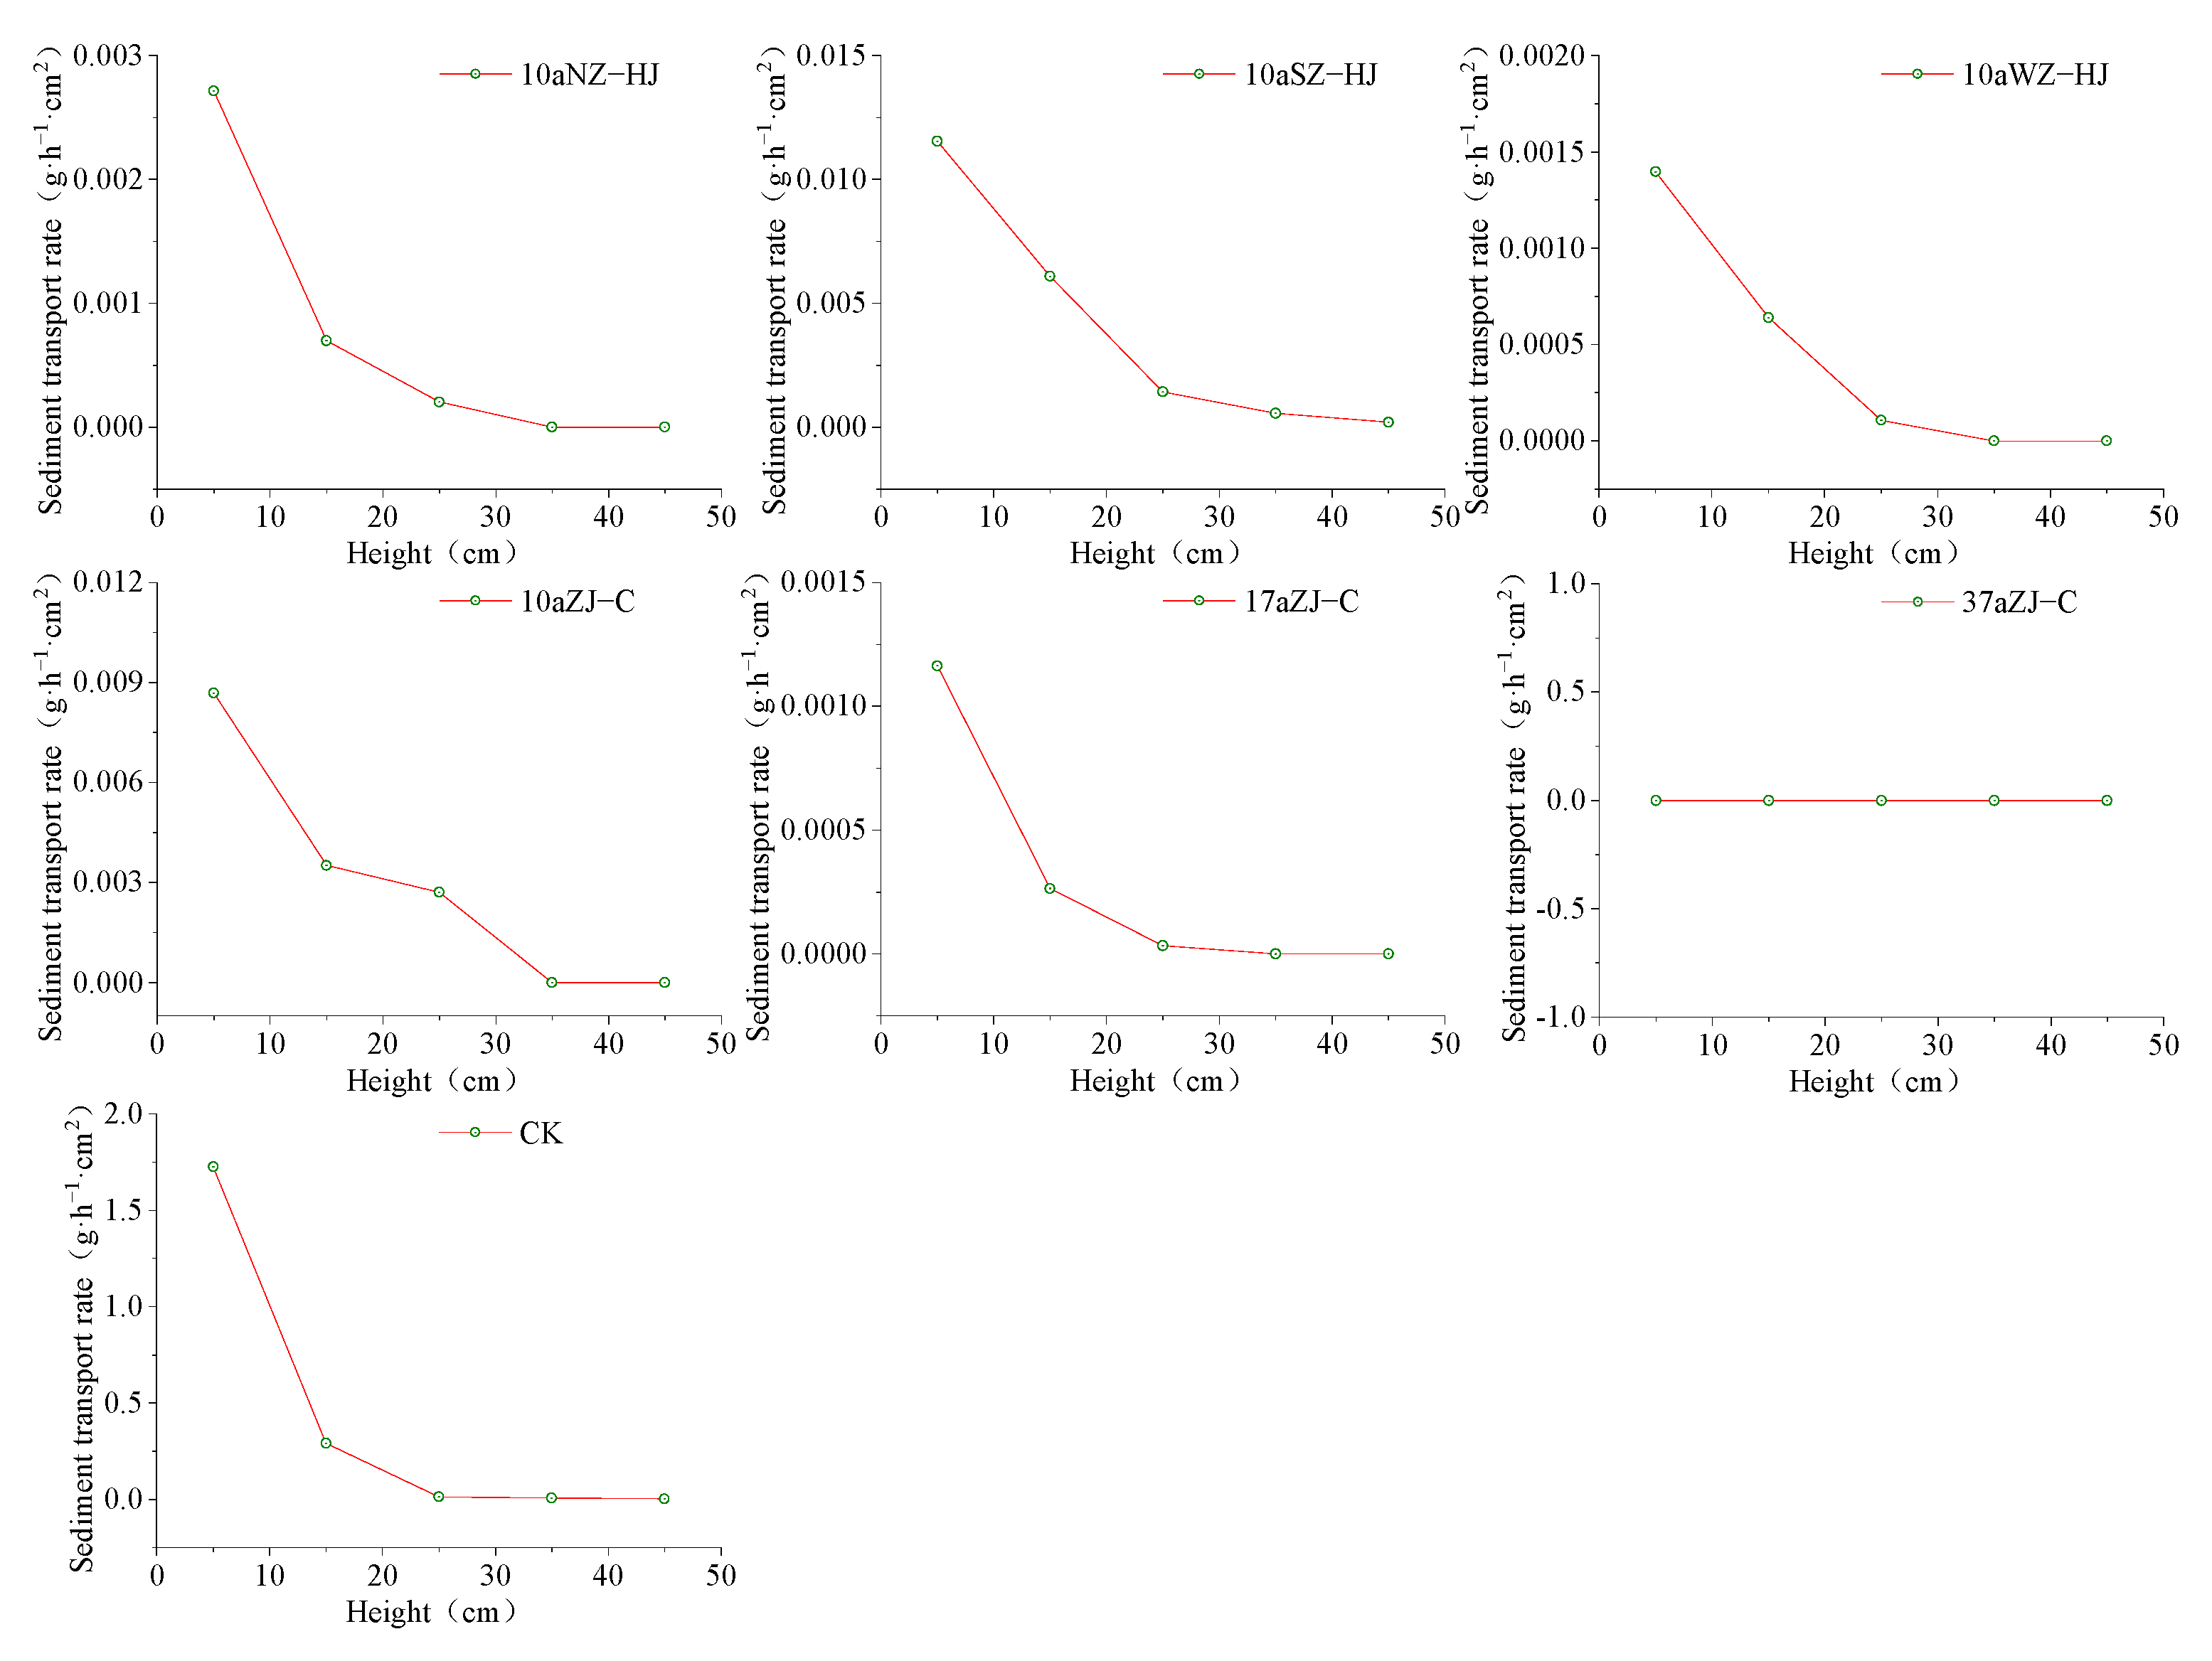
3.2. Sediment Transport Rate and Its Vertical Distribution in the Protective Forest

Based on Figure 4, it can be observed that each site has reduced sediment transport rates near the surface to varying degrees. The sediment transport rates at each site decrease with increasing height. Among them, the 37-year-old pure Caragana liouana forest has the lowest sediment transport rate, and the sediment transport rates at each height are 0. In the sites 10aNZ-HJ, 10aWZ-HJ, 17aZJ-C, and 37aZJ-C, the sediment transport flux within the 15 cm near the ground accounted for over 90% of the entire observed section’s sediment transport flux. The sites 10aZJ-C and 10aSZ-HJ accounted for 88.95% and 81.79% of the entire observed section’s sediment transport flux within the 15 cm near the ground, and within the near-surface layers of 5 cm, 15 cm, and 25 cm, both the 10aSZ-HJ and 10aZJ-C plots exhibited notably greater sand transport rates than the other plots (p < 0.05). At heights of 35 cm and 45 cm from the ground, the sand transport rate of the 10aSZ-HJ plot significantly surpassed that of the other plots (p < 0.05) (Supplementary Table S1). Moreover, except for the site 37aZJ-C, the sediment transport rates at each site show a good exponential function relationship with height (Table 2). The fitted formulae for the sediment transport rates with height at each site are shown in Table 2, with correlation coefficients (R2) above 0.95 and p-values below 0.01, indicating a high correlation. Using an exponential function to represent the relationship between sediment transport rates and height can fully reflect the distribution characteristics of sand content within the transport layer with height.

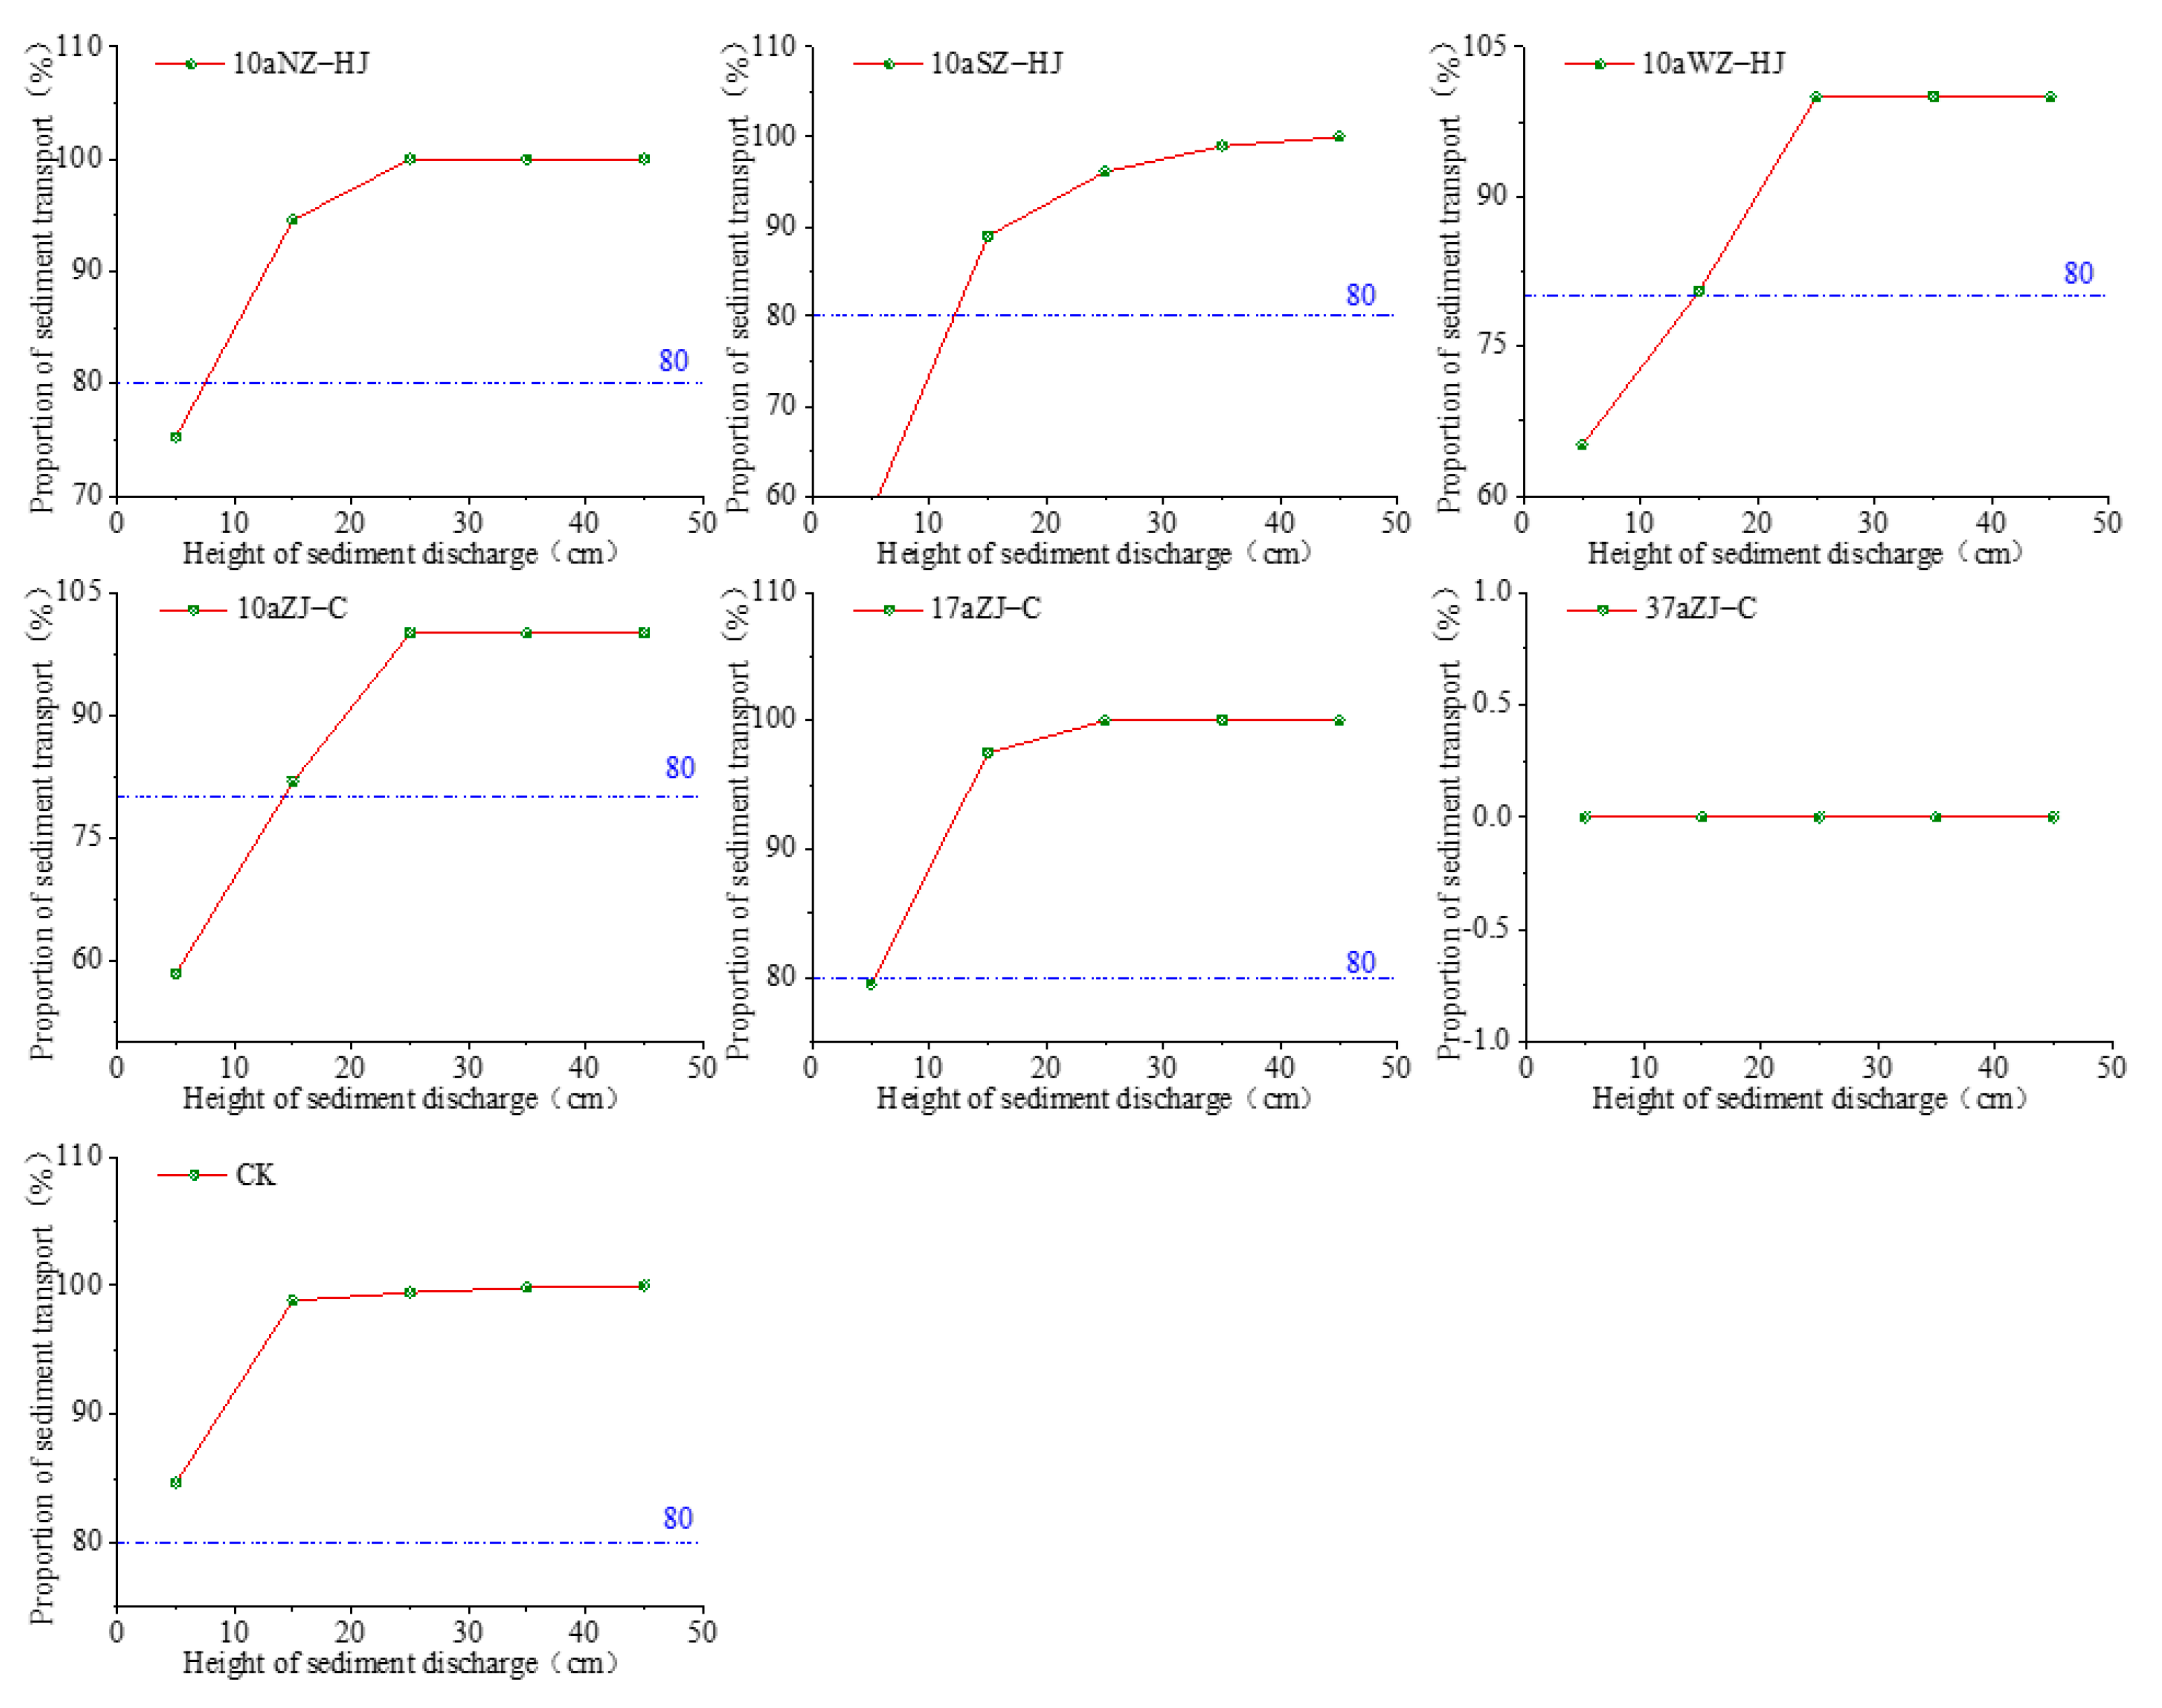
3.3. Cumulative Sand Transport Rate and Sand Blocking Effect of Shelter Forest

As seen in Figure 5, the cumulative sediment transport rates at a height of 5 cm above ground level in the mobile sand dune site have already exceeded 80%. For the 10aNZ-HJ, 10aSZ-HJ, 10aWZ-HJ, 10aZJ-C, and 17aZJ-C sites, the cumulative sediment transport rates above 80% occur at a height of 15 cm above ground level. This indicates that in areas covered by shrubs, higher cumulative sediment transport rates are required to meet the threshold of 80%, suggesting that all sites control near-surface aeolian activities and raise the baseline for wind erosion. For the control site, the cumulative sediment transport rate at 5 cm above ground level reaches 84.61%. At the same height, the cumulative sediment transport rates for the 10aNZ-HJ, 10aSZ-HJ, 10aWZ-HJ, 10aZJ-C, and 17aZJ-C sites are 75.23%, 58.18%, 65.09%, 58.32%, and 79.47%, respectively. This represents reductions of 9.38%, 26.43%, 19.52%, 26.29%, and 5.14% compared to the control site. It is evident that each site effectively controls aeolian activities near the surface at 5 cm, with the 37aZJ-C site exhibiting the most effective control, achieving a cumulative sediment transport rate of 0. The 10aSZ-HJ and 10aZJ-C sites follow in terms of effectiveness in controlling near-surface aeolian activities.
Sediment transport variation is an important indicator of surface wind erosion, providing a clear reflection of the sand-retention benefits of different underlying surfaces and serving as a critical measure of the severity of sand damage in sandy regions [40]. The cumulative sand transport volume overall demonstrated the following trend: 37aZJ-C < 17aZJ-C < 10aWZ-HJ < 10aNZ-HJ < 10aZJ-C < 10aSZ-HJ < CK. In comparison to the other plots, the 10aSZ-HJ plot exhibited the largest cumulative sand transport volume of 6.10 g, significantly surpassing the others (p < 0.05). The 10aZJ-C plot came next, with a cumulative sand transport volume of 4.58, substantially greater than the 10aWZ-HJ, 10aNZ-HJ, 37aZJ-C, and 17aZJ-C plots (p < 0.05). The plot with the least cumulative sand transport volume was the 37aZJ-C plot, which recorded a sand transport volume of 0 g. Among them, the sediment transport height in the 10aSZ-HJ site is the highest at 45 cm, whereas in the 37aZJ-C site, there is no sediment transport, resulting in the lowest sediment transport height. The sediment transport heights in the remaining sites are all 25 cm. (Supplementary Table S2). From Figure 6, At a height of 5 cm from the ground, the sand stabilization effect of the 37aZJ-C plot was significantly superior to that of other plots (p < 0.05). At 15 cm, although there was no significant difference in the sand stabilization effects between 17aZJ-C and 37aZJ-C plots (p > 0.05), they were both markedly superior to other plots (p < 0.05). The sand stabilization effects of the 10aNZ-HJ, 10aSZ-HJ, 10aWZ-HJ, 10aZJ-C, 17aZJ-C, and 37aZJ-C plots were all above 95% within 15 cm from the ground. This suggests that vegetation can effectively reduce surface wind and sand activity. The average sand-fixing benefits of each site are 99.59%, 94.31%, 99.76%, 95.17%, 99.92%, and 100%, respectively. Overall, the sand-fixing benefits of the sites are ranked as 37aZJ-C > 17aZJ-C > 10aWZ-HJ > 10aNZ-HJ > 10aZJ-C > 10aSZ-HJ.

3.4. Shelter Forest Surface Erosion Characteristics

Vegetation not only blocks incoming sand and wind but also plays a role in stabilizing the original sand surface. Under the long-term action of airflow vortices, the original sand surface inside the vegetation can be fully eroded to form a stable concave surface, which is the most intuitive manifestation of vegetation surface erosion and sand-fixing effects. The surface characteristic maps of each forest type show that the surface topography within the forests has changed significantly, with undulating forms varying significantly depending on the forest type. According to the distribution of relative erosion depths and the fitting of concave surface shapes within different forest types, as shown in Figure 7, there are significant differences in erosion within the forests under the action of wind, with distinct morphological differences due to different forest types. Overall, the forest morphology shows coexistence of peaks and valleys. In the 10aNZ-HJ and 10aZJ-C sites, the lowest erosion points appear on the leeward side, showing a “dipper” concave surface with a lower leeward and higher windward profile. In the 10aSZ-HJ site, the lowest erosion point appears on the leeward side, presenting a concave surface with lower middle and higher surroundings. In the 10aWZ-HJ site, the lowest erosion point appears on the leeward side, exhibiting a concave surface with a higher windward and lower leeward profile. In the 17aZJ-C site, the lowest erosion point also appears on the leeward side, showing a profile that is higher in the W-N direction and lower in the other directions. In the 37aZJ-C site, the lowest erosion point appears on the leeward side, forming a concave surface with higher elevations in the northwest (windward) direction and lower elevations in the southeast (leeward) direction. Due to the obstruction of sand grains by vegetation, sand deposition occurs on the windward side, leading to a decrease in sand content and an increase in sand-carrying capacity within the sand flow. Therefore, erosion occurs on the leeward side. In the case of the mobile dune site, the leeward side shows the lowest erosion point, indicating an overall erosion state.
The results in Table 3 show that all sites generally exhibit an accumulation state. In the Caragana liouana pure forest, the relative accumulation areas of the 10aZJ-C and 17aZJ-C sites both reached 76.00%. With increasing stand age, the relative accumulation area decreased. In the 10-year-old Caragana liouana pure forest, the erosion depth ranged from −1 to 2 cm, with the lowest point decreasing by 0.6 cm and the highest point increasing by 1.5 cm. The 17aZJ-C site showed slight undulations, with the erosion depth ranging from −1 to 3 cm, and the lowest point decreased by 0.6 cm. In the 0–3 cm depth range, the relative accumulation area distribution was 76.00%. The 37aZJ-C site exhibited significant fluctuations in surface undulation, with the erosion depth ranging from −1 to 2 cm, and the lowest point decreased by 1.00 cm. In the 0–2 cm depth range, the relative accumulation area distribution was 68.00%. In the mixed forest, the 10aWZ-HJ site had the largest relative accumulation area at 88.00%, with the erosion depth ranging from −2 to 3 cm. The lowest point decreased by −1.4 cm, and the highest point increased by 2.8 cm. The 10aSZ-HJ site had a relative accumulation area of 84.00%, with the erosion depth ranging from −1 to 3 cm, and the lowest point decreased by 0.6 cm. The 10aNZ-HJ site had the smallest relative accumulation area at 68.00%, with slight undulations, and the erosion depth ranged from −2 to 2 cm, with the lowest point decreasing by 1.4 cm. In the mobile dune site, the surface undulation was the largest, with the erosion depth ranging from −4 to 0 cm, indicating an erosive state, and the lowest point decreased by 3.3 cm. In the −2 to 0 cm depth range, the relative erosion depth area accounted for 100.00%. According to Figure 8, the average intensity of wind erosion for each site was as follows: 10aWZ-HJ > 10aSZ-HJ > 10aZJ-C > 17aZJ-C > 37aZJ-C > 10aNZ-HJ > CK, indicating that all sites were primarily affected by wind accumulation. The average intensity of wind erosion was the largest in the 10aWZ-HJ site, at 1.11.

4. Discussion

4.1. Wind Protection Efficiency of Different Stand Types

In the process of wind and sand control in arid or semi-arid desertification-prone areas, vegetation cultivation is the most widely applied measure and the most effective, long-lasting, and environmentally friendly method for protecting soil from wind erosion [41,42,43]. There are three main ways in which vegetation affects wind erosion [44]. The first is through collision interception to cause sand deposition [45]. The second is by increasing the aerodynamic roughness of the ground surface through coverage, thereby reducing the direct erosive effect of the wind on the ground [16,18]. Liu Jiaqi et al. [15] concluded from wind tunnel experiments that the increase in aerodynamic roughness and friction rate under vegetation cover conditions has a significant impact on soil wind erosion. The third approach is to alter the airflow field, weaken the surface wind momentum, and thus reduce the sediment-carrying capacity of surface wind and sand flow. After the establishment of vegetation in sandy areas, the vegetation has the effect of lifting the air flow. The airflow gradually accumulates energy above the vegetation, and the wind speed recovers faster than that of the same height of the mobile sand dunes, showing a trend of gradually surpassing the wind speed of the mobile sand dunes at higher levels [46,47]. The above-ground part of the vegetation can cause the decomposition of the wind and sand flow, effectively lift the flow field, disperse the wind momentum in the near-surface airflow, and cause changes in the near-surface wind speed profile, thereby reducing the erosive effect of the wind on the surface [48]. The windbreak and sand-fixing forests primarily achieve their windbreak and sand-fixing mechanisms by altering the vertical wind speed amplification of the wind speed profile, increasing the surface roughness, and changing the structure of the wind and sand flow. Research by Miri et al. [49] and Shahid Latif Bhutto et al. [43] also demonstrates that different plants have varying effects on wind erosion prevention, and plant height can significantly influence the effectiveness of wind erosion prevention. The study results are similar to previous research. In this study, each protective forest had a significant impact on wind protection. The wind speeds in the protective forests were notably lower compared to the bare sand dunes, with a clear reduction in wind speeds at 0–20 cm above the ground in the protective systems. As the height increased, the overall windbreak efficiency values showed a decreasing trend. This may be because when the wind passes through the plants, it experiences frictional resistance, leading to a decrease in wind speed near the ground. As it approaches the top of the plant, the influence of the plant on the wind speed diminishes [48]. This study, through comparing the windbreak characteristics of each protective forest, found that in the respective forest plots, the windbreak effect of the pure Caragana liouana forest improved with the increase in stand age. Similarly, Jiang Deming et al. [50] also revealed that the comprehensive windbreak performance of Caragana microphylla increased with stand age. As the stand age increased, both plant height and canopy width increased, thereby leading to a better windbreak effect [51,52]. In the mixed forest, the windbreak benefit of the 10-year-old Salix cheilophila and Caragana liouana forest was higher than that of the 37-year-old pure Caragana liouana forest. This is similar to the findings of Su et al. [53] and Zhao et al. [54], possibly due to the inconsistent growth status of different species in the mixed forest, leading to a more complex structural distribution and denser branches [55], thereby resulting in the most effective windbreak effect.

4.2. Redistribution of Different Stand Types on Near-Surface Aeolian Sand Flows

Wind erosion is a significant physical process in which sand particles are carried along the surface by the wind, particularly prevalent in arid and desert regions. The windy seasons in desert areas are often accompanied by the occurrence of sandstorms. When the wind speed exceeds the local threshold for sand movement, sand transport with the wind commonly occurs. Different surface morphologies often result in different types of wind and sand flow structures. On the surface of the sand, over 90% of the sand material is concentrated within 0–10cm, and the sand content in the 0–30 cm wind and sand flow reaches over 98% [56], a finding consistent with previous research as well as the results of this study. The variation of sediment transport in each protective forest in the study area exhibits a clear exponential function change with height, with sediment transport mainly concentrated within the first 30 cm from the ground, accounting for over 90% of the total sediment transport. This indicates that the protective system plays a crucial role in the redistribution of wind and sand flows. Liu et al. [57] found through research on the wind and sand flow structure at the crescent-shaped sand dune crest that, under the windward direction, the sediment transport decreases exponentially with increasing height, and the transport of sand material by the airflow is concentrated within the first 30 cm from the ground. Under the leeward direction, the sediment transport initially increases and then decreases with height, with a trend that closely approximates a bimodal Gaussian function, and the sand content in the airflow is highest within the 30–50 cm height range. Ding et al. [58] evaluated the sand control benefits of the windbreak forest system in the Jilantai Salt Lake area over 35 years. They found that the increase in forest cover led to a more pronounced reduction in surface wind speed. Under the influence of the windbreak forest belt, the sand flow in the forest belt tended to stay close to the ground, with over 84.70% of the sediment transport occurring within the first 30 cm above the ground. From the perspective of sand fixation, controlling the sand flow within 0–30 cm or even 0–10 cm would be sufficient to meet the requirements of wind and sand control. From this perspective, all protective forests are effective in controlling near-surface sand activity. However, when analyzing the changes in sediment transport, sediment transport rates, and cumulative sediment transport rates, it is observed that in the 0–15 cm layer, the sediment transport of 10aNZ-HJ, 10aWZ-HJ, 17aZJ-C, and 37aZJ-C accounts for more than 90% of the total sediment transport, while that of 10aZJ-C and 10aSZ-HJ accounts for more than 80% of the total sediment transport. This may be because in the Caragana liouana pure forest, with the increasing age of the forest, the growth in the crown width and plant height leads to natural sparse distribution of the forest [59]. Despite the individual plants growing larger, the spacing between them also increases. As the plants mature, they primarily form a dense canopy in the middle and upper parts, while there are fewer branches in the lower parts, creating “passages”. This canopy structure causes most of the airflow passing through the Caragana liouana to bypass the upper part of the canopy. However, some airflow may pass through the trunks and the “passages” between the plants. The reduced branching in the lower layers results in a certain “venturi effect” during strong winds [60,61], leading to erosion near the roots and subsequently increasing the sediment transport. In the mixed forest, the lowest sediment transport was observed within the 15 cm near-ground layer in the 10aSZ-HJ site, possibly due to the fact that the Artemisia desertorum belong to the category of shrubs or small shrubs, and the plant size is smaller than that of the same-aged Caragana liouana. Therefore, the Artemisia desertorum can effectively reduce the “venturi effect” in the lower layers of the mixed forest, thereby reducing the sediment transport. In terms of sand fixation benefits alone, the 37-year-old pure Caragana liouana forest demonstrates a clear advantage. However, with the increasing age of the forest, the plants gradually undergo aging and degradation, resulting in a decrease in the sand-fixation effect. From the perspective of protective duration, the planting of the mixed forest of Caragana liouana and Salix cheilophila is the most effective forest protection configuration in the experimental area, as it provides excellent results and has a long service life.

4.3. Morphological Characteristics of Forest Surface in Forests of Different Stand Types

The interaction between the flow field structure and the wind–sand flow structure causes erosion or deposition on the surface of the sand dunes, leading to changes in the surface morphology [42,55]. Surface erosion conditions can be reflected, to some extent, by evaluation indicators such as erosion intensity, which can represent the transformation modes of wind erosion and wind deposition on the surface. The inhibitory effect of vegetation on surface wind and sand activities is manifested in surface coverage, reducing the speed of surface airflow movement [62], ensuring that fine particles on the surface are not eroded. Secondly, it involves the decomposition of upwind airflow, reducing its sand-carrying capacity [63]. Hu et al. [38] studied the wind erosion and deposition conditions of vegetation patches in the desert-oasis transition zone in the middle reaches of the Heihe River. The study found that wind erosion activities in the desert-oasis transition zone mainly transitioned from wind erosion to wind deposition, and their intensity and spatial pattern changes were directly related to regional terrain, vegetation coverage, and meteorological factors. Mao et al. [64] observed surface erosion of different underlying surfaces in the transition zone from the oasis to the desert in Cele, Xinjiang. They found that mobile sand surfaces exhibited strong surface wind erosion, semi-fixed sand surfaces showed strong surface wind deposition, and fixed sand surfaces with higher vegetation coverage, taller and more uniformly arranged plants, and lower overall terrain exhibited greater wind deposition and less wind erosion per unit area. Liu et al. [65] conducted field research on the desert-oasis transition zone at the southern edge of the Taklimakan Desert, indicating that surface deposition predominates with 30% vegetation coverage. This process can intercept a considerable portion of suspended matter, leading to a refinement of the surface particle size distribution. Consistent with this study, the results here indicate an overall state of accumulation in all the sample areas. This is attributed to the vegetation coverage exceeding 30% in all protective forest sample areas. As the airflow encounters the vegetation, it is impeded, leading to a deceleration zone near the surface. Consequently, the wind speed decreases sharply, causing sand particles to accumulate on the ground [8,61]. In the case of the pure Caragana liouana forest, the decrease in the accumulation area with the increase in forest age may be due to the natural sparse growth of the Caragana liouana resulting from limitations in water and soil resources [59]. This leads to a decrease in vegetation coverage and an increase in the spacing between plants. The formation of “aisles” between plants during high winds induces a certain “channeling effect” [60,61], causing accelerated flow between the plants, leading to the formation of elongated wind erosion gullies on both sides [61,66]. Therefore, the decrease in the relative accumulation area in the pure Caragana liouana forest with increasing forest age is attributed to these factors. In the mixed forest, the 10aWZ-HJ site exhibits the largest relative accumulation area. This could be attributed to the faster growth rate of Salix cheilophila compared to Caragana liouana at the same age. As a result, it effectively reduces the “narrow channel effect” between plants. Additionally, Salix cheilophila has well-developed branches and dense foliage, which can obstruct wind and sand flow, facilitating direct sedimentation of sand particles. Thus, the 10aWZ-HJ site shows the largest relative accumulation area.

4.4. Areas for Improvement

Moreover, though this study assessed the wind and sand stabilization characteristics of Caragana liouana artificial forests of varied ages, as well as their diverse types of mixed forests, providing a theoretical basis for the construction of wind and sand stabilization in high-altitude sandy areas, several issues remain unresolved. These include how the protective effects of different types of mixed forests change over time. Our subsequent research will explore the impacts of different forest types on the long-term wind and sand control functions of the region, as well as the comparisons between engineering sand stabilization measures and plant sand stabilization measures, and their influences on the long-term wind and sand control functions of the region. We will also analyze the differences in socioeconomic benefits generated by these measures.

5. Conclusions

This study reveals that different types of sand-fixing plants in the Gonghe Basin of the Qinghai-Tibet Plateau have good windbreak effects. The wind-speed profiles within the sample sites of 0aNZ-HJ, 10aSZ-HJ, 10aWZ-HJ, 10aZJ-C, 17aZJ-C, and 37aZJ-C exhibit a linear distribution pattern. The windbreak effects of each forest sample site decrease with the increasing distance from the ground. The windbreak effects of plant communities have a substantial impact within a broader range of vegetation height, and also outside the plant height range, although the effect is less pronounced than within the plant height range. Overall, the 10aWZ-HJ plot shows a significant alteration in the wind speed profile, with the greatest blocking and weakening effect on the wind speed, particularly at a height of 200 cm, where its windbreak efficiency can still reach 41.04%. The overall sand-fixation benefits near the ground surface decrease as the sand accumulation height increases. The trend is as follows: 37aZJ-C > 17aZJ-C > 10aWZ-HJ > 10aNZ-HJ > 10aZJ-C > 10aSZ-HJ. In each site, aeolian deposition is the dominant process. The erosion intensity of the bare sand dune without vegetation cover is much greater than that of the various protective forests. In the pure Caragana liouana forest, the average intensity of aeolian deposition decreases with the increase in forest age. In the mixed forest, the 10aWZ-HJ site has the highest average intensity of aeolian deposition. This once again confirms that different surface covers have a more significant effect on intercepting sand material transport and achieving surface soil accumulation. Considering the windbreak and sand-fixation functions, the stability of forest stands, and the duration of protection, this study suggests that in the cold desert areas of the Qinghai-Tibet Plateau, promoting the mixed forest of Salix cheilophila and Caragana liouana as the main windbreak and sand-fixation forest combination is suitable in the Gonghe Basin. Especially during the spring, when wind and sand activities are most frequent, the mixed forest of Ulmus pumila and Caragana liouana demonstrates more significant windbreak and sand-fixation capabilities compared to other mixed and pure forests.

Supplementary Materials

The following supporting information can be downloaded at: https://www.mdpi.com/article/10.3390/f14122342/s1, Table S1: Characteristics of sediment transport rates for different forest stands; Table S2: Accumulative sediment transport and sediment transport height of different types of land.

Author Contributions

Conceptualization, J.Z. and Z.J.; data curation, J.Z.; formal analysis, J.Z.; funding acquisition, Z.J.; investigation, J.Z., Q.L., L.W. and D.H.; methodology, J.Z., Z.J., L.H. and X.Z.; project administration, J.Z., Z.J., Q.L. and L.H.; visualization, J.Z.; writing—original draft, J.Z.; writing—review and editing, J.Z., Z.J., Q.L., L.H., X.Z., L.W. and D.H. All authors have read and agreed to the published version of the manuscript.

Funding

The research was funded by the Key R&D projects in China (project No. 2022YFF1302503-2), the Special fund project of the Research Institute of Forestry Chinese Academy of Forestry Sciences (project No. LYSZX202003), and the Special fund from the Research Institute of Forestry Chinese Academy of Forestry Key Laboratory of Forest Cultivation (project No. ZDRIF201903).

Data Availability Statement

Data is contained within the article.

Conflicts of Interest

The authors declare no conflict of interest.

References

  1. Akbari, M.; Shalamzari, M.J.; Memarian, H.; Gholami, A. Monitoring desertification processes using ecological indicators and providing management programs in arid regions of Iran. Ecol. Indic. 2020, 111, 106011. [Google Scholar] [CrossRef]
  2. Li, C.J.; Abulimiti, M.; Fan, J.L.; Wang, H.F. Ecologic service, economic benefits, and sustainability of the man-made ecosystem in the Taklamakan Desert. Front. Environ. Sci. 2022, 10, 259–270. [Google Scholar] [CrossRef]
  3. Liang, X.; Li, P.; Wang, J.; Chan, F.K.S.; Togtokh, C.; Ochir, A.; Davaasuren, D. Research progress of desertification and its prevention in Mongolia. Sustainability 2021, 13, 6861. [Google Scholar] [CrossRef]
  4. Fussell, J.C.; Kelly, F.J. Mechanisms underlying the health effects of desert sand dust. Environ. Int. 2021, 157, 106790–106804. [Google Scholar] [CrossRef] [PubMed]
  5. Joshi, J.R. Quantifying the impact of cropland wind erosion on air quality: A high-resolution modeling case study of an Arizona dust storm. Atmos. Environ. 2021, 263, 118658–118680. [Google Scholar] [CrossRef]
  6. Lyu, Y.; Shi, P.; Han, G.; Liu, L.; Guo, L.; Hu, X.; Zhang, G. Desertification control practices in China. Sustainability 2020, 12, 3258. [Google Scholar] [CrossRef]
  7. Taylor, N.T.; Davis, K.M.; Abad, H.; McClung, M.R.; Moran, M.D. Ecosystem services of the Big Bend region of the Chihuahuan Desert. Ecosyst. Serv. 2017, 27, 48–57. [Google Scholar] [CrossRef]
  8. Torshizi, M.R.; Miri, A.; Shahriari, A.; Dong, Z.; Davidson-Arnott, R. The effectiveness of a multi-row Tamarix windbreak in reducing aeolian erosion and sediment flux, Niatak area, Iran. J. Environ. Manag. 2020, 265, 110486–110498. [Google Scholar] [CrossRef]
  9. Xin, G.W.; Huang, N.; Zhang, J.; Dun, H.C. Investigations into the design of sand control fence for Gobi buildings. Aeolian Res. 2021, 49, 100662–100673. [Google Scholar] [CrossRef]
  10. Zang, Y.X.; Gong, W.; Xie, H.; Liu, B.L.; Chen, H.L. Chemical sand stabilization: A review of material, mechanism, and problems. Environ. Technol. Rev. 2015, 4, 119–132. [Google Scholar] [CrossRef]
  11. Kheirfam, H.; Asadzadeh, F. Stabilizing sand from dried-up lakebeds against wind erosion by accelerating biological soil crust development. Eur. J. Soil Biol. 2020, 98, 103189–103196. [Google Scholar] [CrossRef]
  12. Fattahi, S.M.; Soroush, A.; Huang, N. Wind erosion control using inoculation of aeolian sand with cyanobacteria. Land Degrad. Dev. 2020, 31, 2104–2116. [Google Scholar] [CrossRef]
  13. Li, B.; Sherman, D.J. Aerodynamics and morphodynamics of sand fences: A review. Aeolian Res. 2015, 17, 33–48. [Google Scholar] [CrossRef]
  14. Yan, B.; Ma, J.; Na, L. Synthesis and swelling behaviors of sodium carboxymethyl cellulose-g-poly(AA-co-AM-co-AMPS)/MMT superabsorbent hydrogel. Carbohydr. Polym. 2011, 84, 76–82. [Google Scholar] [CrossRef]
  15. Liu, J.Q.; Kimura, R.; Miyawaki, M.; Kinugasa, T. Effects of plants with different shapes and coverage on the blown-sand flux and roughness length examined by wind tunnel experiments. Catena 2021, 197, 104976. [Google Scholar] [CrossRef]
  16. Han, Y.; Zhao, W.W.; Ding, J.Y.; Ferreira, C.S.S. Soil erodibility for water and wind erosion and its relationship to vegetation and soil properties in China’s drylands. Sci. Total Environ. 2023, 903, 166639. [Google Scholar] [CrossRef]
  17. Elagib, N.A.; Al-Saidi, M. Balancing the benefits from the water–energy–land–food nexus through agroforestry in the Sahel. Sci. Total Environ. 2020, 742, 140509. [Google Scholar] [CrossRef] [PubMed]
  18. Fakhech, A.; Ouahmane, L.; Hafidi, M. Analysis of symbiotic microbial status of Atlantic sand dunes forest and its effects on Acacia gummifera and Retama monosperma (Fabaceae) to be used in reforestation. J. For. Res. 2020, 31, 1309–1317. [Google Scholar] [CrossRef]
  19. Danin, A. Plant adaptations in desert dunes. J. Arid. Environ. 1991, 21, 193–212. [Google Scholar] [CrossRef]
  20. Shamsutdinov, Z.S.; Shamsutdinov, N.Z. Biogeocenotic principles and methods of environmental restoration of desert pasture ecosystems in Central Asia. Arid. Ecosyst. 2012, 2, 139–149. [Google Scholar] [CrossRef]
  21. Zhang, J.M.; Yu, X.X.; Jia, G.D.; Liu, Z.Q. Determination of optimum vegetation type and layout for soil wind erosion control in desertified land in North China. Ecol. Eng. 2021, 171, 106383. [Google Scholar] [CrossRef]
  22. Pang, Y.J.; Wu, B.; Jia, X.H.; Xie, S.B. Wind-proof and sand-fixing effects of Artemisia ordosica with different coverages in the Mu Us Sandy Land, northern China. J. Arid. Land 2022, 14, 877–893. [Google Scholar] [CrossRef]
  23. Jia, Z.X.; Wang, X.F.; Feng, X.M.; Ma, J.H.; Wang, X.X.; Zhang, X.R.; Zhou, J.T.; Sun, Z.C.; Yao, W.J.; Tu, Y. Exploring the spatial heterogeneity of ecosystem services and influencing factors on the Qinghai Tibet Plateau. Ecol. Indic. 2023, 154, 110521. [Google Scholar] [CrossRef]
  24. Chen, M.Q.; Shao, Q.Q.; Ning, J.; Liu, G.B.; Liu, S.C.; Niu, L.N.; Zhang, X.Y.; Huang, H.B. Analysis on Ecological Restoration in Different Ecogeographical Divisions of the Tibetan Plateau. Acta Agrestia Sin. 2023, 31, 1211–1225. [Google Scholar] [CrossRef]
  25. Cetin, M. The Changing of Important Factors in The Landscape Planning Occur Due to Global Climate Change in Temperature, Rain and Climate Types: A Case Study of Mersin City. Turk. J. Agric. Food Sci. Technol. 2020, 8, 2695–2701. [Google Scholar] [CrossRef]
  26. Lian, X.H.; Jiao, L.M.; Hu, Y.C.; Liu, Z.J. Future climate imposes pressure on vulnerable ecological regions in China. Sci. Total Environ. 2023, 858, 159995. [Google Scholar] [CrossRef] [PubMed]
  27. Wang, L.Y.; Wu, Q.B.; Fu, Z.T.; Jiang, G.L.; Liu, Y.L.; Xu, K.M. Aeolian sand accumulation and land desertification over the past 1500 years as revealed by two aeolian dunes in the Beiluhe Basin on interior Qinghai-Tibet Plateau, SW China. Quat. Int. 2022, 613, 101–117. [Google Scholar] [CrossRef]
  28. Tian, L.H.; Wu, W.Y.; Zhang, D.S.; Yu, Y. Airflow field around Hippophae rhamnoides in alpine semi-arid desert. Land 2020, 9, 140. [Google Scholar] [CrossRef]
  29. Li, Y.F.; Li, Z.W.; Wang, Z.Y.; Wang, W.L.; Jia, Y.H.; Tian, S.M. Impacts of artificially planted vegetation on the ecological restoration of movable sand dunes in the Mugetan Desert, northeastern Qinghai-Tibet Plateau. Int. J. Sediment Res. 2017, 32, 277–287. [Google Scholar] [CrossRef]
  30. Cao, X.; Jiao, J.Y.; Li, J.J.; Qi, H.K.; Bai, L.C.; Wang, X.; Sun, X.C. Morphometric characteristics and sand intercepting capacity of dominant perennial plants in the Eastern Qaidam Basin: Implication for aeolian erosion control. Catena 2022, 210, 105939. [Google Scholar] [CrossRef]
  31. Wu, W.Y.; Zhang, D.S.; Tian, L.H.; Zhang, M.Y.; Zhou, X. Ecological responses of Hippophae rhamnoides to wind-sand hazard in alpine sand land. Bull. Soil Water Conserv. 2018, 38, 1–8. [Google Scholar] [CrossRef]
  32. Li, X.Y.; Wang, K.J.; Gu, J.C.; Liu, Q.G.; Cui, Y. Windbreak effect model of forest belts with different structure. J. Desert Res. 2019, 39, 118–125. [Google Scholar] [CrossRef]
  33. Li, Q.X.; Yang, D.F.; Jia, Z.Q.; Zhang, L.H.; Zhang, Y.Y.; Feng, L.L.; He, L.X.Z.; Yang, K.Y.; Dai, J.; Chen, J.; et al. Changes in soil organic carbon and total nitrogen stocks along a chronosequence of Caragana liouanaa plantations in alpine sandy land. Ecol. Eng. 2019, 133, 53–59. [Google Scholar] [CrossRef]
  34. Yang, K.Y.; Jia, Z.Q.; Zhang, L.H.; Li, Q.X.; He, L.X.Z.; Dai, J.; Chen, J. Study on spatial distribution characteristics of soil water in typical plantation of Alpine sandy land. J. Arid. Land Resour. Environ. 2019, 33, 88–94. [Google Scholar] [CrossRef]
  35. Dai, J.; Jia, Z.Q.; Li, Q.X.; He, L.X.Z.; Yang, K.Y.; Gao, Y. Effects of Natural Rainfall on Soil Respiration of Caragana Plantation in Alpine Sandland. For. Res. 2020, 33, 151–159. [Google Scholar] [CrossRef]
  36. Li, Q.; Jia, Z.; He, L.; Zhao, X.; Yang, X. The Allocation and Cycling Characteristics of Main Nutrients for Caragana intermedia With Different Stand Age on Alpine Sandy Land. For. Res. 2023, 36, 119–128. [Google Scholar] [CrossRef]
  37. Liu, L.Y. The quantity and intensity of regional aeolian sand erosion and deposition: The case of shanxi-sha an xi-nei monggol region. Acta Geogr. Sin. 1999, 54, 59–68. [Google Scholar] [CrossRef]
  38. Hu, G.L.; Wang, D.J.; Feng, Y.X.; Zhang, H.W.; Chen, H.X.; Zhao, C.Y. Intensity of Wind Erosion and Deposition in Patch Vegetation Area of Desert Oasis Ecotone in the Middle Reaches of the Heihe River of China. J. Desert Res. 2016, 36, 1547–1554. [Google Scholar] [CrossRef]
  39. Li, Y.K.; Li, J.R.; Dong, L.; Luo, X.Y.; Han, Z.E.; Wang, R. The wind and sand resistance effect of four vegetation types in Ulan Buhe Desert. J. Dessert Res. 2022, 42, 65–73. [Google Scholar] [CrossRef]
  40. Zhou, X.; Tian, L.H.; Zhang, D.S.; Wu, W.Y.; Zhang, M.Y.; Zhang, P. Study on wind—Prevention and sand—Fixing benefits of different vegetation on the east coast dune of Qinghai Lake. J. Arid. Land Resour. Environ. 2018, 32, 180–185. [Google Scholar] [CrossRef]
  41. Tariq, A.; Ullah, A.; Sardans, J.; Zeng, F.J.; Graciano, C.; Li, X.Y.; Wang, W.Q.; Ahmed, Z.; Ali, S.; Zhang, Z.H.; et al. Alhagi sparsifolia: An ideal phreatophyte for combating desertification and land degradation. Sci. Total Environ. 2022, 844, 157228. [Google Scholar] [CrossRef] [PubMed]
  42. Fu, G.Q.; Xu, X.Y.; Qiu, X.N.; Xu, G.X.; Shang, W.; Yang, X.M.; Zhao, P.; Chai, C.G.; Hu, X.K.; Zhang, Y.N.; et al. Wind tunnel study of the effect of planting Haloxylon ammodendron on aeolian sediment transport. Biosyst. Eng. 2021, 208, 234–245. [Google Scholar] [CrossRef]
  43. Bhutto, S.L.; Miri, A.; Zhang, Y.; Danish, A.B.; Cao, Q.Q.; Xin, Z.M.; Xiao, H.J. Experimental study on the effect of four single shrubs on aeolian erosion in a wind tunnel. Catena 2022, 212, 106097. [Google Scholar] [CrossRef]
  44. Yu, P.D.; Chen, Y.P.; Li, Y.Q.; Yan, Z.Q.; Wang, X.Y.; Niu, Y.Y.; Gong, X.W. Influence of Vegetation Coverage on Sand Flow Structure and Wind Erosion Yield with Wind Tunnel Experiment as a Case. J. Desert Res. 2019, 39, 29–36. [Google Scholar] [CrossRef]
  45. Miri, A.; Davidson-Arnott, R. The effectiveness of a single Tamarix tree in reducing aeolian erosion in an arid region. Agric. For. Meteorol. 2021, 300, 108324. [Google Scholar] [CrossRef]
  46. Mo, Z.W.; Liu, C.H.; Chow, H.L.; Lam, M.K.; Lok, Y.H.; Ma, S.W.; Wong, F.L.; Yip, P.Y. Roughness sublayer over vegetation canopy: A wind tunnel study. Agric. For. Meteorol. 2022, 316, 108880. [Google Scholar] [CrossRef]
  47. Wolf, S.A.; Nickling, W.G. The protective role of sparse vegetationin wind erosion. Prog. Phys. Geogr. 1993, 17, 50–68. [Google Scholar] [CrossRef]
  48. Webb, N.P.; McCord, S.E.; Edwards, B.L.; Herrick, J.E.; Kachergis, E.; Okin, G.S.; Van Zee, J.W. Vegetation canopy gap size and height: Critical indicators for wind erosion monitoring and management. Rangel. Ecol. Manag. 2021, 76, 78–83. [Google Scholar] [CrossRef]
  49. Miri, A.; Dragovich, D.; Dong, Z. Wind-borne sand mass flux in vegetated surfaces—Wind tunnel experiments with live plants. Catena 2018, 172, 421–434. [Google Scholar] [CrossRef]
  50. Jiang, D.M.; Cao, C.Y.; Toshio, O.; Li, X.H.; Li, M. Study on the Effects of Protection against Wind, Sand-fixation and Soil Improvement of Caragana microphylla Plantations in Horqin Sand Land. Arid. Zone Res. 2008, 25, 653–658. [Google Scholar] [CrossRef]
  51. Li, J.W.; Dosmanbetov, D.A.; Guo, H.; Xin, Z.M.; Liu, P.F.; Liu, M.H. Wind tunnel experiment on protection benefits of arbor-shrub mixed forest belts in different configurations. Trans. Chin. Soc. Agric. Eng. 2020, 36, 95–102. [Google Scholar] [CrossRef]
  52. Wu, W.Y.; Zhang, D.S.; Tian, L.H.; Wei, D.S.; Zhao, C.; Jia, F.F. Mechanism and benefit of wind-prevention and sand-fixation of Hippophae rhamnoides forestation in Ketu Sandy Land around Qinghai Lake. Arid. Land Geogr. 2014, 37, 777–785. [Google Scholar] [CrossRef]
  53. Su, Y.Z.; Zhao, W.Z.; Su, P.X.; Zhang, Z.H.; Wang, T.; Ram, R. Ecological effects of desertification control and desertified land reclamation in an oasis–desert ecotone in an arid region: A case study in Hexi Corridor, northwest China. Ecol. Eng. 2007, 29, 117–124. [Google Scholar] [CrossRef]
  54. Zhao, W.Z.; Hu, G.L.; Zhang, Z.H.; He, Z.B. Shielding effect of oasis-protection systems composed of various forms of wind break on sand fixation in an arid region: A case study in the Hexi Corridor, northwest China. Ecol. Eng. 2008, 33, 119–125. [Google Scholar] [CrossRef]
  55. Ma, R.; Li, J.R.; Ma, Y.J.; Shan, L.S.; Li, X.L.; Wei, L.Y. A wind tunnel study of the airflow field and shelter efficiency of mixed windbreaks. Aeolian Res. 2019, 41, 100544. [Google Scholar] [CrossRef]
  56. Wu, Z. Aeolian Geomorphology and Sand Control Engineering; Chinese Science Publishing: Beijing, China, 2003. [Google Scholar]
  57. Liu, X.Y.; Ning, W.X.; Wang, Z.T. Aeolian Sand Structure at the Brink of Barchans. J. Desert Res. 2019, 39, 76–82. [Google Scholar] [CrossRef]
  58. Ding, Y.L.; Wang, J.; Hu, S.R.; Gao, Y.; Sun, X.R.; Liu, B.; Yang, L.M.; Shen, G.L. Shelter Effect of the Forest Shelterbelt System around Jilantai Salt Lake after 35y’s Running. J. Desert Res. 2019, 39, 111–119. [Google Scholar] [CrossRef]
  59. Condit, R.; Ashton, S.P.; Baker, P.; Yamakura, T. Spatial Patterns in the Distribution of Tropical Tree Species. Science 2000, 288, 1414–1418. [Google Scholar] [CrossRef]
  60. Hong, C.; Liu, C.C.; Zou, X.Y.; Li, H.R.; Kang, L.Q.; Liu, B.; Li, J.F. Wind erosion rate for vegetated soil cover: A prediction model based on surface shear strength. Catena 2020, 187, 104398. [Google Scholar] [CrossRef]
  61. Wasson, R.J.; Hyde, R. Factors determining desert dune type. Nature 1984, 304, 337–339. [Google Scholar] [CrossRef]
  62. Fenta, A.A.; Tsunekawa, A.; Haregeweyn, N.; Poesen, J.; Tsubo, M.; Borrelli, P.; Panagos, P.; Vanmaercke, M.; Broeckx, J.; Yasuda, H.; et al. Land susceptibility to water and wind erosion risks in the East Africa region. Sci. Total Environ. 2020, 703, 135016. [Google Scholar] [CrossRef] [PubMed]
  63. Hesp, P.A.; Dong, Y.; Cheng, H.; Booth, J.L. Wind flow and sedimentation in artificial vegetation: Field and wind tunnel experiments. Geomorphology 2019, 337, 165–182. [Google Scholar] [CrossRef]
  64. Mao, D.L.; Lei, J.Q.; Zeng, F.J.; Wang, C.; Zhou, J.; Zaynulla, R. Sand erosion and deposition on different underlying land surfaces in the desertoasis ecotone in Cele, Xinjiang, China. J. Desert Res. 2014, 34, 961–969. [Google Scholar] [CrossRef]
  65. Liu, J.H.; Wang, X.Q.; Ma, Y.; Tan, T.Z. Spatial heterogeneity of soil grain size on Tamarix ramosissima nebkhas and interdune in desert-oasis ecotone. J. Beijing For. Univ. 2015, 37, 89–99. [Google Scholar] [CrossRef]
  66. Tan, F.Z.; Wang, X.Q.; Wang, H.F.; Xu, J.R.; Yuan, X.X. Wind tunnel simulation on distribution change of erosion and deposition around nebkhas and interdune under different background vegetation coverage. Arid. Zone Res. 2018, 41, 56–65. [Google Scholar] [CrossRef]
Figure 1. Location map of the research area.
Forests 14 02342 g001
Figure 2. Wind speed profiles of different windbreak and sand fixation forest plots. The figure shows the wind speed profiles for all study sites in sub-figure (a), while sub-figures (bh) represent the fitted curves of wind speed variation with height for the 10aNZ-HJ, 10aSZ-HJ, 10aWZ-HJ, 10aZJ-C, 17aZJ-C, 37aZJ-C, and CK study sites, respectively.
Forests 14 02342 g002
Figure 3. Wind prevention efficiency values under different forest stands. The lowercase letters represent significant differences at the 0.05 level.
Forests 14 02342 g003
Figure 4. The variation of sediment transport rate along height in different types and control plots.
Forests 14 02342 g004
Figure 5. The proportion of cumulative sediment transport rate in different stand plots and control plots varies with height.
Forests 14 02342 g005
Figure 6. Sand fixation benefits of different forest sample plots. The lowercase letters represent significant differences at the 0.05 level.
Forests 14 02342 g006
Figure 7. Distribution of relative erosion depth and concave surface morphology under different forest stands.
Forests 14 02342 g007
Figure 8. Change of intensity of wind erosion and deposition. The lowercase letters represent significant differences at the 0.05 level.
Forests 14 02342 g008
Table 1. Sample Site Information.
Type of Protection ForestCaragana liouanaCaragana korshinskiiArtemisia desertorumSalix cheilophilaVegetation Coverage (%)
Average Tree Height (cm)Average Crown Width (cm)Average Tree Height (cm)Average Crown Width (cm)Average Tree Height (cm)Average Crown Width (cm)Average Tree Height (cm)Average Crown Width (cm)
10aNZ-HJ104.1695.45194.25110.38 75
10aSZ-HJ63.6969.65 58.1985.64 48.8
10aWZ-HJ102.91102.28 126.7093.5578.2
10aZJ-C111.49107.94 68.8
17aZJ-C142.92114.46 61
37aZJ-C230.17224.63 59
Table 2. Regression equation for fitting sediment transport height and sediment transport rate.
Type of Protection ForestRegression Equation of Sediment Transport RateR2p
10aNZ-HJy = 0.005e−0.135x1.00<0.001
10aSZ-HJy = 0.018e−0.083x0.98<0.01
10aWZ-HJy = 0.003e−0.001x1.00<0.001
10aZJ-Cy = 0.013e−0.081x0.96<0.01
17aZJ-Cy = 0.002e−0.153x1.00<0.001
CKy = 4.284e−0.182x1.00<0.001
Table 3. Area percentage of different ranges of erosion and deposition depth in each checkerboard (%).
Type of Protection ForestGrouping of Erosion Depth Range (cm)
−4~−3−3~−2−2~−1−1~00~11~22~3
10aNZ-HJ0012.0020.0036.0032.000
10aSZ-HJ00016.0044.0036.004.00
10aWZ-HJ004.008.0036.0032.0020.00
10aZJ-C00024.0044.0032.000
17aZJ-C00024.0048.0024.004.00
37aZJ-C00032.0044.0024.000
CK4.008.0036.0052.00000
Disclaimer/Publisher’s Note: The statements, opinions and data contained in all publications are solely those of the individual author(s) and contributor(s) and not of MDPI and/or the editor(s). MDPI and/or the editor(s) disclaim responsibility for any injury to people or property resulting from any ideas, methods, instructions or products referred to in the content.

