Article

Groundwater Recharge from Below under Changing Hydro-Meteorological Conditions in a Forested and Grassland Site of the Great Hungarian Plain

1
Forest Research Institute, University of Sopron, Várkerület 30/A, H-9600 Sárvár, Hungary
2
Institute of Geomatics and Civil Engineering, Faculty of Forestry, University of Sopron, Bajcsy-Zsilinszky u. 4, H-9400 Sopron, Hungary
3
Department of Land and Water Resources Management, Faculty of Civil Engineering, Slovak University of Technology, Radlinského 11, SK-81005 Bratislava, Slovakia
4
HUN-REN, Centre for Agricultural Research, Institute for Soil Sciences, Herman Ottó út 15, H-1022 Budapest, Hungary
5
Independent Researcher, H-1012 Budapest, Hungary
*
Author to whom correspondence should be addressed.
Forests 2023, 14(12), 2328; https://doi.org/10.3390/f14122328
Submission received: 30 October 2023 / Revised: 21 November 2023 / Accepted: 24 November 2023 / Published: 28 November 2023
(This article belongs to the Section Forest Hydrology)

Abstract

:
The process of groundwater evapotranspiration and its subsequent recharge are fundamental aspects of the Earth’s natural water cycle and have significant implications for the preservation and functionality of various forested ecosystems. This study presents a case analysis examining the recent fluctuations in groundwater levels and their replenishment in two wells situated at a designated forested experimental area and a control site. The magnitude and temporal fluctuations of groundwater recharge were examined through the utilisation of a novel adaptation of the traditional White method, which was specifically tailored to the local context. We also tested the sensitivity of the White method as an indicator of the system’s behaviour because the signal has changed in relation to the access of the forests to groundwater under the conditions of regionally declining groundwater resources and a warming climate. The novelty of this approach is found in the examination of the temporal fluctuations in groundwater recharge, which are influenced by both a decrease in groundwater levels caused by forest evaporation in response to climate change and a regional reduction in groundwater supplies. As a result, the ongoing decrease in groundwater levels may have significant adverse effects on local forests.

1. Introduction

Groundwater recharge refers to the complex processes by which precipitation, surface water, or other sources infiltrate vegetated and bare ground and replenish aquifers. It is a critical component of the Earth’s natural water cycle and plays a vital role in sustaining and maintaining the health of many forested ecosystems. Alterations in the Earth’s climate on a global scale have the potential to exert a substantial impact on groundwater resources, affecting both their quality and quantity [1]. Hence, it is of utmost importance to investigate the spatiotemporal dynamics of evapotranspiration and recharge rates in response to alterations in land use and climate conditions [2]. These topics have received continual attention in the literature around the globe [3,4,5,6,7,8].
Afforestation efforts in Hungary, undertaken as part of climate change adaptation measures, extend to the Great Hungarian Plain. This region is seeing a decline in forest suitability due to unfavourable climate conditions and reduced soil moisture levels. The probable loss of suitable forest habitats is a concerning consequence of the changing climate, mostly due to the increased evaporation rates, particularly in regions characterised by a high aridity index. The majority of forests located on the Great Hungarian Plain are reliant on surplus subsurface water derived from the groundwater in order to sustain their survival [9,10]. Nevertheless, the task of obtaining precise estimates of groundwater evapotranspiration still remains a challenge due to the presence of uncertainties associated with climate factors, vegetation characteristics, hydrogeological conditions, and hydrological parameters [11].
Climate change can alter not only precipitation patterns, temperature regimes, the timing of snowmelt, and vegetation zones but also the length of the growing season [12]. These alterations have significant implications for evapotranspiration, which subsequently affects the quantity and distribution of groundwater recharge. Therefore, understanding how changing climate patterns affect groundwater recharge rates is paramount [13]. The examination of these alterations in forested ecosystems contributes to the preservation of forest and water resources management and the ability to adapt to a dynamic environment in the long run.
Measuring on-site groundwater evapotranspiration poses significant challenges. The conventional techniques commonly employed to assess evapotranspiration from the surface, such as micrometeorological methods, lysimeter weighing, field water balance equations, vorticity covariance methods, and the Bowen ratio method, are not well-suited for directly quantifying groundwater evapotranspiration and estimating associated recharge. This limitation arises due to the disruption of connectivity between the surface and the aquifer caused by the presence of the unsaturated zone. The acquisition of measurements can frequently incur high costs, with the limitation that only point values are provided. Numerous investigations have been carried out globally to estimate groundwater evapotranspiration using various models, such as empirical, statistical, energy balance, Penman, and complementary correlation models [2,14,15], in order to mitigate or incorporate complexities associated with the variability of moisture content in the unsaturated zone.
Long-term fluctuations due to the changing climate have led to the introduction of further sources of uncertainty when quantifying groundwater evapotranspiration and recharge. In the context of regional comparisons and land management studies, it may be required to utilise many sites for measurements or modelling purposes, particularly when dealing with spatially heterogeneous regions, such as mixed forests or wetlands. Hence, it is imperative to prioritise the utilisation of cost-effective and robust methodologies in such scenarios due to practical considerations. Various alternative and indirect methods, including process-based and empirical models, as well as methods relying on diurnal groundwater level changes, might be employed [16,17,18,19].
Phreatophytic plants frequently induce diurnal variations in groundwater levels by their utilisation of subsurface water resources. Methods for estimating evapotranspiration and recharge have been created by analysing the distinct daily fluctuations in the water table caused by the reduction in groundwater levels during plant transpiration. Upon decreased plant transpiration at night, the recharge increases the groundwater table [20]. The characteristic diurnal pattern typically consists of a steep decline during the day and a recovery phase overnight. Different methodologies leverage the attributes of these oscillations to estimate the daily rate of groundwater evaporation in a cost-effective manner. The phenomenon in question has been consistently and systematically investigated and documented since the 1930s, as evidenced by the studies conducted by Healy and Cook [21], Gribovszki et al. [22], Fahle and Dietrich [23], and Hou et al. [2].
This study extends the established White method [24] at a specific study site. The widespread utilisation of this method can be attributed to its relative simplicity and its applicability in on-site evapotranspiration calculations. As a result, it has become the prevailing approach for calculating rates of groundwater evapotranspiration and recharge in arid and semi-arid regions [25]. The concept is based on three underlying assumptions: (1) changes in the groundwater table during the day are mostly caused by plant water consumption; (2) vegetation exhibits minimal water demand during nighttime; and (3) the average daily recharge rate can be approximated by the net inflow rate occurring between midnight and four a.m. The inclusion of subjective aspects within these ideas may impose limitations on the applicability of the strategy in diverse real-life scenarios involving certain aquifers and ecosystems. Therefore, several corresponding improvements have been introduced based on the shortcomings discovered in the assumptions of the original method, which have been extensively discussed by Gribovszki et al. [22] and Hou et al. [2].
These improvements include a considerable amount of uncertainty in quantifying the daily groundwater recovery rate; the quantification of the specific yield; the variability in the amounts of water transpired by plants during the growing season; the choice of the time of recharge; the high heterogeneity of surface vegetation; and the effect of rainfall or irrigation on the water table, variable groundwater fluctuations, transient recharge rate as typically a function of the head difference between the observation well and the recharge source, stress factors, and the growth state of the forests and other vegetation. Consequently, drawing inspiration from the White method, numerous scholars persist in suggesting alterations or alternative approaches based on information about water-table fluctuations [17,20,26,27,28,29,30].
Groundwater recharge rates are influenced by various factors, including the type of vegetation, land use practices, soil qualities, and prevailing climate conditions. The present study addresses the intricate and diverse task of evaluating the groundwater recharge differences between a forested area and a grassland control site in the context of a dynamic climate. This endeavour involves a range of ecological, hydrological, and climatic elements. Understanding these factors is necessary for the effective management of land and water resources in both types of ecosystems [12]. In reaction to the shortcomings listed above and the specific local conditions of the study site, this paper intends to test the performance of an adaptation of the White method, which is described in the methodological section, under a nonstationary hydrological regime caused by the continuous declining trend of groundwater levels in the pilot region.
Forest vegetation has the capacity to evaporate a greater amount of water compared to herbaceous vegetation due to its larger leaf area and deeper root zone, as depicted in Figure 1 [31,32,33,34,35]. Consequently, the water uptake by forest vegetation might surpass that of herbaceous vegetation [25,36,37,38,39], leading to the formation of diverse groundwater depressions beneath the forested areas.
The extent of groundwater depressions under forest stands shows seasonal patterns with different time scales. Groundwater depressions typically exhibit their lowest levels during the spring [9] and gradually increase to their peak by the end of the vegetation period. The values span a range of a few decimetres to approximately 2–3 m [40,41,42,43]. The majority of prior study has been primarily concerned with the phenomenon of seasonal depletion in groundwater levels. Groundwater levels also exhibit diurnal variations characterised by a sinusoidal pattern, wherein the most prominent depressions typically occur in the late afternoon. These depressions generally have a magnitude that ranges on the order of centimetres [22].
The groundwater depressions beneath forests in the Kiskunság Sand Ridge were examined by Szilágyi and Vörösmarty [44] through the utilisation of a physically based groundwater water balance model that incorporated spatially distributed parameters. The researchers reached the conclusion that the average decline in groundwater levels over an extended period of time in forests that have been formed ranges from 0.1 to 0.4 m, as indicated by the model results. In their study, Szilágyi et al. [45] conducted an analysis of evapotranspiration within the Danube–Tisza interfluve region. This analysis was carried out by utilising maps of actual evapotranspiration, which were simulated using MODIS surface temperature data. They found that in forested areas, evaporation was higher (by 70–80 mm) than the precipitation in several locations. In these locations, a negative water balance can only occur if the forests are able to use groundwater resources (including additional inflow/recharge from the surrounding water bodies), which may create a depression in the groundwater levels.
Vágás [46] emphasised the significance of hydraulic factors associated with soil texture in the formation of a groundwater depression. It has been observed that these factors can exert a significantly greater influence on the ensuing groundwater depression compared to the actual evapotranspiration of groundwater.
Such effects of forests in the creation of groundwater level depressions have been reported by various researchers [47,48,49], with a primary focus on the water uptake by forests. In relation to groundwater recharge in the pilot area, there are two distinct mechanisms that can be identified. The first mechanism involves recharge from above, which occurs through the infiltration of precipitation. The second mechanism involves recharge from the sides or from below, which can occur due to the creation of groundwater depression and the presence of preferred regional groundwater flow paths [44].
The decline of groundwater levels on the Great Hungarian Plain, where the pilot area of the present study is located, has emerged as a prominent environmental and agricultural issue for quite a few years. There are multiple potential causes for this phenomenon, including a decrease in the natural replenishment of groundwater due to climate change [50,51,52], as well as inadequate control and monitoring of groundwater extraction. The aforementioned factors may lead to excessive extraction of groundwater, insufficient assessment of its sustainability, intensive irrigation methods, and the historical transformation of natural landscapes for other uses [52].
The management of forests throughout Europe is currently facing significant concerns due to recent climatic changes [53]. The heightened sensitivity of pedunculate oaks to water balances in eastern Hungary [54] suggests that forests on the Great Hungarian Plain may suffer a tendency towards increased risks and heightened vulnerability. This vulnerability stems not only from drought conditions but also from the escalating challenges associated with accessing groundwater.
It can be concluded that in the wooded steppe vegetation zone of the temperate climatic belt, there is limited knowledge about the interactions between forest plantations and groundwater, particularly under the changing conditions of climate change.
This paper presents a case study of the recent dynamics of groundwater levels and recharge at a selected pilot site. The analysis and conclusions are based on diurnal water table fluctuations in two wells located in a forested area and a grassland control point of the Great Hungarian Plain. The comparison of the magnitude, the seasonal and temporal distribution, and the multiannual long-term trends of the groundwater recharge are based on values estimated by the White method. The novelty of this approach is in the analysis of temporal fluctuations in groundwater recharge, which are influenced by both the depletion of groundwater caused by forest evapotranspiration and the overall regional decline in groundwater levels. The present study aims to evaluate the efficacy of the White method as a reliable indicator for detecting alterations in forest access to groundwater. The objective of this study is to enhance our comprehension of the temporal fluctuations in the accessibility of groundwater for evapotranspiration and growth in local forests, particularly in the context of nonstationary meteorological circumstances and the diminishing supply of groundwater.

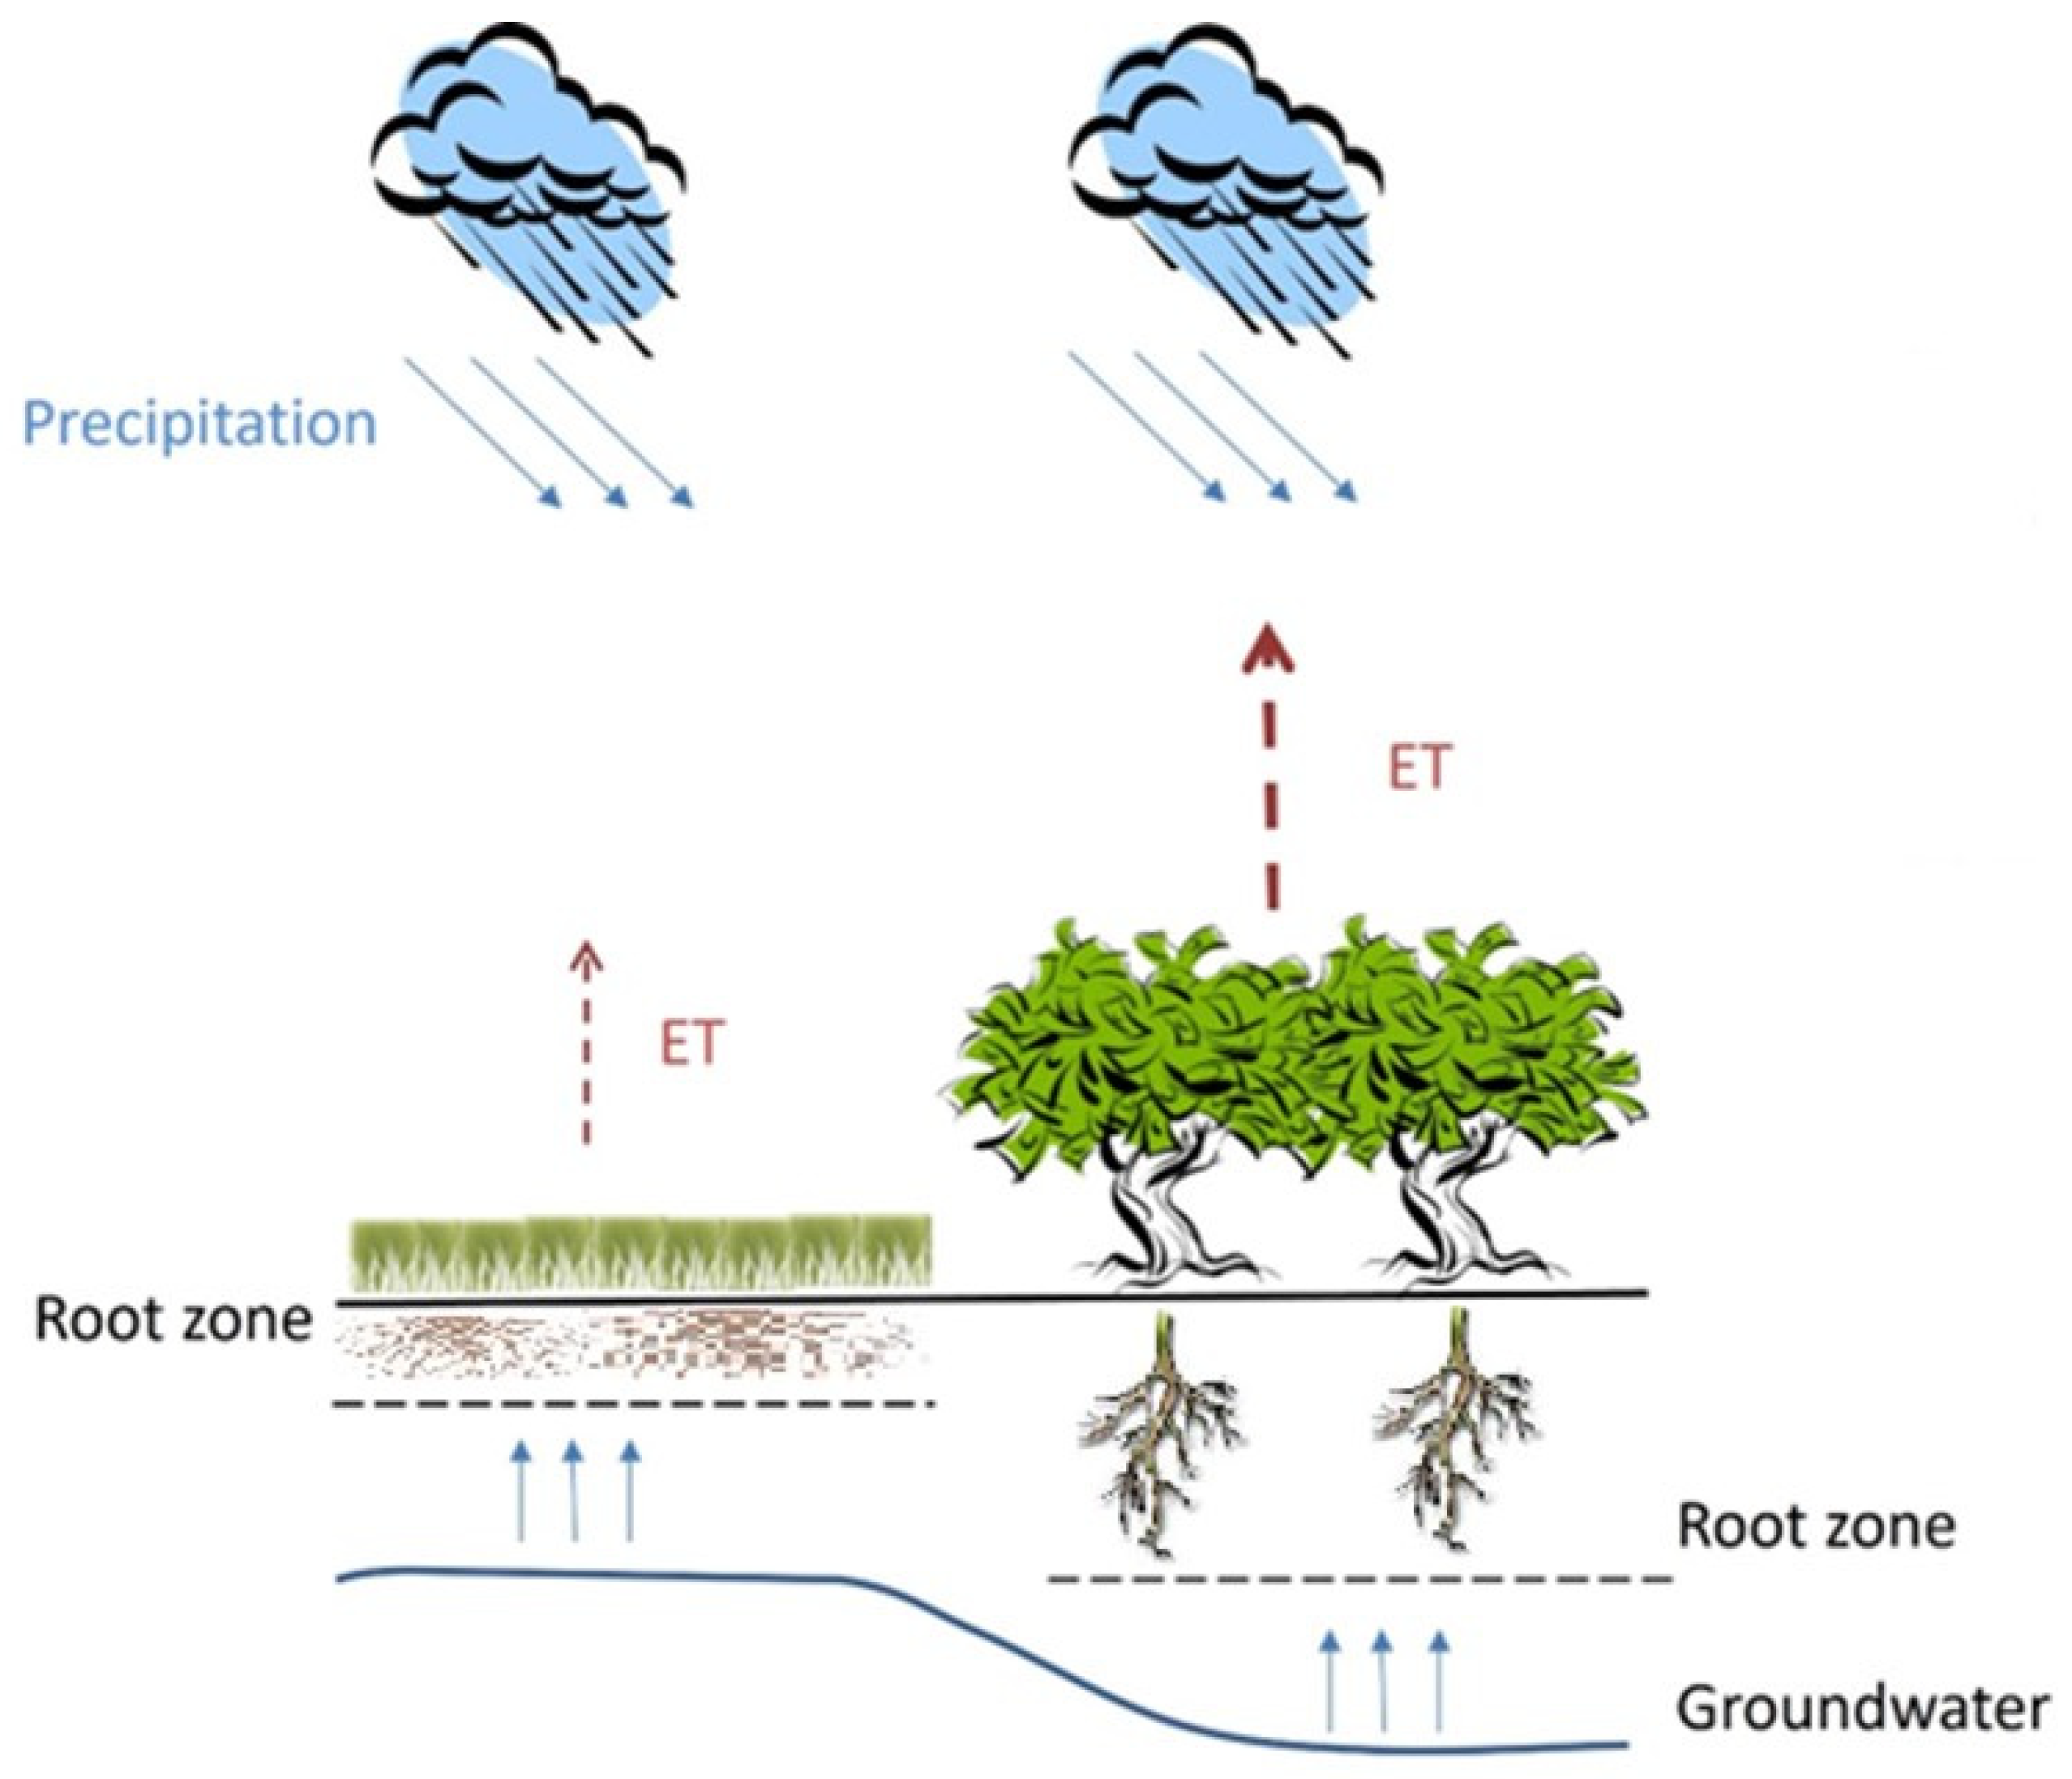
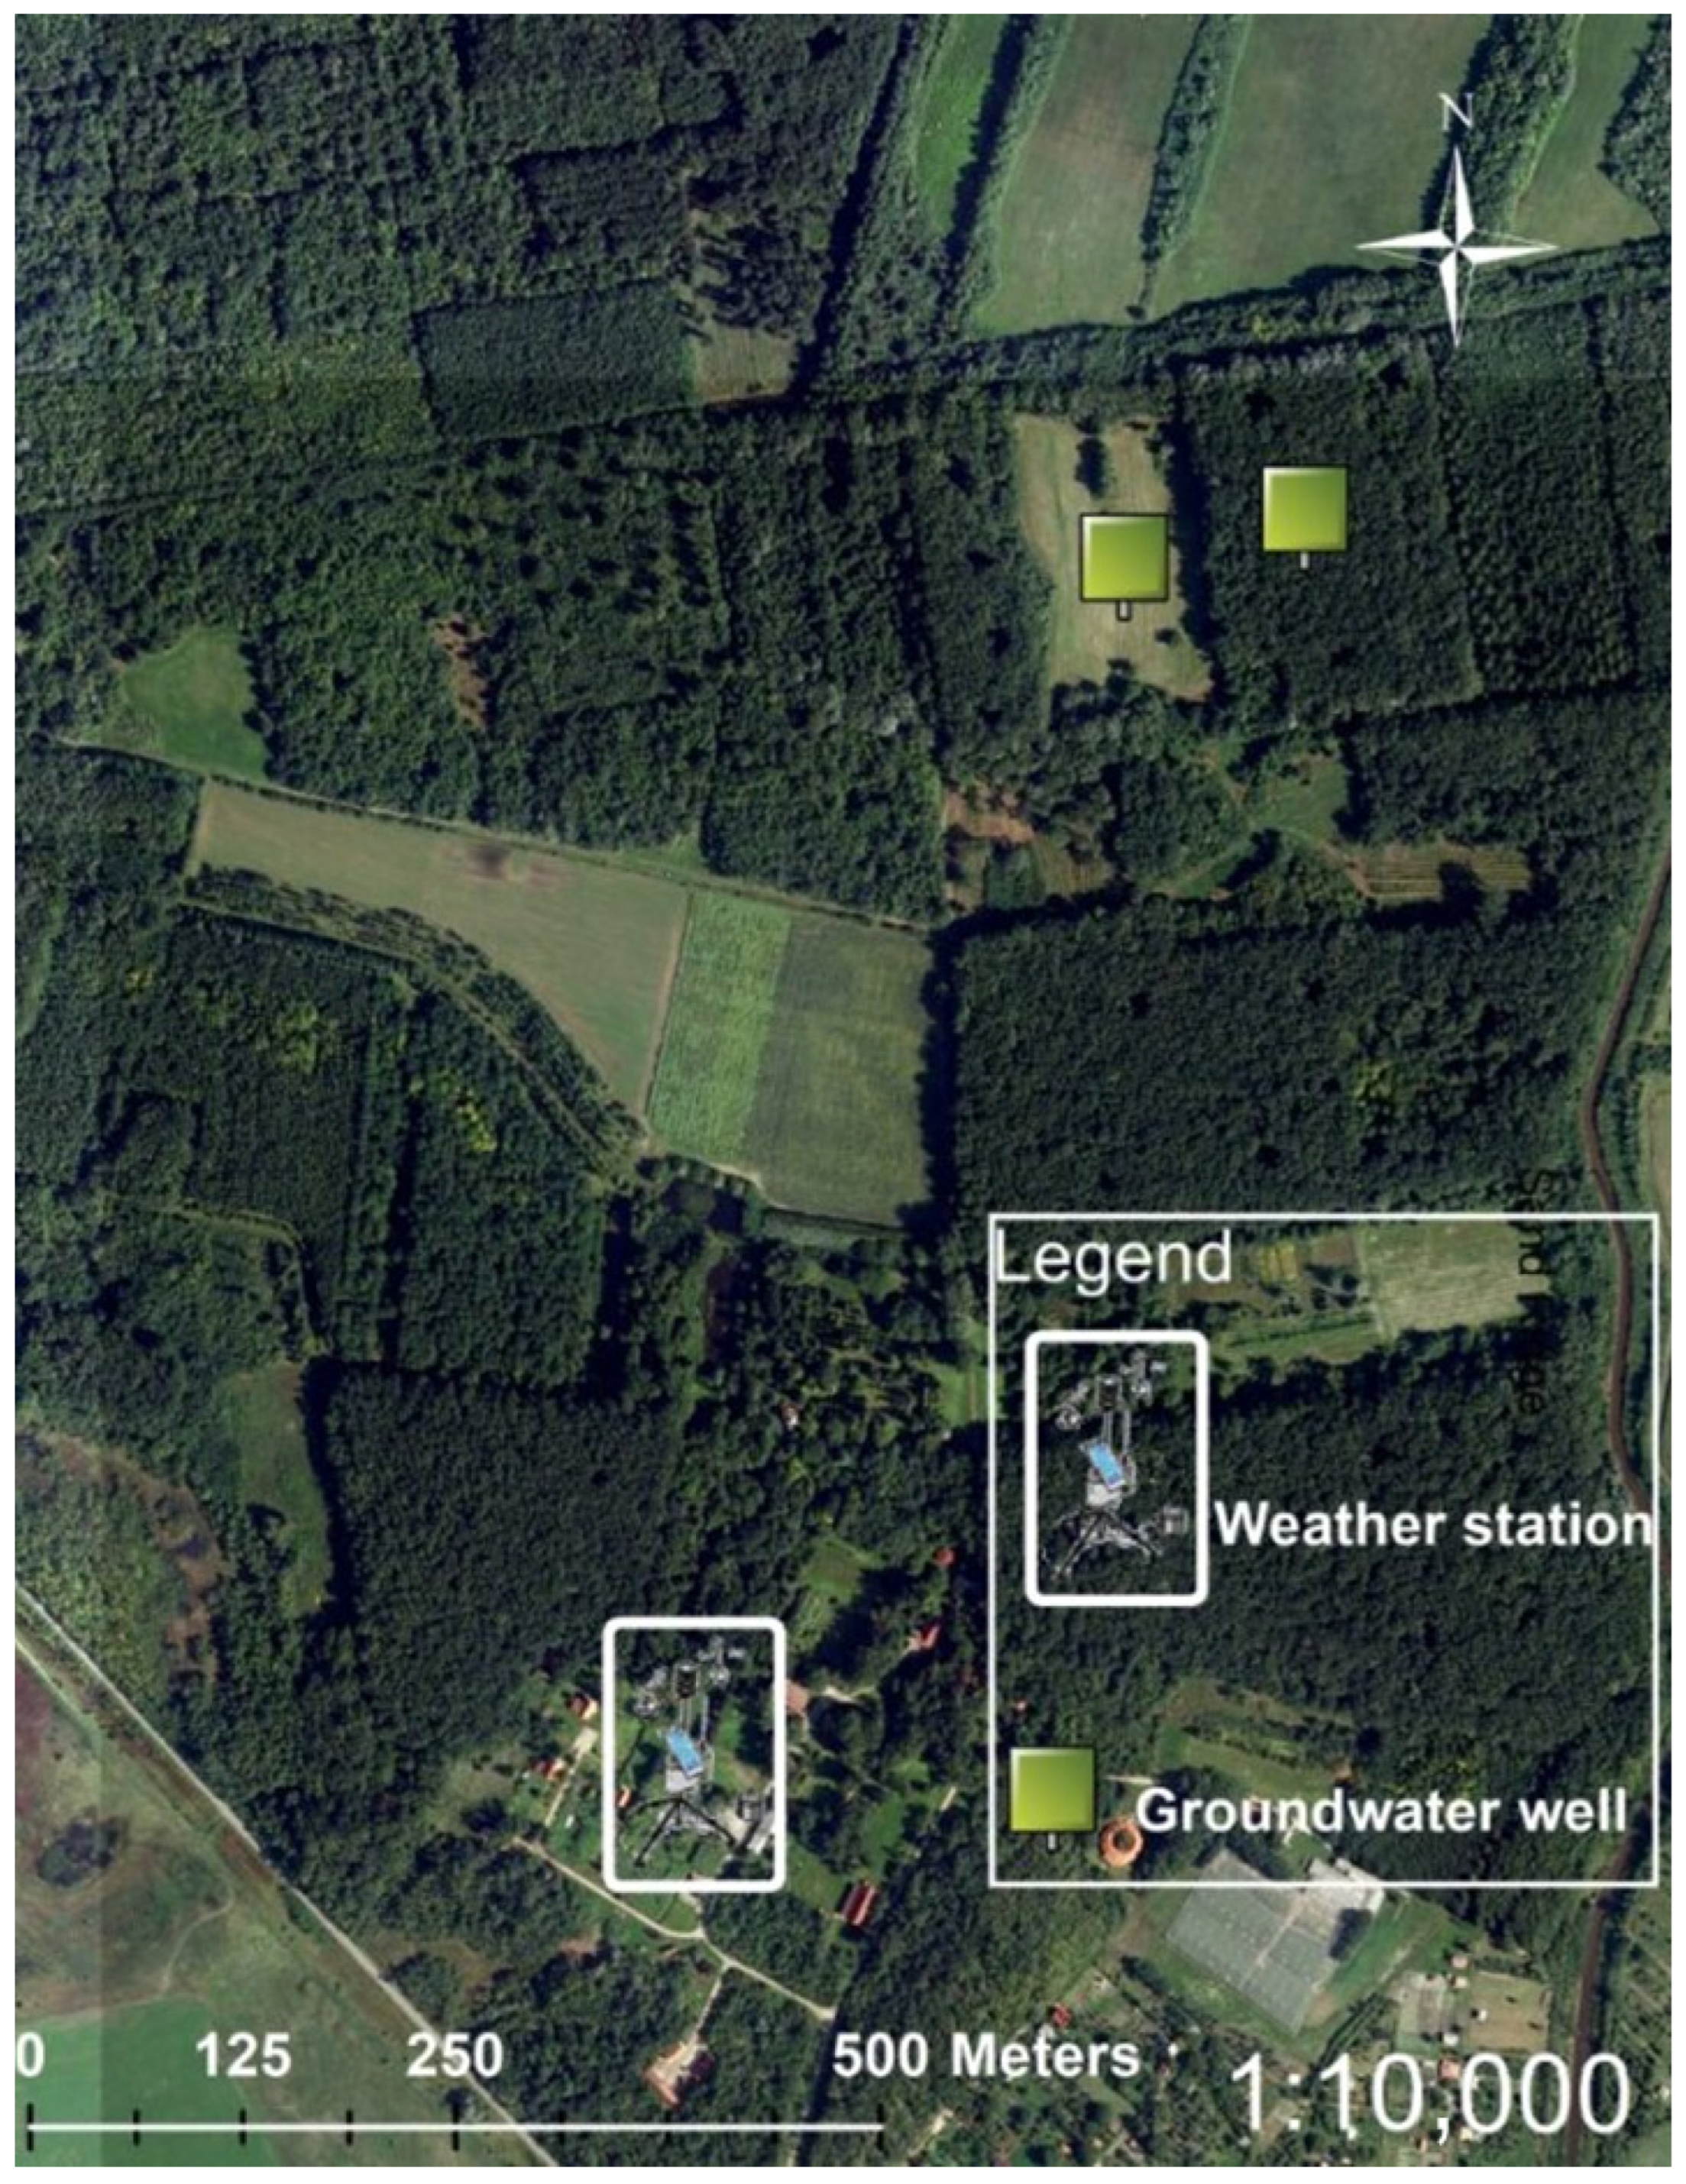
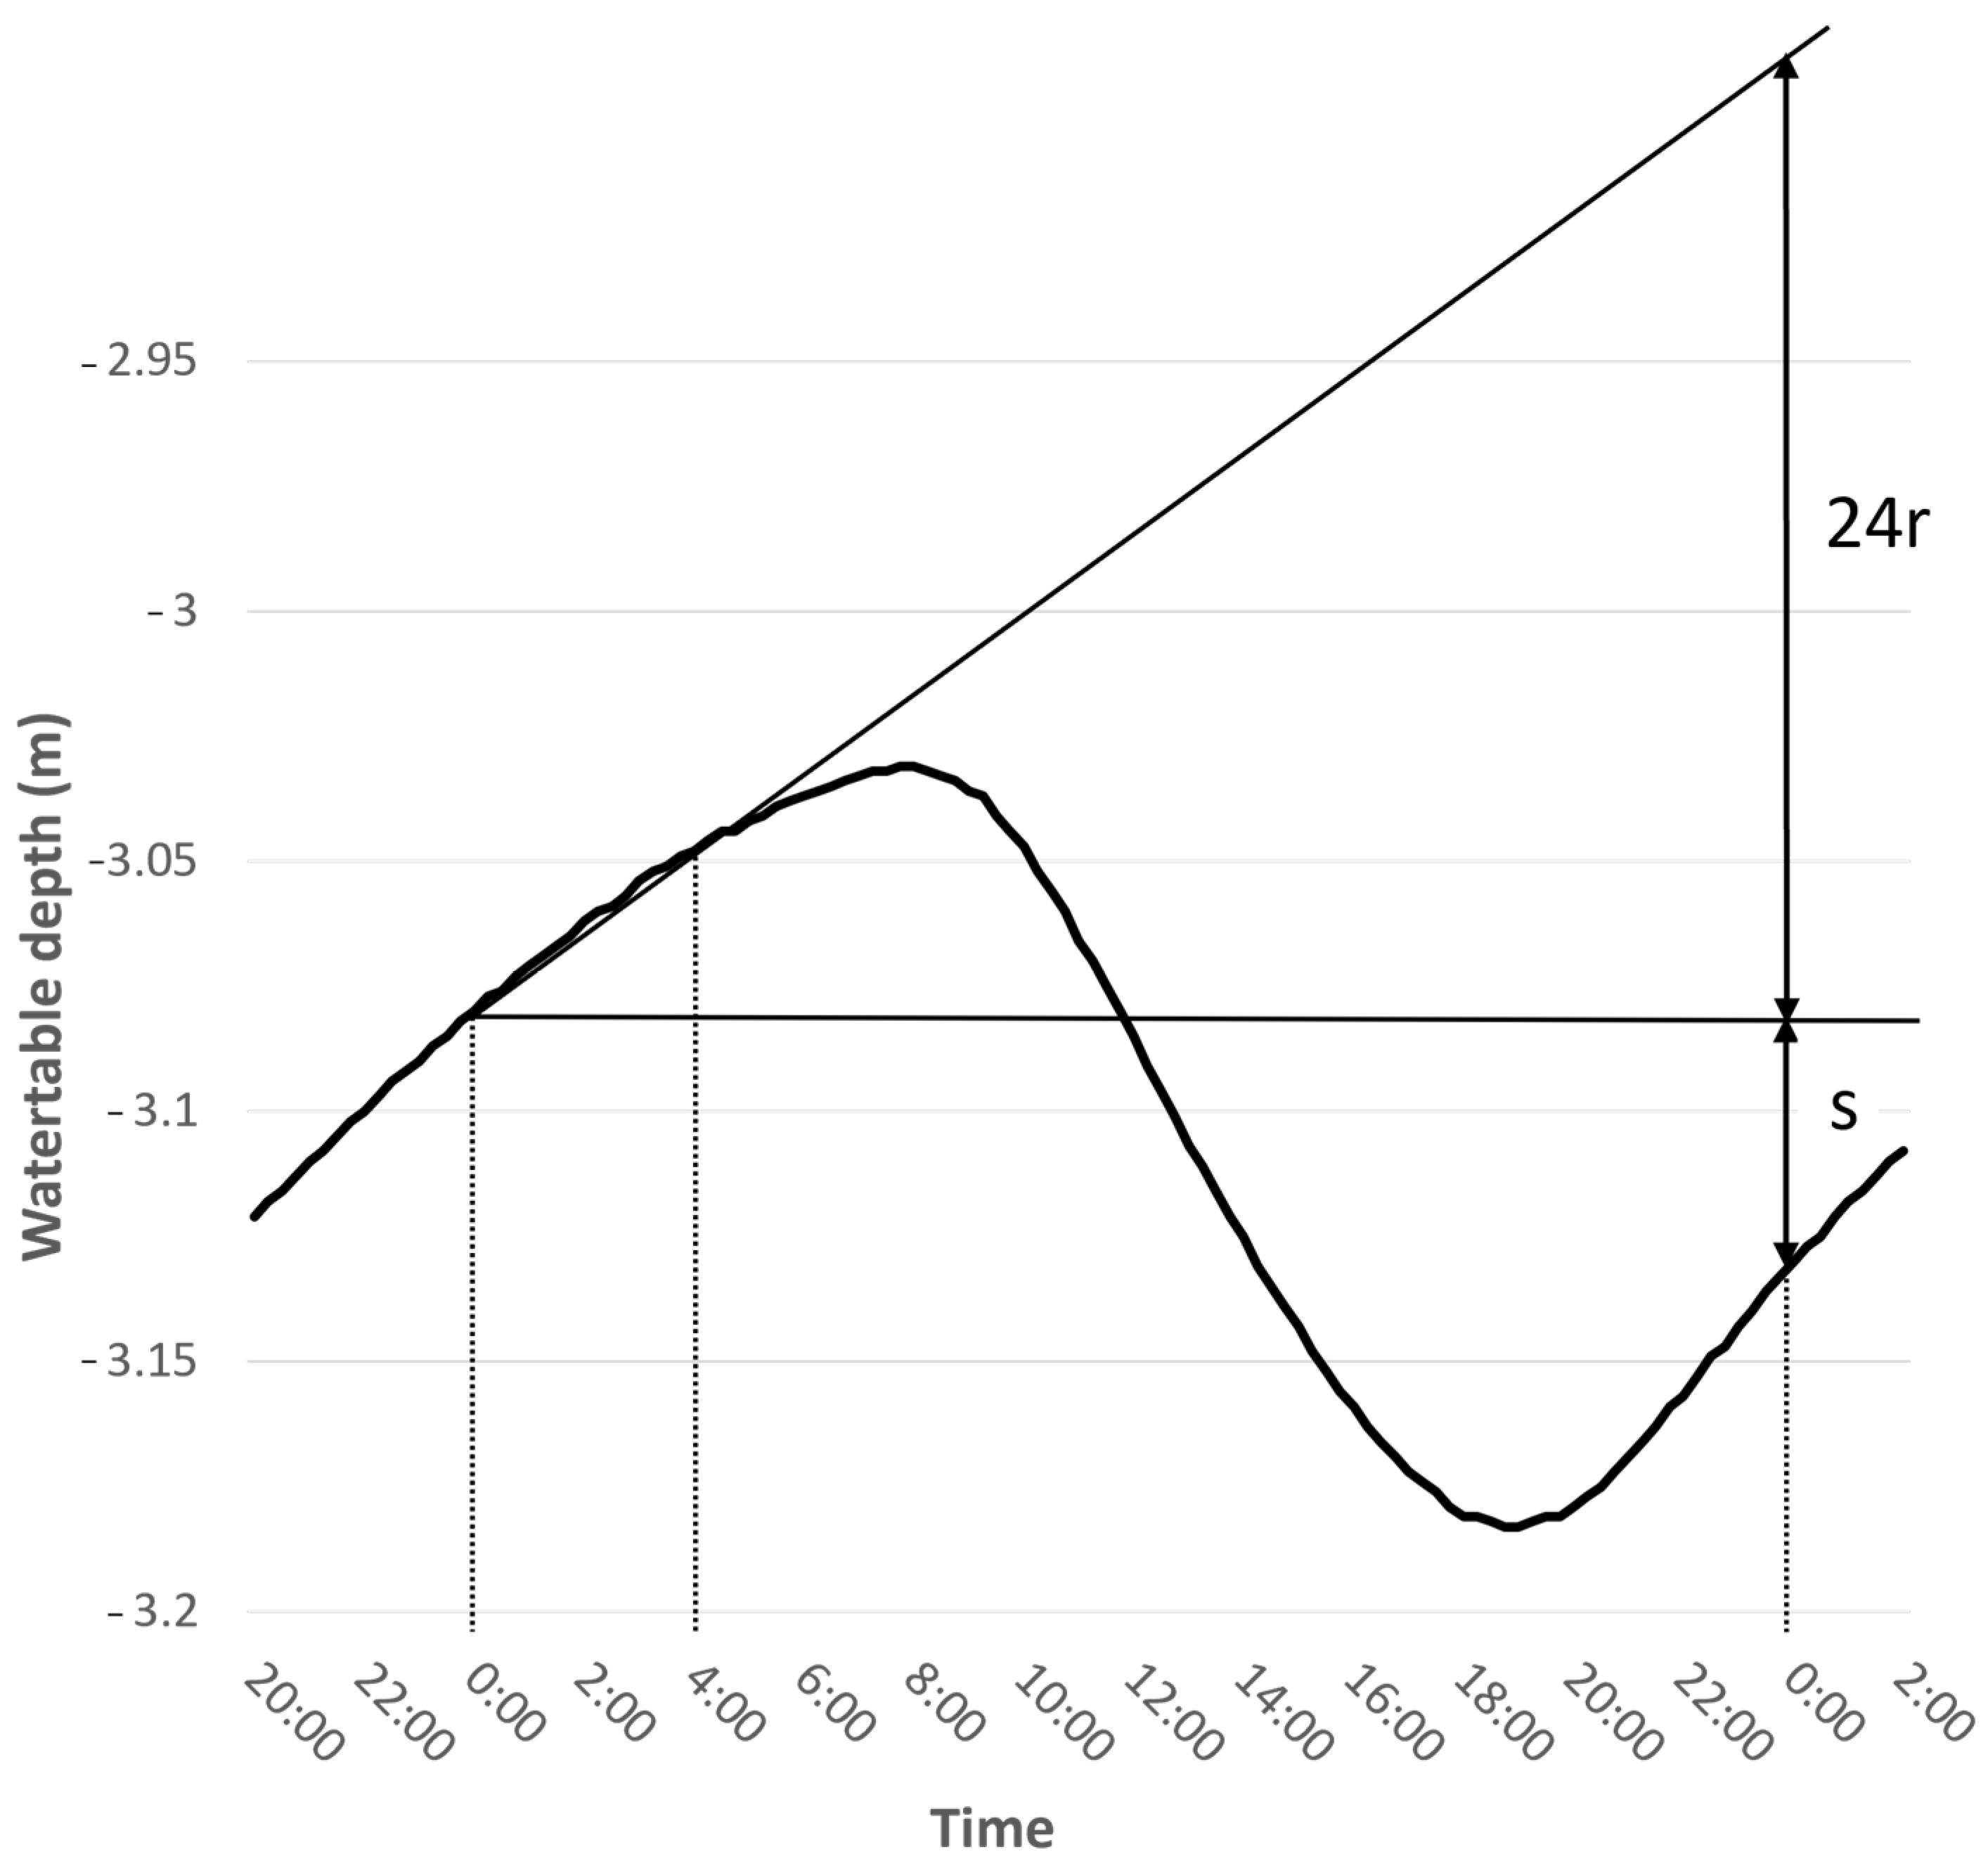
2. Materials and Methods

The geographical location of Püspökladány–Farkassziget research area is situated in the eastern region of the Great Hungarian Plain (Figure 2). The region has a continental climate, characterised by annual precipitation levels ranging from 340 to 913 mm, and had an average yearly air temperature fluctuating between 9.8 and 12.7 °C between 1991 and 2020. Regarding the topography, the area is a lowland covered with loess and alluvial deposits. Historically, this lowland comprised of marshes, swamps, and riparian woods. Throughout history, the implementation of drainage systems has yielded vast expanses of pastures and cultivable lands, hence contributing to the occurrence of salinisation in specific regions. During the 1920s, Hungary initiated afforestation initiatives with the aim of addressing the nation’s depleted wood supply, which had become a pressing concern following the conclusion of the First World War. The forest stand in the study area was established during research efforts to investigate the afforestation and tree planting in areas with unfavourable ecological conditions, including saline regions. The Farkassziget forest has expanded to encompass an area of 4.1 km2 as a consequence of the project’s initiation in 1924 and the continuous afforestation efforts. The habitat has a rich diversity, characterised by the presence of multi-layered stands comprising closed oak woods, as well as other tree species and grasslands that are fragmented into distinct patches.
The analysis focused on groundwater level data that were gathered from two distinct sampling places, as seen in Figure 2. One of the sampling points was located within an oak (Quercus robur) stand planted in 1929 with a wood volume of 777 m3/ha (estimated in 2015). The other point served as a control and was covered by herbaceous vegetation and functioned as a meadow.
In August 2014, a groundwater monitoring well was installed at each of the sampling stations. The boreholes are equipped with polyvinyl chloride (PVC) pipes, which have a diametre of 5 cm. The groundwater levels were monitored at regular intervals of 15 min using vented pressure transducer devices of DA-LUB 222-type, which had a precision of 1 mm (Table 1). Soil samples were collected at regular intervals of 20 cm in the upper 1 m layer and subsequently at intervals of 50 cm below that layer during the drilling of the boreholes. The determination of soil texture was based on hygroscopicity (hy1) values.
About 280 m east of the study area is the Makkodi main drainage channel, which ends in a nearby (6.5 km) pumping station east of the pilot region. The lowest point of the channel bed in the study area is 83.2 m above sea level. According to the data obtained from monitoring activities (Table 1), it can be observed that the bottom of the channel is situated at an elevation several metres higher than the average groundwater level within the surrounding region. It was concluded that it does not have a drainage effect on the groundwater in its surroundings under average groundwater conditions and could serve as one recharge source for groundwater resources in the immediate surroundings of the canal. The magnitude of the recharge depends on the current state of the channel–groundwater interaction, which was not observed during the course of this investigation.
Detailed primary meteorological data, including the air temperature, humidity, precipitation, wind speed and direction, and global radiation, were recorded at regular 10 min intervals at the meteorological station (ECO logger 2, Boreas Ltd., Érd, Hungary) (Figure 2, Table 1). The meteorological data used in this study are from the Püspökladány meteorological station, which is part of the hydro-meteorological monitoring network managed by the Forest Research Institute at the University of Sopron, Hungary.
The measurement data from both monitoring stations have been collected since 2015; however, they remained incomplete until 2018 due to asynchronous measurement dropouts. Hence, the paper used data that were gathered during hydrological years starting with November 2018 for the purpose of analysis.
In order to mitigate the influence of precipitation on forest evapotranspiration and groundwater recharge, our analysis focused exclusively on days where the cumulative rainfall throughout the preceding 30-day period did not surpass 20 mm. The threshold was established by an examination of the impact of cumulative precipitation over varying durations of 10, 20, 30, and 40 days on the recharge estimation derived from the White technique. The groundwater levels, differences in the groundwater levels between the sampling points, amplitude, and recharge were considered. We found the weakest correlations for the 30-day precipitation below 20 mm. It was concluded that rainfall does not act as a disruptive factor in the recharge processes studied in this case.
In order to differentiate the effect of vegetation on evapotranspiration and recharge during the dormant and vegetation period, our analysis incorporated data from November to February, as well as data from May to August. The analysis did not include the transitional months between the dormant and vegetation periods.
The main meteorological characteristics for 2018–2022 are summarised in Table 2. The analysis was based on hydrological years. The average annual precipitation for 2018–2022 is 432 mm. The driest year was 2022, and the wettest was 2020. The highest potential evaporation also occurred in 2022. The average annual potential evaporation was 943 mm. The annual potential evapotranspiration (PET) was calculated using the Duna–Posza–Varga–Haszonits method [55,56], which calculates PET based on temperature and humidity data.
Based on the Budyko climate classification [57], utilising aridity indexes, the years 2018, 2019, and 2020 can be categorised as steppe climate, but the years 2021 and 2022 can be classified as desert climate. During the study period, the ratio between potential evaporation and annual precipitation consistently exceeded 1, which is not typical of a forest vegetation zone. The presented data suggests the presence of an extended period of drought and the potential for the region to transition into a state of semi-aridity. Nevertheless, it is imperative to acknowledge that utilising a climate classification solely reliant on data from specific years is inadequate for formulating long-term judgements.
Table 3 displays the soil texture classifications derived from the hy1 values.
Concerning the estimated recharge, it is notable that the soil texture in the observed fluctuation zone of the groundwater levels could be considered homogeneous in both wells. It is noteworthy to add that roots were discovered inside the soil samples located beneath the clay layer at 5.5–6.0 m under the forest. This exceeds the data mentioned in the available literature, which indicates that the primary root mass of an oak tree typically falls between the range of 40 and 100 cm [58], whereas the maximum depth of its roots is generally seen to be between 1 and 2 m [59,60,61]. However, it should be noted that the quantitative measured data regarding the region’s maximum root zone depth is missing.
The daily groundwater recharge was determined by the White method [24,62]. The method is illustrated in Figure 3. It assumes that evapotranspiration is negligible during the late night to early morning (between 0 and 4 h). Therefore, the rate of the increase in the groundwater level during this period could be attributed to the groundwater recharge.
The slope of the line drawn to the curve showing the change in the depth of the water table during this interval represents the groundwater recharge rate per time unit (e.g., 1 h). By extending this rate for 24 h, we can obtain the daily recharge rate (24(r)).
Based on the above, the groundwater recharge can be calculated in millimetres using the following formula:
Qnet = Sy(24r),
where Qnet—daily groundwater recharge [LT-1]. Sy—specific yield (depends on soil texture, dimensionless). r—theoretical increase in groundwater level per hour due to recharge [LT-1].
In a recent study conducted by Wang et al. [28], it is suggested that instead of the initial fixed period of 0-4 a.m. proposed by White, a dynamically variable period based on the timing of sunrise and sunset should be employed for nighttime recharge. The inclusion of a dynamically changing period resulted in enhanced accuracy of the calculation of evapotranspiration, principally through the reduction of variability in the calculated ET values. During our analysis of the data, it was observed that the daily recharge during the vegetation period often started at a later time (sometimes significantly delayed) than midnight. Consequently, we made adjustments to the White method by implementing a 4 h interval, beginning at the point of maximum growth rate, as the basis for the recharge calculations.
The White method was originally devised for utilisation during the growing season; however, it can also be effectively employed during the dormant period. In this case, the trend applied to the complete dataset is also appropriate. However, the White method was employed during the period of dormancy in order to maintain consistency with the analysis carried out during the period of active growth.
During the dormant period, the raw data collected within the forest exhibited intermittent multi-day cyclical fluctuations that could not be accounted for by currently known impacting factors. Hence, in this case, the recharge value was derived by applying the aforementioned approach to a smoothed three-day dataset.

3. Results

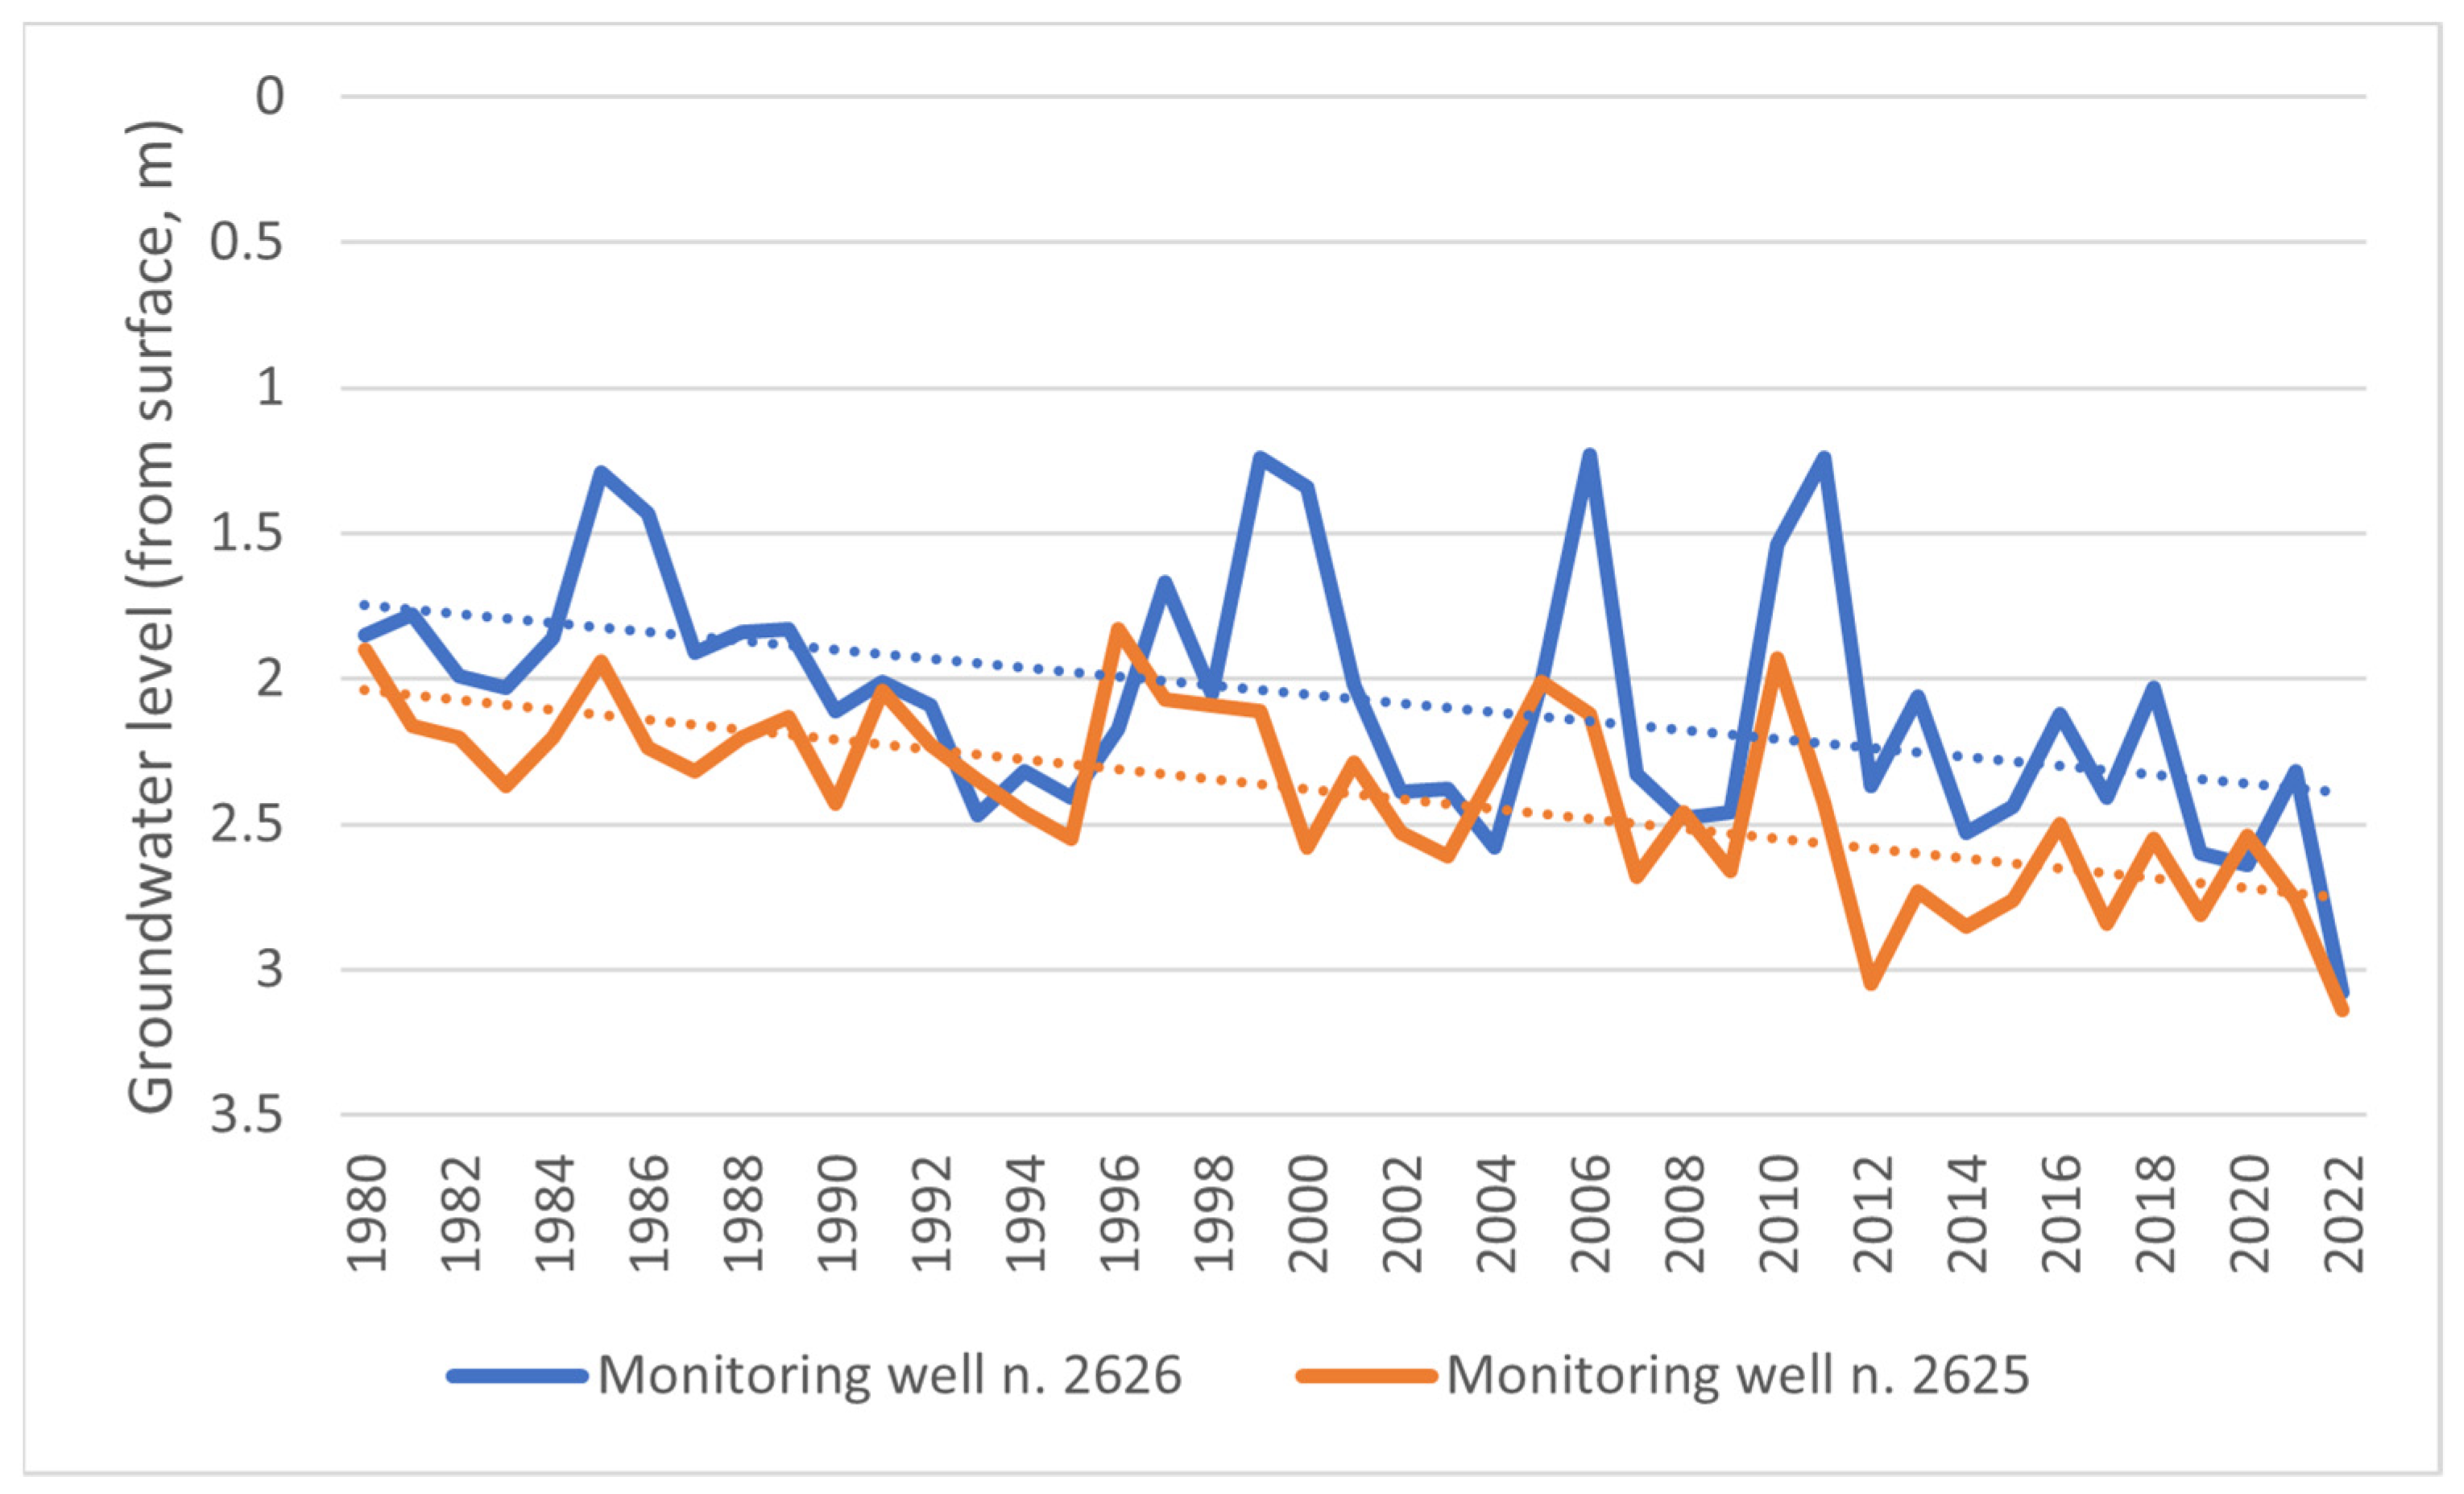
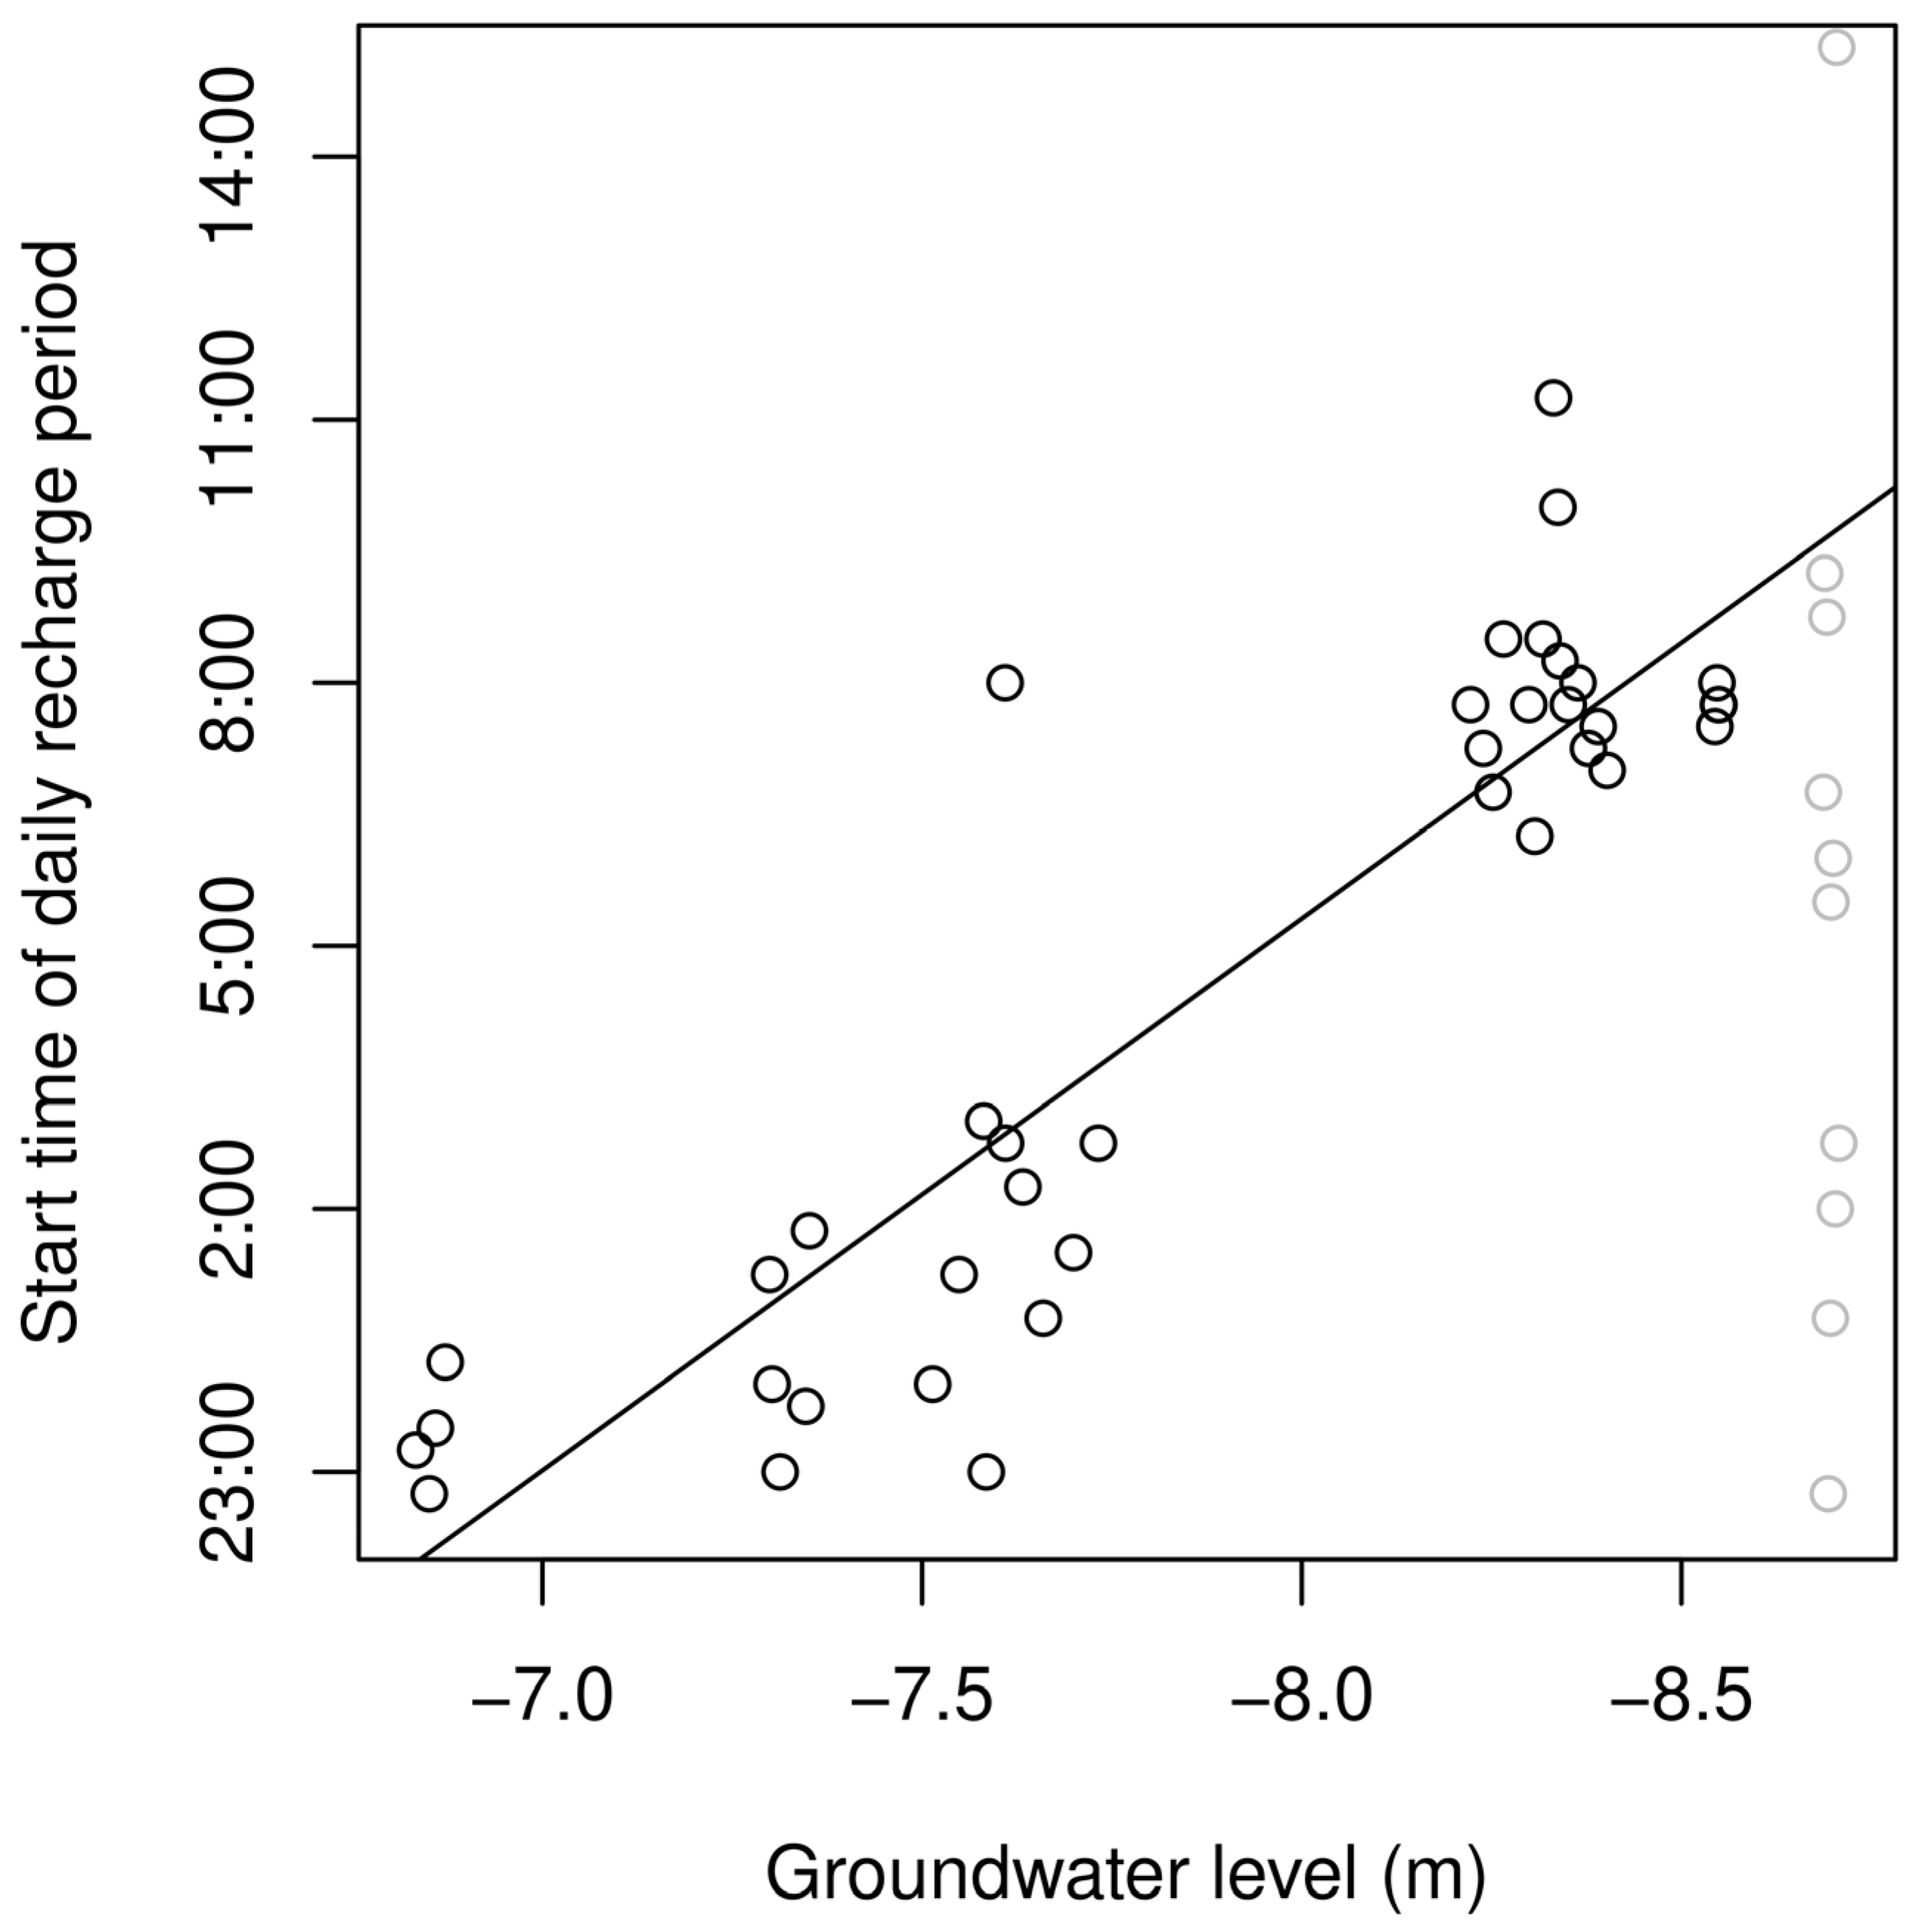
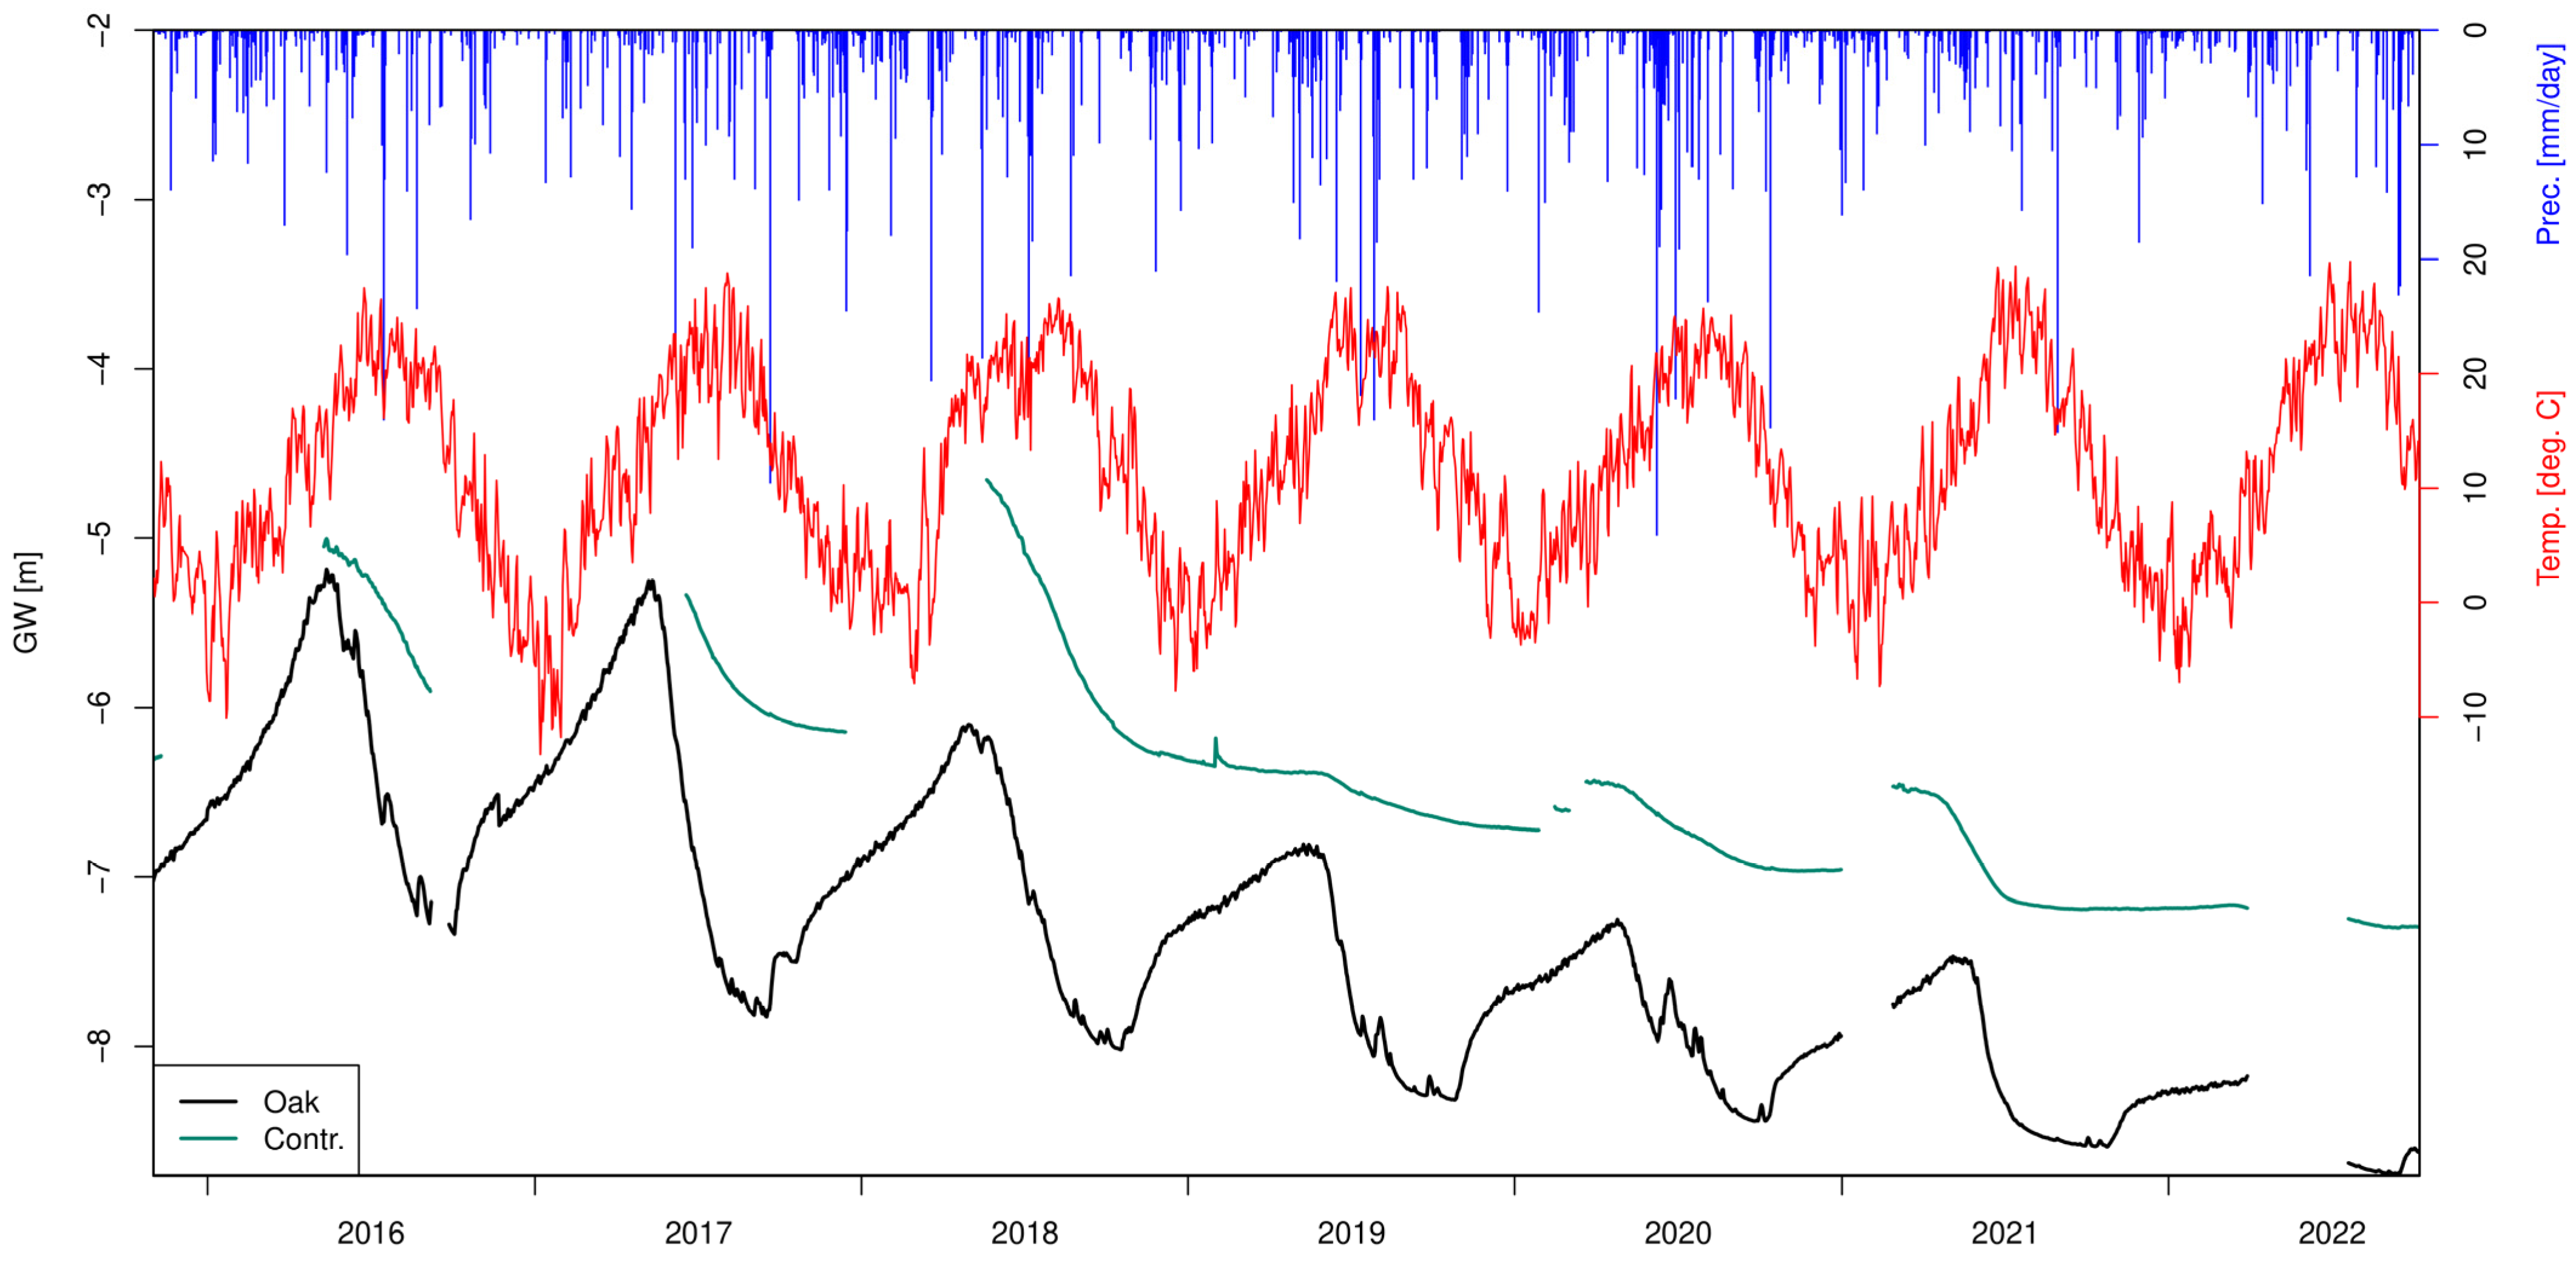
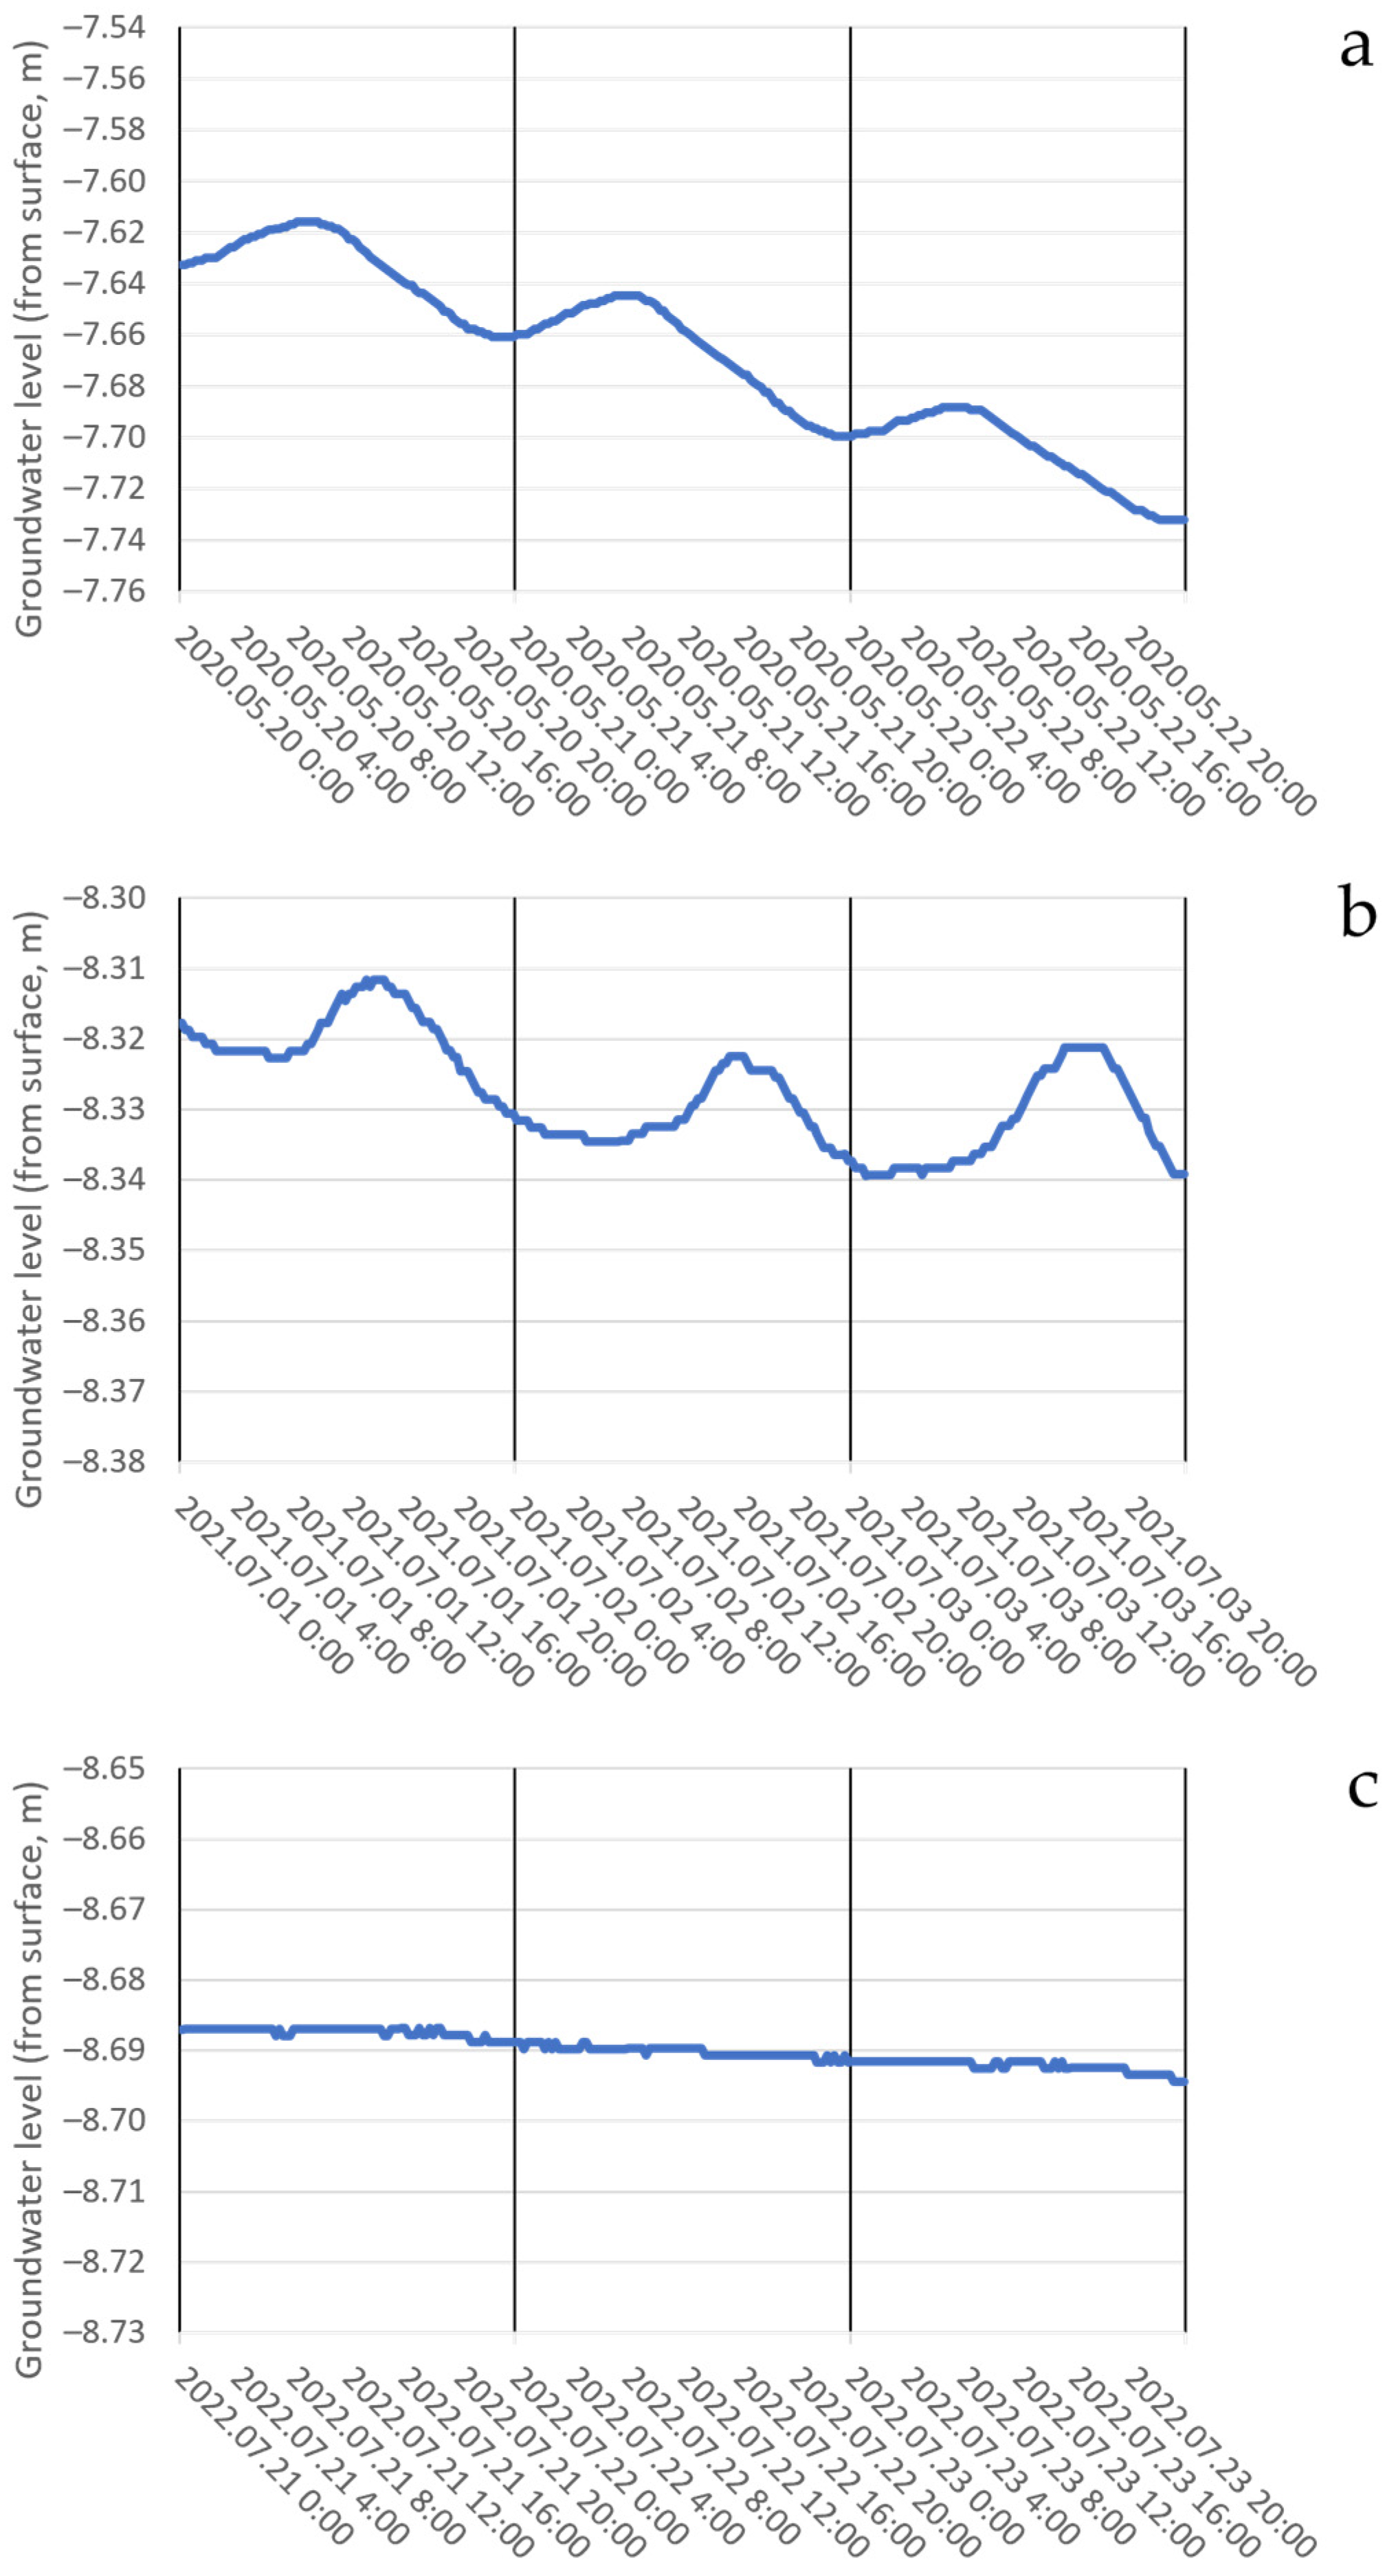
3.1. General Characterisation of the Dynamics of the Groundwater Level

In order to illustrate and understand the changes in groundwater levels at a regional scale within the wider vicinity of the study area, we used data obtained from several groundwater level monitoring network stations. Due to the similarity in results, the two nearest ones were selected to represent the ongoing processes. These are located at distances of 2.7 km and 15 km from the study site, respectively. The data collection and processing activities were carried out by the Central Tisza Valley Water Management Directorate (KÖTIVÍZIG) over the period spanning from 1980 to 2022. The groundwater monitoring well No. 2625 is located at Püspökladány (47°19′16.01″ N and 21°06′47.98″ E). Well No. 2626 is situated in the Nádudvar area (47°27′51.07″ N and 21°10′38.42″ E). The graphical representation of the data series and subsequent trend analysis demonstrated that, despite instances of groundwater level increases in years characterised by higher precipitation (specifically, 1996, 1999, 2006, 2010, 2013, and 2018), an overall downward trend in groundwater levels was observed at all monitoring stations. This trend suggests a reduction in the volume of water stored within the aquifer (see Figure 4).
The observed long-term groundwater level data from both the Oak and Control wells support the general declining trend in the regional groundwater level (Figure 5). The difference in groundwater levels between the forested and grassland areas has been supported by previous studies [37,64]. During the designated study period spanning from 1 November 2018 to 9 October 2022, it was observed that the average groundwater level beneath the forest area was 1.14 m lower in comparison to the control area, which was characterised by herbaceous vegetation.
The differences in the groundwater levels in the Oak and Control wells varied in the annual cycles. The peak values were observed throughout the late summer and early autumn periods, as the difference in water uptake between the forest and the control vegetation reached its peak near the end of the vegetative period. Following this, it can be noticed that recharge during the dormant season is significantly higher under the forest compared to the control area. As a result, the difference declined until it subsequently resumed growing due to the water uptake by the plants throughout the seasonal vegetation period. The aforementioned fluctuations described became less pronounced in the consecutive years.

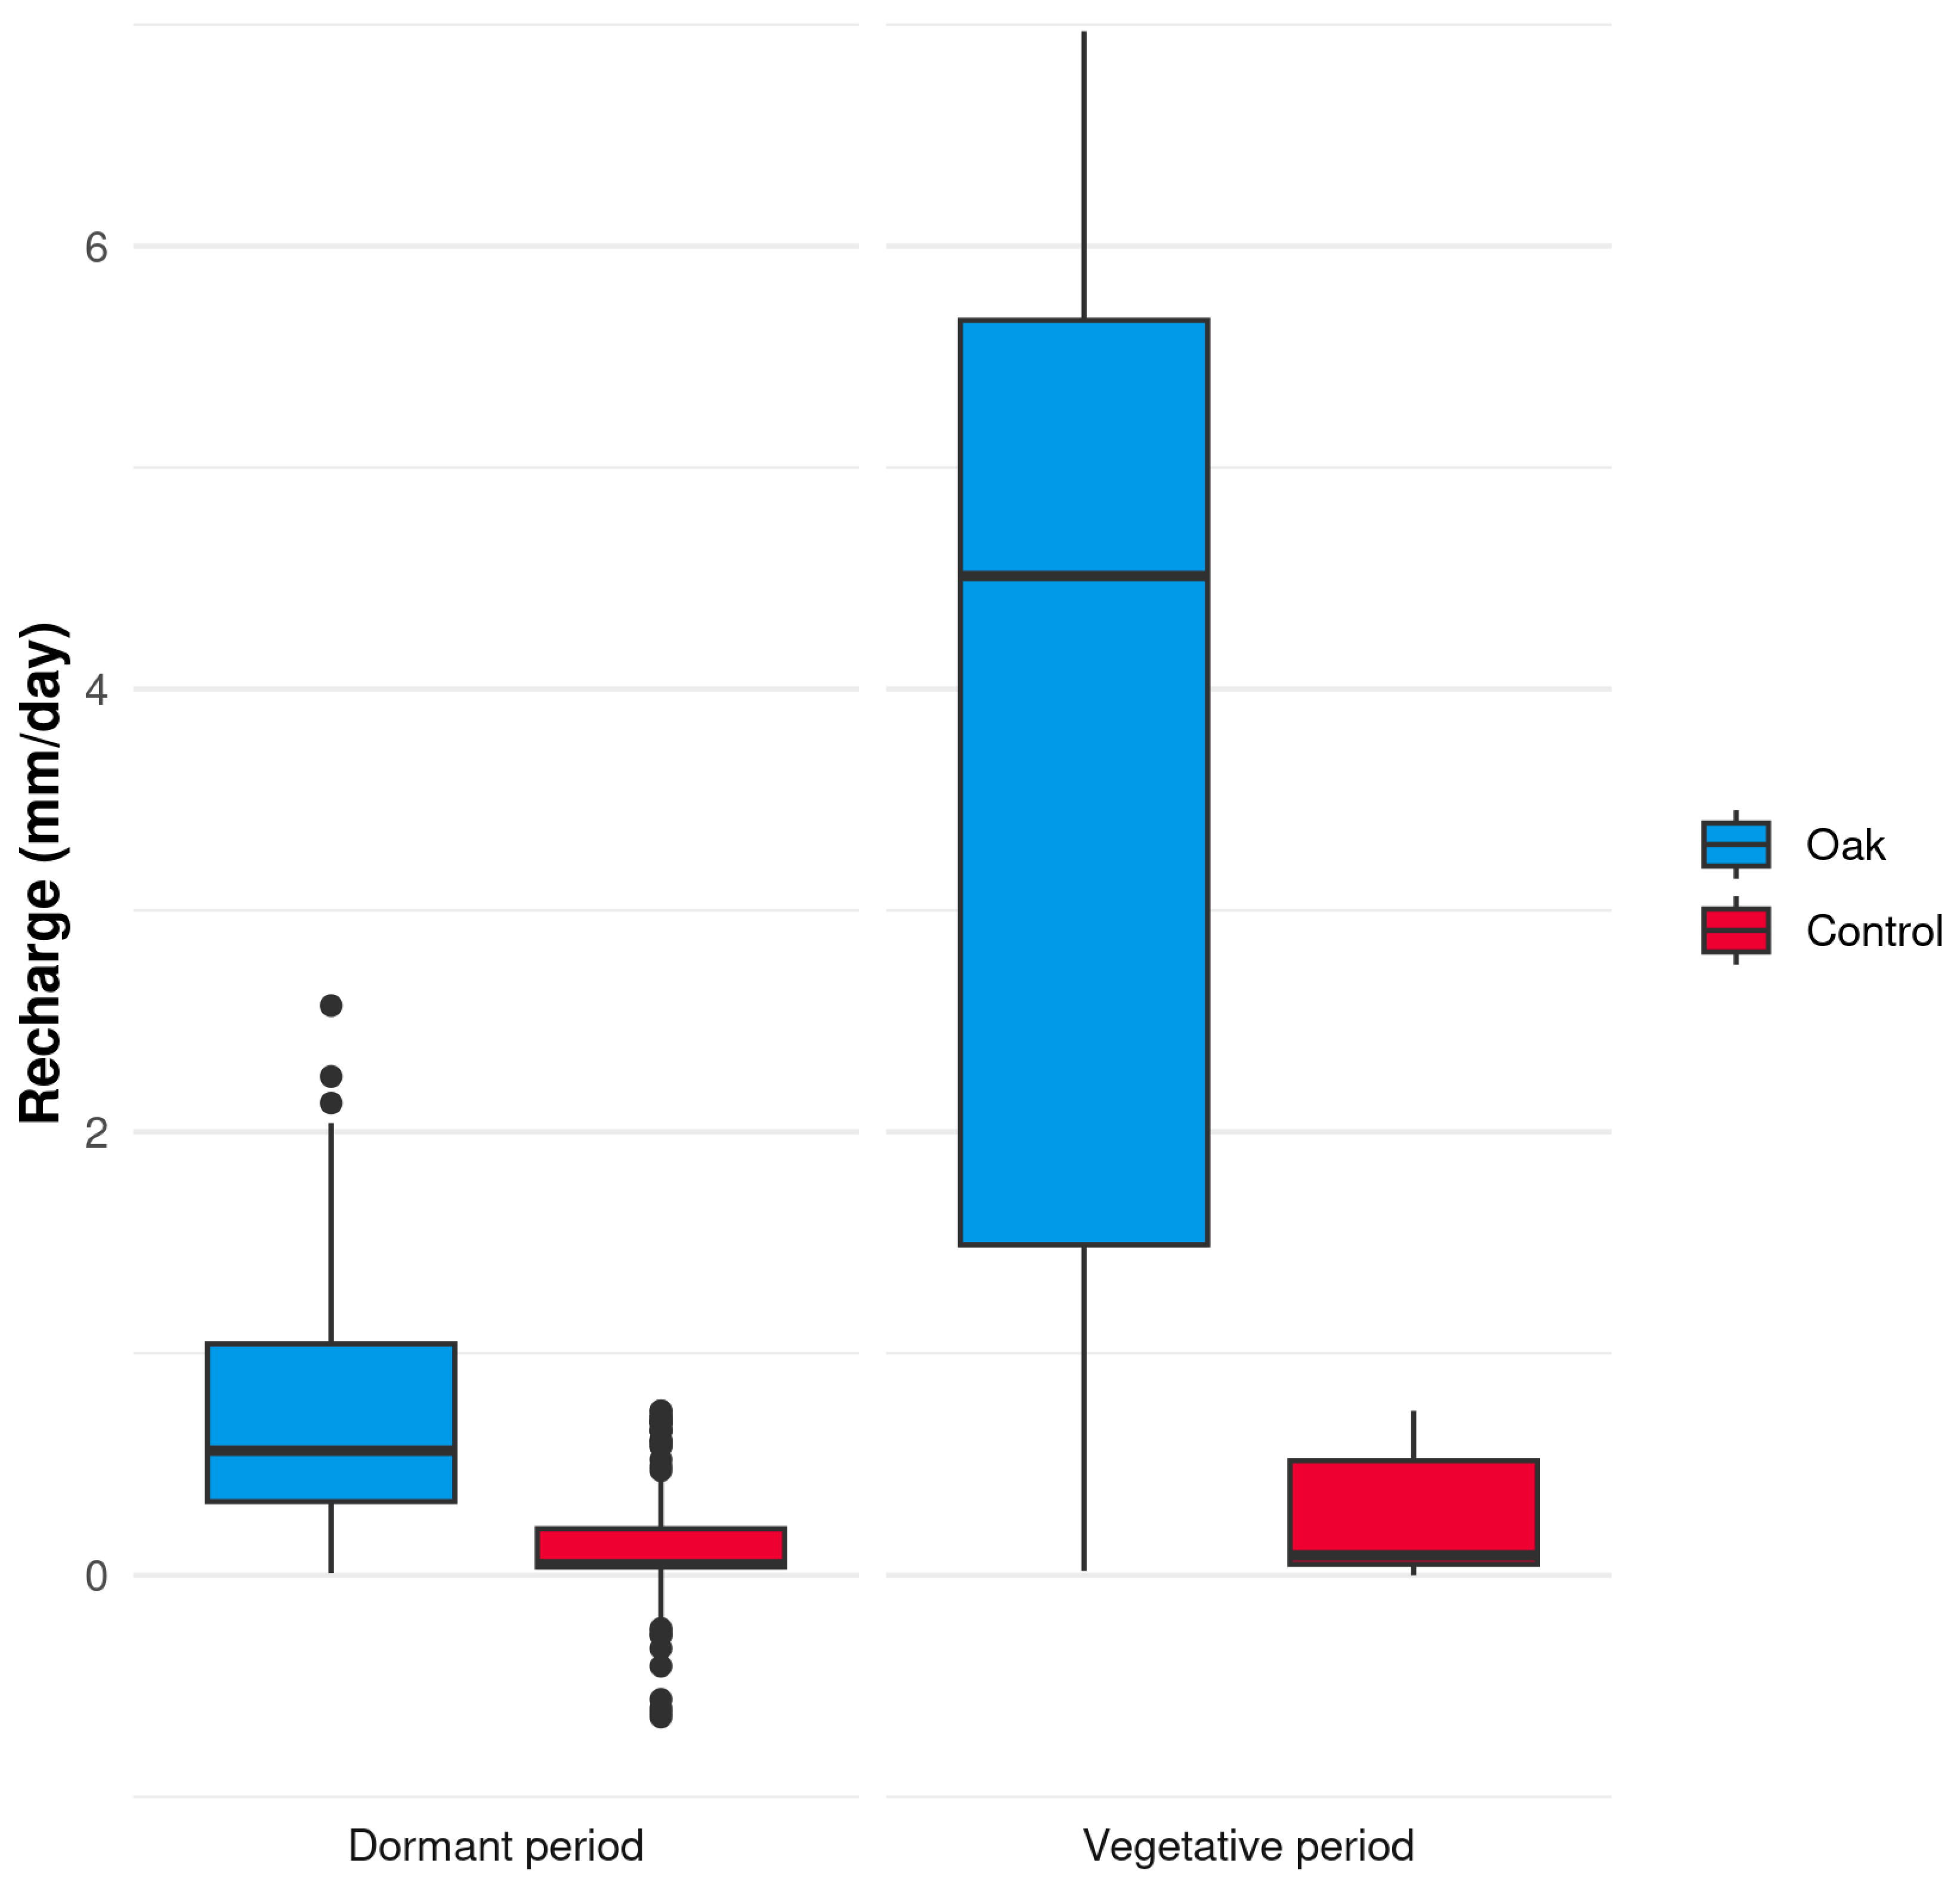
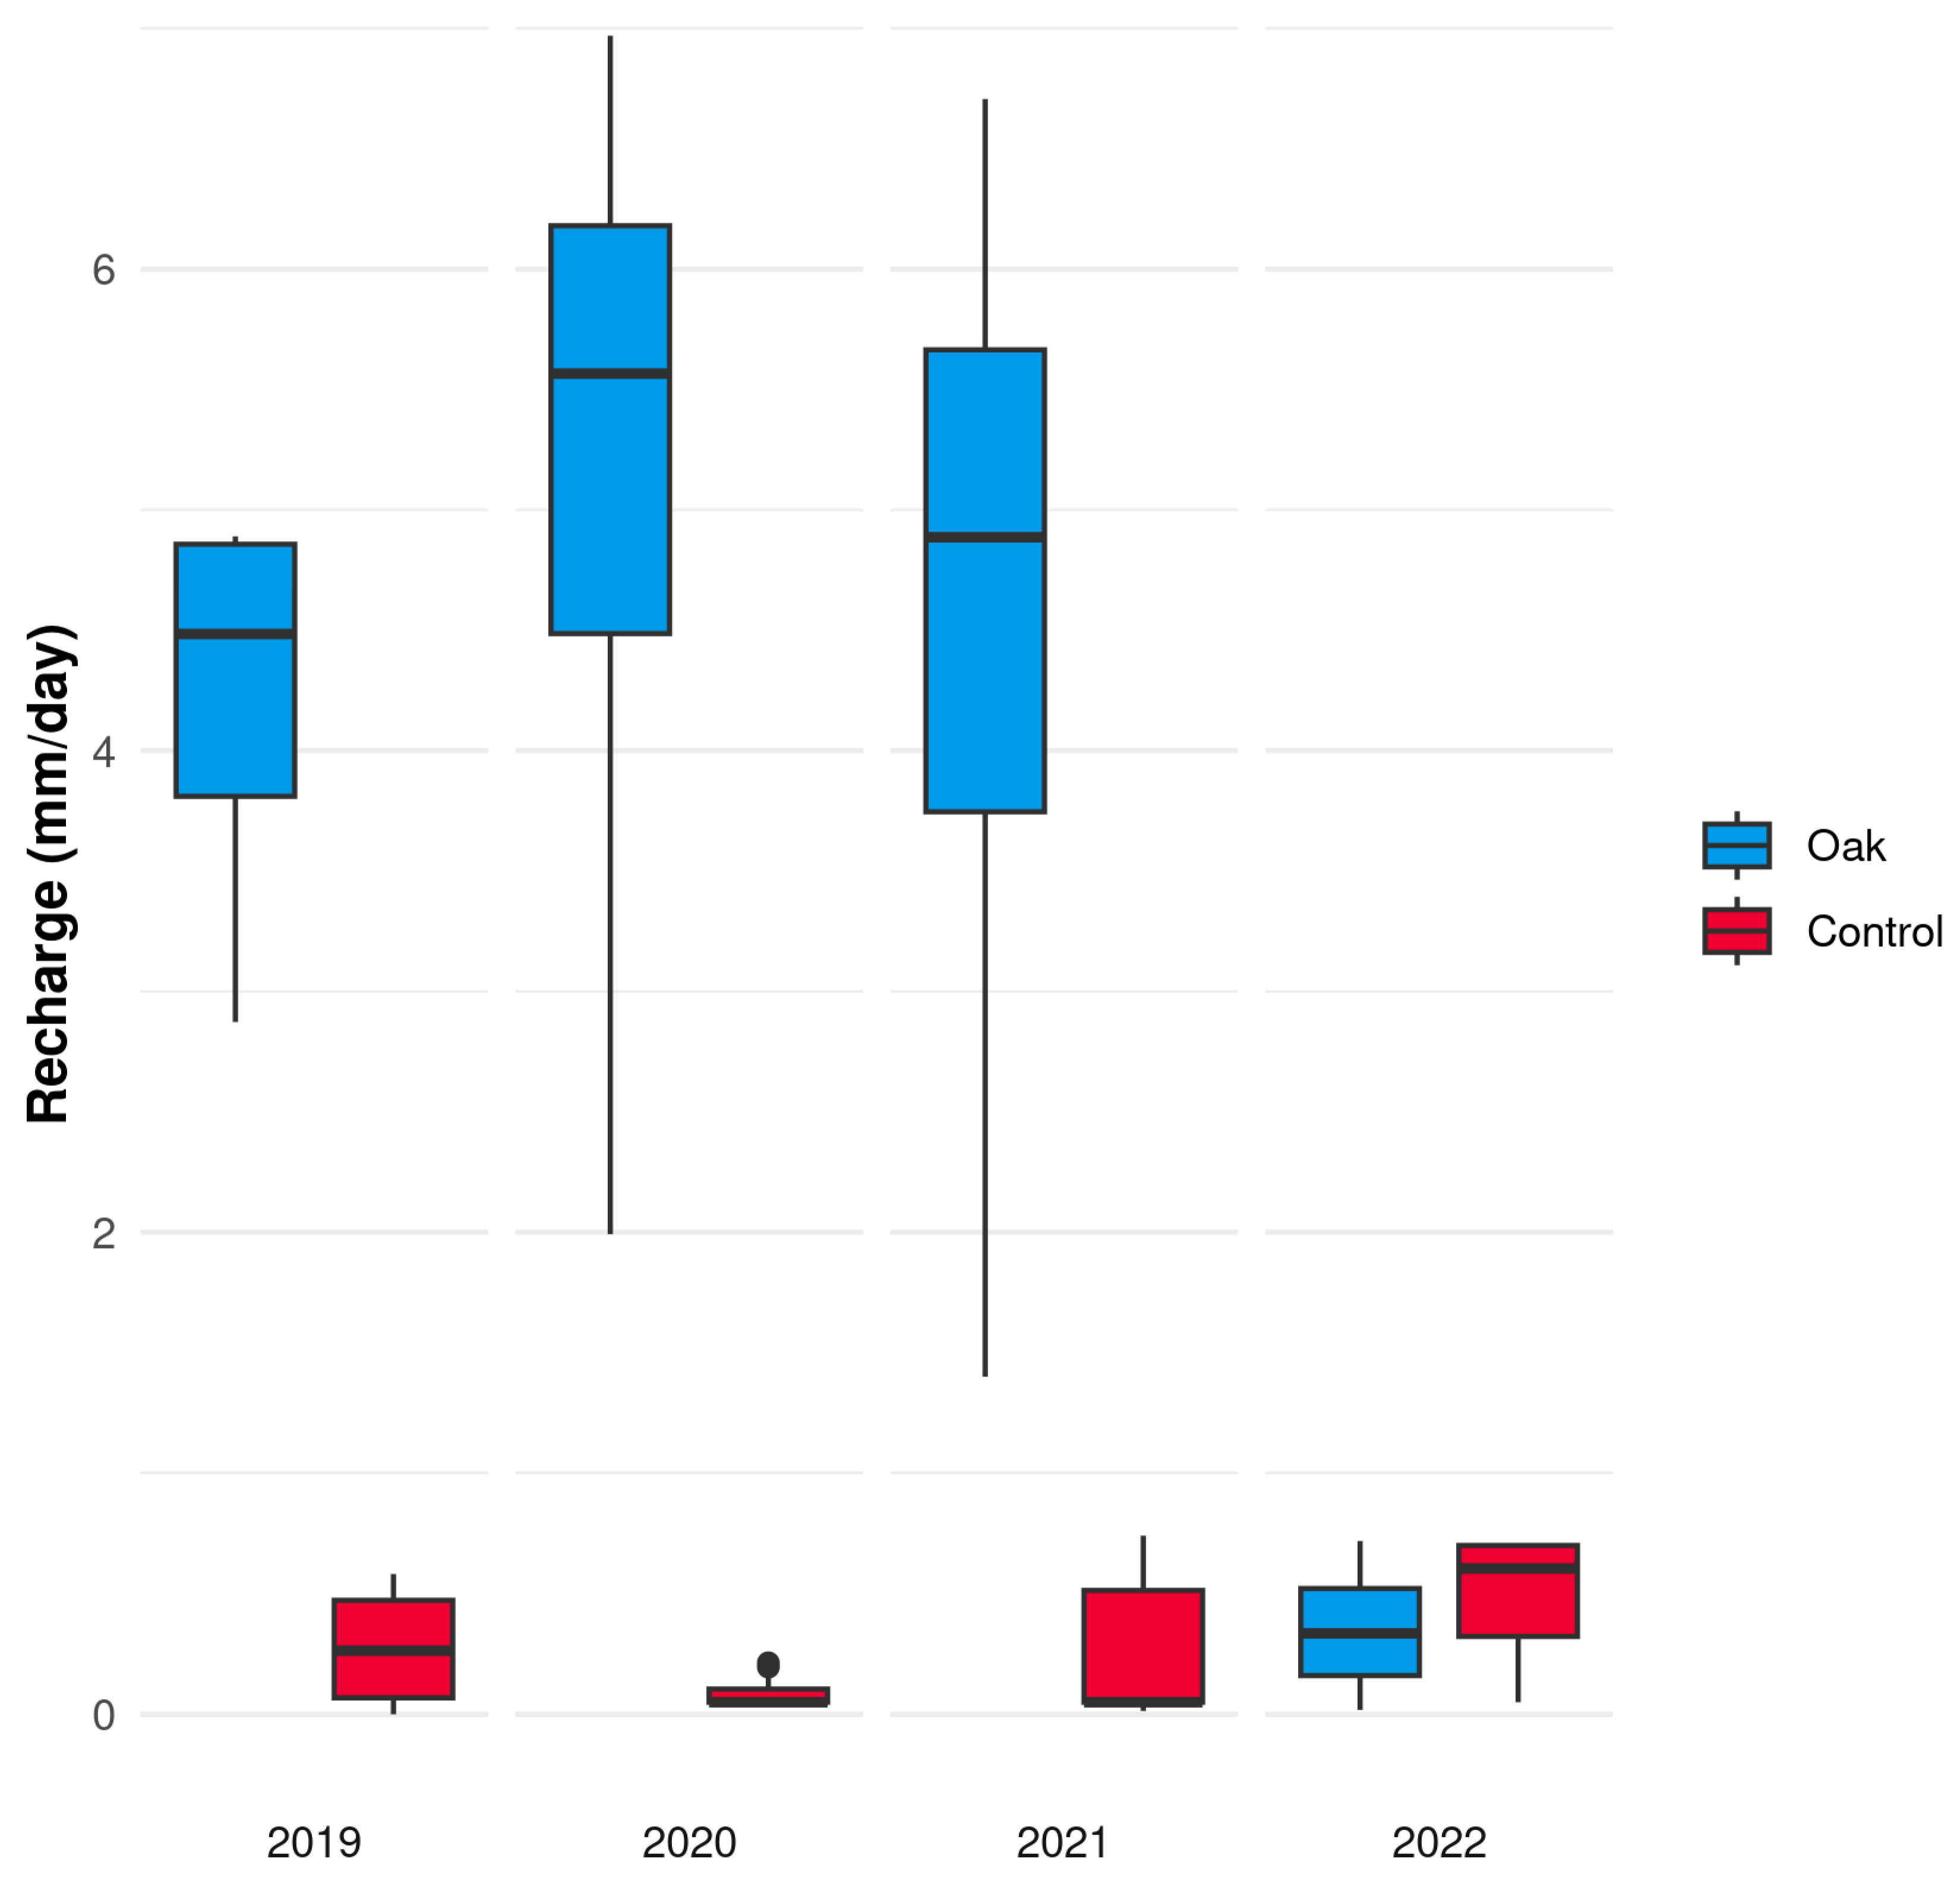
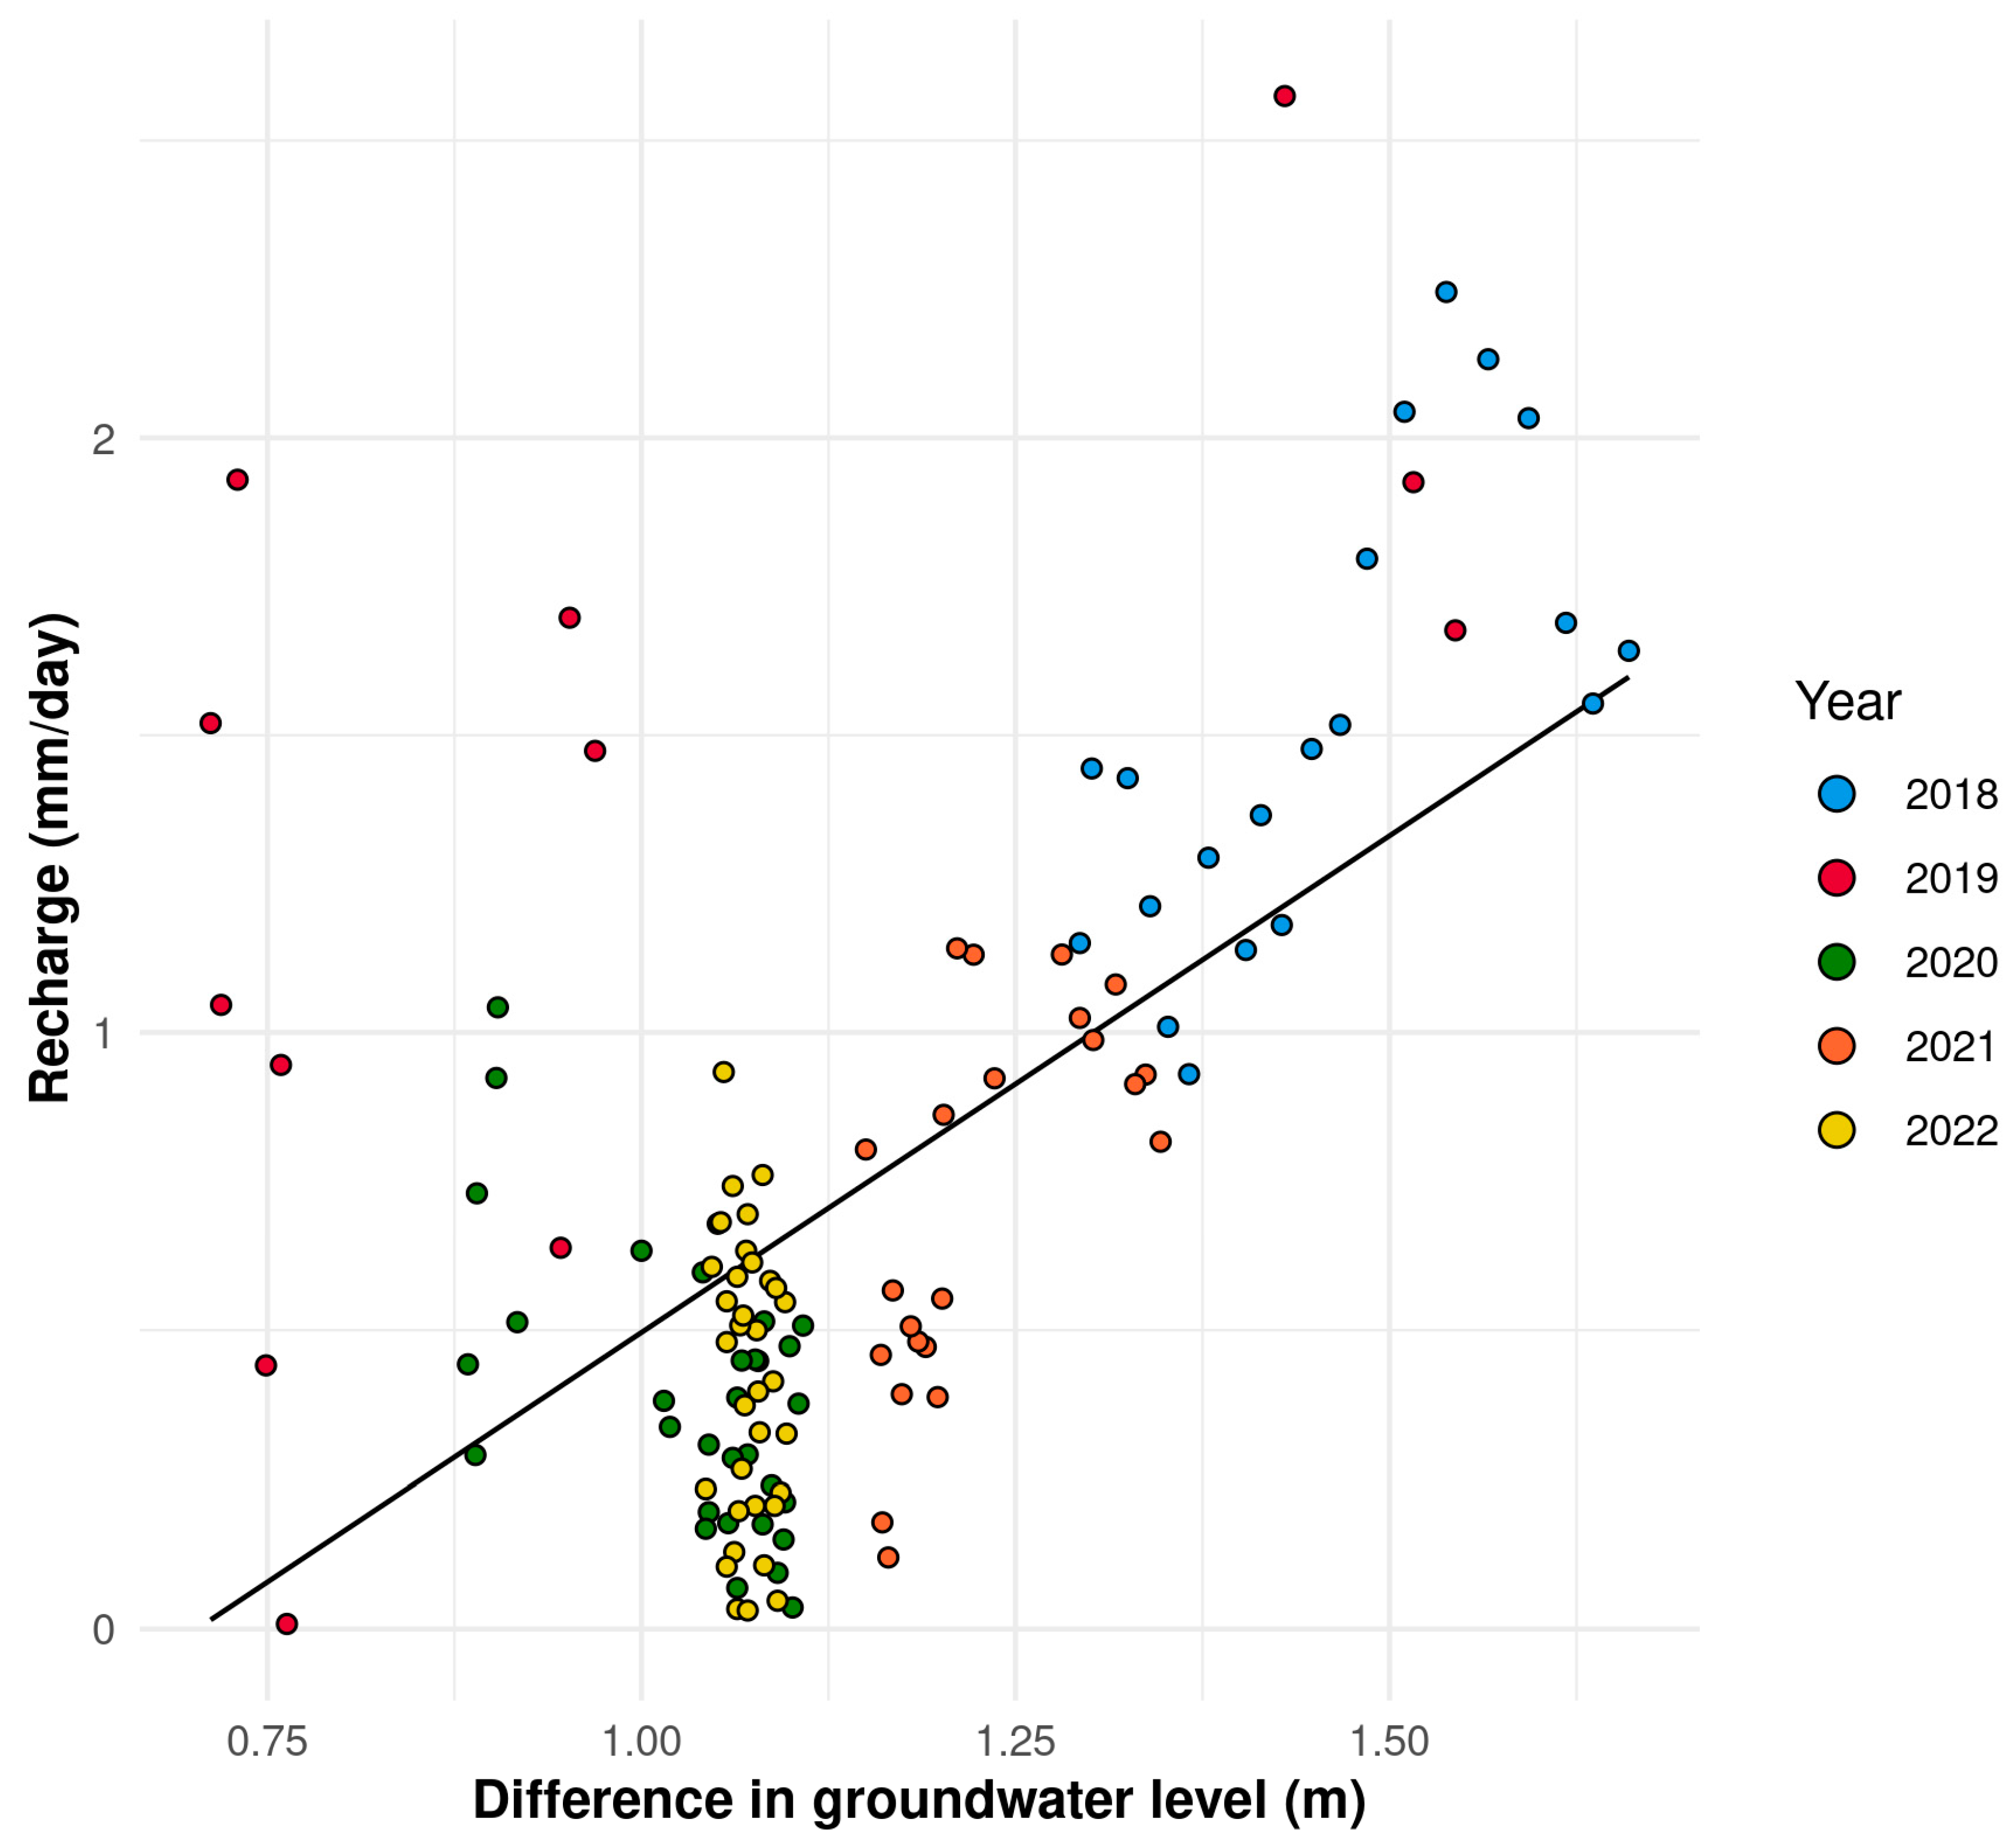
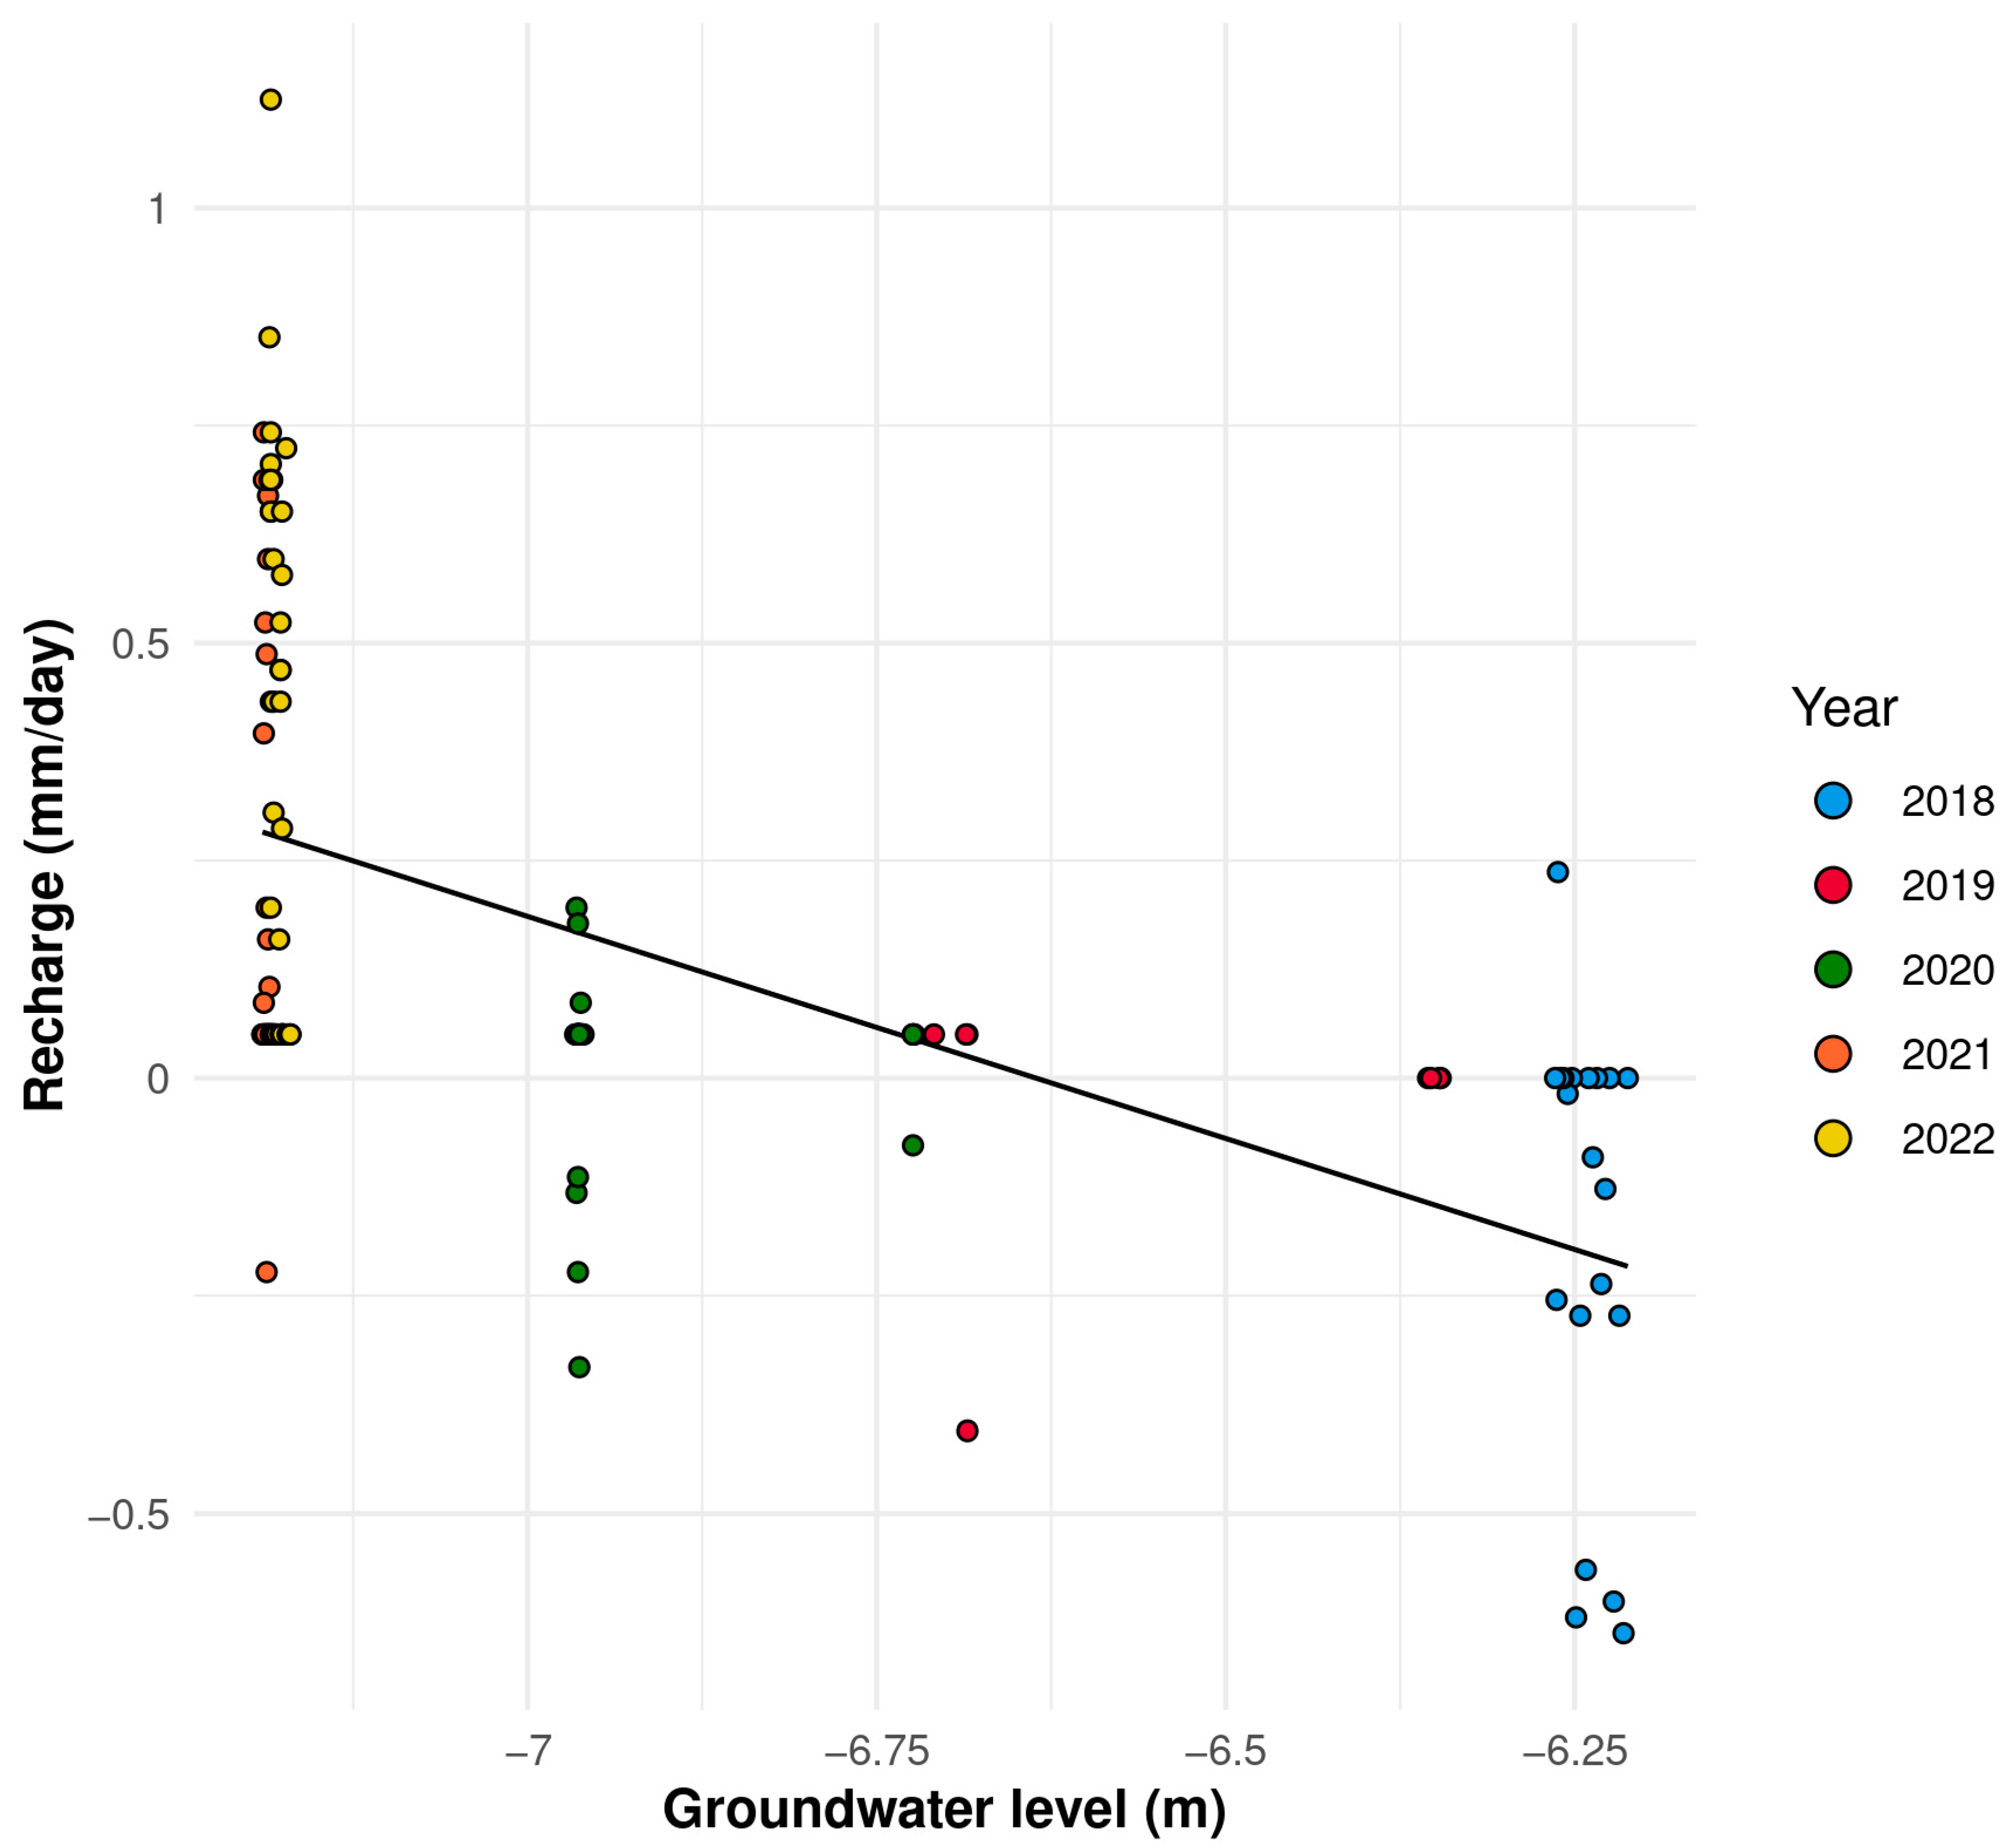
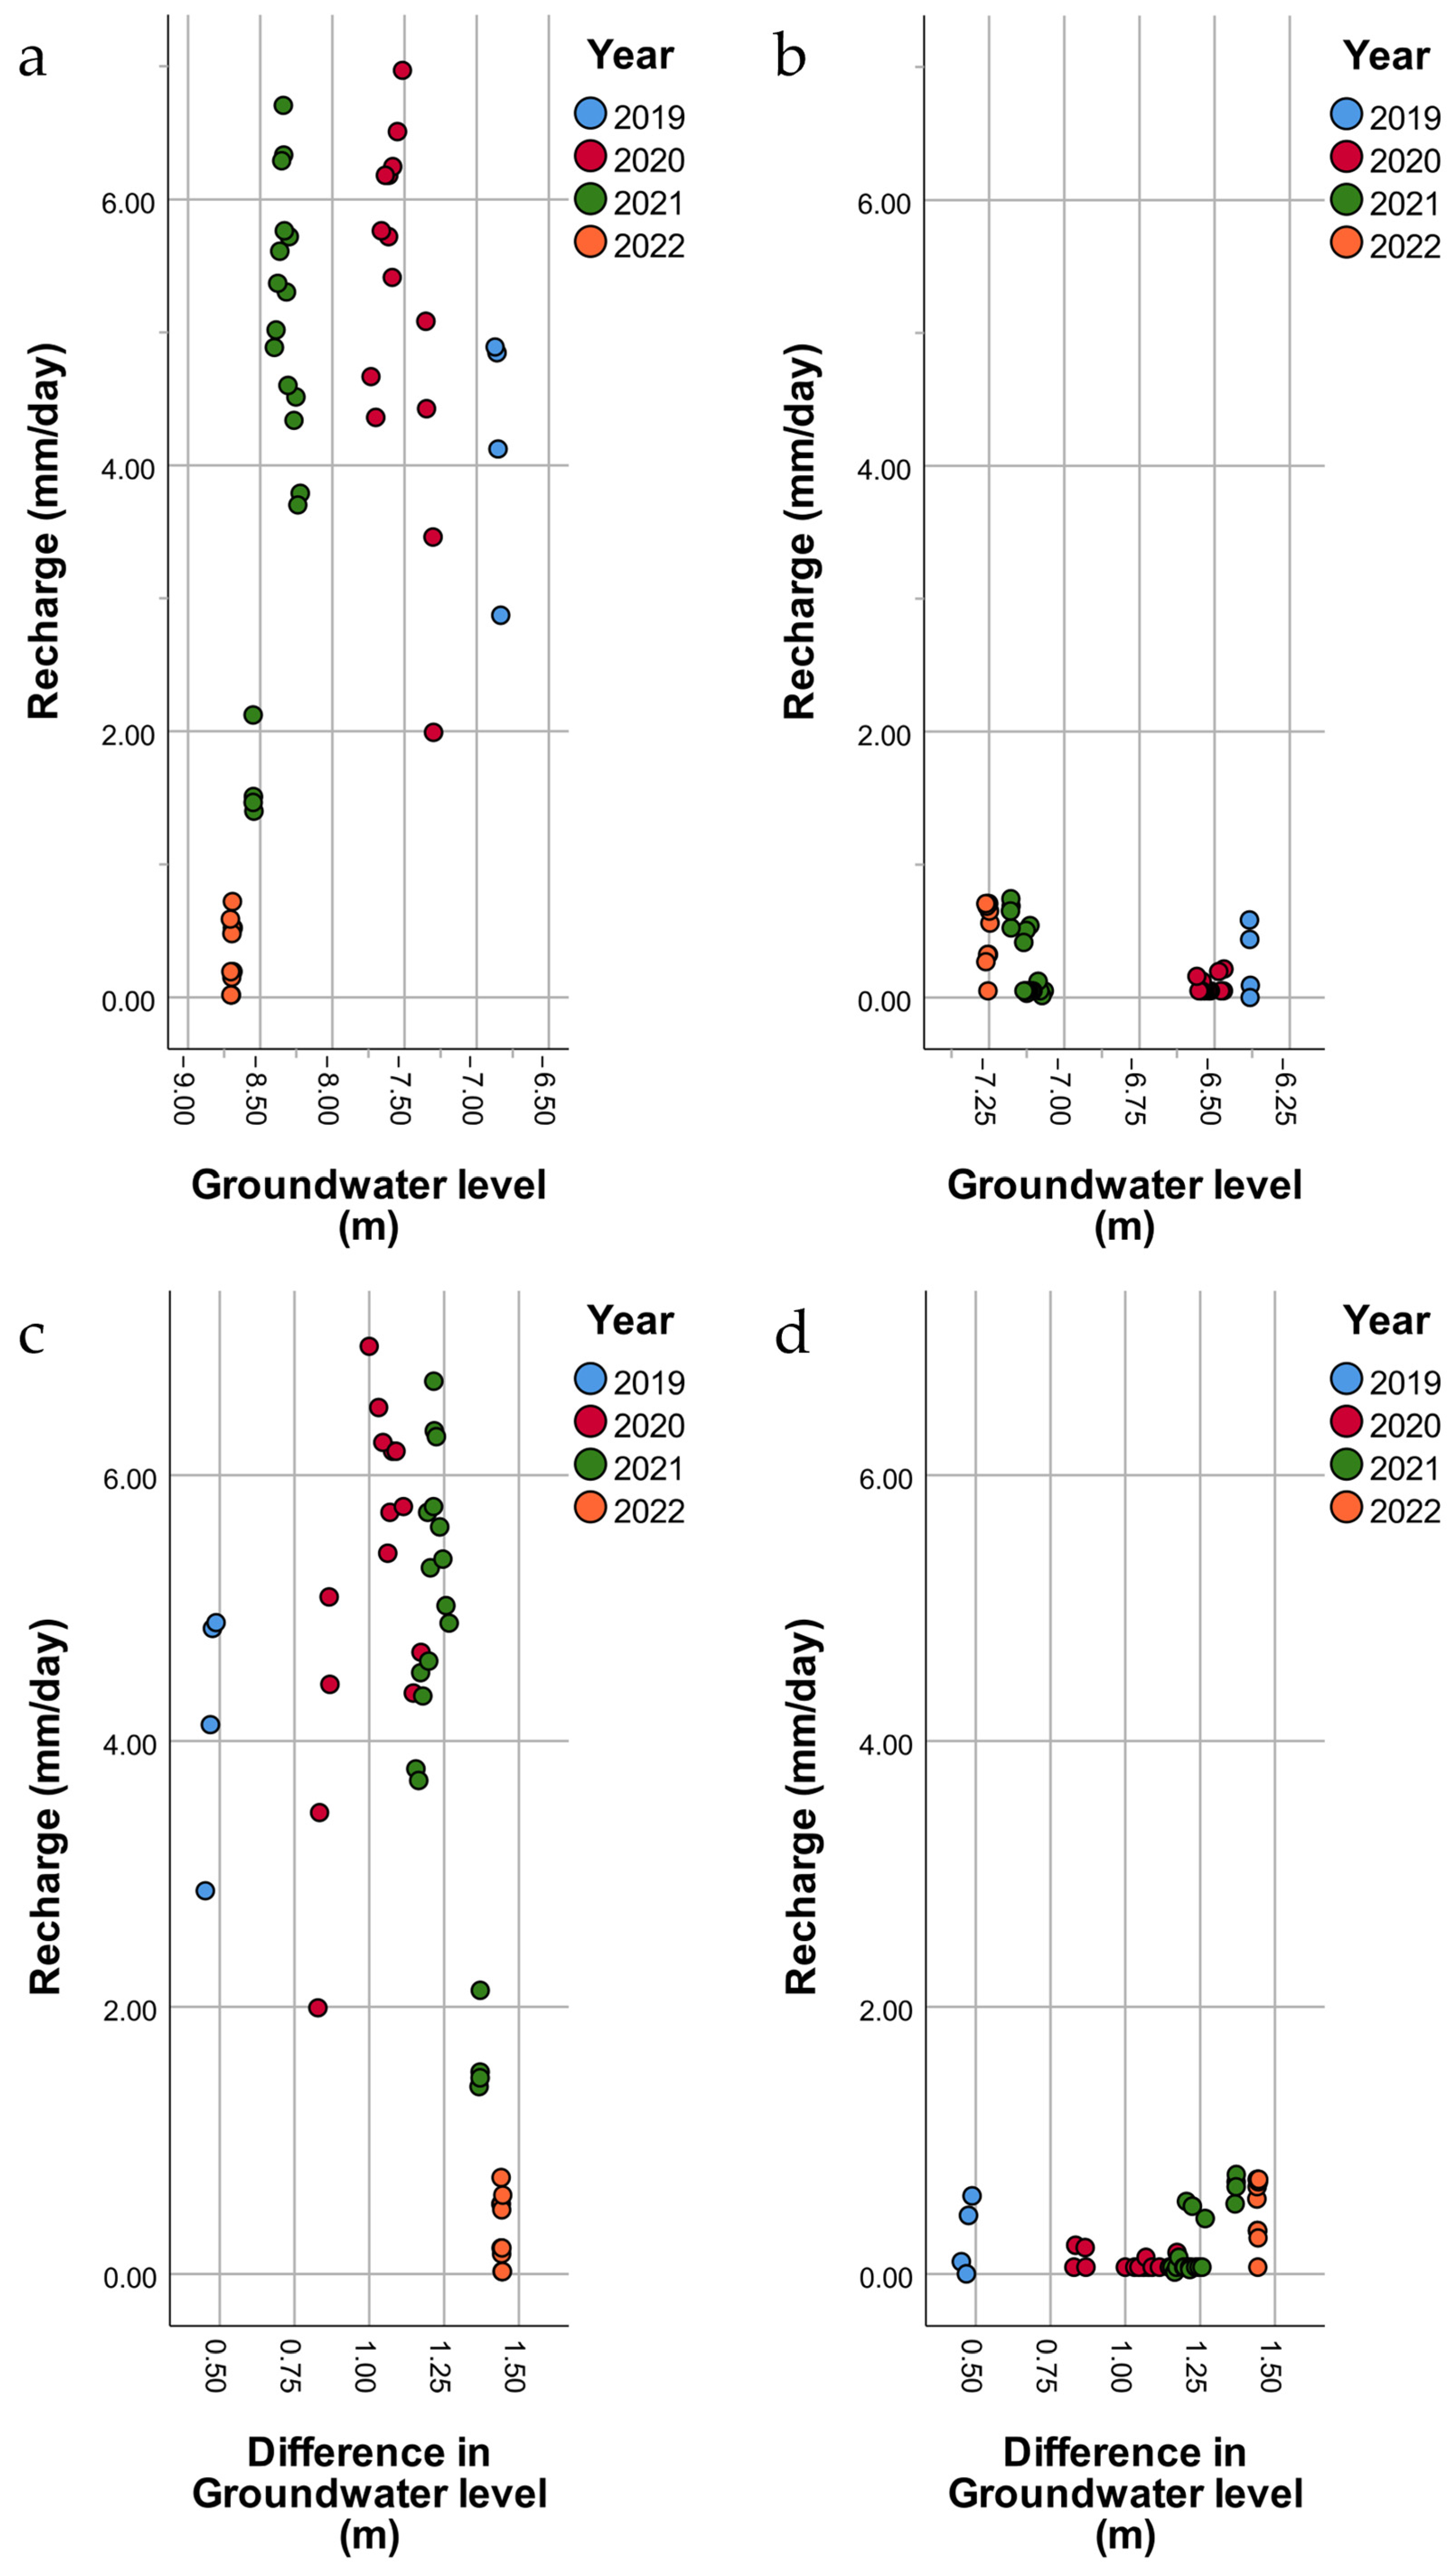
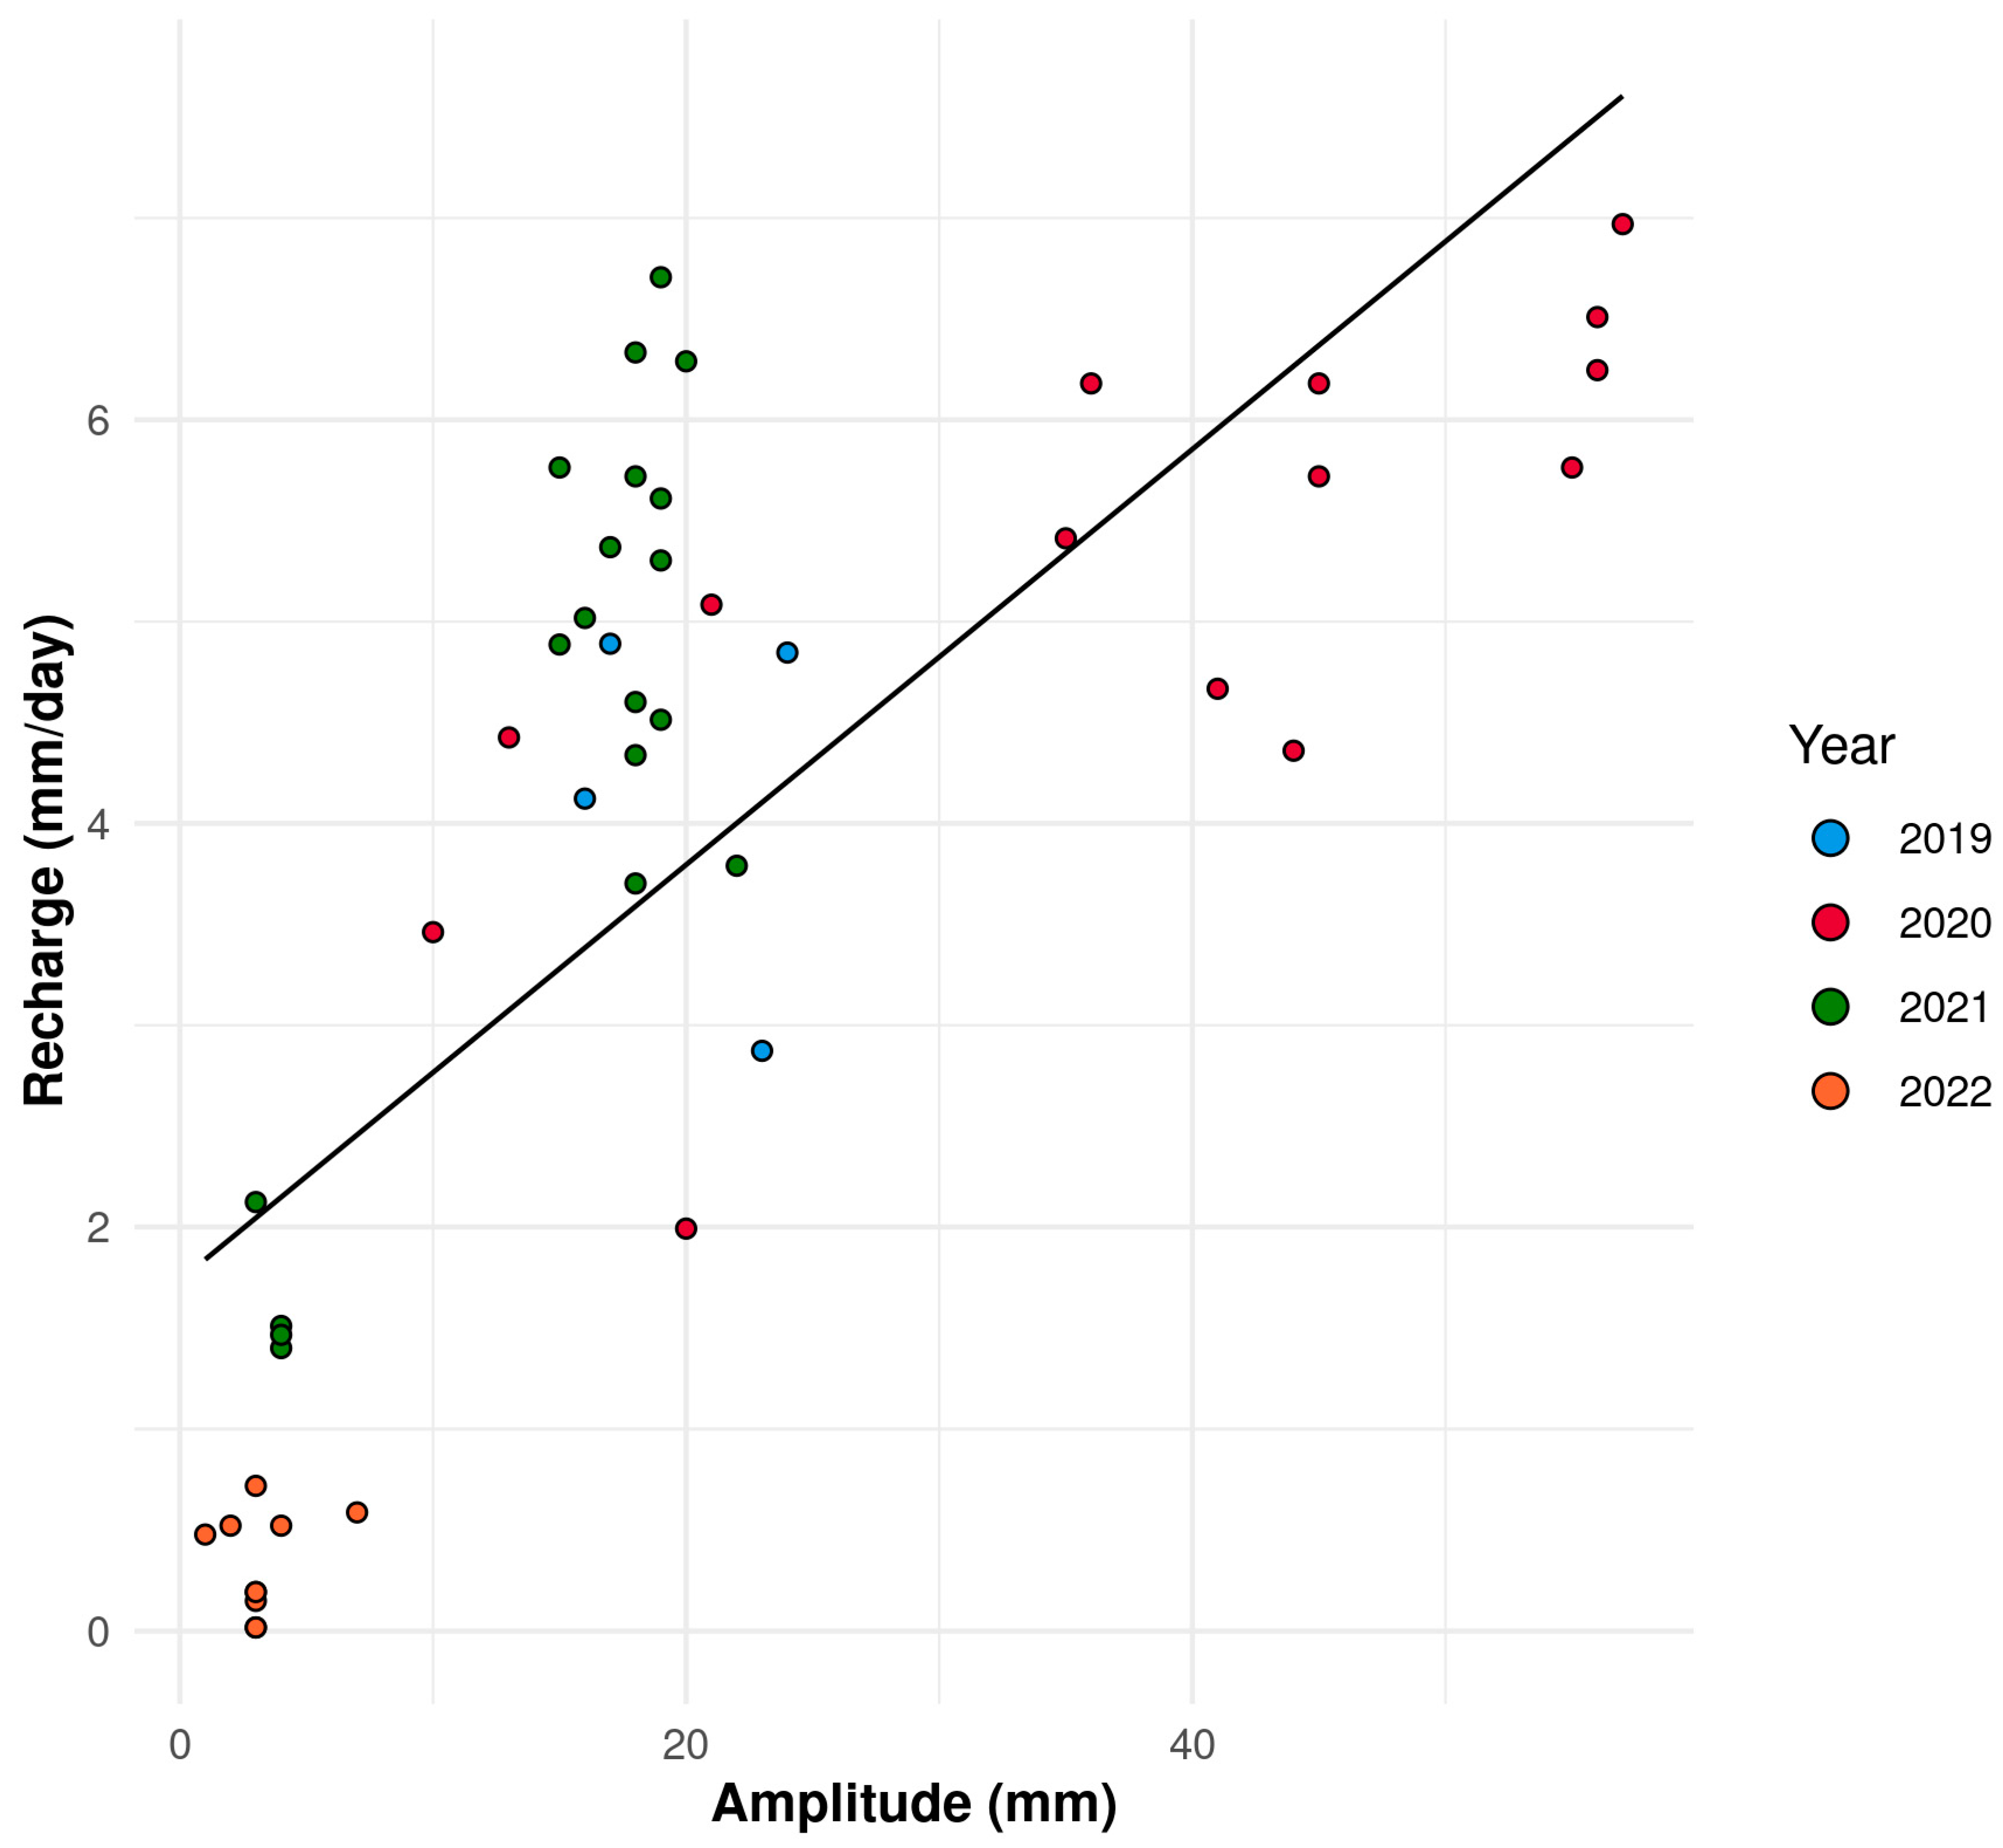
3.2. General Description of the Recharge

This study focused on analysing the individual effects of various influencing factors, namely groundwater level, difference in groundwater levels, and amplitude, throughout both the dormant and vegetation periods. This approach was adopted to accurately assess the influence of vegetation on these components. The characteristics of the recharge for each period and sampling point are in Figure 6.
During the dormant period (Nov-Feb), in the precipitation-free periods, the groundwater recharge is generally positive under the forest (rechargeable groundwater zone). During these periods, there is a positive correlation between recharge and groundwater level differences, independent of the groundwater depth, as represented in Figure 7. Conversely, in the control area, the groundwater recharge remained close to zero during times without precipitation.
Groundwater recharge during the dormant period under the forest is primarily sourced from the surrounding areas, where the vegetation roots do not reach the groundwater during the summer. It is possible that recharging may also occur from deeper layers through regional groundwater flow originating from below. The recharge observed at the control region exhibited a notable decrease and showed a weak positive correlation with the groundwater level. This suggests that a positive recharge may occur when the groundwater levels are sufficiently low, as seen in Figure 8.
The data obtained from the forest well during the precipitation-free days of the vegetative period (from May to August) from the entire observation period can be divided into two distinct segments. During the period spanning from 2019 to the first half of 2021, the situation indicated stationary behaviour, with no discernible correlation between the recharge and the groundwater level (Figure 9a), as well as the difference in groundwater levels (magnitude of the depression) (Figure 9c). However, starting from the latter half of 2021 and continuing into 2022, there was a notable decline in the recharging rate, which coincided with a decline in the groundwater level and an increase in the groundwater depression (Figure 9a,c). No discernible correlation was found between the depth of groundwater and the depression of groundwater at the control point (Figure 9b,d).
The behaviour observed during the vegetative period can be attributed to the detachment of the root system from the lowering groundwater level. As a consequence, there is a notable reduction in the cyclical daily water uptake from the aquifer. Minimising this daily groundwater uptake has led to the dominance of the long-term recharge into the aquifer under the forest instead of the cyclical daily recharge. During the dormant period, however, this process was characterised by a different orientation, i.e., deeper groundwater levels or more minor spatial differences in the groundwater levels generate less recharge because there is a lower available supply of groundwater in the system around both wells. Furthermore, a correlation exists in the vegetation period between the recharge and the daily amplitude of groundwater level fluctuations generated by vegetation in the forested area (Figure 10). During the vegetation period, no daily fluctuations in the groundwater levels were detected in the control area.
Figure 11 illustrates the differences in the daily groundwater level fluctuations under the forest on three consecutive precipitation-free days, specifically in the years (a) 2020, (b) 2021, and (c) 2022. The vertical lines serve as markers indicating midnight each day. There are significant changes in the daily fluctuations in groundwater levels reported across successive years. Apparent daily fluctuations and recharge periods were observed in the first two years of the study period (2019, 2020). The start of these periods varied between 22:45 and 3:00 (Figure 11a). Following this, in the year 2021, the daily fluctuations were still observable. Nevertheless, the start of the recharge periods was significantly delayed, occurring from 6:15 to 11:15. The magnitude of the daily fluctuations significantly decreased in the data series after 21 August 2021 (Figure 11b).
In the daily data for 2022, no recharge periods are visible; therefore, their start could not be determined (Figure 11c).
It can be concluded that in contrast to the time interval spanning from 12:00 a.m. to 4:00 a.m. presumed by the White method, it is possible for the daily recharge periods to occasionally start with significant delays. Upon comparing the temporal delay with the influencing factors that were investigated, a distinct correlation was observed between the extent of the delay and the groundwater level (Figure 12). Data from 2022 were eliminated from the analysis due to the inability to identify observable recharge periods caused by the decline in the groundwater level.

4. Discussion

In addition to their globally significant function as carbon sinks, forests in a given region are fed by groundwater, which can induce numerous locally significant positive effects. During the summer season, they cool their environment [65], reduce the extended drying of the upper soil, mitigate the effects of erosion, and lower the salt content of the topsoil [66]. The latter is particularly significant in regions affected by salinisation, such as the Great Hungarian Plain.
The results of this case study need to be viewed in the context of the local importance of the ecological and socio-economic roles of groundwater. The vegetation in the area depends on groundwater as a means of survival during extended periods of drought caused by limited water availability due to climate factors [9]. In the aforementioned situations, the significance of groundwater resources at a regional level is paramount. However, a comprehensive understanding of the dynamics between vegetation and groundwater-level systems remains limited, both on a regional scale and in a global context [67]. The forest stand that we analysed represents a little contribution towards addressing this shortage. However, it also serves as an indicator of growing hazards that necessitate more comprehensive investigations.
The local data and regional data indicate a noticeable decrease in groundwater levels in the research area (Figure 4). According to Major [68], the decline in question is caused by various factors, including both climatic and anthropogenic influences such as groundwater extraction and afforestation. Szilágyi and Vorosmarty [44] quantified the influence of the Danube–Tisza interfluve as 70 percent due to deep groundwater outtake and 15 percent due to forest and climatic influence, respectively. The current study aimed to examine spatially and temporally limited processes and assess the suitability of the White method as an indicator of change in the forest–aquifer interaction within a specific local context. However, we were unable to analyse and quantify the effects of potential anthropogenic influences or long-term meteorological factors. Nevertheless, it is important to note that the meteorological conditions observed during the analysed years demonstrate a consistent inclination towards aridity (Table 2). Additionally, the evident decline in groundwater levels further emphasises the significance of these aspects as crucial contextual elements in our interpretation and subsequent findings.
It is important to acknowledge an additional source of uncertainty related to the generalisations of our findings, namely, the fact that the local groundwater level is deeper at both the control and forest sample points in comparison to the monitoring wells located further away in the region. The observed depression in the groundwater level at the control and forest sample points (Figure 5) may result in extra recharging towards the forest, mostly due to a regional lateral groundwater flow. This fact, when considered in conjunction with the aforementioned observation, supports the notion of increased recharge towards the forested area. It is worth mentioning that the rate of lateral groundwater flow is significantly influenced by the soil texture as the distance increases. The presence of a substantial clay component in the soil, which is a defining characteristic of the region, results in a reduction in the rate of flow in both the saturated and unsaturated zones.
The inclusion of upward-flowing groundwater from deeper layers, which had not been excluded by hydrogeologists in a different area of the Great Hungarian Plain [69], was not taken into account. Therefore, we have yet to attempt to put the results into a broader water balance/areal evapotranspiration context, which is a drawback.
Based on our calculations, the average precipitation-independent recharge during the vegetative periods spanning from May to August in the years 2019 to 2022 was determined to be 3.78 mm/day in the forested areas and 0.25 mm/day in the control stands. Nevertheless, it is crucial to highlight that these values are not appropriate for establishing a water balance or conducting spatial interpolation. This limitation arises from the use of single-point sampling, which disregards the potential influence of regional groundwater flow systems, including lateral and upward movements. Additionally, accurately determining the crucial Sy value in the White method [70] poses significant challenges. However, considering the aforementioned information, the predicted recharge values are appropriate for demonstrating the differences between the forest and control points in each respective year.
A positive correlation between recharge and groundwater depression was solely found during the dormant period (Figure 7). This suggests that recharge tends to reach a state of equilibrium during the dormant period under the forested area. Simultaneously, the recharge within the control point was found to be influenced by the groundwater level. It was observed that a shallower groundwater level corresponded to a lower rate of recharge (Figure 8).
Among the factors examined, the amplitude of the daily water uptake during the vegetation period showed the highest degree of correlation (Figure 10). It follows that the renewal is typically dependent on the magnitude of the local and short-term depression generated by the daily fluctuation of the groundwater level (the amplitude of the daily groundwater level). The explanation for this relationship is that days characterised by high potential evaporation result in a notable depression in the groundwater level on a short time scale. This depression occurs due to the water uptake of the forest from the nearby groundwater reservoir, which is situated in close proximity (within a few metres) [62]. During the vegetation periods, there are two discernible patterns in the correlation between the recharge under the forest and the groundwater level or depression (Figure 9a,c). Initially, over the observation period spanning from 2019 to 2021, no distinct patterns were observed in the relationship between recharge and the analysed parameters, and stationary conditions were implicated in the system’s behaviour. Below a certain threshold of drying conditions in the last two years, both the increase in the groundwater water depression and the decrease in the groundwater level resulted in a decreasing recharge, suggesting that nonstationary system behaviour and the subsurface water flow were becoming less capable of replenishing the necessary daily water uptake by the vegetation.
Significant variations were observed in the diurnal dynamics of the groundwater level throughout each year of the vegetation period (Figure 11). The temporal delay in the starting of recharge exhibited a robust correlation with the depth of the groundwater, suggesting that the occurrence of drying may be linked to a delayed daily recharge (Figure 12). In the data for 2022, the recharge periods could not even be separately identified (Figure 11c). In the case when we could not expect a significant increase in recharge resulting from precipitation in the region in the foreseeable future, the ongoing decline in groundwater levels might have severe adverse effects on the forest ecosystem. The initial indications of drought-induced stress, including top-drying, early leaf yellowing, and leaf loss, are presently observable on the forest vegetation located at the designated monitoring site (Figure 13).
It may be assumed that, with regard to the control point, the replenishment of water during rainless periods may be sourced from an established upward movement of groundwater, which is an integral component of larger-scale flow systems [69,71]. In the case of the forest site, this hydrological process is supplemented by the additional water from the lateral inflow, which is formed due to the pressure difference resulting from the groundwater depression induced by the daily water absorption by trees. The data for the year 2022 provide support for the theory positing an upward flow of groundwater. Specifically, when the daily fluctuation is absent (presumably due to the gap between the root zone and the aquifer), this additional lateral water source does not occur. Consequently, there is a similar level of recharge under both the control and the forest (Figure 14).
The signs of this process are also visible in the curves describing the daily dynamics of the groundwater level (Figure 11a–c).

5. Conclusions

The sustenance and preservation of diverse forest ecosystems in the Great Hungarian Plain heavily rely on the crucial functions of groundwater evapotranspiration and recharge. This paper is a case study examining the recent dynamics of groundwater levels and recharge in two wells situated at a forest pilot site and a meadow control site. The analysis and conclusions are based on recharge driven by the difference in pressure from a groundwater depression due to forest evaporation. In this study, we conducted an analysis of the amplitude and temporal fluctuations of groundwater recharge using a novel adaptation of the traditional White method. The sensitivity of the White method was also tested in order to assess its effectiveness in detecting changes in the system’s behaviour with regard to forest access to groundwater. This analysis was conducted under the circumstances of declining regional groundwater resources and a warming environment. During the vegetation period, the recharge under the forest was comprised of two main components. Firstly, there was an upward flow of groundwater from deep horizons, which was also observed in the control area. Secondly, there was lateral water movement caused by the daily water uptake of the forest vegetation, resulting in small-scale spatiotemporal groundwater depressions. In the past two years, it has been observed that when drying conditions fall below a certain threshold, there is a simultaneous increase in groundwater depression and a decrease in groundwater level. This leads to a decline in recharge, indicating a nonstationary system behaviour. Furthermore, it suggests that the subsurface water flow is becoming less effective in replenishing the daily water uptake required by vegetation.
Due to the decline in groundwater described above that occurred on multiple time scales, the capillary zone has likely moved away from the root system of the trees. The initial indications of this phenomenon became apparent during the vegetative period of 2021, characterised by diminished diurnal oscillations in groundwater levels and a delayed onset of the daily recharge phase. During the vegetative period of 2022, the processes beneath the forest showed patterns similar to those observed beneath the control monitoring point in terms of daily groundwater dynamics and daily recharge levels. This indicates that the regular replenishment of groundwater generated by the depression beneath the forest is no longer occurring on a daily basis. This is due to the drying out of the system, which hinders the ability of tree roots to access the relatively deep groundwater reservoir.
Based on the analysis of the multi-year data series and the observed correlations, it is apparent that the local depression within the research area has moved towards an equilibrium during the dormant period. The observed phenomenon can be seen as a replenishment of groundwater on a seasonal basis, facilitated by the water uptake by vegetation during the growing season of the forest. This replenishment is determined by the difference in groundwater levels between the control area and the forested area. Nevertheless, it is essential to note that a state of full balance has not been achieved, even by the end of one dormant period. It suggests that the observed decline in regional groundwater levels can be attributed, in part, to the warming climate and the subsequent increase in potential evapotranspiration of the forest. It is important to note, however, that other factors also contribute to this decline.
The contribution of precipitation-independent recharge is a notable aspect of the annual water balance, playing a crucial role in ensuring the long-term viability of forests that offer a multitude of beneficial ecosystem services within the given region. The findings of our study suggest that the depletion of groundwater at the research site has reached a critical threshold, posing a significant threat to the long-term viability of the investigated forest ecosystem. Hence, there is a need to reassess the existing water management policies in order to enhance the preservation and restoration of groundwater resources with greater efficiency [72,73]. Furthermore, it is imperative to prioritise important objectives in forestry research, such as the exploration of novel and sustainable approaches to forest management and the identification of suitable tree species for places grappling with this issue.
Nevertheless, the current measurement methods only allow for a limited examination of parallel processes operating at different spatial and temporal scales. Consequently, it is not feasible to establish a water balance particular to the area using the provided values. Hence, the assessment of the hydrological function of lowland forests necessitates reliance on data obtained from regionally implemented and long-term intensive monitoring systems.
Furthermore, considering the vast extent of the wooded steppe vegetation zone and the possibility that global climate change can induce similar processes in other areas, it would be crucial to monitor these processes through the mentioned monitoring systems.

Author Contributions

Conceptualization, Z.G. and J.S. (Ján Szolgay); formal analysis, A.S. and P.K.; investigation, A.S., K.B., J.S. (József Szalai), and B.B.; visualization, A.S., P.K. and B.B.; writing—original draft, A.S.; writing—review and editing, K.H. All authors have read and agreed to the published version of the manuscript.

Funding

The following joint projects (143972SNN project and the TKP2021-NKTA-43 project) were also supported the preparation of this paper: TKP2021-NKTA-43 has been implemented with the support provided by the Ministry of Innovation and Technology of Hungary (successor: Ministry of Culture and Innovation of Hungary) from the National Research, Development and Innovation Fund, financed under the TKP2021-NKTA funding scheme. This work was also supported by the APVV No. 20-0374 grant by the Slovak Research and Development Agency and VEGA No. 2/0015/23 project by the Scientific Grant Agency of the Ministry of Education Science, Research and Sport of the Slovak Republic. The authors are thankful for the support.

Data Availability Statement

Data are contained within the article.

Acknowledgments

The authors are thankful to the Central Tisza Valley Water Management Directorate, Hungary, for the provided data.

Conflicts of Interest

The authors declare no conflict of interest. The funders had no role in the design of the study; in the collection, analyses, or interpretation of data; in the writing of the manuscript; or in the decision to publish the results.

References

  1. Atawneh, D.A.; Cartwright, N.; Bertone, E. Climate Change and Its Impact on the Projected Values of Groundwater Recharge: A Review. J. Hydrol. 2021, 601, 126602. [Google Scholar] [CrossRef]
  2. Hou, X.; Hui, Y.; Cao, J.; Feng, W.; Zhang, Y. A Review of Advances in Groundwater Evapotranspiration Research. Water 2023, 15, 969. [Google Scholar] [CrossRef]
  3. Andualem, T.G.; Demeke, G.G.; Ahmed, I.; Dar, M.A.; Yibeltal, M. Groundwater Recharge Estimation Using Empirical Methods from Rainfall and Streamflow Records. J. Hydrol. Reg. Stud. 2021, 37, 100917. [Google Scholar] [CrossRef]
  4. Lee, C.-H.; Chen, W.-P.; Lee, R.-H. Estimation of Groundwater Recharge Using Water Balance Coupled with Base-Flow-Record Estimation and Stable-Base-Flow Analysis. Environ. Geol. 2006, 51, 73–82. [Google Scholar] [CrossRef]
  5. Manna, F.; Cherry, J.A.; McWhorter, D.B.; Parker, B.L. Groundwater Recharge Assessment in an Upland Sandstone Aquifer of Southern California. J. Hydrol. 2016, 541, 787–799. [Google Scholar] [CrossRef]
  6. Obuobie, E.; Diekkrueger, B.; Agyekum, W.; Agodzo, S. Groundwater Level Monitoring and Recharge Estimation in the White Volta River Basin of Ghana. J. Afr. Earth Sci. 2012, 71–72, 80–86. [Google Scholar] [CrossRef]
  7. Szabó, A.; Gribovszki, Z.; Kalicz, P.; Szolgay, J.; Bolla, B. The Soil Moisture Regime and Groundwater Recharge in Aged Forests in the Sand Ridge Region of Hungary after a Decline in the Groundwater Level: An Experimental Case Study. J. Hydrol. Hydromech. 2022, 70, 308–320. [Google Scholar] [CrossRef]
  8. Yadav, B.; Parker, A.; Sharma, A.; Sharma, R.; Krishan, G.; Kumar, S.; Corre, K.L.; Moreno, P.C.; Singh, J. Estimation of Groundwater Recharge in Semiarid Regions under Variable Land Use and Rainfall Conditions: A Case Study of Rajasthan, India. PLoS Water 2023, 2, e0000061. [Google Scholar] [CrossRef]
  9. Ijjász, E. A Fatenyészet És Az Altalajvíz, Különös Tekintettel a Nagyalföldi Viszonyokra. Erd. Kísérletek 1939, 42, 107. [Google Scholar]
  10. Magyar, P. Alföldfásítás. I.-II.; Akademiai Kiado: Budapest, Hungary, 1961. [Google Scholar]
  11. Gou, S.; Miller, G. A Groundwater–Soil–Plant–Atmosphere Continuum Approach for Modelling Water Stress, Uptake, and Hydraulic Redistribution in Phreatophytic Vegetation. Ecohydrology 2014, 7, 1029–1041. [Google Scholar] [CrossRef]
  12. Kupec, P.; Deutscher, J.; Futter, M. Longer Growing Seasons Cause Hydrological Regime Shifts in Central European Forests. Forests 2021, 12, 1656. [Google Scholar] [CrossRef]
  13. Wojkowski, J.; Wałęga, A.; Młyński, D.; Radecki-Pawlik, A.; Lepeška, T.; Piniewski, M.; Kundzewicz, Z.W. Are We Losing Water Storage Capacity Mostly Due to Climate Change—Analysis of the Landscape Hydric Potential in Selected Catchments in East-Central Europe. Ecol. Indic. 2023, 154, 110913. [Google Scholar] [CrossRef]
  14. Sajil Kumar, P.J.; Schneider, M.; Elango, L. The State-of-the-Art Estimation of Groundwater Recharge and Water Balance with a Special Emphasis on India: A Critical Review. Sustainability 2022, 14, 340. [Google Scholar] [CrossRef]
  15. West, C.; Rosolem, R.; MacDonald, A.M.; Cuthbert, M.O.; Wagener, T. Understanding Process Controls on Groundwater Recharge Variability across Africa through Recharge Landscapes. J. Hydrol. 2022, 612, 127967. [Google Scholar] [CrossRef]
  16. Collenteur, R.; Bakker, M.; Klammler, G.; Birk, S. Estimating groundwater recharge from groundwater levels using non-linear transfer function noise models and comparison to lysimeter data. Hydrol. Earth Syst. Sci. 2020, 25, 2931–2949. [Google Scholar] [CrossRef]
  17. Jia, W.; Yin, L.; Zhang, M.; Zhang, X.; Zhang, J.; Tang, X.; Dong, J. Quantification of Groundwater Recharge and Evapotranspiration along a Semi-Arid Wetland Transect Using Diurnal Water Table Fluctuations. J. Arid Land 2021, 13, 455–469. [Google Scholar] [CrossRef]
  18. Yonghong, S.; Qi, F.; Gaofeng, Z.; Qi, Z. Evaluating the Different Methods for Estimating Groundwater Evapotranspiration Using Diurnal Water Table Fluctuations. J. Hydrol. 2022, 607, 127508. [Google Scholar] [CrossRef]
  19. Zhang, W.; Zhao, L.; Yu, X.; Zhang, L.; Wang, N. Estimation of Groundwater Evapotranspiration Using Diurnal Groundwater Level Fluctuations under Three Vegetation Covers at the Hinterland of the Badain Jaran Desert. Adv. Meteorol. 2020, 2020, 8478140. [Google Scholar] [CrossRef]
  20. Gribovszki, Z. Comparison of Specific-Yield Estimates for Calculating Evapotranspiration from Diurnal Groundwater-Level Fluctuations. Hydrogeol. J. 2018, 26, 869–880. [Google Scholar] [CrossRef]
  21. Healy, R.W.; Cook, P.G. Using Groundwater Levels to Estimate Recharge. Hydrogeol. J. 2002, 10, 91–109. [Google Scholar] [CrossRef]
  22. Gribovszki, Z.; Szilágyi, J.; Kalicz, P. Diurnal Fluctuations in Shallow Groundwater Levels and Streamflow Rates and Their Interpretation—A Review. J. Hydrol. 2010, 385, 371–383. [Google Scholar] [CrossRef]
  23. Fahle, M.; Dietrich, O. Estimation of Evapotranspiration Using Diurnal Groundwater Level Fluctuations: Comparison of Different Approaches with Groundwater Lysimeter Data. Water Resour. Res. 2014, 50, 273–286. [Google Scholar] [CrossRef]
  24. White, W.N. A Method of Estimating Ground-Water Supplies Based on Discharge by Plants and Evaporation from Soil: Results of Investigations in Escalante Valley, Utah; US Government Printing Office: Washington, DC, USA, 1932; Volume 659. [Google Scholar]
  25. Fan, J.; Oestergaard, K.T.; Guyot, A.; Lockington, D.A. Estimating Groundwater Recharge and Evapotranspiration from Water Table Fluctuations under Three Vegetation Covers in a Coastal Sandy Aquifer of Subtropical Australia. J. Hydrol. 2014, 519, 1120–1129. [Google Scholar] [CrossRef]
  26. Jiang, X.-W.; Sun, Z.-C.; Zhao, K.-Y.; Shi, F.-S.; Wan, L.; Wang, X.-S.; Shi, Z.-M. A Method for Simultaneous Estimation of Groundwater Evapotranspiration and Inflow Rates in the Discharge Area Using Seasonal Water Table Fluctuations. J. Hydrol. 2017, 548, 498–507. [Google Scholar] [CrossRef]
  27. Soylu, M.E.; Lenters, J.D.; Istanbulluoglu, E.; Loheide II, S.P. On Evapotranspiration and Shallow Groundwater Fluctuations: A Fourier-Based Improvement to the White Method. Water Resour. Res. 2012, 48, W06506. [Google Scholar] [CrossRef]
  28. Wang, T.-Y.; Wang, P.; Yu, J.-J.; Pozdniakov, S.P.; Du, C.-Y.; Zhang, Y.-C. Revisiting the White Method for Estimating Groundwater Evapotranspiration: A Consideration of Sunset and Sunrise Timings. Environ. Earth Sci. 2019, 78, 412. [Google Scholar] [CrossRef]
  29. Runyan, C.; Welty, C. Use of the White Method to Estimate Evapotranspiration along an Urban Riparian Corridor; CUERE Technical Memo 2010/001; UMBC, Center for Urban Environmental: Baltimore, MD, USA, 2010. [Google Scholar]
  30. Zhang, P.; Yuan, G.; Shao, M.; Yi, X.; Du, T. Performance of the White Method for Estimating Groundwater Evapotranspiration under Conditions of Deep and Fluctuating Groundwater: Performance of White Method with Deep Groundwater. Hydrol. Process. 2016, 30, 106–118. [Google Scholar] [CrossRef]
  31. Calder, I.R. Water Use by Forests, Limits and Controls. Tree Physiol. 1998, 18, 625–631. [Google Scholar] [CrossRef]
  32. Jackson, R.B.; Pockman, W.T.; Hoffmann, W.A. The Importance of Root Distributions for Hydrology, Biogeochemistry, and Ecosystem Functioning. In Integrating Hydrology, Ecosystem Dynamics, and Biogeochemistry in Complex Landscapes, 1st ed.; Tenhunen, J.D., Kabat, P., Eds.; John Wiley & Sons, Inc.: New York City, NY, USA, 1999; pp. 217–238. [Google Scholar]
  33. Nosetto, M.D.; Jobbágy, E.G.; Paruelo, J.M. Land-Use Change and Water Losses: The Case of Grassland Afforestation across a Soil Textural Gradient in Central Argentina. Glob. Chang. Biol. 2005, 11, 1101–1117. [Google Scholar] [CrossRef]
  34. Schenk, H.J.; Jackson, R.B. Rooting Depths, Lateral Root Spreads and below-Ground/above-Ground Allometries of Plants in Water-Limited Ecosystems. J. Ecol. 2002, 90, 480–494. [Google Scholar] [CrossRef]
  35. Kelliher, F.M.; Leuning, R.; Schulze, E.D. Evaporation and Canopy Characteristics of Coniferous Forests and Grasslands. Oecologia 1993, 95, 153–163. [Google Scholar] [CrossRef] [PubMed]
  36. Móricz, N.; Mátyás, C.; Berki, I.; Rasztovits, E.; Vekerdy, Z.; Gribovszki, Z. Comparative Water Balance Study of Forest and Fallow Plots. IForest—Biogeosci. For. 2012, 5, 188. [Google Scholar] [CrossRef]
  37. Csáfordi, P.; Szabó, A.; Balog, K.; Gribovszki, Z.; Bidló, A.; Tóth, T. Factors Controlling the Daily Change in Groundwater Level during the Growing Season on the Great Hungarian Plain: A Statistical Approach. Environ. Earth Sci. 2017, 76, 675. [Google Scholar] [CrossRef]
  38. Nachabe, M.; Shah, N.; Ross, M.; Vomacka, J. Evapotranspiration of Two Vegetation Covers in a Shallow Water Table Environment. Soil Sci. Soc. Am. J. 2005, 69, 492–499. [Google Scholar] [CrossRef]
  39. Schilling, K. Water Table Fluctuations under Three Riparian Land Covers, Iowa (USA). Hydrol. Process. 2007, 21, 2415–2424. [Google Scholar] [CrossRef]
  40. Major, P. Síkvidéki Erdők Hatása a Vízháztartásra. Hidrol. Közlöny 2002, 82, 319–323. [Google Scholar]
  41. Szodfridt, I.; Faragó, S. Talajvíz És Vegetáció Kapcsolata a Duna—Tisza Köze Homokterületén. Bot. Közl 1968, 55, 69–75. [Google Scholar]
  42. Markó, A. Ipari Nyár Ültetvények Környezeti Hatása Mezőgazdasági Területeken. In Talajvédelem—Magyar talajtani társaság ülése, Keszthely, Hungary, 04-06.09.2014; Hernádi, H., Sisák, I., Szabóné Kele, G., Eds.; Talajvédelmi Alapítvány: Budapest, Hungary, 2014; pp. 69–74. [Google Scholar]
  43. Nosetto, M.D.; Jobbágy, E.G.; Tóth, T.; Di Bella, C.M. The Effects of Tree Establishment on Water and Salt Dynamics in Naturally Salt-Affected Grasslands. Oecologia 2007, 152, 695–705. [Google Scholar] [CrossRef]
  44. Szilágyi, J.; Vörösmarty, C. A Duna–Tisza Közi Talajvízszint-Süllyedések Okainak Vizsgálata. Vízügyi Közlemények 1993, 75, 280–294. [Google Scholar]
  45. Szilágyi, J.; Kovács, Á.; Józsa, J. Remote-Sensing Based Groundwater Recharge Estimates in the Danube-Tisza Sand Plateau Region of Hungary. J. Hydrol. Hydromech. 2012, 60, 64–72. [Google Scholar] [CrossRef]
  46. Vágás, I. Az Erdők Talajvizszintsüllyesztésének Kútelméleti Értelmezése. Hidrol. Közlöny 1993, 73, 60–61. [Google Scholar]
  47. Jackson, R.B.; Jobbágy, E.G.; Avissar, R.; Roy, S.B.; Barrett, D.J.; Cook, C.W.; Farley, K.A.; Le Maitre, D.C.; McCarl, B.A.; Murray, B.C. Trading Water for Carbon with Biological Carbon Sequestration. Science 2005, 310, 1944–1947. [Google Scholar] [CrossRef] [PubMed]
  48. Jobbágy, E.G.; Jackson, R.B. Groundwater Use and Salinization with Grassland Afforestation. Glob. Chang. Biol. 2004, 10, 1299–1312. [Google Scholar] [CrossRef]
  49. Lu, C.; Zhao, T.; Shi, X.; Cao, S. Ecological Restoration by Afforestation May Increase Groundwater Depth and Create Potentially Large Ecological and Water Opportunity Costs in Arid and Semiarid China. J. Clean. Prod. 2018, 176, 1213–1222. [Google Scholar] [CrossRef]
  50. Matyasovszky, I.; Weidinger, T.; Bartholy, J.; Barcza, Z. Current Regional Climate Change Studies in Hungary: A Review. Geogr. Helv. 1999, 54, 138–146. [Google Scholar] [CrossRef]
  51. Novaky, B.; Balint, G. Shifts and Modification of the Hydrological Regime under Climate Change in Hungary. In Climate Change—Realities, Impacts Over Ice Cap, Sea Level and Risks; Singh, B.R., Ed.; InTech: Vienna, Austria, 2013; ISBN 978-953-51-0934-1. [Google Scholar]
  52. Jánosi, I.; Bíró, T.; Lakatos, B.; Gallas, J.; Szöllosi-Nagy, A. Changing Water Cycle under a Warming Climate: Tendencies in the Carpathian Basin. Climate 2023, 11, 118. [Google Scholar] [CrossRef]
  53. Vacek, Z.; Vacek, S.; Cukor, J. European Forests under Global Climate Change: Review of Tree Growth Processes, Crises and Management Strategies. J. Environ. Manag. 2023, 332, 117353. [Google Scholar] [CrossRef]
  54. Árvai, M.; Morgós, A.; Kern, Z. Growth-Climate Relations and the Enhancement of Drought Signals in Pedunculate Oak (Quercus robur L.) Tree-Ring Chronology in Eastern Hungary. iForest-Biogeosci. For. 2018, 11, 267. [Google Scholar] [CrossRef]
  55. Varga-Haszonits, Z.; Varga, Z. A Meteorológiai Tényezők És a Növényfejlődés Közötti Kapcsolat Modellezésének Módszertani Alapjai. Acta Agron. Óvár. 2014, 56, 53–74. [Google Scholar]
  56. Varga-Haszonits, Z.; Tar, K.; Lantos, Z.; Varga, Z. Párolgási Formulák Összehasonlítása a Mosonmagyaróvári Meteorológiai Állomás Adatai Alapján. Növénytermelés 2015, 64, 77–96. [Google Scholar]
  57. Budyko, M.I. Climate of Life; Academic Press: New York, NY, USA; London, UK, 1974. [Google Scholar]
  58. Tatarinov, F.; Urban, J.; Čermák, J. Application of “Clump Technique” for Root System Studies of Quercus Robur and Fraxinus Excelsior. For. Ecol. Manag. 2008, 255, 495–505. [Google Scholar] [CrossRef]
  59. Hruska, J.; Čermák, J.; Šustek, S. Mapping Tree Root Systems with Ground-Penetrating Radar. Tree Physiol. 1999, 19, 125–130. [Google Scholar] [CrossRef]
  60. Thomas, F.M.; Hartmann, G. Tree Rooting Patterns and Soil Water Relations of Healthy and Damaged Stands of Mature Oak (Quercus Robur L. and Quercus Petraea [Matt.] Liebl.). Plant Soil 1998, 203, 145–158. [Google Scholar] [CrossRef]
  61. Mauer, O.; Houšková, K.; Mikita, T. The Root System of Pedunculate Oak (Quercus Robur L.) at the Margins of Regenerated Stands. J. For. Sci. 2017, 63, 22–33. [Google Scholar] [CrossRef]
  62. Loheide, S.P.; Butler, J.J., Jr.; Gorelick, S.M. Estimation of Groundwater Consumption by Phreatophytes Using Diurnal Water Table Fluctuations: A Saturated-Unsaturated Flow Assessment. Water Resour. Res. 2005, 41, W07030. [Google Scholar] [CrossRef]
  63. Gribovszki, Z. Evapotranszspiráció Számítása a Talajvíz Napi Periódusú Változása Alapján. Ph.D. Thesis, Budapesti Műszaki és Gazdaságtudományi Egyetem, Budapest, Hungary, 2009. [Google Scholar]
  64. Tóth, T.; Balog, K.; Szabó, A.; Pásztor, L.; Jobbágy, E.G.; Nosetto, M.D.; Gribovszki, Z. Influence of Lowland Forests on Subsurface Salt Accumulation in Shallow Groundwater Areas. AoB Plants 2014, 6, plu054. [Google Scholar] [CrossRef] [PubMed]
  65. Li, Y.; Zhao, M.; Motesharrei, S.; Mu, Q.; Kalnay, E.; Li, S. Local Cooling and Warming Effects of Forests Based on Satellite Observations. Nat. Commun. 2015, 6, 6603. [Google Scholar] [CrossRef] [PubMed]
  66. Novák, T. Afforestation Affects Vertical Distribution of Basic Soil Characteristics and Taxonomic Status of Sodic Soils. Plant Soil Environ. 2022, 68, 245–252. [Google Scholar] [CrossRef]
  67. Glanville, K.; Sheldon, F.; Butler, D.; Capon, S. Effects and Significance of Groundwater for Vegetation: A Systematic Review. Sci. Total Environ. 2023, 875, 162577. [Google Scholar] [CrossRef]
  68. Major, P. A Nagy-Alföld Talajvízháztartása. Hidr. Közl. 1993, 73, 40–43. [Google Scholar]
  69. Mádl-Szőnyi, J.; Tóth, J. A Hydrogeological Type Section for the Duna-Tisza Interfluve, Hungary. Hydrogeol. J. 2009, 17, 961–980. [Google Scholar] [CrossRef]
  70. Meyboom, P. Ground Water Studies in the Assiniboine River Drainage Basin: Hydrologic Characteristics of Phreatophytic Vegetation in South-Central Saskatchewan; Department of Energy, Mines and Resources: Ottawa, ON, Canada, 1967; Volume 2. [Google Scholar]
  71. Tóth, J. A Theoretical Analysis of Groundwater Flow in Small Drainage Basins. J. Geophys. Res. 1963, 68, 4795–4812. [Google Scholar] [CrossRef]
  72. Puskás, L. Ökológiai Vízpótlás a Körös-Völgy Erdeiben. In Erdő-Víz—Szemelvények az Erdészeti és Gyakorlati Munkákból; Magyar Hivatalos Közlönykiadó Lajosmizsei Nyomdája: Kecskemét, Hungary, 1999; pp. 50–63. [Google Scholar]
  73. Puskás, L. Ökológiai Vízpótlás a Mályvádi Tározóban. In Alföldi Erdıkért Egyesület Kutatói Nap—Tudományos Eredmények A Gyakorlatban; Alföldi Erdőkért Egyesület: Szeged, Hungary, 2006; pp. 39–48. [Google Scholar]
Figure 1. Schematic representation of the differences in water uptake between forests and herbaceous vegetation. ET: evapotranspiration.
Forests 14 02328 g001
Figure 2. Location of the study area and the data sampling points.
Forests 14 02328 g002
Figure 3. Schematic representation of the White method (based on Gribovszki [63]).
Forests 14 02328 g003
Figure 4. Long-term trends in groundwater level data series in the broader region. Source: Central Tisza Valley Water Management Directorate, Hungary.
Forests 14 02328 g004
Figure 5. Daily precipitation, air temperature, and groundwater levels in the forest and control monitoring sites between 2016 and 2022. Blue columns—precipitation; red line—temperature; green line—groundwater level at the control point; black line—groundwater level at the forested point.
Forests 14 02328 g005
Figure 6. Characteristic daily recharge rates at the forested and control sampling points during the dormant (n = 120) and vegetative (n = 47) periods.
Forests 14 02328 g006
Figure 7. Relationship between the recharge and the difference in the groundwater level (Control–Oak) during the dormant period under the forest point. (R2 = 0.343).
Forests 14 02328 g007
Figure 8. Relationship between the recharge and groundwater level during the dormant period under the control point (R2 = 0.332).
Forests 14 02328 g008
Figure 9. Relationship between the groundwater level recharge and groundwater level (a: Oak; b: Control) and difference in groundwater levels (magnitude of the depression) between the control and forest wells (c: Oak; d: Control) during the vegetation period.
Forests 14 02328 g009
Figure 10. Relationship between the groundwater level recharge and amplitude of the daily groundwater fluctuations during the vegetation period under the forest sample point (R2 = 0.548).
Forests 14 02328 g010
Figure 11. (ac) Daily groundwater level fluctuations under the forest in 2020 (a), 2021 (b), and 2022 (c) on three consecutive precipitation-free days. The vertical lines indicate midnight on each day.
Forests 14 02328 g011
Figure 12. Relationship between the start of the daily recharge periods and groundwater level during the vegetation period under the forest sample point. The data from 2022 are in light grey (R2 = 0.810).
Forests 14 02328 g012
Figure 13. Canopy of the forest stand at the forest monitoring point.
Forests 14 02328 g013
Figure 14. Daily groundwater recharge at the forested and control points between 2019 and 2022 on selected rainless days in the vegetation period.
Forests 14 02328 g014
Table 1. Main parameters of the sample points.
Sampling Point CoordinatesElevation (Surface, m, a.s.l.)Well Bottom (m, a.s.l.)Screening Depth of (m, a.s.l.)Average Groundwater Level (from Surface, m)Monitoring Period
Oak47°20′29.48″ N
21°05′42.16″ E
85.7875.2575.78–74.78−7.92 (+/−0.52)1 November 2018–9 October 2022
Control47°20′26.29″ N
21°05′37.46″ E
85.8376.8076.3–75.3−6.78 (+/−0.33)
Meteorological station47°20′04.53″ N
21°05′23.70″ E
88.70 -
Table 2. Main meteorological characteristics of the study period (hydrological years).
YearTemperature (°C)Precipitation (mm)Potential Evapotranspiration (mm)Aridity Index
201811.8504.9951.41.9
201911.7439.5897.22.0
202011.8627.3877.41.4
202111.3300.2916.93.1
202211.7288.21069.53.7
Table 3. Soil texture types in the monitoring wells. SL, sandy loam (light blue); L, loam (dark blue); CL, clay loam (yellow); C, clay (brown).
Depth (from Surface, m)ControlOak
0–0.2LL
0.2–0.4CLCL
0.4–0.6CLCL
0.6–0.8LL
0.8–1.0LL
1.0–1.5LL
1.5–2.0LCL
2.0–2.5LSL
2.5–3.0LL
3.0–3.5LCL
3.5–4.0SLCL
4.0–4.5SLCL
4.5–5.0SLCL
5.0–5.5LC
5.5–6.0LCL
6.0–6.5SLL
6.5–7.0SLL
7.0–7.5LL
7.5–8.0LL
8.0–8.5LL
8.5–9.0LCL
Disclaimer/Publisher’s Note: The statements, opinions and data contained in all publications are solely those of the individual author(s) and contributor(s) and not of MDPI and/or the editor(s). MDPI and/or the editor(s) disclaim responsibility for any injury to people or property resulting from any ideas, methods, instructions or products referred to in the content.

