Article

Effects of Groundwater Table Decline on Vegetation in Groundwater-Dependent Ecosystems

1
Key Laboratory of Soil and Water Conservation and Desertification Combating of Ministry of Education, Beijing Forestry University, Beijing 100083, China
2
State Key Laboratory of Simulation and Regulation of Water Cycle in River Basin, China Institute of Water Resources and Hydropower Research, Beijing 100038, China
3
Institute of Ecological Conservation and Restoration, Chinese Academy of Forestry, Beijing 100091, China
*
Authors to whom correspondence should be addressed.
Forests 2023, 14(12), 2326; https://doi.org/10.3390/f14122326
Submission received: 1 November 2023 / Revised: 20 November 2023 / Accepted: 22 November 2023 / Published: 27 November 2023
(This article belongs to the Section Forest Hydrology)

Abstract

:
The distribution map of groundwater-dependent ecosystems (GDEs) is generally used for the scientific management of vegetation and groundwater resources, and is instructive for forest resource conservation. The groundwater table in the Loess zone has declined over the past few years, but no study has yet been conducted to assess the impact of this decline on GDEs. This study used data from the GRACE gravity satellite to delineate groundwater fluctuation periods from 2002 to 2021, to develop a method to identify whether vegetation is potentially associated with groundwater using three criteria, and to verify the accuracy of this method. Study results show that the groundwater changes in the Loess zone can be divided into two periods, 2002–2014 and 2015–2021, with groundwater declines becoming more rapid after 2015. We did not observe the spatial variation pattern of GDEs in the Loess areas, but there was a significant change in the area of GDEs during the two periods studied, with a 13.56% decrease in the very likely GDEs’ group area and an 11.68% increase in the unlikely GDEs’ group area between 2015 and 2021 compared to 2002–2014, with little change in the neutral, likely, and very unlikely group areas. This study provides a reference for exploring the relationship between vegetation and groundwater, as well as for the scientific management of water resources.

1. Introduction

A third of the world’s water withdrawals come from groundwater, which serves as an emergency reserve in arid zones, maintaining baseflow and ecosystem stability [1,2,3]. Groundwater has become increasingly important due to climate change and the overuse of surface waters [4]. If groundwater levels change significantly, plants that use groundwater are at risk of extinction and ecosystem instability [5]. The spatial and temporal distribution of groundwater is subject to considerable uncertainty, so direct measurement is difficult [6], in the past, groundwater management has also faced considerable challenges due to lack of data. To achieve sustainable groundwater use, groundwater management has shifted from balancing human water demand and natural recharge rates to balancing environmental and human water demand [7,8,9]. The first step towards sound groundwater management is the integration of groundwater hydrology and ecology into the management of groundwater. The mapping of groundwater-dependent ecosystems (GDEs) provides ideas for new models of groundwater management [10].
GDEs rely intermittently or permanently on groundwater sources for their structure and function [11,12]. Apart from being found on land, GDEs are also found in aquatic, hyporheic, and riparian habitats, wetlands and springs, estuaries, and nearshore marine ecosystems [13]. GDEs provide for the survival of plants, and in addition to this, GDEs function to provide ecosystem services such as soil protection and water purification [14]. GDEs are usually identified via field probing and remote sensing techniques. In small-scale studies, isotope tracing techniques can be used to identify plant water sources [15], however, there are also disadvantages such as high costs and tracing and interpretation difficulties. A Moderate Resolution Imaging Spectroradiometer (MODIS) provides satellite data that can be used to distinguish GDEs from other ecosystems using remote sensing (RS). NDVI changes in vegetation pixels can be used to identify potential GDEs, such as in Texas, where vegetation characteristics were considered [16]. Multicriteria analysis was used to validate several studies, which combined remote sensing techniques, expert opinion, and field survey data, but the weights assigned to geographic parameters were too subjective [17]. At the same time, we are mindful of the interconnectedness between groundwater and surface water through vegetation. It is noteworthy that most previous studies have solely focused on vegetation changes while neglecting the vital role of groundwater in GDEs [18,19]. This is clearly not justified, therefore, we believe that developing a reliable GDEs framework and outlining it is crucial for the study of vegetation change and water cycles.
Many countries around the world have implemented conservation and management initiatives to curb GDE degradation. For example, Australia has established a detailed water management framework and set GDE management thresholds to help curb GDE degradation [10]. The rate of change in groundwater affects water uptake by plant roots, and GDEs change accordingly, therefore, capturing changes in groundwater is critical to identifying GDEs [20]. The Gravity Recovery and Climate Experiment (GRACE) gravity satellite that was launched in 2002 has provided a systematic approach to understanding groundwater storage [21]. This method, in contrast to traditional groundwater wells, allows the collection of groundwater information over large areas, thereby effectively reducing the cost of groundwater resource monitoring, which is widely used in estimating regional terrestrial water storage anomalies (TWSAs) and groundwater storage anomalies (GWSAs), such as in the Tarim River basin [22] and the North China Plain [23].
Approximately 8 months after the onset of meteorological drought, GRACE’s drought severity index (DSI) can accurately identify groundwater drought conditions on a monthly basis [24]. It can also determine how changes in the GRACE-based terrestrial water storage (TWS) parameter affect the GRACE-based drought severity index or DSI [25]. We believe that DSI can accurately capture changes in groundwater, therefore, used the drought severity index of groundwater (DSI-g) to describe groundwater droughts. By defining periods based on fluctuating changes in groundwater, it is possible to improve the accuracy of the spatial distribution of GDEs.
This study maps potential GDEs within the Loess zone to provide a reference for groundwater management in the region. In this study, we aimed to (1) map potential GDEs in the Loess zone, (2) examine whether the area of potential GDEs changes after large groundwater fluctuations, and (3) determine the causes of such changes.

2. Study Area and Data

2.1. Study Area

The study area is located in the Loess Plateau of China and extends from the Great Wall in the north to the Qinling Mountains in the south and from the Wulin Mountains in the west to the Taihang Mountains in the east (Figure 1). The Shanxi, the north–central Shaanxi, the central–eastern Gansu, the southern Ningxia, and the eastern Qinghai form part of the study area, covering a total area of 360,000 km2 and 45.4% of the Yellow River zone. The study area has a continental monsoon climate, with a decrease in temperature and precipitation from the southeast to the northwest. The average annual temperature is 8.45 °C. The temporal and spatial distribution of precipitation is characterized by its non-uniformity, with greater amounts in the summer and lesser amounts in the winter. In spatial terms, there is a gradual decrease in precipitation from southeast to northwest, forming a stepped pattern. The average annual precipitation ranges between 200 mm and 650 mm [26]. The loam soil type is ubiquitous in the study region and explains the significant erosion that is present in the study area. The main crops observed in the research area consist of winter wheat, millet, and peanuts. The forest predominantly exhibits exotic plants, such as locust trees, poplars, pines, and sea buckthorn, which collectively form dominant species groups. The vegetation tends to display relative homogeneity. The Loess zone is characterized by ecological fragility and significant soil erosion due to the lack of vegetation and specific soil characteristics. According to the simulation results of the Revised Universal Soil Loss Equation, it indicates that the erosion rate has significantly decreased by 54.3% from the 1970s to the 2000s. However, there was a noticeable increase in the erosion rate between 2010 and 2016 [27]. Long-term irrational land use has also disrupted the natural ground cover and affected the soil water infiltration capacity, further affecting the water cycle of the Loess Plateau.

2.2. Dates

2.2.1. GRACE and the Global Land Data Assimilation System (GLDAS)

GRACE satellite data were obtained from the German Research Centre (GFZ; http://isdc.gfz-potsdam.de/grace-isdc/ (accessed on 2 December 2021)) and the Centre for Space Research (CSR; http://www2.csr.utexas.edu/grace/ (accessed on 2 December 2021)). The data version Level-2 RL06, with a spatial resolution of 0.25° × 0.25° covers the period from the launch of the GRACE satellite to December 2021, which was used in this study. The GRACE data values obtained from GFZ and CSR were averaged and processed, and the least-squares interpolation method was used to estimate the missing values. To address the GRACE satellite’s inability to track the center of mass of the earth, the GRACE data values were averaged and processed to replace the original data with C20 terms obtained from Satellite Laser Ranging (SLR) [28]. Gaussian smoothing and filters with a radius of 300 km were used to remove the north–south band error and weaken the weight of the higher spherical harmonic coefficient [29,30]. The monthly groundwater table data from 57 monitoring wells were collected from the China Groundwater Table Yearbook for the Loess zone (2005–2018) (Figure 1c).
The land surface data were obtained from the Global Land Data Assimilation System (GLDAS), specifically GLDAS_Noah V2.1 (http://disc.sci.gsfc.nasa.gov (accessed on 2 December 2021)). These data, with a spatial resolution of 0.25° × 0.25°, were downloaded to obtain long-term hydrological processing data for the study area. The selected output data consisted of soil moisture (SM), canopy water storage (CWS), and surface runoff (QS) data with a monthly scale and spatial resolution of 0.25° × 0.25°from the March 2002–December 2021 period. The SM data were derived from four layers of the 0–200 cm soil profile, they include 0–10 cm, 10–40 cm, 40–100 cm, 100–200 cm.

2.2.2. Remote Sensing Data

The Enhanced Vegetation Index (EVI) data were obtained from the MODIS product MOD13A2 (https://lpdaac.usgs.gov/products/mod13a2v006 (accessed on 8 December 2021)). This dataset is synthesized every 16 days at a spatial resolution of 1 km, which we collate into monthly datasets using the maximum synthetic value method. Next, we extracted data from 2002 to 2021, while values less than 0.1 in EVI were removed to exclude non-vegetation elements such as sand and gravel.
Land cover data included from Huang Xin’s 30 m resolution China Land Cover Dataset (CLCD), with selected images from 2020 [31]. The overall accuracy of CLCD data was 79.31 percent, based on 5463 samples that were visually interpreted. Further analysis based on 5131 third-party test samples revealed the CLCD data to be more accurate than MCD12Q1, ESACCI_LC, FROM_GLC, and GlobeLand30 data.
The long-term precipitation data used in this study was obtained from the Climate Hazards Group InfraRed Precipitation with Stations (CHIRPS) V 2.0, with a daily scale and spatial resolution of 0.05° × 0.05° (https://catalog.data.gov/dataset/chirps-version-2-0-precipitation-global-0-05a-monthly-1981-present (accessed on 8 December 2021)). The CHIRPS data is efficient in estimating global precipitation [32]. This dataset combines satellite imagery and in situ observations to provide gridded precipitation data daily. This study used the CHIRPS Version 2.0 dataset, organized it into a month-based, 1000 m accuracy dataset and extracted data from 2002– to 2021.
TerraClimate’s evapotranspiration (ET) dataset, which was used in this study, was produced by the University of California Merced Climatology Lab (www.climatologylab.org/ (accessed on 10 December 2021)), this dataset includes monthly climate and climate water balance data for the global land surface. This dataset has a 1/24th degree spatial resolution and a monthly temporal resolution. According to the above data, the time resolution is consistent.
The drought index data were derived from the self-calibrating Palmer Drought Severity Index (scPDSI) from the University of East Anglia’s Climatic Research Unit (CRU) [33]. Using monthly data on scPDSI for the Loess zone from 2002 to 2021, we calculated the wettest and driest years in the region based on the annual mean value of scPDSI and the number of dry months.

2.3. Methods

2.3.1. Groundwater Calculation

The TWS includes the QS, SM, glacial snow, CWS, and vertical groundwater direction parameters. After deriving the distance level values, the SM, CWS, and QS were separated from the GLDAS product to obtain GWSA from TWSA, using the following equation [34]:
GWSA = TWSA SMA C W S A Q S A
where GWSA is the groundwater storage anomaly, TWSA is the terrestrial water storage anomaly, SMA is the soil moisture anomaly, CWSA is the canopy water storage anomaly, and QSA is the surface runoff anomaly. The units of these variables are mm.
In order to obtain the distance flat value of the data, in each month of the study period, the mean values of groundwater storage ( GWS ), terrestrial water storage ( TWS ), S M , C W S , and Q S were subtracted from the data to derive G W S A , TWSA , SMA , C W S A , and Q S A , respectively. This study did not consider the glacial snow accumulation, as snow accumulation in the study area was negligible. The GRACE-based drought index can be used to describe drought phenomenon since it is consistent with the Palmer drought severity index (PDSI) and the standardized precipitation evapotranspiration index (SPEI) [24,25]. Using monthly changes in the GWSA, we calculated the GRACE-based DSI from the GWSA data derived from the GRACE and GLDAS products, according to the following formula [25]:
D S I i , j - g = G W S A i , j G W S A j ¯ σ j
where i is the year ranging from 2002 to 2021; j is the month range of the year; G W S A j ¯ and σ j are the mean and standard deviation of the groundwater storage anomalies for the month.

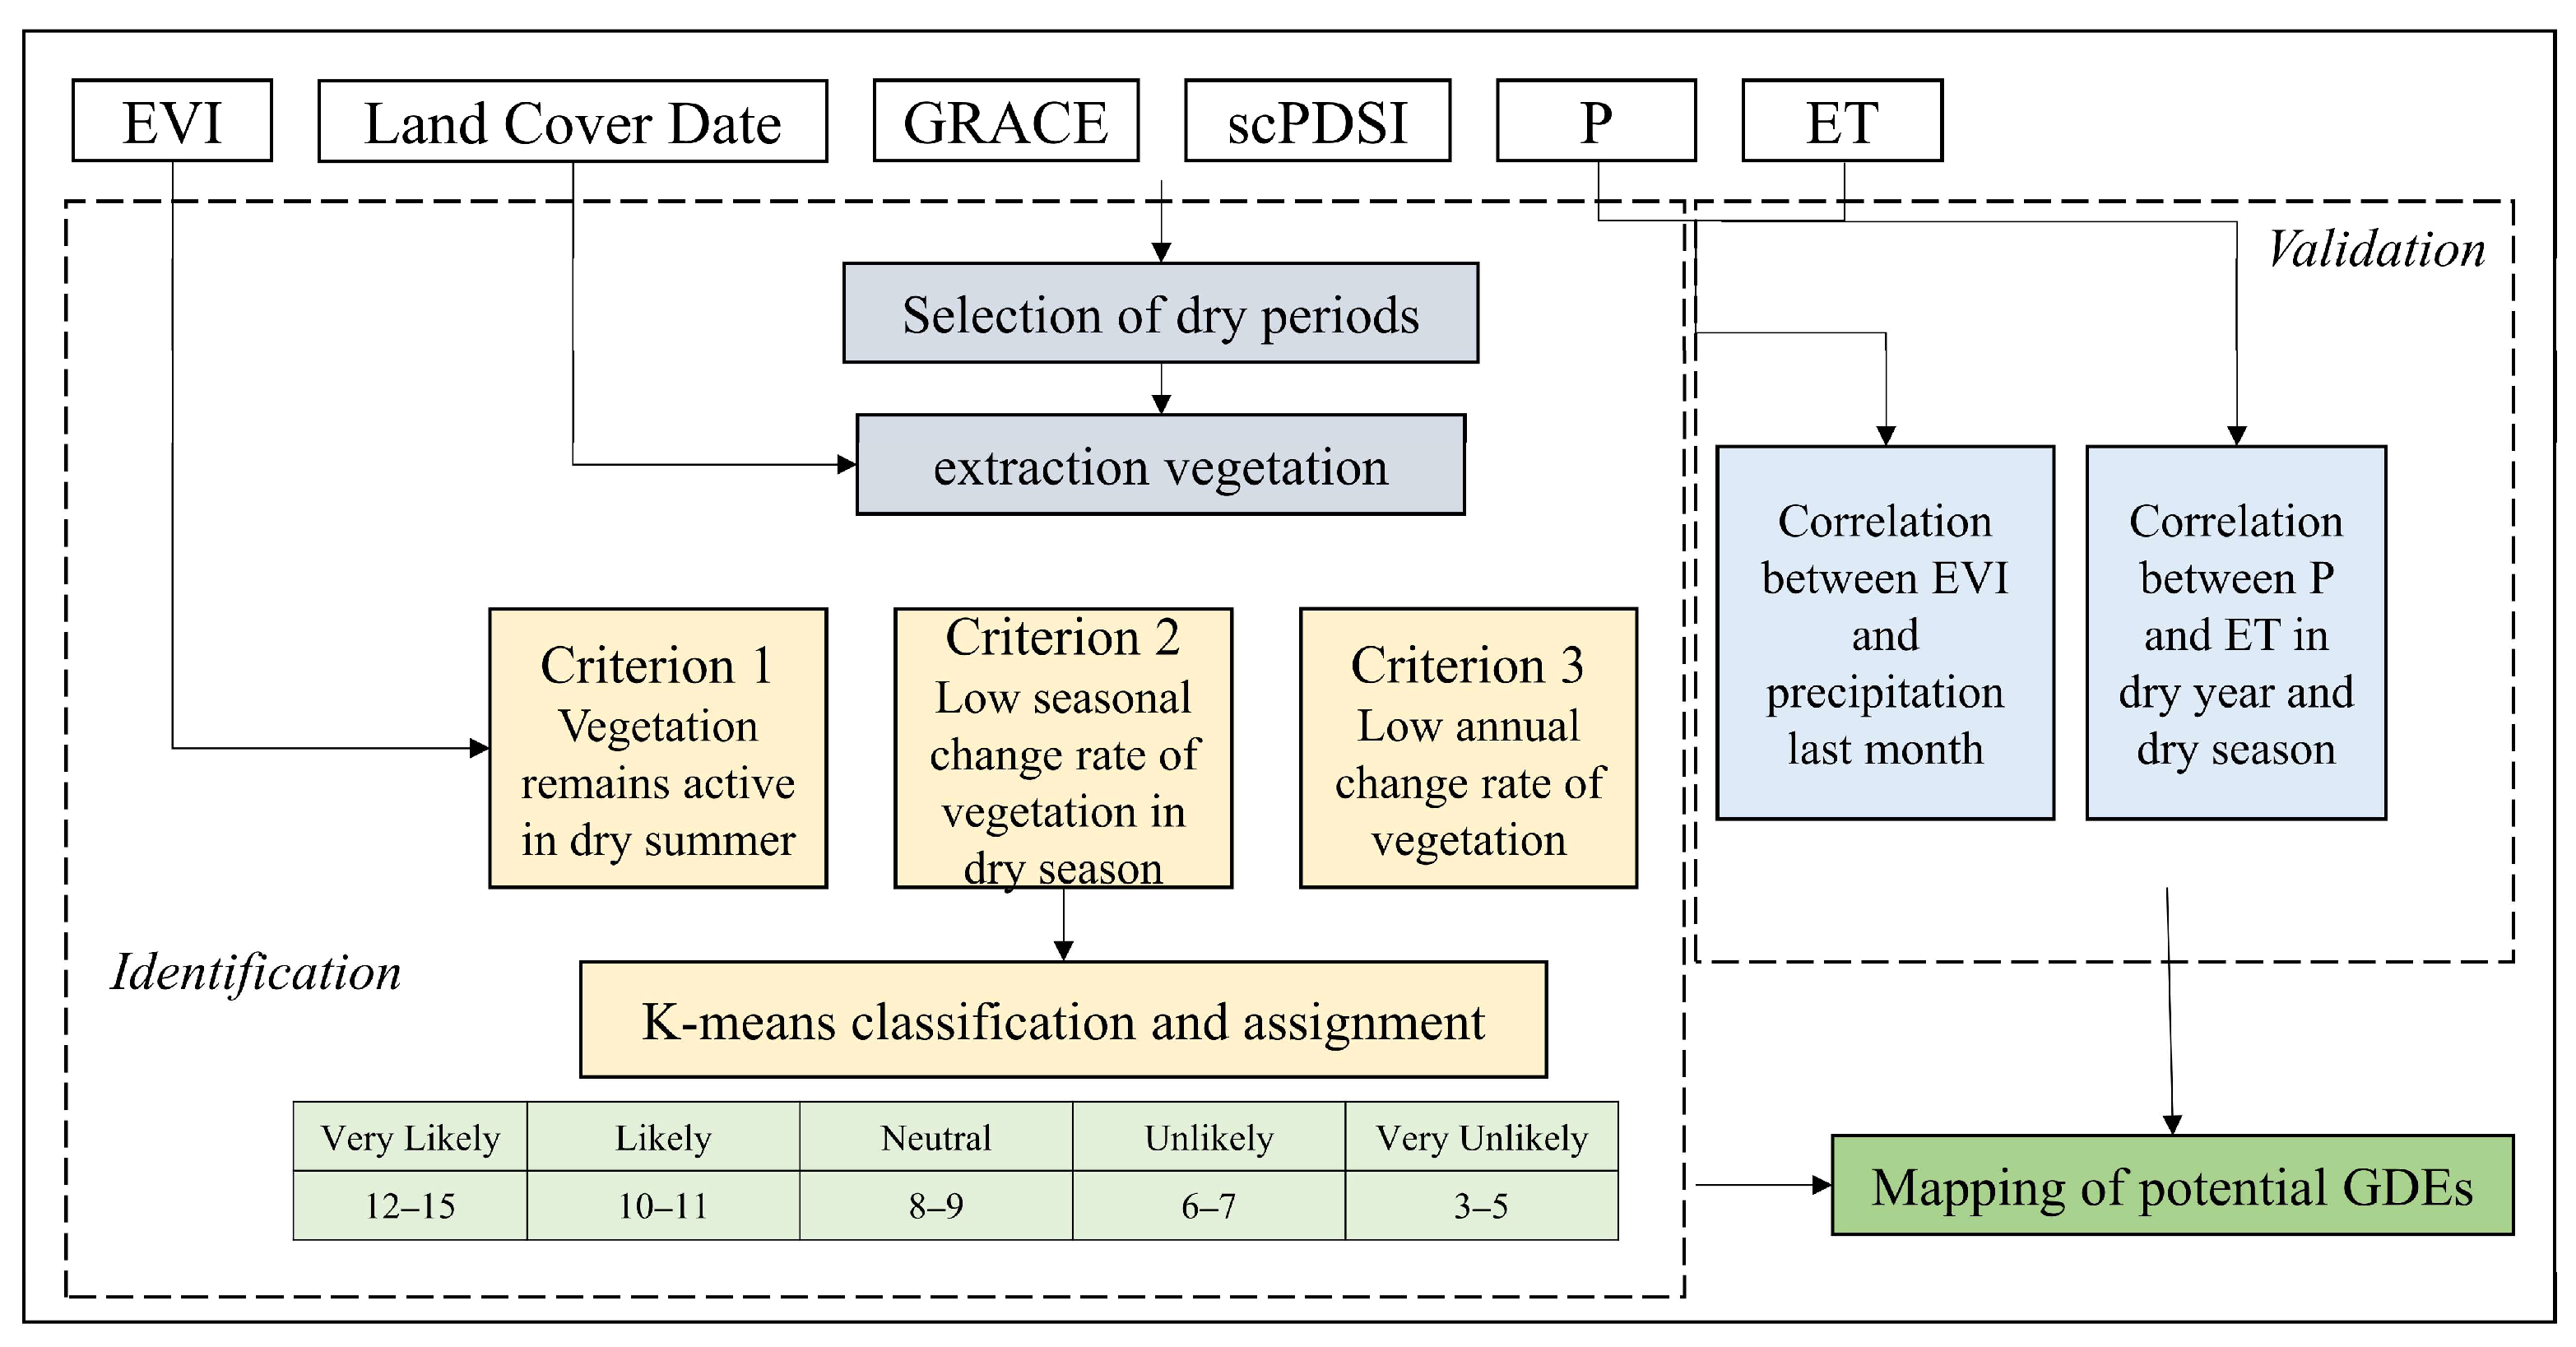
2.3.2. Identification and Validation of GDEs

The data were collected and the study steps were executed as shown in Figure 2. We determined the drought years and the wet years for 2002–2014 and 2015–2021 based on the average annual scPDSI for 2002–2021 and the number of dry months in a year, for 2006, 2019, and 2012, 2018, respectively. The method was used to map the GDE [16]. This method is based on three criteria: first, the plants remain physiologically active during the dry summer, and therefore we compared the changes in the EVI between the summer of the driest and the summer of the wettest year, with areas with smaller changes using groundwater more frequently [35]. The second and third criteria refer to plants that utilize groundwater as their primary source of water and exhibit less seasonal and interannual variations in their activity [36,37]. The standard deviation of the EVI for the entire year of the driest year was used to determine the second criterion, while the standard deviation of the EVI for the month of July during the study period was used to determine third criterion.
The results were categorized into five categories based on the K-means classification for each criterion. Those with the greatest EVI differences and standard deviations were considered to be very unlikely associated with groundwater, and those with the smallest EVI differences and standard deviations were considered to be most likely associated with groundwater. We assigned values to each criterion individually, resulting in five results with values ranging from 3 to 15, with the very likely class (12 to 15), the likely class (10 to 11), the neutral class (8 to 9), the unlikely class (6 to 7), and the very unlikely class (3 to 5).
We calculated the correlation between the EVI and the previous month’s precipitation in the driest year, with vegetation responding a little later to precipitation [38], taking into account the slight delay in vegetation response to precipitation. Based on this result, the less positive and negative correlation between EVI and last month’s precipitation indicates the characteristic features of GDEs in this region. According to the water balance principle, if a vegetation area has a transpiration rate that exceeds its precipitation, it has other sources of water in addition to precipitation [39] and is considered to be a GDE. This provides further support for classifying this area as a GDE.

3. Result

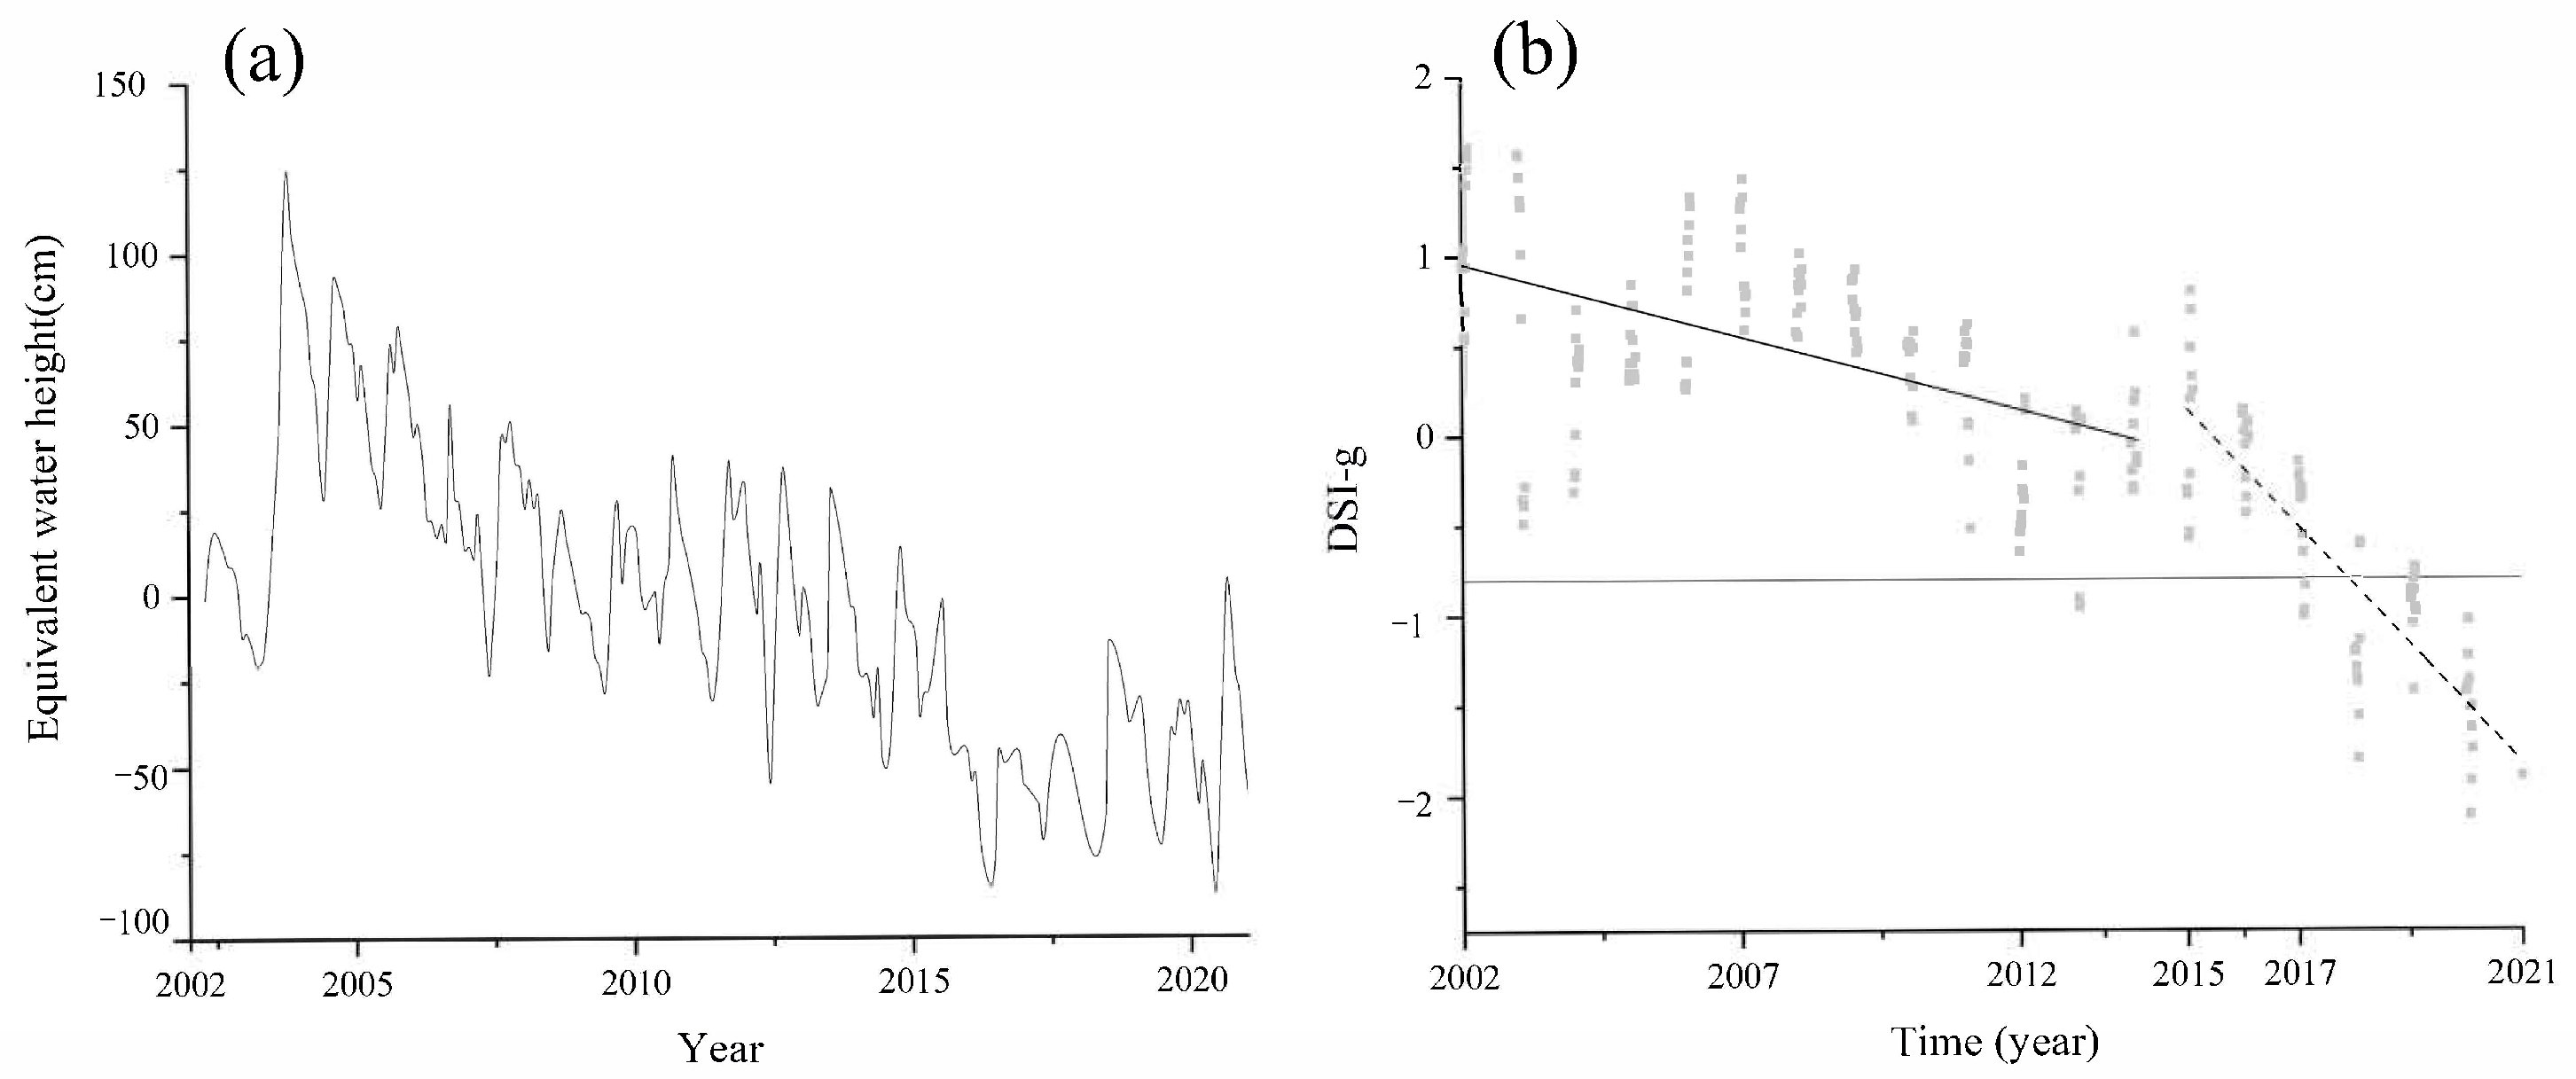
3.1. Delineation of the Drought Period

The GRACE satellite measurements of the terrestrial water reserves were converted into equivalent water column heights (Figure 3a). A decrease in the equivalent water heights has been observed from 2002 to 2021, with almost all of the equivalent water height distance levels having been below 0 since 2015. This indicates that terrestrial water supplies are being depleted at an accelerated pace. To obtain a scatter plot of the groundwater drought index (Figure 3b), we normalized the groundwater storage to more accurately divide the time periods of GDEs. The DSI-g is divided into two time periods, 2002–2014 and 2015–2021. During the first phase, the DSI-g declined relatively slowly, but during the second phase, it decreased more rapidly. After 2017, values of DSI-g below −0.8 indicated a severe drought in groundwater. Our study demonstrates that the trends of in situ observed groundwater levels agree well with the DSI-g in Loess areas and that DSI-g is more accurate at describing groundwater changes [40,41]. Based on the results, we divided the study period into two time periods to study GDEs, namely 2002–2014 and 2015–2021. According to in-situ observations, the average groundwater table showed a similar trend to DSI-g from 2005 to 2018 (Figure 4), with a correlation over 0.5 (p < 0.01).

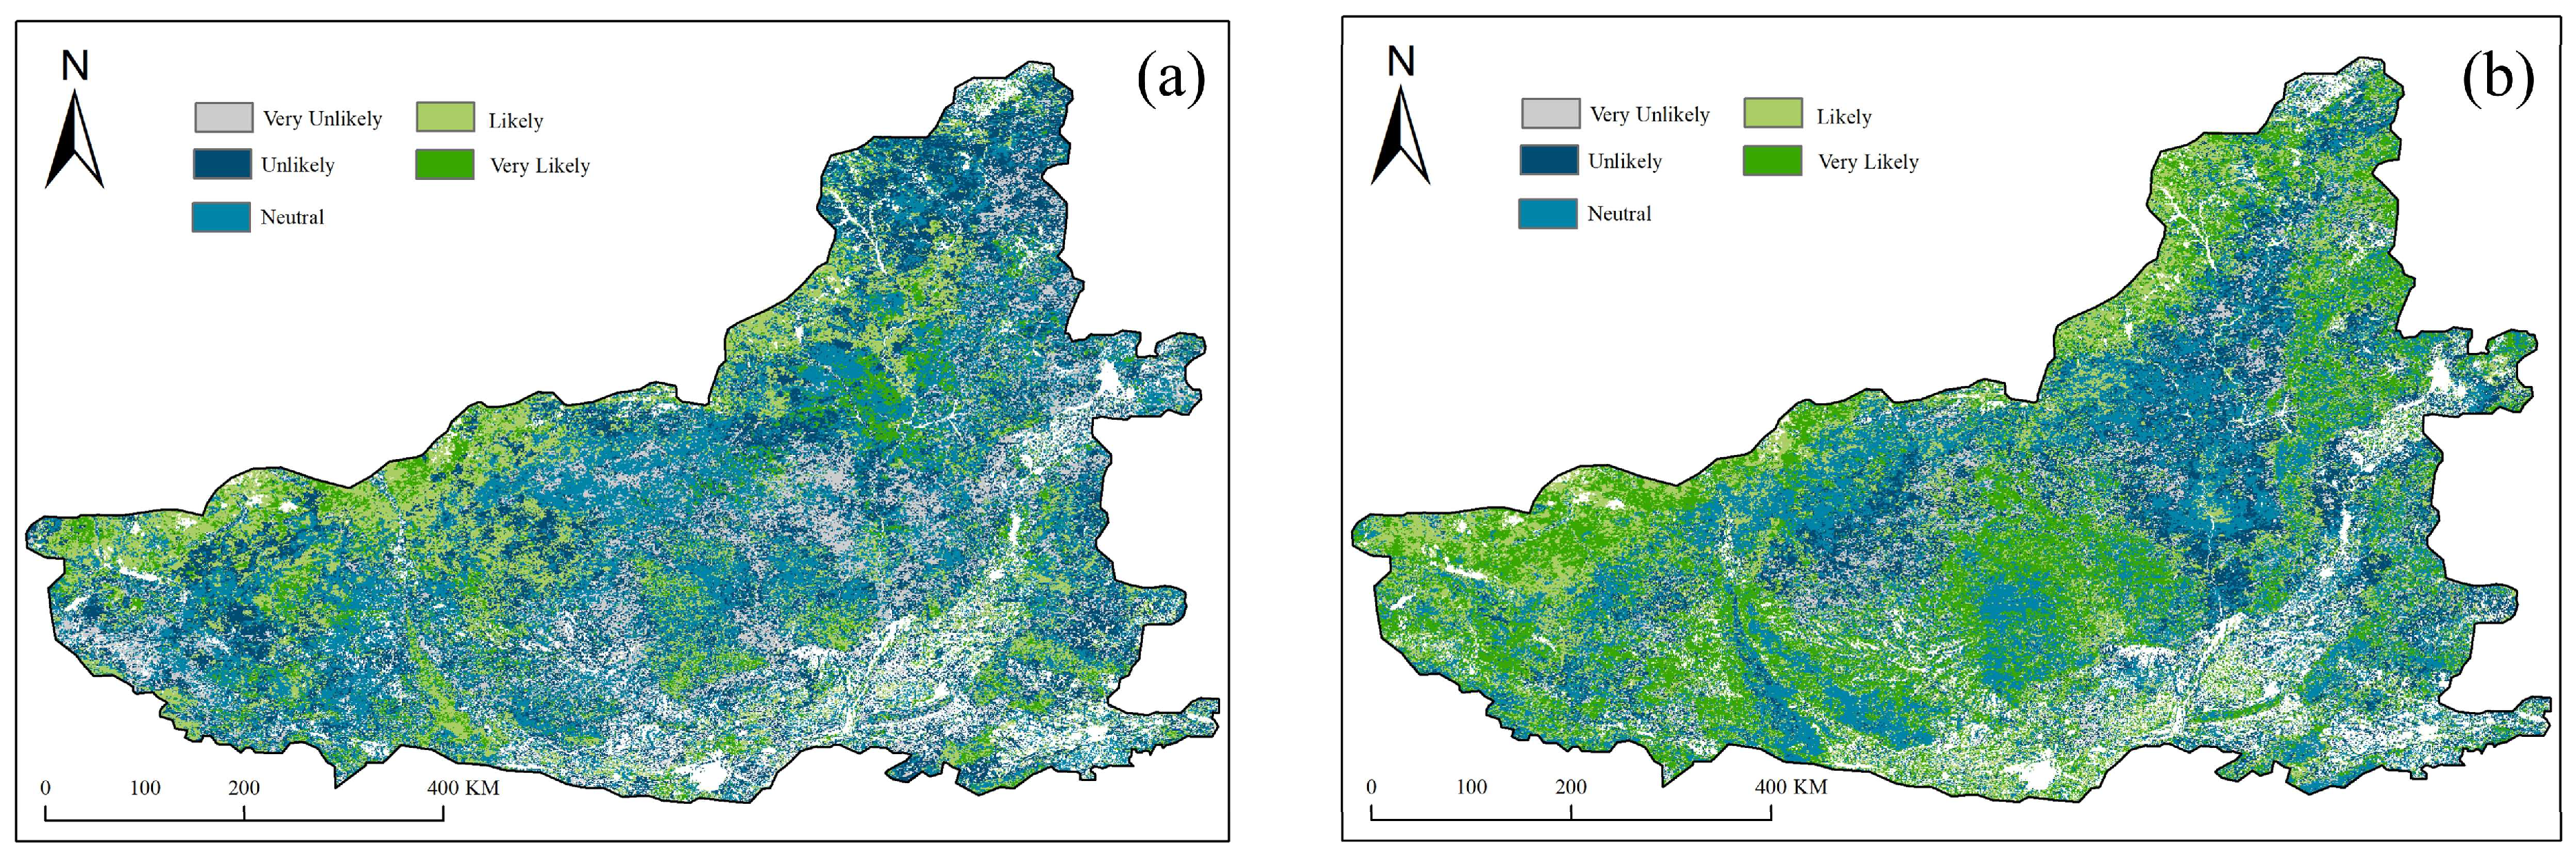
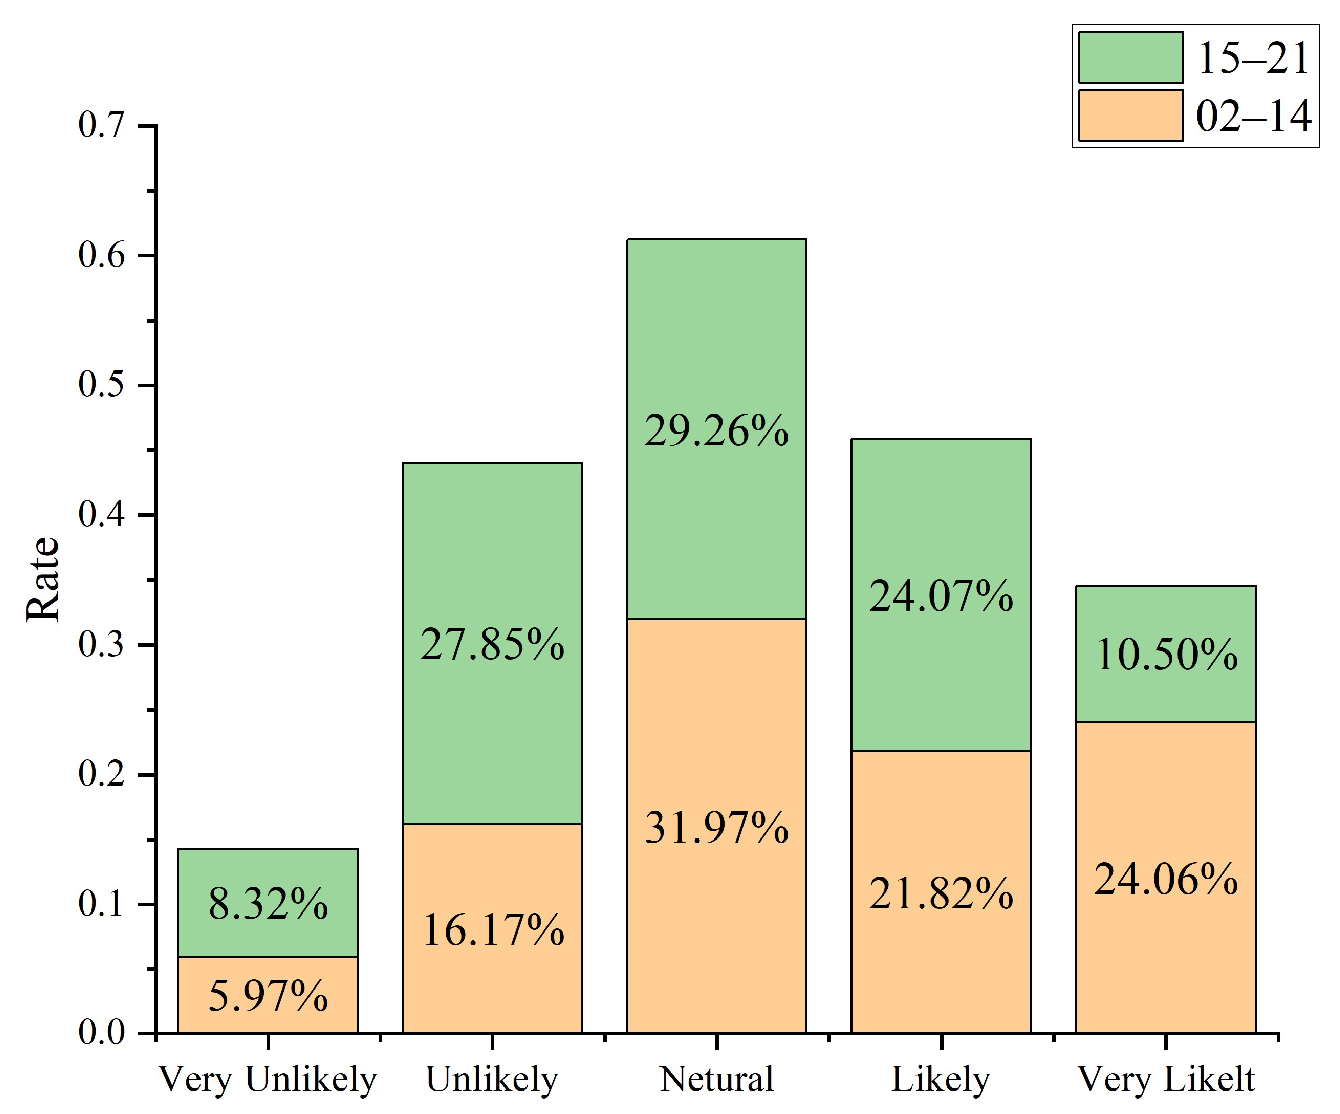
3.2. Identification of Potential GDE Regions

Figure 5 illustrates some areas in the Loess zone that may be GDEs. Figure 5a shows that the neutral group occupies the highest percentage of the area at 29.26% and that the very unlikely group occupies the lowest proportion of the area at 8.32%. The unlikely, likely, and very likely groups account for 27.85%, 24.07%, and 10.50%, respectively. The GDEs are mainly concentrated in southern Gansu, southern Ningxia, and northern Shaanxi. Grasslands are the predominant vegetation type in these areas (Figure 1b). In arid grasslands, the root systems are primarily concentrated within the 0–30 cm range, a study investigating how grassland roots respond to climate change suggests that grasses cope with drought by increasing their belowground biomass relative to aboveground biomass [42,43]. And this study opens up the possibility of groundwater utilization by grass roots. There are scattered neutral and unlikely GDE areas in the Loess region, and it is difficult to discern a regional pattern.
For the subperiod 2002–2014, there is a higher proportion of the total area in the neutral, very likely, and likely groups, respectively, at 31.97%, 24.06%, and 21.82%, with the very unlikely group having the lowest proportion at only 5.97% (Figure 6). There is a relatively wider distribution of the possible and very likely groups in Figure 5b compared to Figure 5a. In Figure 5b it can be seen that the possible and very likely groups are more widely distributed compared to Figure 5a. Apart from the potential GDEs areas in Figure 5a, potential GDEs areas also appear in the central and eastern parts of the Loess zone, such as the Ziwu Ridge. Despite the thick soil layers in these areas, plants can still access groundwater. A study indicates that the primary roots of shrubs in the Loess Plateau, such as Caragana korshinskii, have reached depths exceeding 10 m [44]. Fewer areas support potential GDEs in the core silvicultural areas of the Loess zone. Neutral areas are likely to be located near the forest floor and are unlikely to be fragmented on a regional basis.
Upon comparing Figure 5a,b, we observe that during the period 2002–2014, the combined area of the likely and very likely groups amounts to 45.88%. However, it decreased by 11.31% during 2015–2021. We also note that the vanished areas predominantly featured the cultivation of trees. This reduction is attributed to groundwater depletion, coupled with the age of vegetation, as old-aged vegetation with insufficient groundwater utilization hinder water recycling [45].

3.3. Validation of Potential GDEs

The sub-period 2002–2014 has been used as an example to verify the accuracy of the potential GDEs. The EVI and the previous month’s precipitation were correlated negatively in 2006 (Figure 7a), which is the driest year within the sub-period, with more than half of the area showing a negative correlation. There is a negative correlation between the EVI and the previous month’s P at the intersection of hilly gullies, river valley plains, and plateau gullies. These areas are also considered to be more likely to have GDEs. Those areas with stronger positive correlations are primarily located near the intersection of Ningxia, Shaanxi, and Gansu provinces. This suggests that the EVI increases with precipitation and that the grouping of GDEs is largely neutral and unlikely in these regions. As the likelihood of GDEs zonation decreases, the average correlation increases progressively (Figure 7b), with more of the very likely group focusing on negative correlations and relatively low correlations in the likely group. The areas identified as potential GDEs therefore primarily depend more on groundwater and less on precipitation.
The water balance principle was used to verify the reliability of the GDEs’ results (Figure 8). Our calculations of the difference between evapotranspiration and precipitation in dry years indicate that areas with a greater difference between evapotranspiration (ET) and precipitation are less dependent on precipitation (P). This means that plants are more likely to use groundwater in these areas. The difference between the ET and the P in the Loess zone is greater in the east and lower in the west. More than half of the area in Figure 8a is positive, indicating a strong ET in the region. This difference is the greatest in the southeastern part of the Loess zone. The area where P is greater than ET is primarily concentrated at the border between the Gansu and Shaanxi provinces. The very likely and likely groups of potential GDEs have a higher mean ET, suggesting that the high ET within this group may be related to groundwater support (Figure 8b).

4. Discussion

4.1. Changes in the Potential GDEs in the Loess Areas

There is no apparent regularity in the distribution of GDE between the two sub-periods (2002–2014 and 2015–2021) in this study. The GDEs are also detected in the deeper loess hills and gullies, as shown in Figure 5, where the relationship between the groundwater level and the NDVI is uneven in the Loess hills [46]. In some cases, the GDEs have been found in areas where the water table reaches a depth of approximately 20 m [47,48], as well as in Loess areas, where the soil layer is thicker with an average thickness of over 50 m and a maximum depth of more than 100 m. Our results indicate that GDEs are still present in these areas, so this result is considered plausible. This phenomenon occurs as a result of plants adapting to their environment, a study of 0–21 m root systems of acacias in Loess areas found that the deep soil root system’s foraging strategy is to increase its root length rather than its diameter to obtain water resources at a lower carbon cost [49], causing the water use characteristics of loess shrubs to be highly ecologically plastic in that they can flexibly respond to drought events by switching water sources and extending their primary roots to survive [44,50]. Because of the thicker soil layers and the greater variability of plant root systems in the region, there is no clear regularity in the spatial distribution of GDEs.
The proportion and location of the components of the GDE changed considerably over the two sub-periods (Figure 5). Local policy is a factor that is hard to ignore, large portions of sloping arable land in the Loess Plateau have been converted into woodland and grassland since the implementation of the policy of returning farmland to the forest in 1999, and vegetation conditions have changed considerably, with the rate of vegetation growth being the main factor influencing groundwater depletion on the Loess Plateau [41]. At the same time, large-scale vegetation changes have caused alterations in the water cycle. The mean NDVI value of the Loess Plateau has increased significantly since 1999, from 0.478 to 0.51 in terms of vegetation cover. Although precipitation has increased at a rate of 5.16 mm/a across the region due to changes in vegetation [51], the annual potential evapotranspiration of the Loess Plateau has consistently been greater than 1000 mm. The annual evapotranspiration in the region is increasing, with a growth rate of 1.40 mm/a [26], while the average annual SPEI values decreased [52], and the groundwater level continued to decline. As a result, the regional wet and dry patterns have changed, specifically, the area of the very likely group has decreased by 13.56 percent from 2015–2021, while the area of the unlikely group has increased by 11.68 percent compared to the sub-period of 2002–2014. The annual trend in groundwater changes over the two sub-periods indicates that the fastest rate of the decline occurred in the southern part of the Loess zone from 2015–2021 (Figure 9). This is consistent with the shift from the very likely group to the likely or neutral group in the southern part of the Loess zone (Figure 5a). Here, the magnitude and duration of groundwater fluctuations determine the extent of their impact on the GDEs [53]. As the groundwater level changes, the vegetation in these areas adjusts its root distribution and function. This adjustment is, however, limited, with rapidly declining groundwater levels preventing the root systems from adapting, which reduces productivity [20,54].
Climate change and human activities have varying effects on GDEs, with larger ecosystems being more stable and resilient. Apart from climate change and human activities, many other factors contribute to the shift in GDEs that was observed over the two sub-periods [55,56], Changes in abiotic conditions, such as land use change, can affect ecosystems more rapidly and can even offset the effects of climate change [57]. Climate change and human activities have been confirmed to contribute to the degradation of vegetation in the Nalenggele alluvial fan in NW China. This region depends entirely on groundwater for vegetation growth. If the exploitation of water resources continues without any intervention, it is anticipated that the groundwater ecological water levels will shrink by 78% in 2020 [58]. In the Loess zone, we also find that the combined area of the likely and very likely group amounts is decreasing, therefore, it is necessary to grasp the changes in GDEs, rationally utilize the resilience of ecosystems, and develop appropriate measures to maintain the balance of the water cycle.

4.2. Uncertainty Analysis of GDEs

The EVI is positively correlated with the precipitation in the eastern parts of the Gansu Province (Figure 7a). Here, vegetation growth in some areas is not entirely dependent on groundwater, yet our results suggest the likelihood of a grouping in these areas and that the presence of GDEs is greater. Although herbaceous plants have short root systems [59], the soils in this area are relatively thin and contain widespread grasslands. Numerous studies have demonstrated that herbaceous plants not only absorb groundwater but that groundwater levels also profoundly influence the diversity and distribution of herbaceous plants [60,61]. Our mapped GDEs, therefore, remain credible.
Our study artificially delineated two periods, but the effects of groundwater–ecosystem interactions may take longer [14]. On the one hand, complex groundwater movements may be influenced by current particularly striking dramatic climate change effects [62,63]; on the other hand, it has been shown that the stability of GDEs is related to many species that are less able to adapt to environmental change. This means that in some areas, minor groundwater fluctuations can result in the death of such species [64,65]. Therefore, longer time scales and more species information may be needed to obtain GDE more accurately.
Remote sensing is the most commonly used method for identifying GDEs at the regional scale [35,47]. This method of identifying GDEs was first proposed by Guo et al. (2015), and the identification criteria developed through vegetation change have been validated for reliability. However, we also note that this approach to studying vegetation does not address groundwater changes, and our study examines the dynamics of GDEs based on groundwater changes, increasing the accuracy of GDEs identification. In situ observation data are the most reliable method to validate GDEs. However, it is challenging to acquire hydrological data over long time scales. We, therefore, adopted a combination of methods to verify the reliability of the GDEs. The accuracy of GDEs can often be verified by examining the groundwater levels based on the plant rooting depths [36]. Some studies have shown that groundwater levels in most areas of the Loess zone exceeded 20 m [66]. However, this is not the limiting factor for vegetation to access groundwater. In certain extreme environments, vegetation roots can reach depths of several tens of meters [67], suggesting the potential for Loess zone vegetation to utilize deep groundwater through capillary rise. Whether vegetation utilize groundwater directly or indirectly remains to be further researched.
Lastly, spatial and temporal resolution may also affect the results. We used the CLCD2020 land use dataset from Huang Xin, Wuhan University in our study. This method of extracting vegetation, however, has some limitations. It does not adequately represent the vegetation changes since 2002, which may reduce the accuracy of our classification. During identifying the GDEs, we only considered drought periods and did not take into account temperature changes on vegetation growth [68], since the high-temperature periods and drought periods do not overlap in the Loess areas. We could only identify GDEs by using the drought index.

5. Conclusions

It is essential to know the distribution location of GDEs to ensure sustainable groundwater development. This study is the first to combine GRACE data with the mapping of GDEs, based on the groundwater changes detected by the GRACE satellite, this study divides the period from 2002 to 2021 into two sub-periods. A method for identifying GDEs was developed based on three vegetation change criteria. This method was validated through satellite data so that changes in the water levels of the GDEs during the two sub-periods could be studied. The groundwater changes in the Loess zone for the period of 2002–2021 were divided into two sub-periods: 2002–2014 and 2015–2021, with groundwater levels declining more rapidly after 2015. There is no obvious spatial regularity in the distribution of GDEs in the Loess area, but the proportion and location of the components of the GDE changed considerably over the two sub-periods. The results showed that the area of GDEs in the Loess zone decreased by 13.56% in the GDEs very likely group, increased by 11.68% in the GDEs unlikely group, and did not change much in the GDEs neutral, GDEs likely, and GDEs very unlikely groups, when compared with the 2002–2014 period. The distribution of the GDEs is validated by remote sensing.
However, we have not yet been able to quantify the groundwater consumed by vegetation in the GDE areas, and we are still unable to determine the differences in groundwater consumption by different plant species, the applicability of the methods for drawing GDEs to any place worldwide is still to be explored. To obtain answers to these questions, all of the factors that we determined, must be combined with field surveys and should be investigated in greater detail. The conservation and management of GDEs is an important ecological goal in many countries, including Australia, the European Union, the United States, and South Africa, while GDE exploration and protection remain in their infancy in China. The identification of GDEs in Loess areas provides a research basis for ensuring sustainable groundwater management, which will increase the value of ecosystem services.

Author Contributions

Conceptualization, H.L. and Y.Q.; Methodology, D.W.; Resources, X.Y. and H.L.; Writing—original draft, Y.Q. and X.Y.; Supervision, G.J. All authors have read and agreed to the published version of the manuscript.

Funding

This research was funded by National Natural Science Foundation of China-Yellow River Water Research Joint Fund Project (U2243202).

Data Availability Statement

The data presented in this study are available on request from the corresponding author.

Conflicts of Interest

The authors declare no conflict of interest.

References

  1. Mishra, A.K.; Singh, V.P. A Review of Drought Concepts. J. Hydrol. 2010, 391, 202–216. [Google Scholar] [CrossRef]
  2. Aeschbach-Hertig, W.; Gleeson, T. Regional Strategies for the Accelerating Global Problem of Groundwater Depletion. Nat. Geosci. 2012, 5, 853–861. [Google Scholar] [CrossRef]
  3. Famiglietti, J.S. The Global Groundwater Crisis. Nat. Clim. Change 2014, 4, 945–948. [Google Scholar] [CrossRef]
  4. Groves, D.G.; Molina-Perez, E.; Bloom, E.; Fischbach, J.R. Robust Decision Making (RDM): Application to Water Planning and Climate Policy. In Decision Making under Deep Uncertainty; Marchau, V.A.W.J., Walker, W.E., Bloemen, P.J.T.M., Popper, S.W., Eds.; Springer International Publishing: Cham, Switzerland, 2019; pp. 135–163. ISBN 978-3-030-05251-5. [Google Scholar]
  5. Kath, J.; Boulton, A.J.; Harrison, E.T.; Dyer, F.J. A Conceptual Framework for Ecological Responses to Groundwater Regime Alteration (FERGRA): Ecological Responses to Altered Groundwater Regimes. Ecohydrology 2018, 11, e2010. [Google Scholar] [CrossRef]
  6. Barlow, P.M.; Leake, S.A. Streamflow Depletion by Wells—Understanding and Managing the Effects of Groundwater Pumping on Streamflow; Circular; U.S. Geological Survey: Reston, VA, USA, 2012; Volume 1376, p. 95. [Google Scholar]
  7. Alley, W.M.; Leake, S.A. The Journey from Safe Yield to Sustainability. Groundwater 2004, 42, 12–16. [Google Scholar] [CrossRef] [PubMed]
  8. Rudestam, K.; Langridge, R. Sustainable Yield in Theory and Practice: Bridging Scientific and Mainstream Vernacular. Groundwater 2014, 52 (Suppl. S1), 90–99. [Google Scholar] [CrossRef] [PubMed]
  9. Gungle, B.; Callegary, J.; Paretti, N.; Kennedy, J.; Eastoe, C.; Turner, D.; Dickinson, J.; Levick, L.; Sugg, Z. Hydrological Conditions and Evaluation of Sustainable Groundwater Use in the Sierra Vista Subwatershed, Upper San Pedro Basin, Southeastern Arizona; U.S. Geological Survey: Reston, VA, USA, 2016. [Google Scholar]
  10. Rohde, M.M.; Froend, R.; Howard, J. A Global Synthesis of Managing Groundwater Dependent Ecosystems Under Sustainable Groundwater Policy. Groundwater 2017, 55, 293–301. [Google Scholar] [CrossRef] [PubMed]
  11. Griebler, C.; Avramov, M.; Hose, G. Groundwater Ecosystems and Their Services: Current Status and Potential Risks. In Atlas of Ecosystem Services: Drivers, Risks, and Societal Responses; Schröter, M., Bonn, A., Klotz, S., Seppelt, R., Baessler, C., Eds.; Springer International Publishing: Cham, Switzerland, 2019; pp. 197–203. ISBN 978-3-319-96229-0. [Google Scholar]
  12. Aldous, A.; Bach, L. Protecting Groundwater- Dependent Ecosystems: Gaps and Opportunities. Natl. Wetl. Newsl. 2011, 33, 19–22. [Google Scholar]
  13. Kløve, B.; Ala-aho, P.; Bertrand, G.; Boukalova, Z.; Ertürk, A.; Goldscheider, N.; Ilmonen, J.; Karakaya, N.; Kupfersberger, H.; Kvœrner, J.; et al. Groundwater Dependent Ecosystems. Part I: Hydroecological Status and Trends. Environ. Sci. Policy 2011, 14, 770–781. [Google Scholar] [CrossRef]
  14. Murray, B.R.; Hose, G.C.; Eamus, D.; Licari, D. Valuation of Groundwater-Dependent Ecosystems: A Functional Methodology Incorporating Ecosystem Services. Aust. J. Bot. 2006, 54, 221–229. [Google Scholar] [CrossRef]
  15. Orellana, F.; Verma, P.; Loheide, S.P., II; Daly, E. Monitoring and Modeling Water-Vegetation Interactions in Groundwater-Dependent Ecosystems. Rev. Geophys. 2012, 50. [Google Scholar] [CrossRef]
  16. Gou, S.; Gonzales, S.; Miller, G.R. Mapping Potential Groundwater-Dependent Ecosystems for Sustainable Management. Groundwater 2015, 53, 99–110. [Google Scholar] [CrossRef] [PubMed]
  17. Duran-Llacer, I.; Arumí, J.L.; Arriagada, L.; Aguayo, M.; Rojas, O.; González-Rodríguez, L.; Rodríguez-López, L.; Martínez-Retureta, R.; Oyarzún, R.; Singh, S.K. A New Method to Map Groundwater-Dependent Ecosystem Zones in Semi-Arid Environments: A Case Study in Chile. Sci. Total Environ. 2022, 816, 151528. [Google Scholar] [CrossRef] [PubMed]
  18. He, P.; Xu, L.; Liu, Z.; Jing, Y.; Zhu, W. Dynamics of NDVI and Its Influencing Factors in the Chinese Loess Plateau during 2002–2018. Reg. Sustain. 2021, 2, 36–46. [Google Scholar] [CrossRef]
  19. Feng, X.; Fu, B.; Piao, S.; Wang, S.; Ciais, P.; Zeng, Z.; Lü, Y.; Zeng, Y.; Li, Y.; Jiang, X.; et al. Revegetation in China’s Loess Plateau Is Approaching Sustainable Water Resource Limits. Nat. Clim. Change 2016, 6, 1019–1022. [Google Scholar] [CrossRef]
  20. Canham, C.A.; Froend, R.H.; Stock, W.D. Rapid Root Elongation by Phreatophyte Seedlings Does Not Imply Tolerance of Water Table Decline. Trees 2015, 29, 815–824. [Google Scholar] [CrossRef]
  21. Tapley, B.D.; Bettadpur, S.; Watkins, M.; Reigber, C. The Gravity Recovery and Climate Experiment: Mission Overview and Early Results. Geophys. Res. Lett. 2004, 31, L09607. [Google Scholar] [CrossRef]
  22. Yang, F.; Feng, Z.; Wang, H.; Dai, X.; Fu, X. Deep Soil Water Extraction Helps to Drought Avoidance but Shallow Soil Water Uptake during Dry Season Controls the Inter-Annual Variation in Tree Growth in Four Subtropical Plantations. Agric. For. Meteorol. 2017, 234–235, 106–114. [Google Scholar] [CrossRef]
  23. Feng, W.; Zhong, M.; Lemoine, J.-M.; Biancale, R.; Hsu, H.-T.; Xia, J. Evaluation of Groundwater Depletion in North China Using the Gravity Recovery and Climate Experiment (GRACE) Data and Ground-Based Measurements. Water Resour. Res. 2013, 49, 2110–2118. [Google Scholar] [CrossRef]
  24. Han, Z.; Huang, S.; Huang, Q.; Leng, G.; Wang, H.; Bai, Q.; Zhao, J.; Ma, L.; Wang, L.; Du, M. Propagation Dynamics from Meteorological to Groundwater Drought and Their Possible Influence Factors. J. Hydrol. 2019, 578, 124102. [Google Scholar] [CrossRef]
  25. Zhao, M.; Geruo, A.; Velicogna, I.; Kimball, J.S. A Global Gridded Dataset of GRACE Drought Severity Index for 2002–14: Comparison with PDSI and SPEI and a Case Study of the Australia Millennium Drought. J. Hydrometeorol. 2017, 18, 2117–2129. [Google Scholar] [CrossRef]
  26. Yang, Z.; Bai, P.; Li, Y. Quantifying the Effect of Vegetation Greening on Evapotranspiration and Its Components on the Loess Plateau. J. Hydrol. 2022, 613, 128446. [Google Scholar] [CrossRef]
  27. Li, P.; Chen, J.; Zhao, G.; Holden, J.; Liu, B.; Chan, F.K.S.; Hu, J.; Wu, P.; Mu, X. Determining the Drivers and Rates of Soil Erosion on the Loess Plateau since 1901. Sci. Total Environ. 2022, 823, 153674. [Google Scholar] [CrossRef] [PubMed]
  28. Chen, J.L.; Rodell, M.; Wilson, C.R.; Famiglietti, J.S. Low Degree Spherical Harmonic Influences on Gravity Recovery and Climate Experiment (GRACE) Water Storage Estimates: Low Degree Spherical Harmonic Influences. Geophys. Res. Lett. 2005, 32, L14405. [Google Scholar] [CrossRef]
  29. Swenson, S.; Wahr, J. Methods for Inferring Regional Surface-Mass Anomalies from Gravity Recovery and Climate Experiment (GRACE) Measurements of Time-Variable Gravity: Methods for Grace Surface Mass Recovery. J. Geophys. Res. 2002, 107, ETG 3-1–ETG 3-13 . [Google Scholar] [CrossRef]
  30. Swenson, S.; Wahr, J. Post-Processing Removal of Correlated Errors in GRACE Data. Geophys. Res. Lett. 2006, 33, L08402. [Google Scholar] [CrossRef]
  31. Yang, J.; Huang, X. The 30 m Annual Land Cover Dataset and Its Dynamics in China from 1990 to 2019. Earth Syst. Sci. Data 2021, 13, 3907–3925. [Google Scholar] [CrossRef]
  32. Prakash, S. Performance Assessment of CHIRPS, MSWEP, SM2RAIN-CCI, and TMPA Precipitation Products across India. J. Hydrol. 2019, 571, 50–59. [Google Scholar] [CrossRef]
  33. Van der Schrier, G.; Barichivich, J.; Briffa, K.R.; Jones, P.D. A scPDSI-Based Global Data Set of Dry and Wet Spells for 1901–2009. J. Geophys. Res. Atmos. 2013, 118, 4025–4048. [Google Scholar] [CrossRef]
  34. Zhang, B.; Wu, P.; Zhao, X.; Gao, X.; Shi, Y. Assessing the Spatial and Temporal Variation of the Rainwater Harvesting Potential (1971–2010) on the Chinese Loess Plateau Using the VIC Model. Hydrol. Process. 2014, 28, 534–544. [Google Scholar] [CrossRef]
  35. Barron, O.V.; Emelyanova, I.; Van Niel, T.G.; Pollock, D.; Hodgson, G. Mapping Groundwater-Dependent Ecosystems Using Remote Sensing Measures of Vegetation and Moisture Dynamics: Gdes Mapping Using Remote Measures of Vegetation/Moisture Dynamics. Hydrol. Process. 2014, 28, 372–385. [Google Scholar] [CrossRef]
  36. Eamus, D.; Froend, R.; Loomes, R.; Hose, G.; Murray, B. A Functional Methodology for Determining the Groundwater Regime Needed to Maintain the Health of Groundwater-Dependent Vegetation. Aust. J. Bot. 2006, 54, 97–114. [Google Scholar] [CrossRef]
  37. Tweed, S.O.; Leblanc, M.; Webb, J.A.; Lubczynski, M.W. Remote Sensing and GIS for Mapping Groundwater Recharge and Discharge Areas in Salinity Prone Catchments, Southeastern Australia. Hydrogeol. J 2007, 15, 75–96. [Google Scholar] [CrossRef]
  38. Lamchin, M.; Lee, W.-K.; Jeon, S.W.; Wang, S.W.; Lim, C.H.; Song, C.; Sung, M. Long-Term Trend and Correlation between Vegetation Greenness and Climate Variables in Asia Based on Satellite Data. Sci. Total Environ. 2018, 618, 1089–1095. [Google Scholar] [CrossRef] [PubMed]
  39. Eamus, D.; Fu, B.; Springer, A.E.; Stevens, L.E. Groundwater Dependent Ecosystems: Classification, Identification Techniques and Threats. In Integrated Groundwater Management; Jakeman, A.J., Barreteau, O., Hunt, R.J., Rinaudo, J.-D., Ross, A., Eds.; Springer International Publishing: Cham, Switzerland, 2016; pp. 313–346. ISBN 978-3-319-23575-2. [Google Scholar]
  40. Zhang, K.; Xie, X.; Zhu, B.; Meng, S.; Yao, Y. Unexpected Groundwater Recovery with Decreasing Agricultural Irrigation in the Yellow River Basin. Agric. Water Manag. 2019, 213, 858–867. [Google Scholar] [CrossRef]
  41. Han, Z.; Huang, S.; Huang, Q.; Bai, Q.; Leng, G.; Wang, H.; Zhao, J.; Wei, X.; Zheng, X. Effects of Vegetation Restoration on Groundwater Drought in the Loess Plateau, China. J. Hydrol. 2020, 591, 125566. [Google Scholar] [CrossRef]
  42. Liu, Y.; Cui, Z.; Huang, Z.; López-Vicente, M.; Wu, G.-L. Influence of Soil Moisture and Plant Roots on the Soil Infiltration Capacity at Different Stages in Arid Grasslands of China. CATENA 2019, 182, 104147. [Google Scholar] [CrossRef]
  43. Guasconi, D.; Manzoni, S.; Hugelius, G. Climate-Dependent Responses of Root and Shoot Biomass to Drought Duration and Intensity in Grasslands–a Meta-Analysis. Sci. Total Environ. 2023, 903, 166209. [Google Scholar] [CrossRef]
  44. Wang, Y.; Shao, M.; Zhu, Y.; Liu, Z. Impacts of Land Use and Plant Characteristics on Dried Soil Layers in Different Climatic Regions on the Loess Plateau of China. Agric. For. Meteorol. 2011, 151, 437–448. [Google Scholar] [CrossRef]
  45. Chen, G.; Wu, Q.; Wang, Y.; Zhao, Y.; Yu, H.; Lu, Y.; Feng, H.; Li, M.; Siddique, K.H.M. Deep Soil Water Use of Old-Aged Vegetation (17- to 36-Year Stand Age) after the Formation of Dried Soil Layers Based on in Situ Monitoring. J. Hydrol. Reg. Stud. 2023, 48, 101446. [Google Scholar] [CrossRef]
  46. Xu, W.; Kong, F.; Mao, R.; Song, J.; Sun, H.; Wu, Q.; Liang, D.; Bai, H. Identifying and Mapping Potential Groundwater-Dependent Ecosystems for a Semi-Arid and Semi-Humid Area in the Weihe River, China. J. Hydrol. 2022, 609, 127789. [Google Scholar] [CrossRef]
  47. Páscoa, P.; Gouveia, C.M.; Kurz-Besson, C. A Simple Method to Identify Potential Groundwater-Dependent Vegetation Using NDVI MODIS. Forests 2020, 11, 147. [Google Scholar] [CrossRef]
  48. Liu, C.; Liu, H.; Yu, Y.; Zhao, W.; Zhang, Z.; Guo, L.; Yetemen, O. Mapping Groundwater-Dependent Ecosystems in Arid Central Asia: Implications for Controlling Regional Land Degradation. Sci. Total Environ. 2021, 797, 149027. [Google Scholar] [CrossRef] [PubMed]
  49. Zhou, Z.; Wang, Y.; An, Z.; Li, R.; Xu, Y.; Zhang, P.; Yang, Y.; Wang, T. Deep Root Information “Hidden in the Dark”: A Case Study on the 21-m Soil Profile of Robinia Pseudoacacia in the Critical Zone of the Chinese Loess Plateau. CATENA 2022, 213, 106121. [Google Scholar] [CrossRef]
  50. Wang, J.; Fu, B.; Lu, N.; Wang, S.; Zhang, L. Water Use Characteristics of Native and Exotic Shrub Species in the Semi-Arid Loess Plateau Using an Isotope Technique. Agric. Ecosyst. Environ. 2019, 276, 55–63. [Google Scholar] [CrossRef]
  51. Zhang, H.; Zhang, L.L.; Li, J.; An, R.D.; Deng, Y. Monitoring the Spatiotemporal Terrestrial Water Storage Changes in the Yarlung Zangbo River Basin by Applying the P-LSA and EOF Methods to GRACE Data. Sci. Total Environ. 2020, 713, 136274. [Google Scholar] [CrossRef] [PubMed]
  52. Zhong, Y.; Zhong, M.; Feng, W.; Zhang, Z.; Shen, Y.; Wu, D. Groundwater Depletion in the West Liaohe River Basin, China and Its Implications Revealed by GRACE and In Situ Measurements. Remote Sens. 2018, 10, 493. [Google Scholar] [CrossRef]
  53. Shafroth, P.B.; Stromberg, J.C.; Patten, D.T. Woody Riparian Vegetation Response to Different Alluvial Water Table Regimes. West. N. Am. Nat. 2000, 60, 66–76. [Google Scholar]
  54. Canham, C.A.; Froend, R.H.; Stock, W.D.; Davies, M. Dynamics of Phreatophyte Root Growth Relative to a Seasonally Fluctuating Water Table in a Mediterranean-Type Environment. Oecologia 2012, 170, 909–916. [Google Scholar] [CrossRef] [PubMed]
  55. Jin, X.M.; Guo, R.H.; Zhang, Q.; Zhou, Y.X.; Zhang, D.R.; Yang, Z. Response of Vegetation Pattern to Different Landform and Water-Table Depth in Hailiutu River Basin, Northwestern China. Environ. Earth Sci 2014, 71, 4889–4898. [Google Scholar] [CrossRef]
  56. Fulin, L.I.; Huawei, C.; Kairan, W.; Xuequn, C. Comprehensive review of groundwater-dependent ecosystems. Adv. Water Sci. 2018, 29, 750–758. [Google Scholar] [CrossRef]
  57. Kløve, B.; Ala-Aho, P.; Bertrand, G.; Gurdak, J.J.; Kupfersberger, H.; Kværner, J.; Muotka, T.; Mykrä, H.; Preda, E.; Rossi, P.; et al. Climate Change Impacts on Groundwater and Dependent Ecosystems. J. Hydrol. 2014, 518, 250–266. [Google Scholar] [CrossRef]
  58. Xu, W.; Su, X. Challenges and Impacts of Climate Change and Human Activities on Groundwater-Dependent Ecosystems in Arid Areas—A Case Study of the Nalenggele Alluvial Fan in NW China. J. Hydrol. 2019, 573, 376–385. [Google Scholar] [CrossRef]
  59. Lv, J.; Wang, X.-S.; Zhou, Y.; Qian, K.; Wan, L.; Eamus, D.; Tao, Z. Groundwater-Dependent Distribution of Vegetation in Hailiutu River Catchment, a Semi-Arid Region in China: Groundwater-Dependent Vegetation. Ecohydrology 2013, 6, 142–149. [Google Scholar] [CrossRef]
  60. Phiri, M.; Shiferaw, Y.A.; Tesfamichael, S.G. Modelling the Relationship between Groundwater Depth and NDVI Using Time Series Regression with Distributed Lag M. SA J. Geomat. 2018, 7, 147–163. [Google Scholar] [CrossRef]
  61. Zhu, Y.H. Relationship of dominant herbaceous plant species and groundwater depth in tongliao plain, northwestern china. Appl. Ecol. Environ. Res. 2019, 17, 15363–15374. [Google Scholar] [CrossRef]
  62. Oyarzún, R.; Oyarzún, J.; Fairley, J.P.; Núñez, J.; Gómez, N.; Arumí, J.L.; Maturana, H. A Simple Approach for the Analysis of the Structural-Geologic Control of Groundwater in an Arid Rural, Mid-Mountain, Granitic and Volcanic-Sedimentary Terrain: The Case of the Coquimbo Region, North-Central Chile. J. Arid Environ. 2017, 142, 31–35. [Google Scholar] [CrossRef]
  63. Lezzaik, K.; Milewski, A. A Quantitative Assessment of Groundwater Resources in the Middle East and North Africa Region. Hydrogeol. J. 2018, 26, 251–266. [Google Scholar] [CrossRef]
  64. Freed, Z.; Aldous, A.; Gannett, M.W. Landscape Controls on the Distribution and Ecohydrology of Central Oregon Springs. Ecohydrology 2019, 12, e2065. [Google Scholar] [CrossRef]
  65. Wolaver, B.D.; Priestley, S.C.; Crossey, L.J.; Karlstrom, K.E.; Love, A.J. Elucidating Sources to Aridland Dalhousie Springs in the Great Artesian Basin (Australia) to Inform Conservation. Hydrogeol. J. 2020, 28, 279–296. [Google Scholar] [CrossRef]
  66. Fan, Y.; Li, H.; Miguez-Macho, G. Global Patterns of Groundwater Table Depth. Science 2013, 339, 940–943. [Google Scholar] [CrossRef]
  67. Hawkins, B.A.; Field, R.; Cornell, H.V.; Currie, D.J.; Guégan, J.-F.; Kaufman, D.M.; Kerr, J.T.; Mittelbach, G.G.; Oberdorff, T.; O’Brien, E.M.; et al. Energy, water, and broad-scale geographic patterns of species richness. Ecology 2003, 84, 3105–3117. [Google Scholar] [CrossRef]
  68. Zhang, J.; Song, J.; Cheng, L.; Zheng, H.; Wang, Y.; Huai, B.; Sun, W.; Qi, S.; Zhao, P.; Wang, Y.; et al. Baseflow Estimation for Catchments in the Loess Plateau, China. J. Environ. Manag. 2019, 233, 264–270. [Google Scholar] [CrossRef]
Figure 1. Red circle represents the location of the Loess zone (a). Land use of the Loess zone in 2020 (b). Distribution of wells, names of provinces in the study area, and Loess zone elevations (c).
Forests 14 02326 g001
Figure 2. Flow chart of mapping of GDEs.
Forests 14 02326 g002
Figure 3. (a) Changes in the equivalent water height for the GRACE-monitored terrestrial water reserves from 2002 to 2021; (b) a scatter plot of the DSI-g from 2002 to 2021 (grey line: groundwater drought threshold −0.8, the black straight line and grey dashed line indicate the results of the linear fit for the periods 2002–2014 and 2015–2021, and the grey scatter indicates the value of DSI-g).
Forests 14 02326 g003
Figure 4. DSI-g and groundwater anomaly changes in the Loess zone from 2002–2021.
Forests 14 02326 g004
Figure 5. Zoning of possible groundwater-dependent ecosystems (GDEs) in the Loess zone. (a) Zoning of GDEs for the period 2015–2021; (b) Zoning of GDEs for the period 2002–2014.
Forests 14 02326 g005
Figure 6. The changes in the proportion of GDEs regional groups from 2002 to 2021 and from 2015 to 2021.
Forests 14 02326 g006
Figure 7. (a) A plot of the EVI and P correlations within each group as a function of the spatial distribution in 2006; (b) A plot of the potential GDEs correlations within each group as a function of the spatial distribution.
Forests 14 02326 g007
Figure 8. (a) Spatial distribution pattern of differences between annual ET and P in 2006; (b) a box plot of ET and P differences within each potential GDE group.
Forests 14 02326 g008
Figure 9. (a) Annual groundwater trends from 2002 to 2014; (b) annual groundwater trends between 2015 and 2021.
Forests 14 02326 g009
Disclaimer/Publisher’s Note: The statements, opinions and data contained in all publications are solely those of the individual author(s) and contributor(s) and not of MDPI and/or the editor(s). MDPI and/or the editor(s) disclaim responsibility for any injury to people or property resulting from any ideas, methods, instructions or products referred to in the content.

