Article

The Composite Physiological Response of Hydraulic and Photosynthetic Traits and Nonstructural Carbon in Masson Pine Seedlings to Drought Associated with High Temperature

1
College of Landsape Architecture, Jiyang College of Zhejiang A&F University, Zhuji 311800, China
2
State Key Laboratory of Subtropical Silviculture, Zhejiang A&F University, Hangzhou 311300, China
*
Author to whom correspondence should be addressed.
These authors have contributed equally to this work.
Forests 2023, 14(12), 2320; https://doi.org/10.3390/f14122320
Submission received: 24 October 2023 / Revised: 18 November 2023 / Accepted: 22 November 2023 / Published: 26 November 2023
(This article belongs to the Section Forest Ecology and Management)

Abstract

:
Masson pine (Pinus massoniana Lamb.) is a dominant coniferous species in southern China, known for its rapid growth, abundant yield, and extensive utilization. Despite the robust adaptability of Masson pine and the rich annual precipitation in its distribution areas, this species still faces the mortality risk caused by the recurrent high temperatures in summer and low precipitation in subtropical regions. The mortality risk of Masson pine may increase in the future when facing a more frequent or intensive drought threat due to climate change. In this study, we conducted a manipulated drought experiment accompanying high temperature (~32.3 ± 0.7 °C in daytime and 28 °C in nighttime) to simulate a flash drought, aiming to explore the composite physiological response (hydraulic, gas exchange, and nonstructural carbon (NSC) characteristics) of Masson pine seedlings to extreme drought characterized by a high intensity and long duration. We found that, as the drought developed, the leaf water potential and gas exchange traits (net photosynthesis rate, stomatal conductance, and transpiration) significantly decreased while the percentage loss of hydraulic conductivity (PLC) significantly increased. In contrast, NSC remained a more constant trend before it was significantly reduced on day 30 after the beginning of the drought. Except for NSC, all the other traits had significant correlations between them. Additionally, hydraulic dysfunction indicated by the increasing PLC preceded the NSC depletion, which may indicate a more significant role for hydraulic failure than carbon starvation in drought-induced mortality. Conclusively, hydraulic and gas exchange traits showed a coupling response to drought, but NSC displayed an independent dynamic. The findings may improve our understanding of drought-coping strategies of Masson pine and provide some theoretical basis for Masson pine forest management.

1. Introduction

Due to the background of global warming, droughts have resulted in widespread tree mortality worldwide [1,2,3,4,5], which changed the biodiversity and carbon budget of forest ecosystems and brought economic loss to human beings [6,7,8]. If a drought develops rapidly and intensively and usually occurrs in hot seasons (named ‘flash drought’; [9,10,11]), it may lead to a more intensive loss of forests than mere gradual environmental changes [12,13]. Moreover, the drought was not limited to those dry regions but also occurred in humid areas more frequently [7,8,14]. In the future, the frequency and intensity of droughts in humid areas, such as the subtropical regions of China (annual precipitation > 1500 mm), are projected to increase under several climate scenarios [7,11,15]. Unlike species that dominate in arid or semi-arid regions and have adapted to dry conditions, those tree species dominating in humid areas may be more susceptible to changes brought by flash drought due to less investment in hydraulic safety [12,13]. So far, the response and adaptation mechanisms of tree species in subtropical China have drawn the attention of governments and scientists [16,17,18], but we still need more in-depth studies on more species to uncover the inter- and intraspecies differences, which will provide a more accurate prediction of the drought impact on forests.
Masson pine (Pinus massoniana Lamb.) is a dominant coniferous species in southern China, known for its rapid growth, abundant yield, and extensive utilization [17,19]. Despite the robust adaptability of Masson pine and the rich annual precipitation in its distribution areas, this species still faces the mortality risk caused by the recurrent high temperatures in summer and low precipitation in subtropical regions [20], which may worsen the drought threat due to the above-mentioned climate change [7,11,15]. To explore the response of Masson pine to drought, previous studies have emphasized the leaf gas exchange [21], photosynthetic characteristics [22,23], biochemical parameters [18,24,25], hydraulic conductance and nonstructural carbon [17], root tip structure and volatile organic compounds [26], mycorrhizal fungus [22,25,27], and stress-induced defensive secondary metabolites (such as flavonoids and terpenoids [28]).
Briefly, these previous studies aimed to address how Masson pine adjusted its physiological response to different drought levels, but only one study [21] designed the drought treatment under a higher daytime temperature (35 °C) to simulate a flash drought. Additionally, among these studies, only one study tried to explore the mechanisms of drought-induced mortality from the interaction of hydraulic failure and carbon starvation [17], the two most recognized physiological mechanisms leading to tree mortality [14,29]. In this study [17], the researchers did not find clear synchronization between hydraulic damage (denoted as the percentage loss of hydraulic conductivity, PLC) and carbon depletion (denoted as the dynamic of nonstructural carbohydrate, NSC) as demonstrated in other species [30,31,32] and determined the decisive role of PLC but not NSC on the mortality of Masson pine seedlings [17]. As the depletion of NSC is one part of the carbon budget, its role may need to be determined by incorporating the dynamics of carbon input by photosynthesis, which usually would be constrained within the drought process. As pointed out by a previous study, drought adjustment of a single or several traits may still not ensure that most species cope with a future drought, which may require more integrated observations of plant traits [33].
In this study, we conducted a manipulated drought experiment accompanying high temperature (~34 °C in daytime and 28 °C in nighttime) to simulate a flash drought, aiming to explore the composite physiological response (hydraulic, photosynthetic, and NSC characteristics) of Masson pine to extreme drought. We hypothesized that the hydraulic, photosynthetic traits and NSC of Masson pine would show some interrelationship between them within the drought process, experiencing a similar decreasing trend. We hope the findings will deepen our understanding of the drought-coping strategies of Masson pine.

2. Materials and Methods

2.1. Plant Materials and Experimental Design

The experimental Masson pine seedlings were bought from a private nursery in Zhejiang province, China. In October 2022, Masson pine seedlings with similar height (40 ± 0.5 cm) and basal diameter (9 ± 0.5 mm) were planted in 6 L (22.4 cm diameter × 20.8 cm height) plastic pots with drainage holes at the bottom in an experimental greenhouse at Jiyang College of Zhejiang A & F University, Zhejiang province, China. Each pot had one seedling and about 2.5 kg of dry organic sterilized soil. The soil mixture had a pH of 4.7 (LT-PH; Lvbo Co., Ltd., Hangzhou, China) and had an adequate nutrient status (total N—3.8 g kg−1, total P—0.8 g kg−1, total K—7. 6 g kg−1) in the short-term experiment.
At the beginning of December 2022, seedlings with similar height (40 ± 0.5 cm) and basal diameter (9 ± 0.5 mm) were randomly assigned to two watering treatments: the control treatment (fully watered) and the drought treatment (not watered at all during the experiment). Seedlings in the control treatment (n = 20) were fully irrigated with water every 3 or 4 days throughout the experiment, maintaining approximately the same soil moisture over the course of the experiment. Each time, the control pots were watered slowly with spray pots until the water came out from the holes at the bottom of the pots. All the seedlings were put in a room with 32.3 ± 0.7 °C air temperature [21], 25.2 ± 1.8% air humidity, and 34.4 ± 2.5 μmol m−2 s−1 of radiation during daytime from 8:00 to 18:00. During nighttime, the air temperature, air humidity, and light intensity were 28.0 ± 1.0 °C, 27.3 ± 0.8%, and 0 μmol m−2 s−1 from 18:00 to 8:00 the next morning. The room temperature during daytime was maintained by turning on two electric radiators (Gree Company, China), and nighttime room temperature was maintained by one electric radiator.
We monitored leaf water potential and stem hydraulic conductivity periodically on five seedlings of each treatment group at a time. Throughout the experimental period, measurements were conducted 0, 10 (epidemic effects), 20, 30 days after the onset of the drought experiment. Soil water content (cm3 cm−3, SWC) of five pots of seedlings per treatment was continuously monitored with sensors for time domain reflectometry (ZGS-800S, Shuolian Company, Hangzhou, China).

2.2. Leaf Water Potential

Predawn water potential (Ψpd, MPa) and midday water potential (Ψmd, MPa) of needles from five seedlings from each treatment (n = 5) were measured using a dewpoint water potential meter (PSYPRO, WESCOR, South Logan, Utah, USA) on each sampling date in the drought treatments. Needles were sampled approximately 1 h before sunrise (05:00–06:00 h) and at noon (12:00–13:00 h) to determine water potential values. Six to ten intact leaves from the same branch of each well-grown seedling were taken as sample replicates, respectively.

2.3. Hydraulic Conductivity

Hydraulic conductivity was measured based on the pressure-flow method [34]. Branches of uniform size, free of pests and diseases, and oriented in the same direction were selected according to the different treatment groups and immersed in containers with water, covered with a black plastic bag to prevent water evaporation, and brought back to the laboratory immediately. Hydraulic conductivity was determined using the flushing method [17], where hydraulic conductivity was measured directly on five seedlings (n = 5) sampled from each treatment group on each sampling date where water potential was measured. The cut ends of the samples were immersed in ultrapure water for 30 min to ensure xylem tension relaxation and to avoid possible excision embolism. The ultrapure water was prepared with an ultrapure water machine (VE-40LH-A, Hongsen Environmental Protection Technology Co., Ltd., Shenzhen, China). The sample was gradually severed underwater to obtain a straight, unbranched stem segment approximately 8–10 cm in length. The experimental dropping bottle was then hung on a 1.6 m high iron frame with the appropriate amount of water. The physiological upper end of the treated twig segment was connected to the hose at the lower end of the dropping bottle, and the physiological lower end was connected to a graduated hose (homemade pipette) of the appropriate size. In order to ensure airtightness during the measurements, materials such as plastic sealing clay and raw material tape were used for the hermetic sealing of the branch segments and interfaces. The branch was placed horizontally and stood still, and the natural pressure (0.016 MPa) at the height of the water column was used to generate water flow in the isolated stem segment. When water oozed out of the front end of the branch in the graduated hose, the timer started to run for 60 s, and at the end of the timer, a vernier caliper was used to measure and record the value of the graduated value of the pipette connected to the branch that had advanced during the 60 s. The length of the stem segment, as well as the total diameter of the cross-section, was then measured using a vernier caliper. In this way, the initial hydraulic conductivity (Kinitial, kg m s−1 MPa−1) was estimated. Then, the maximum hydraulic conductivity (Kmax) was obtained [35]. PLC of branches were obtained as (KmaxKinitial)/Kmax.

2.4. Leaf Photosynthesis Measurements

The LiCor6400 portable open-path gas exchange system (Li-Cor Inc, Lincoln, Nebraska, USA) was used to determine the leaf net photosynthetic rate (Pn), stomatal conductance (gs), and transpiration rate (Tr). The built-in light intensity was set to 1000 μmol m−2-s−1, and the temperature was set to an average air temperature of 32 °C.

2.5. Measurement of Nonstructural Carbohydrate

Needles, stem, and roots of each sampling seedling (about 15 g of each organ) were sampled separately. The middle parts of the needles were taken as samples. For the stems, the sampling part was above the collar of the stem and without needles. Both taproot and fine roots were sampled and mixed. All these fresh samples were first put in the drying oven at 105 °C for 1 h and then at 75 °C for 48 h.
Dried plant samples were ground to a fine powder in a ball mill, passed through a 100-mesh sieve, and then nonstructural carbohydrate (NSC) contents (soluble sugars and starch) were determined by a modified anthrone colorimetric method [18]. Dried samples weighing 0.100 g were transferred with 10 mL of distilled water into 15 mL centrifuge tubes. The centrifuge tube was then placed in a 70 °C water bath for 30 min, cooled, and then centrifuged in a centrifuge at 3000 rpm for 7 min to collect the sample supernatant. The process of centrifugation and collection of supernatants was repeated twice, and the centrifuged sample solution was combined into a 50 mL beaker and fixed. A total of 1 ml of the supernatant was taken and transferred into a colorimetric tube and mixed with 5 mL of anthrone reagent (0.5 g anthrone dissolved in 500 mL of 80% sulfuric acid). The solution was then heated in a water bath at 100 °C in boiling water for 15 min and cooled to room temperature. Finally, the optical density of the supernatant was determined by visible spectrophotometer at 620 nm. Then, the measured optical density was used to calculate concentration of soluble sugars with standard curve of glucose.
The sample powder remaining in the centrifuge tube was used to determine the starch content. About 3 mL of distilled water was added to each sample tube, boiled for 15 min, and then cooled. After cooling, 2 mL of 74% HClO4 was added to the centrifuge tubes and mixed by shaking using a shaker for 15 min. The supernatant was collected twice and put into a 50 mL flask for constant volume. Finally, the optical density of the supernatant was determined by UV–visible spectrophotometer at 620 nm. Then, the measured optical density was used to calculate starch concentration with standard curve of glucose. The total concentration of NSC was defined as the sum of soluble sugar and starch concentrations.

2.6. Data Analysis

The difference in water potential, PLC, and NSC between treatments, as well as between treatment days, were examined with a nonparametric test (Kruskal–Wallis test), considering that 5 replicates per group may not meet the normal distribution required by parametric tests. Furthermore, to explore the correlation between SWC and predawn water potential, PLC, and photosynthetic traits, linear regression between them was conducted. Results were considered significant at p < 0.05. All analyses and figures were made with SAS 9.4.

3. Results

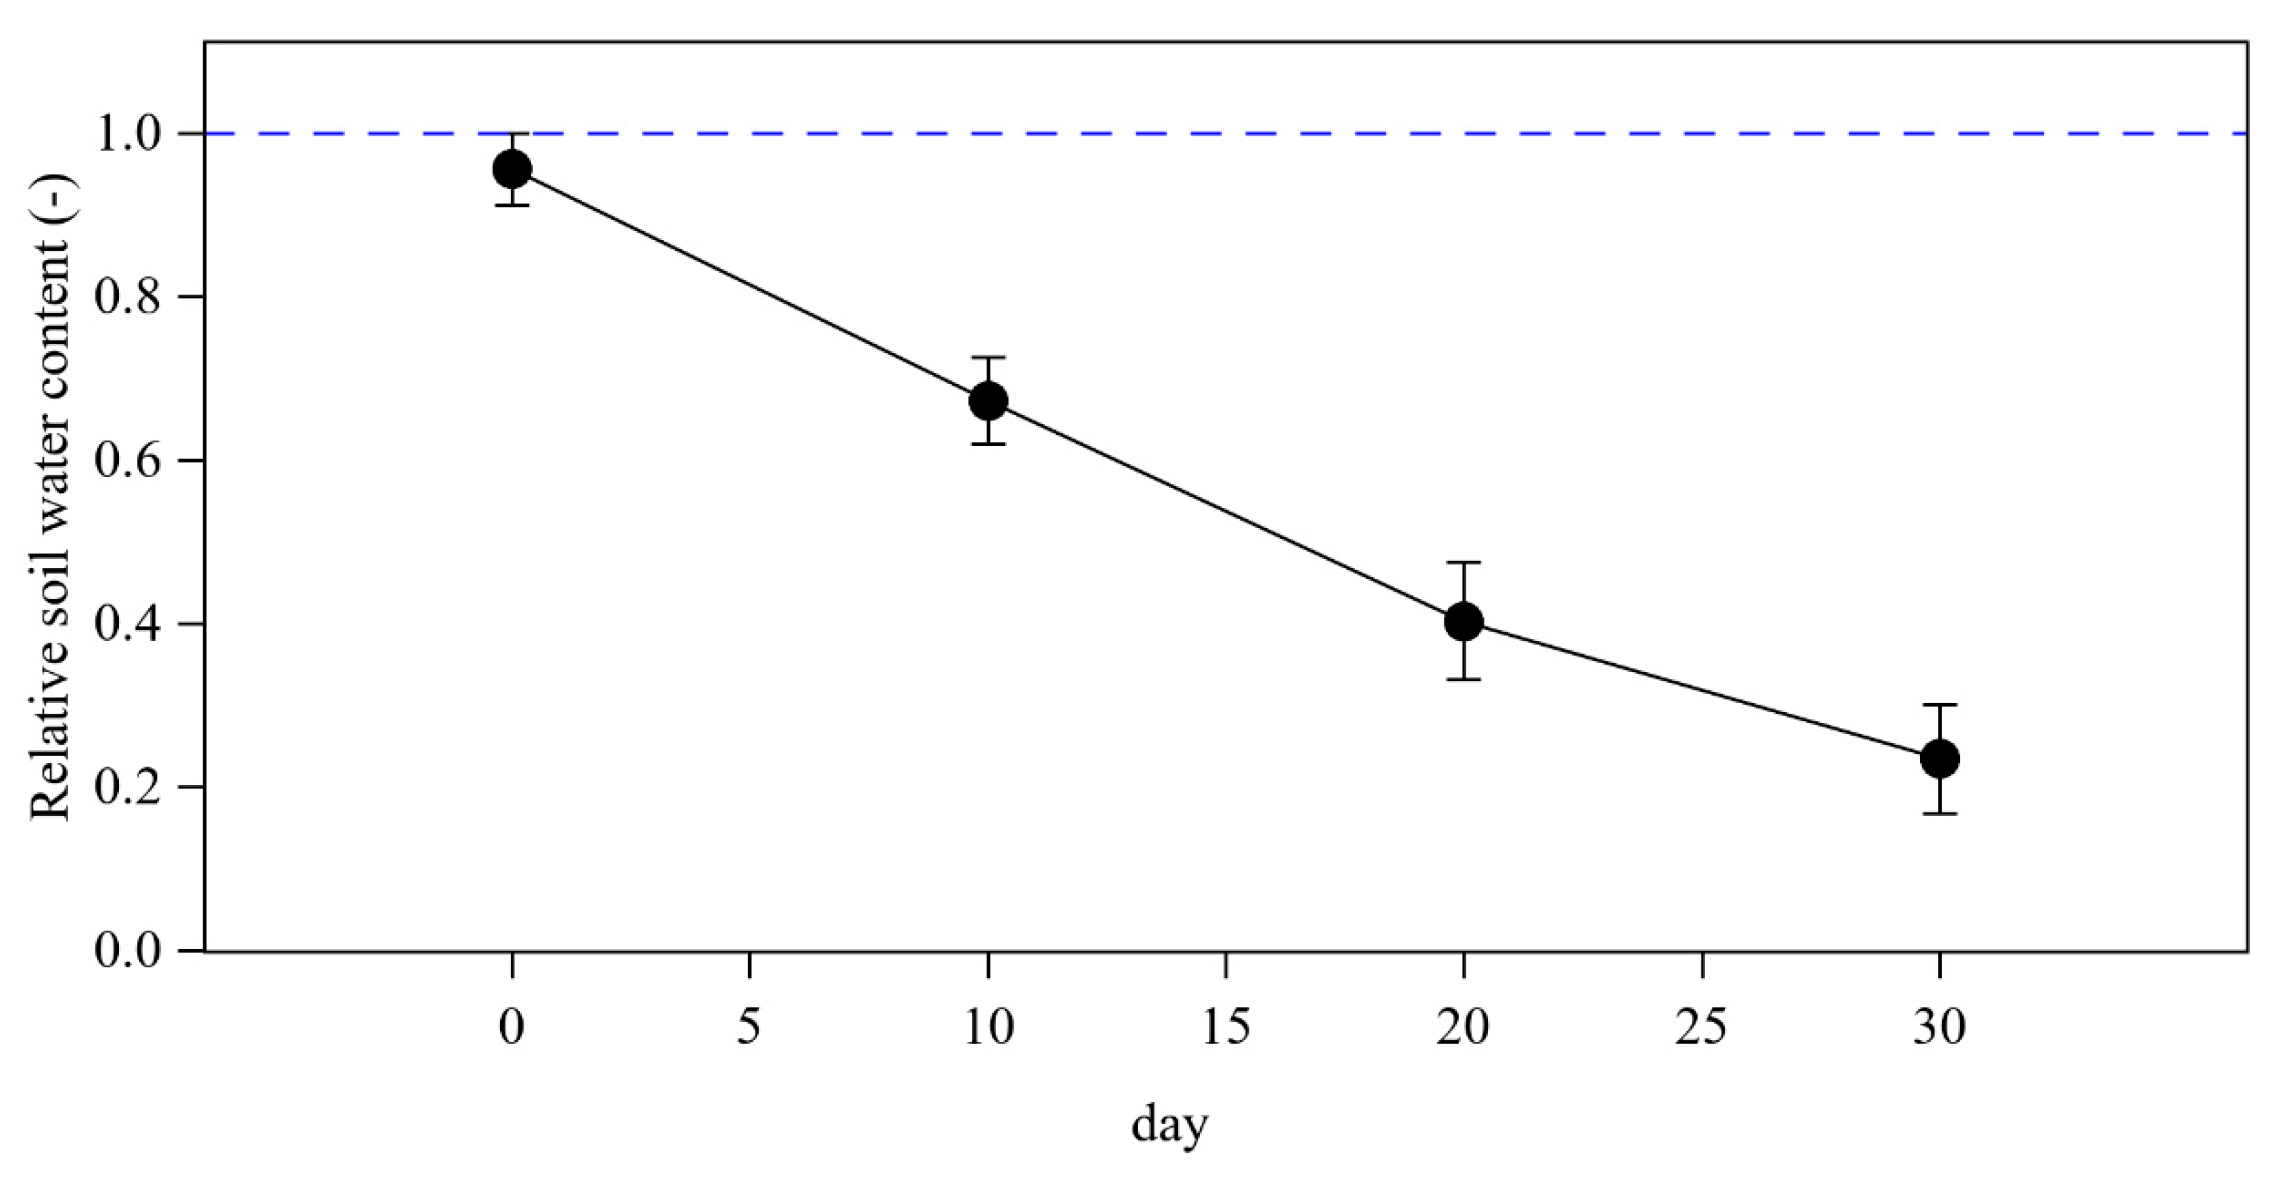
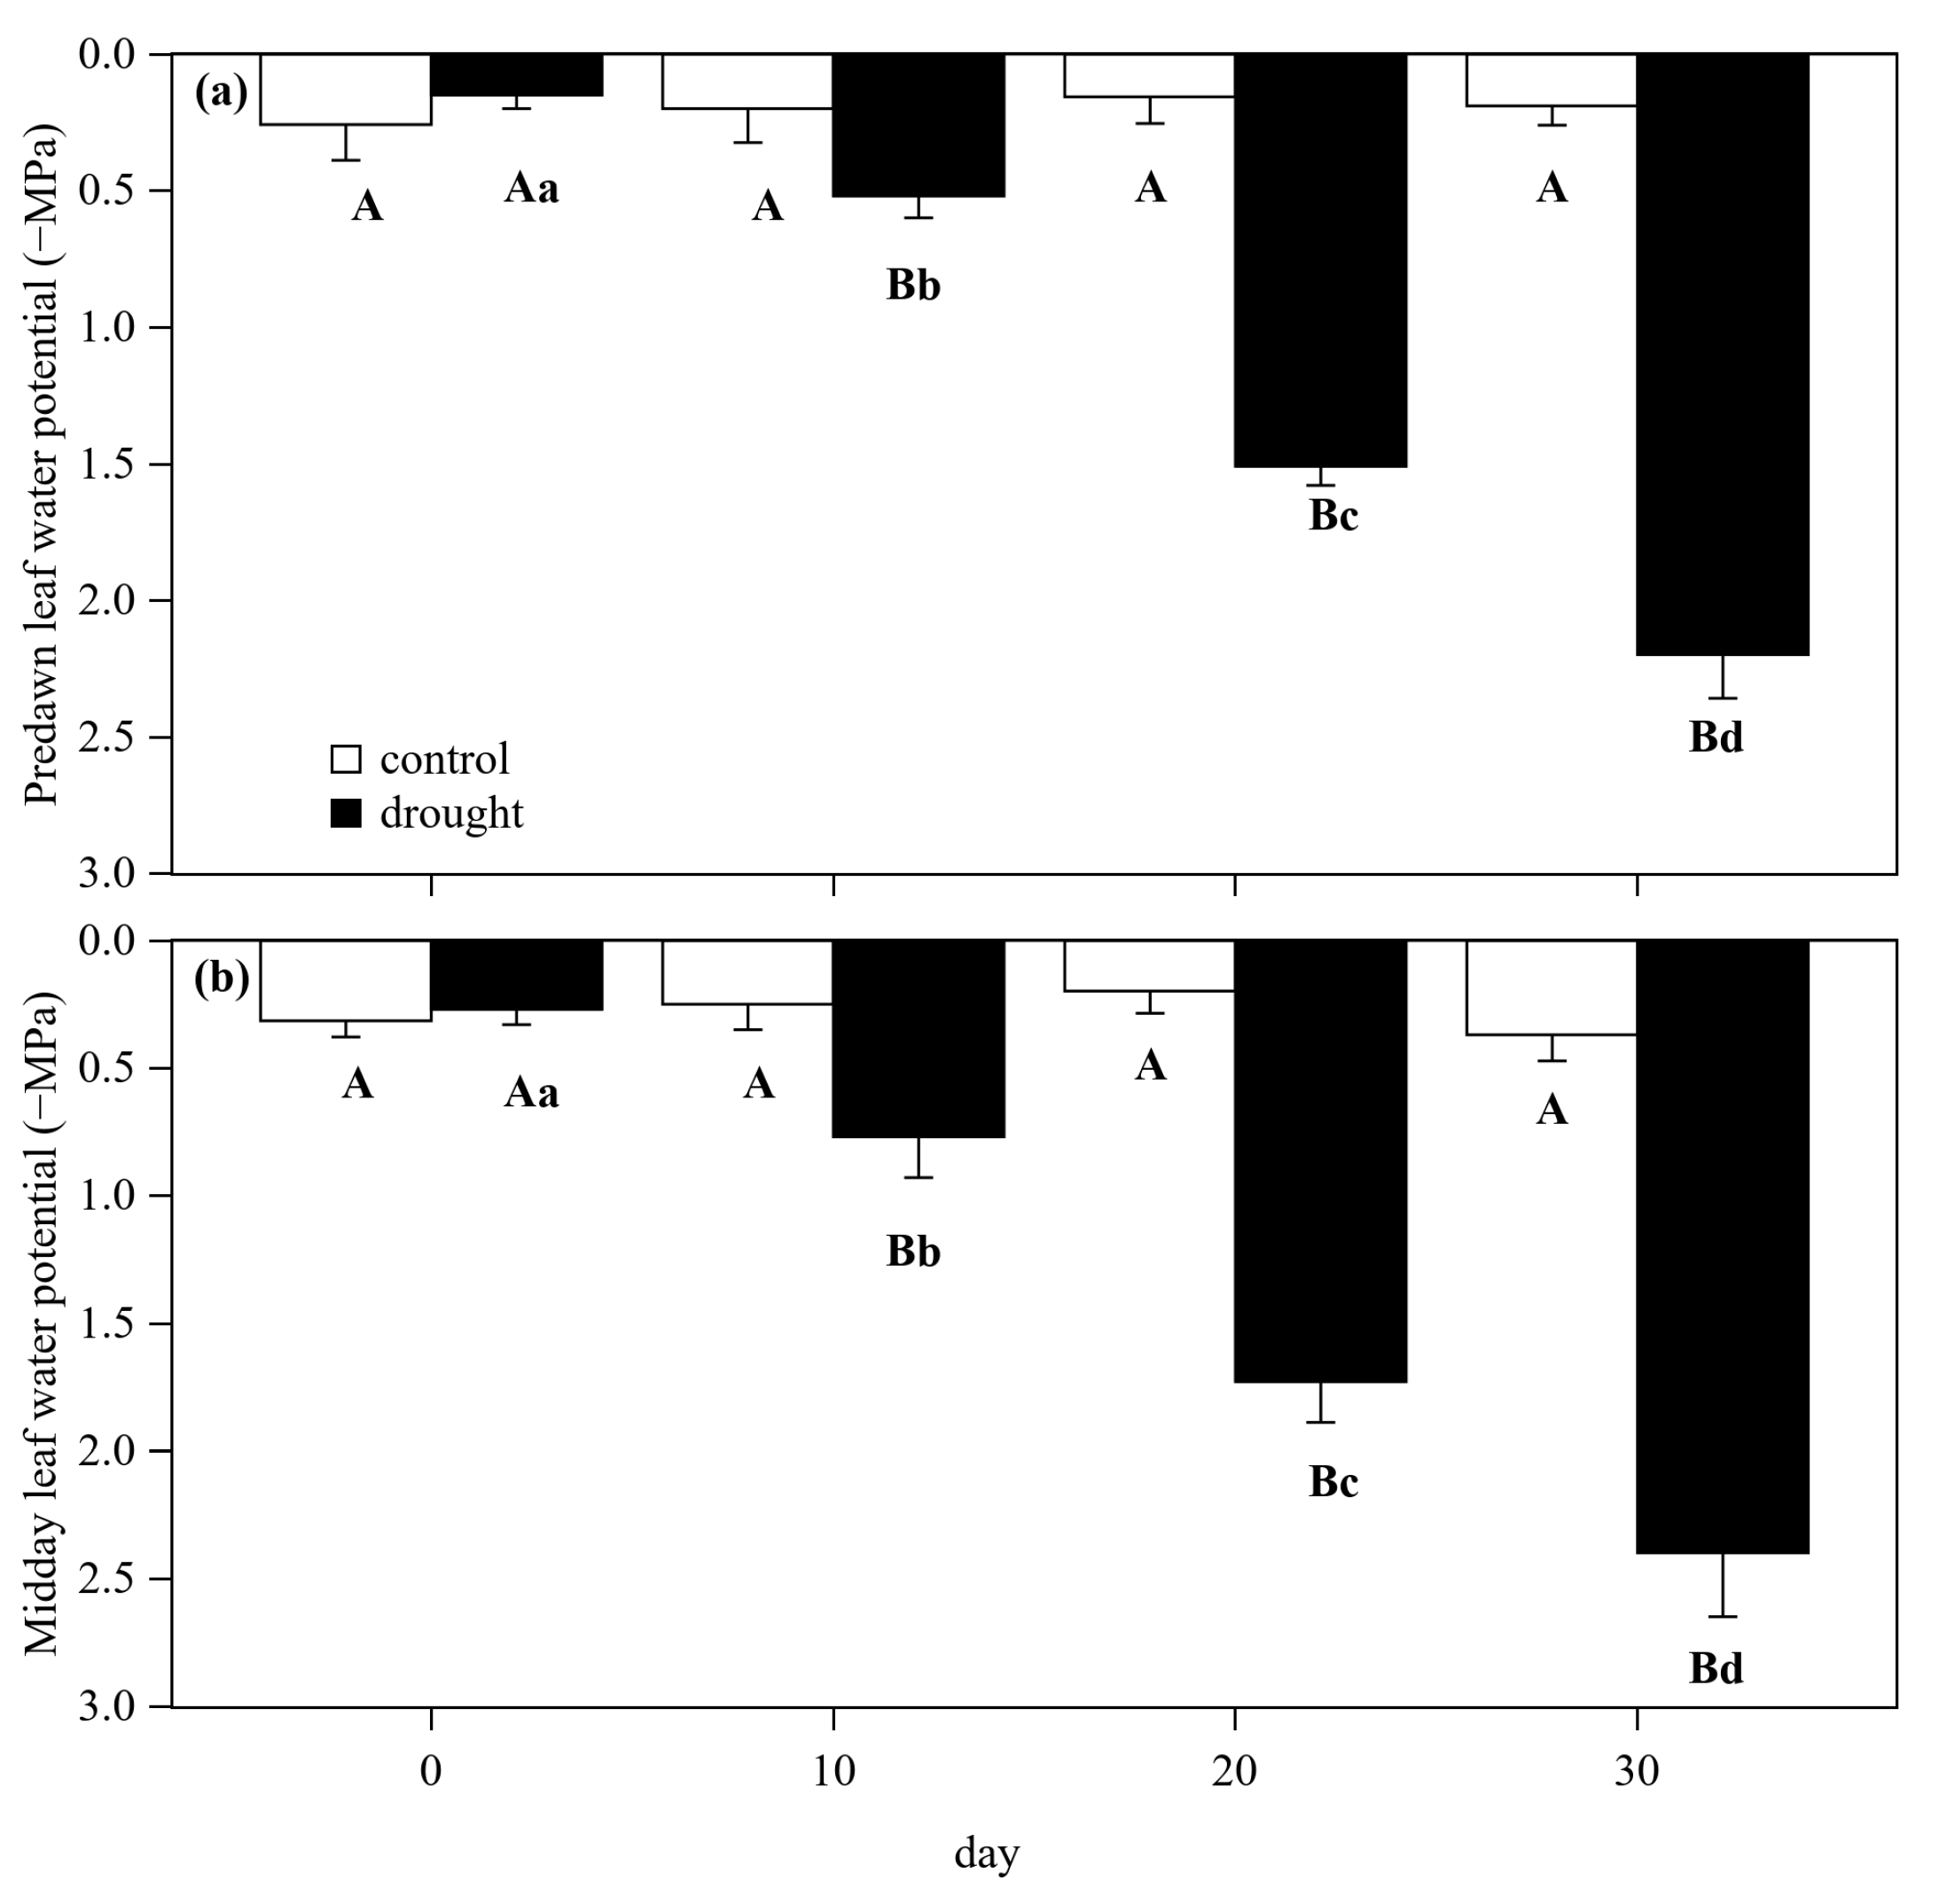
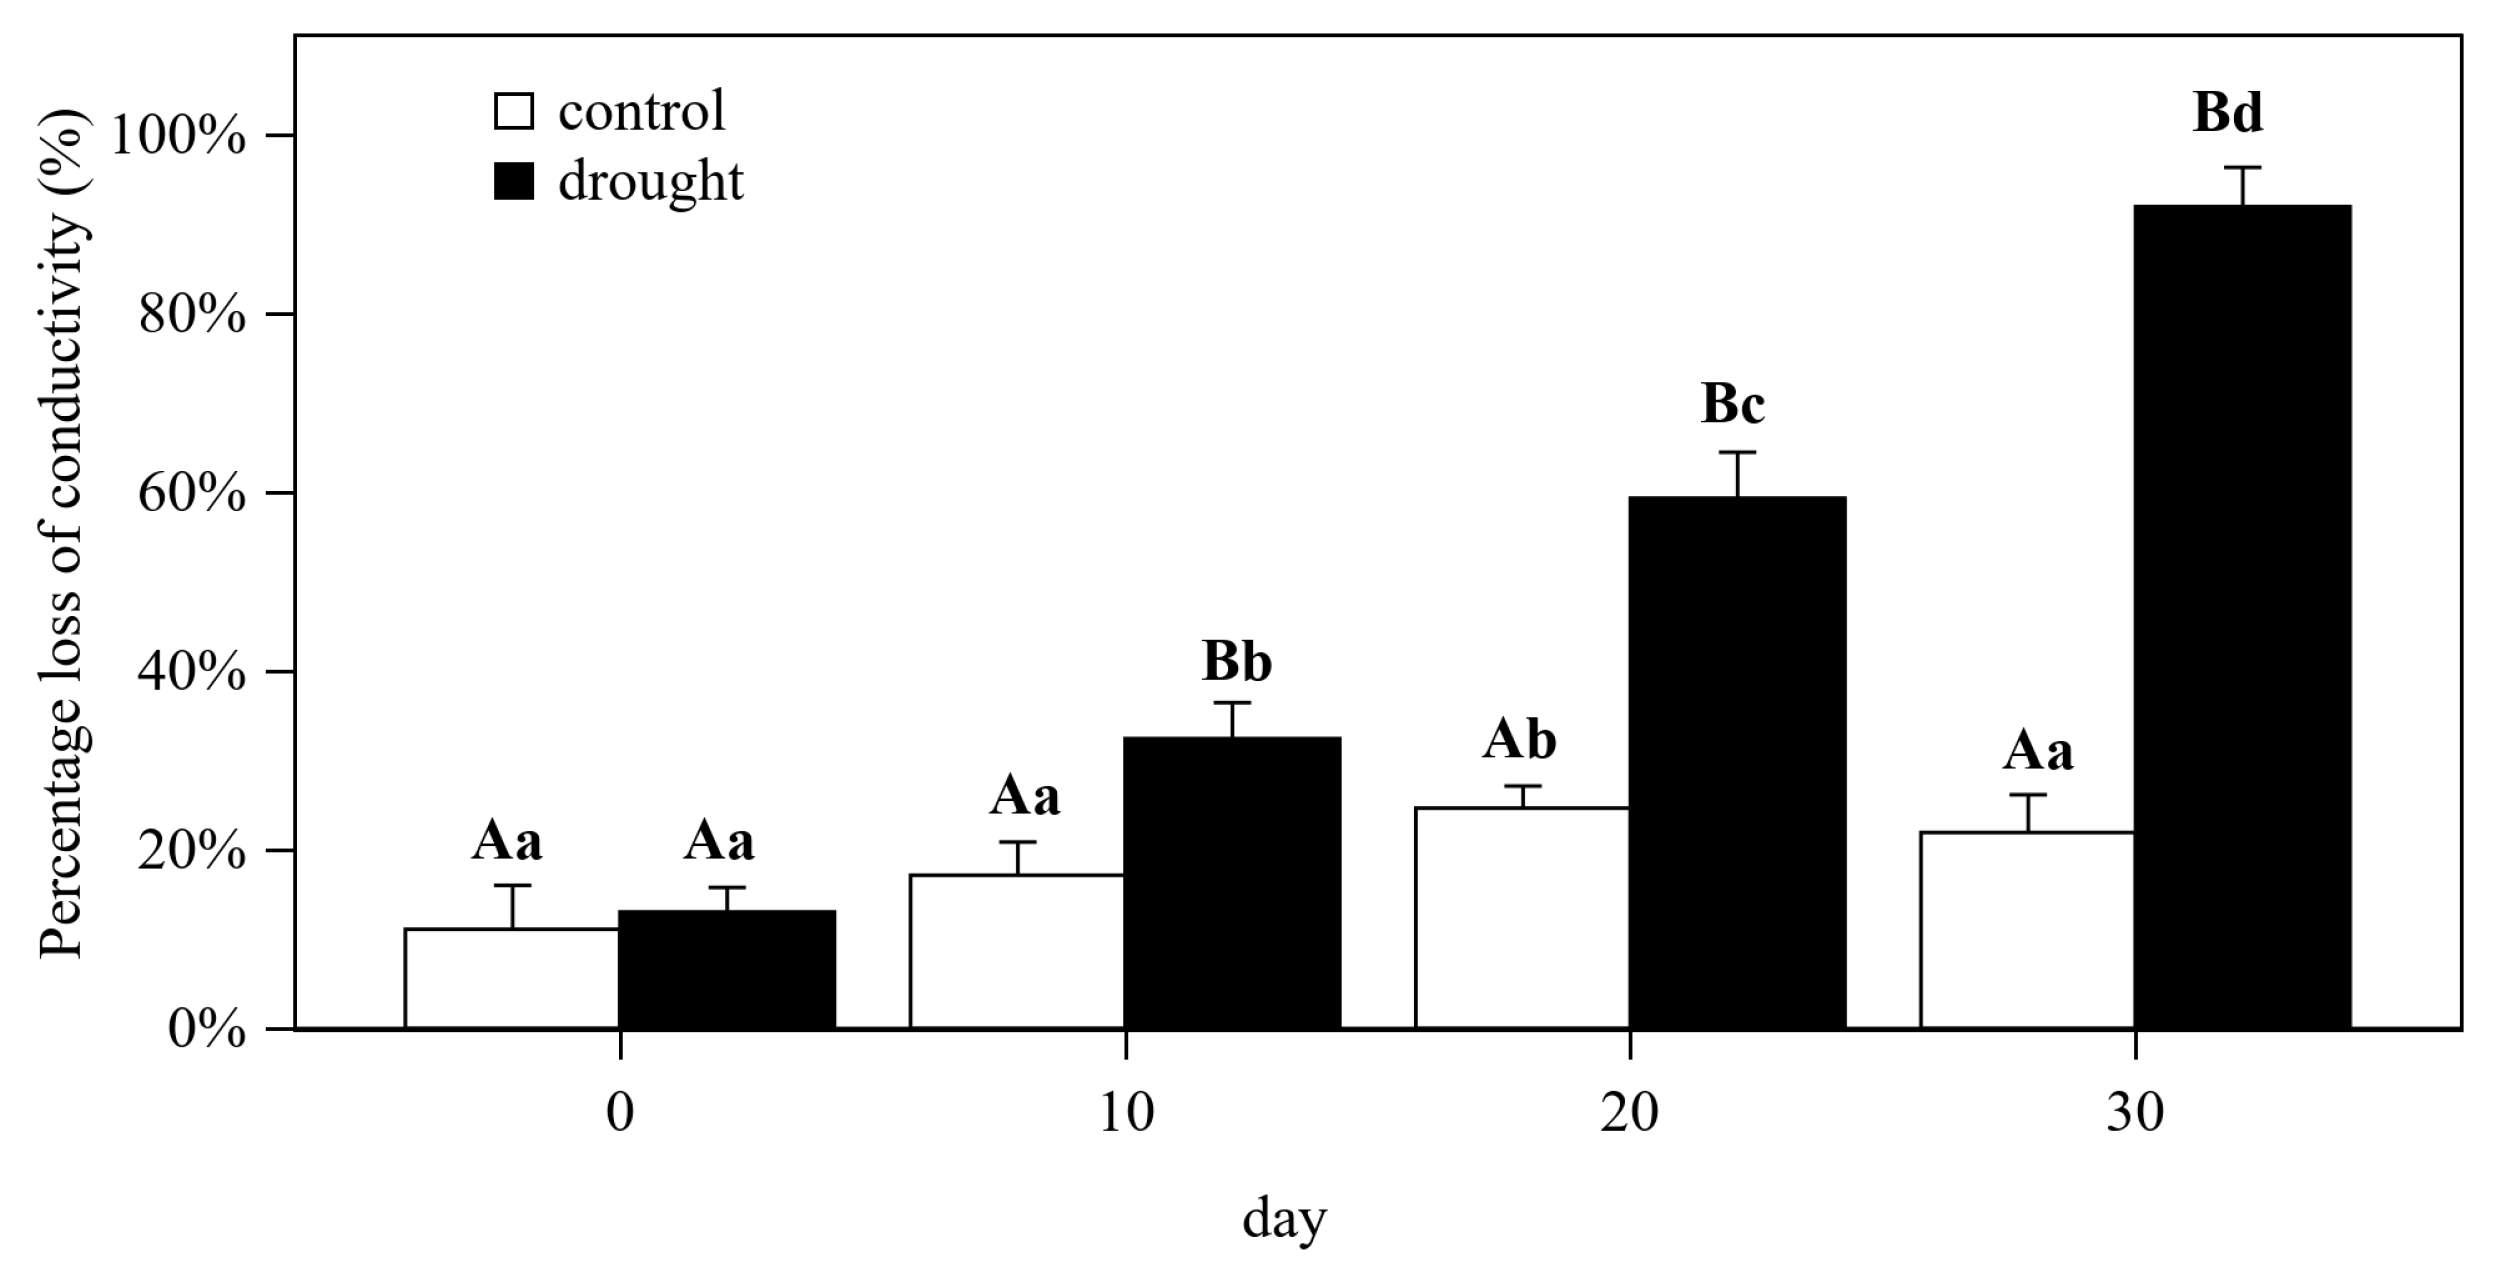
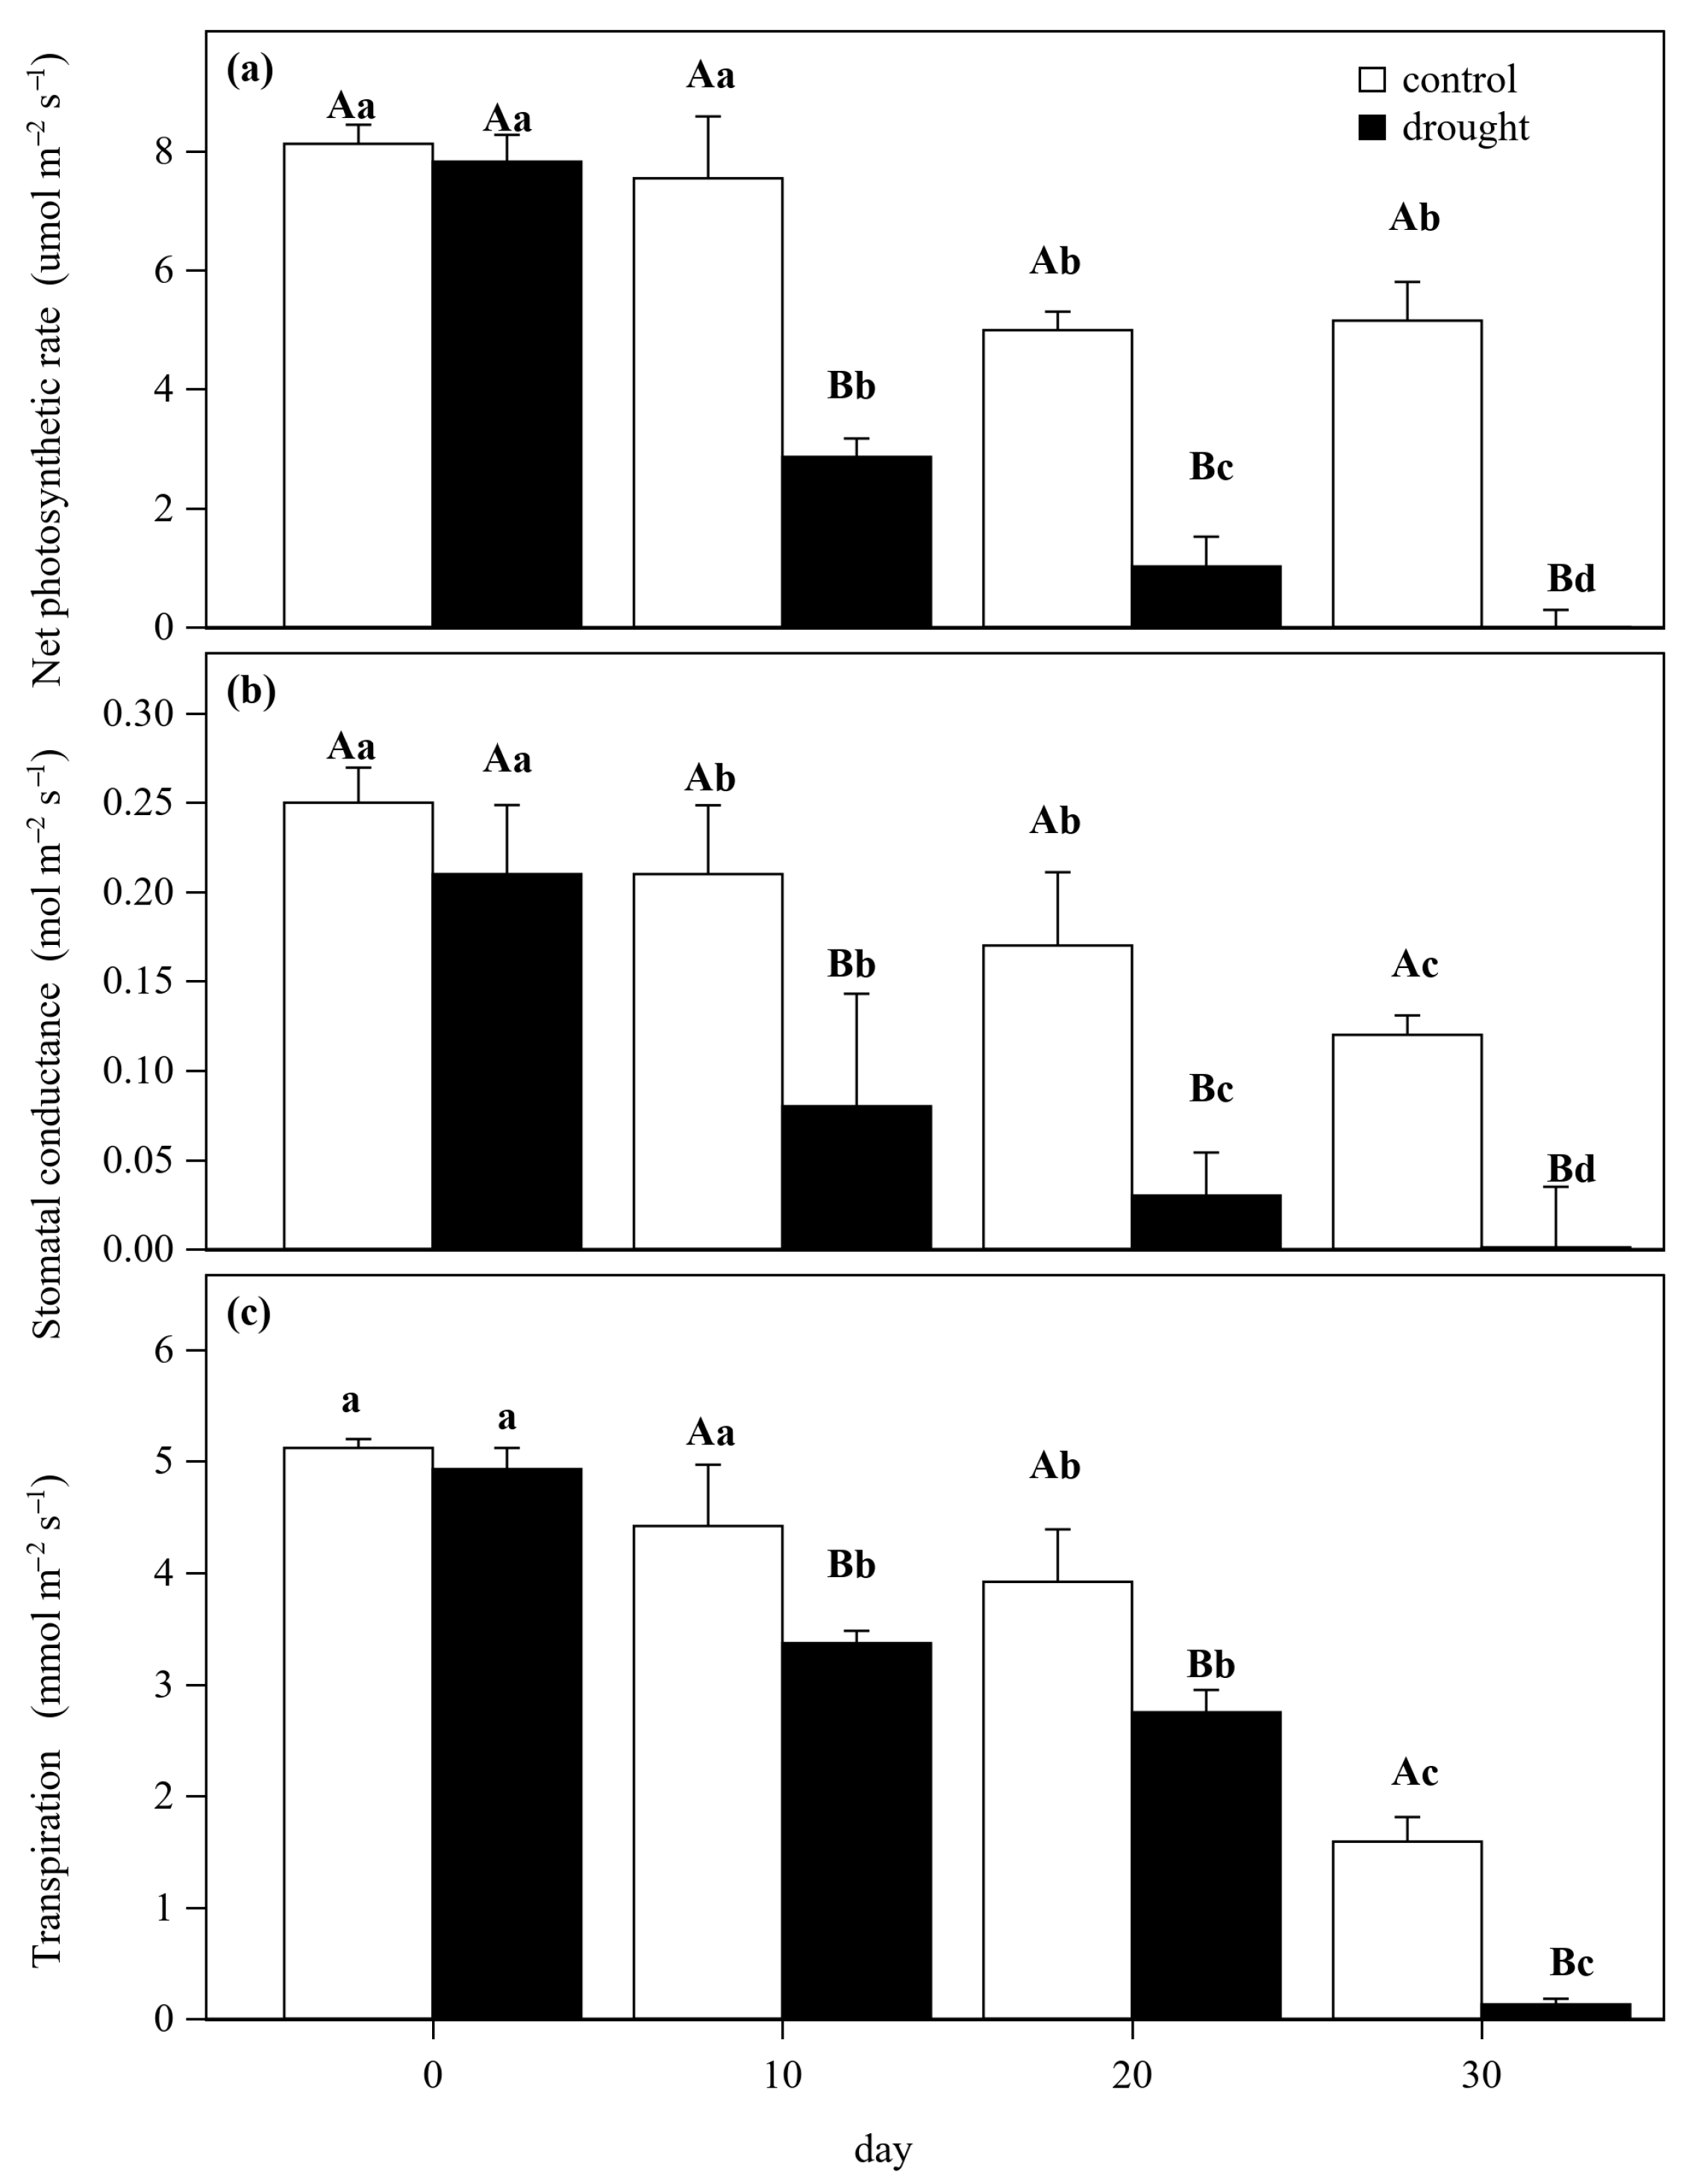
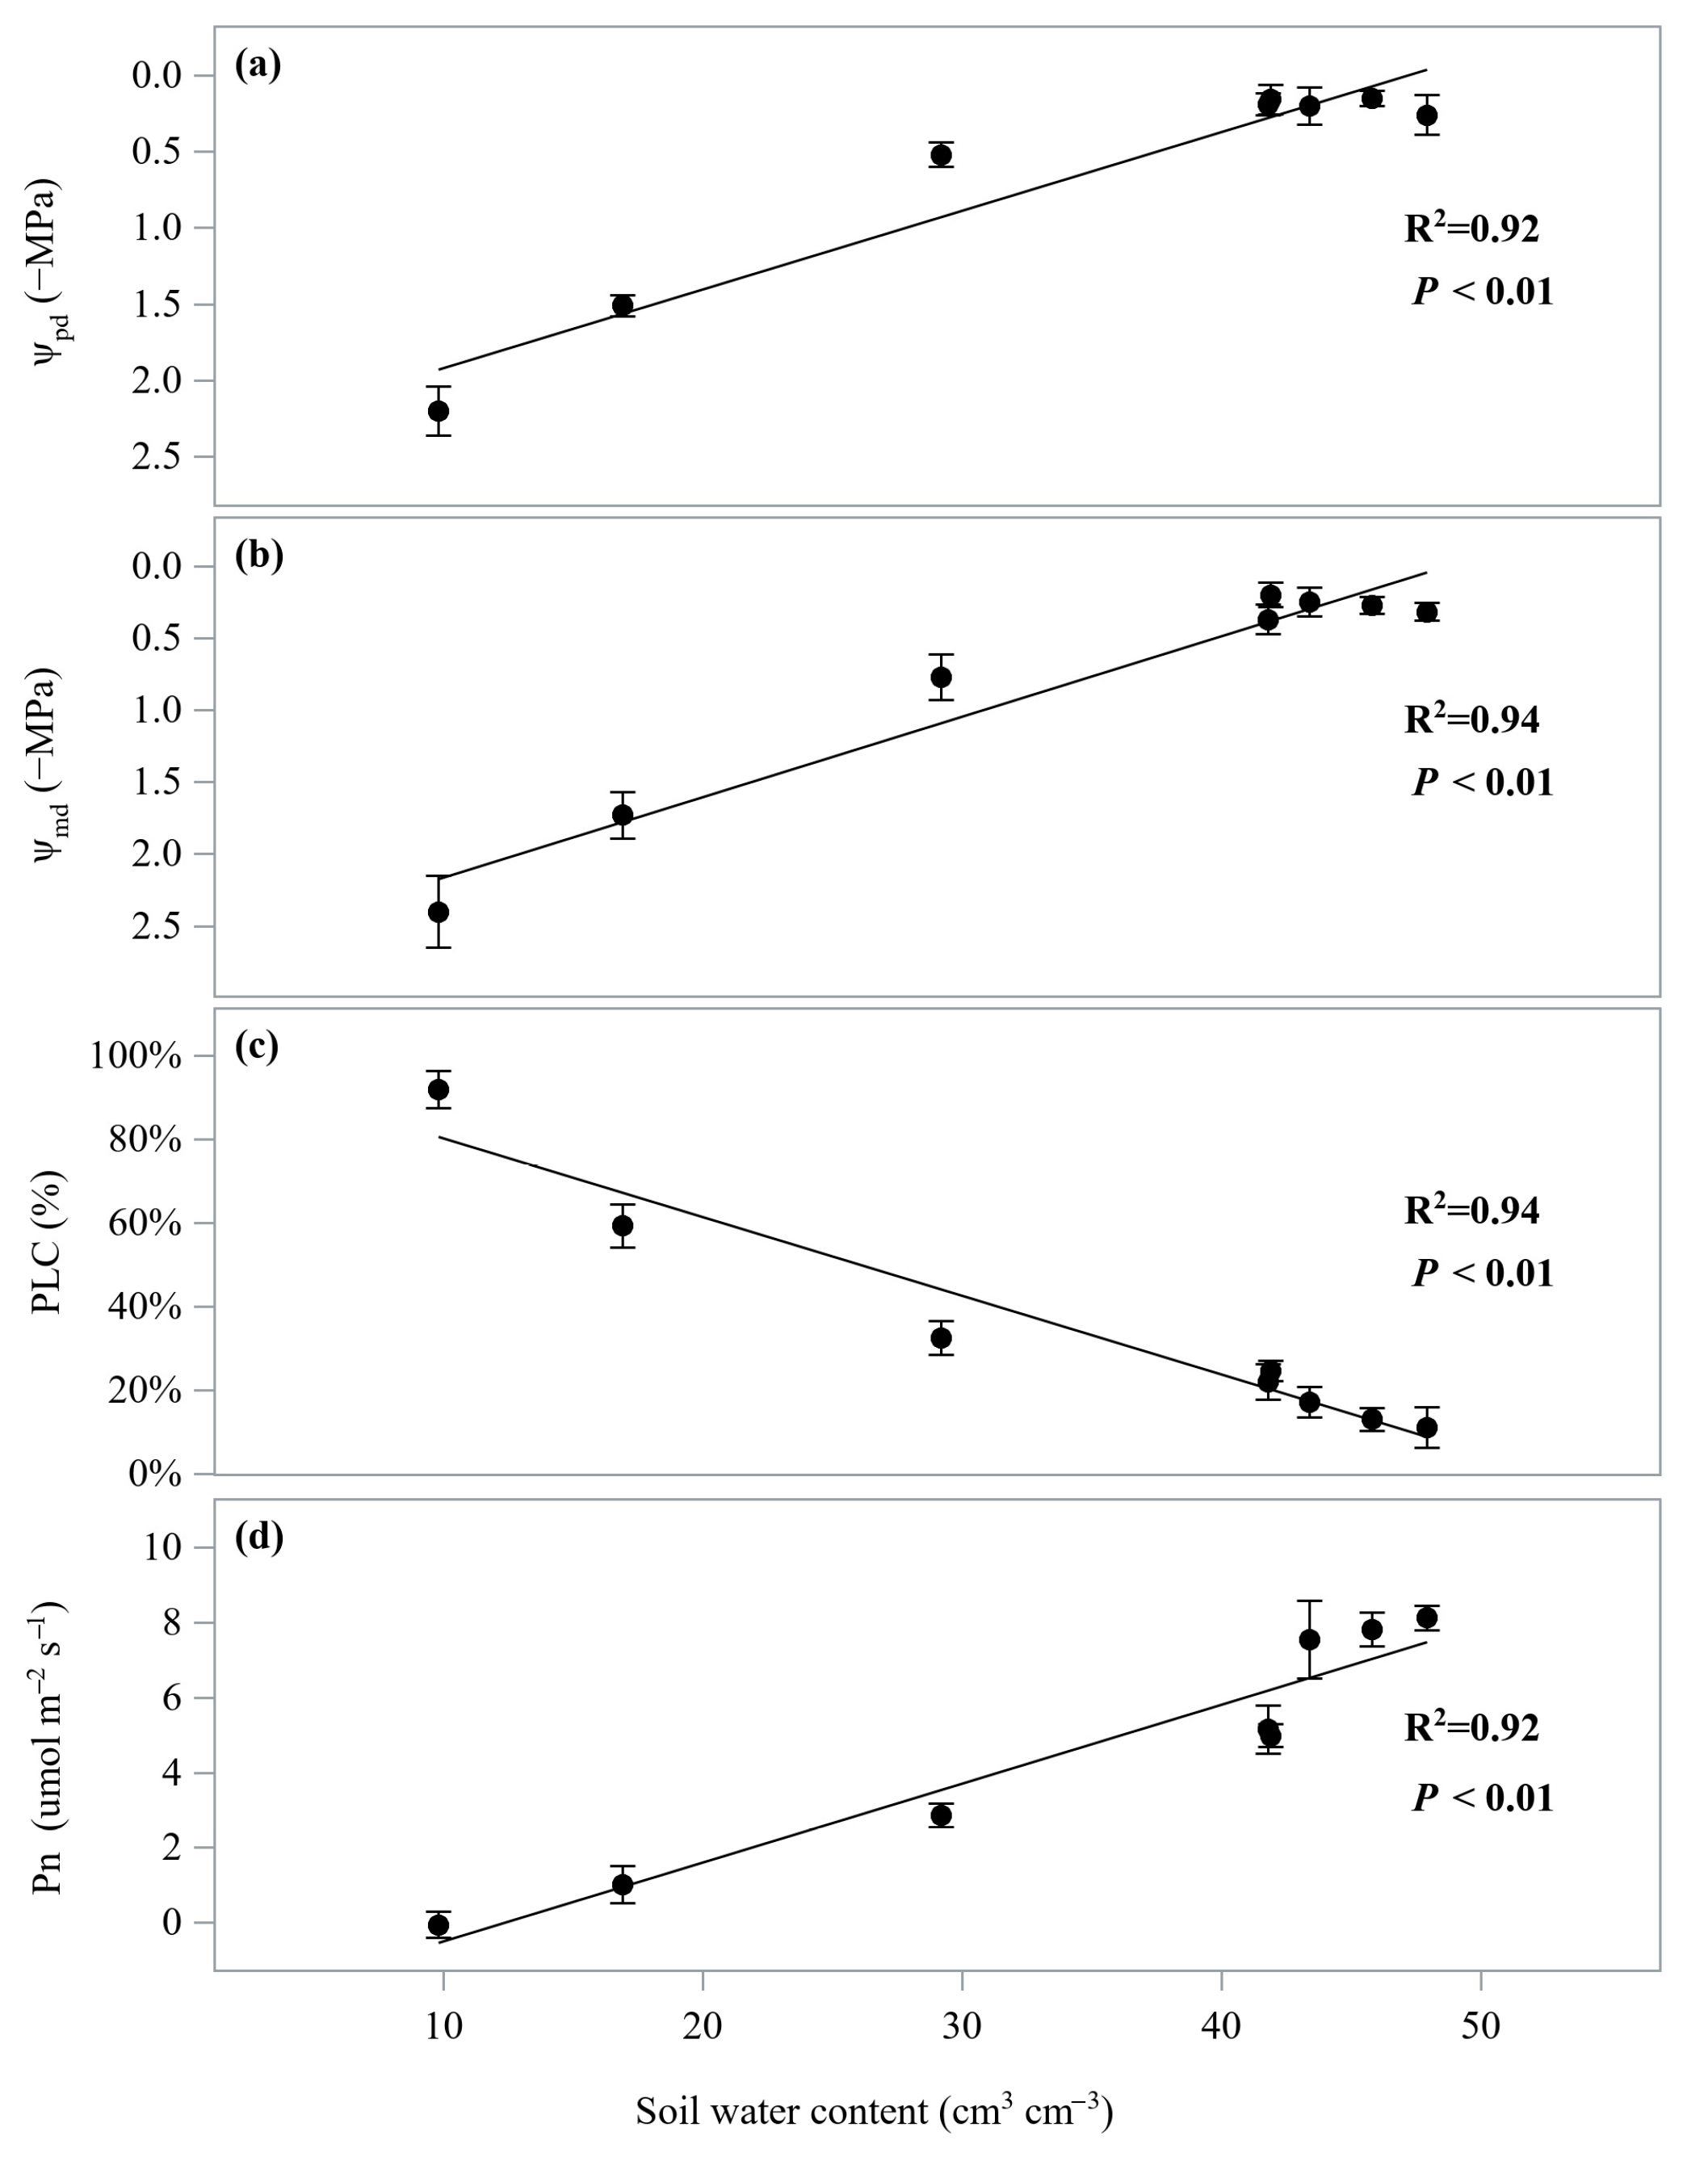
3.1. Hydraulic and Gas Exchange Dynamics

Compared with the control, SWC decreased within the drought process and finally reached 23.4 ± 6.6% of the control SWC (Figure 1). The leaf water potential of seedlings in the drought-treated group became significantly more negative over the duration of the drought, whereas there was no significant change in seedlings in the control group (p < 0.05; Figure 2a,b). Similarly, the stem PLC of seedlings in the drought-treated group also significantly increased, whereas no significant change was observed in the control group (p < 0.05; Figure 3). On days 10, 20, and 30 of the drought treatment, both leaf water potential and stem PLC of seedlings in the drought-treated group were significantly greater than those in the control group (p < 0.05; Figure 2 and Figure 3).
The photosynthetic rate (Pn), stomatal conductance (gs), and transpiration rate (Tr) decreased with time in both the control and drought groups (p < 0.05; Figure 4). The three parameters were significantly lower in the drought group than in the control group at the middle to late stage of the drought (p < 0.05), especially at the late stage of the drought (p < 0.05), when they dropped to almost zero.

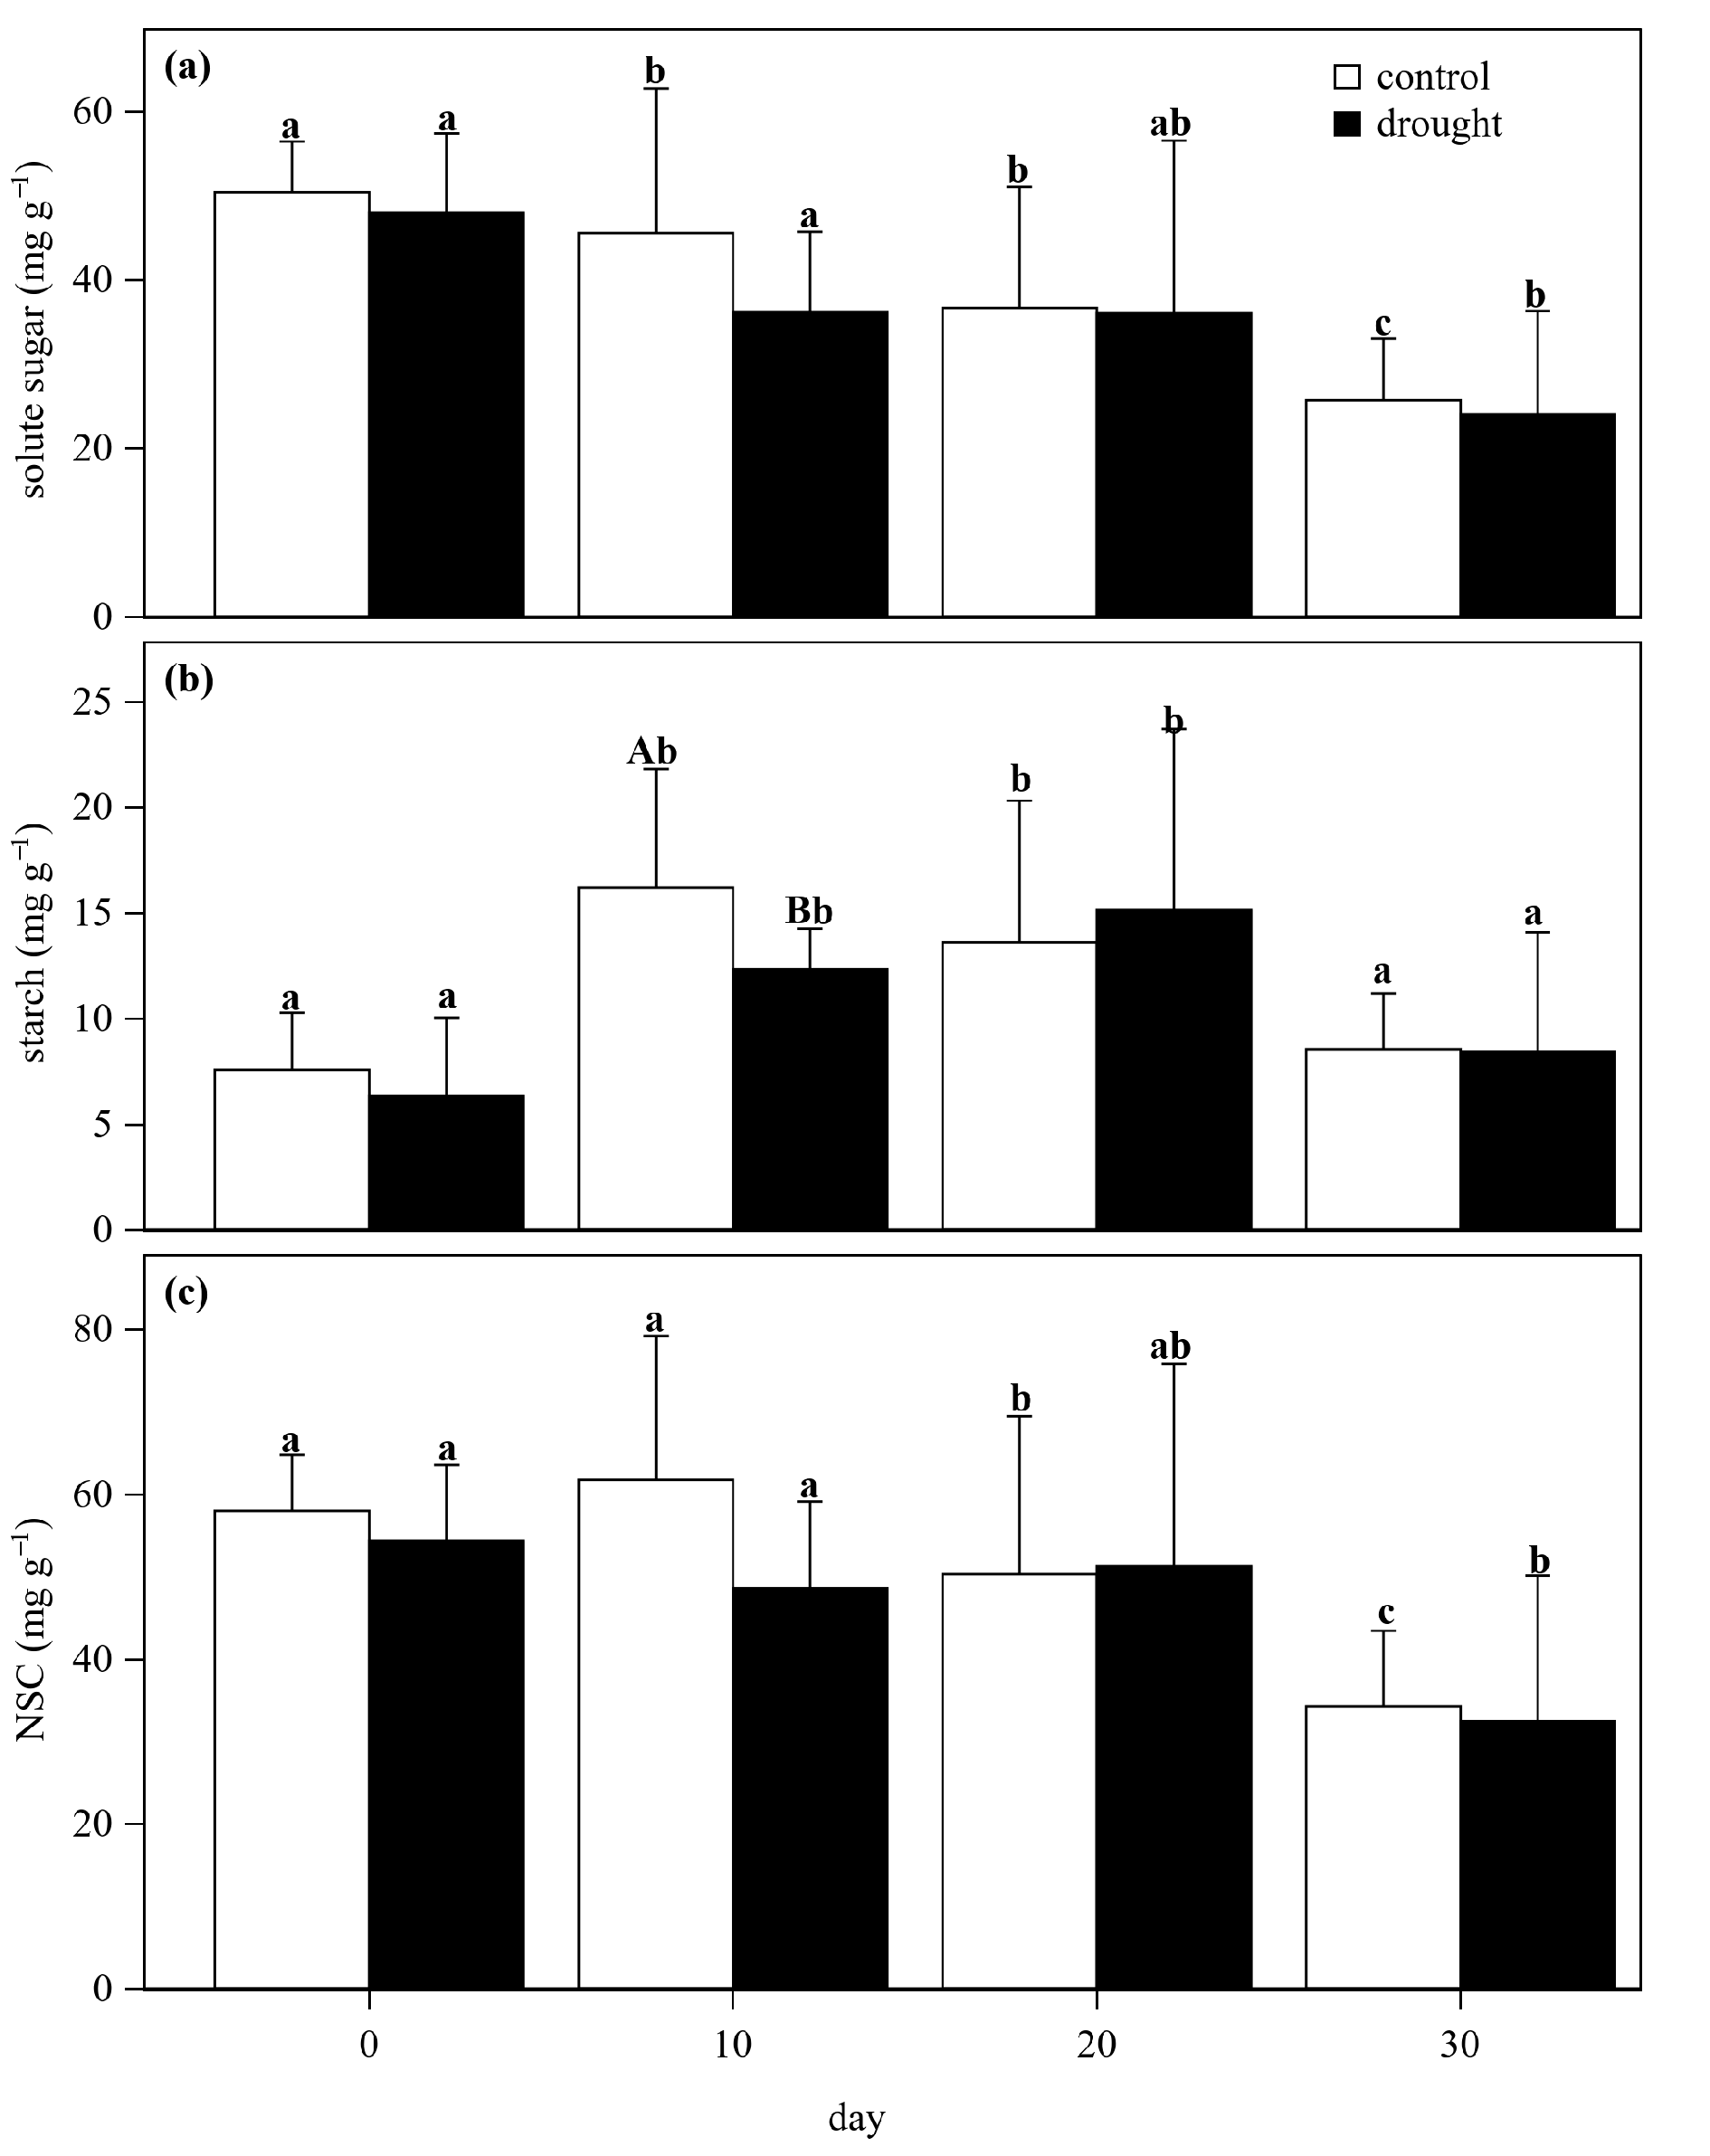
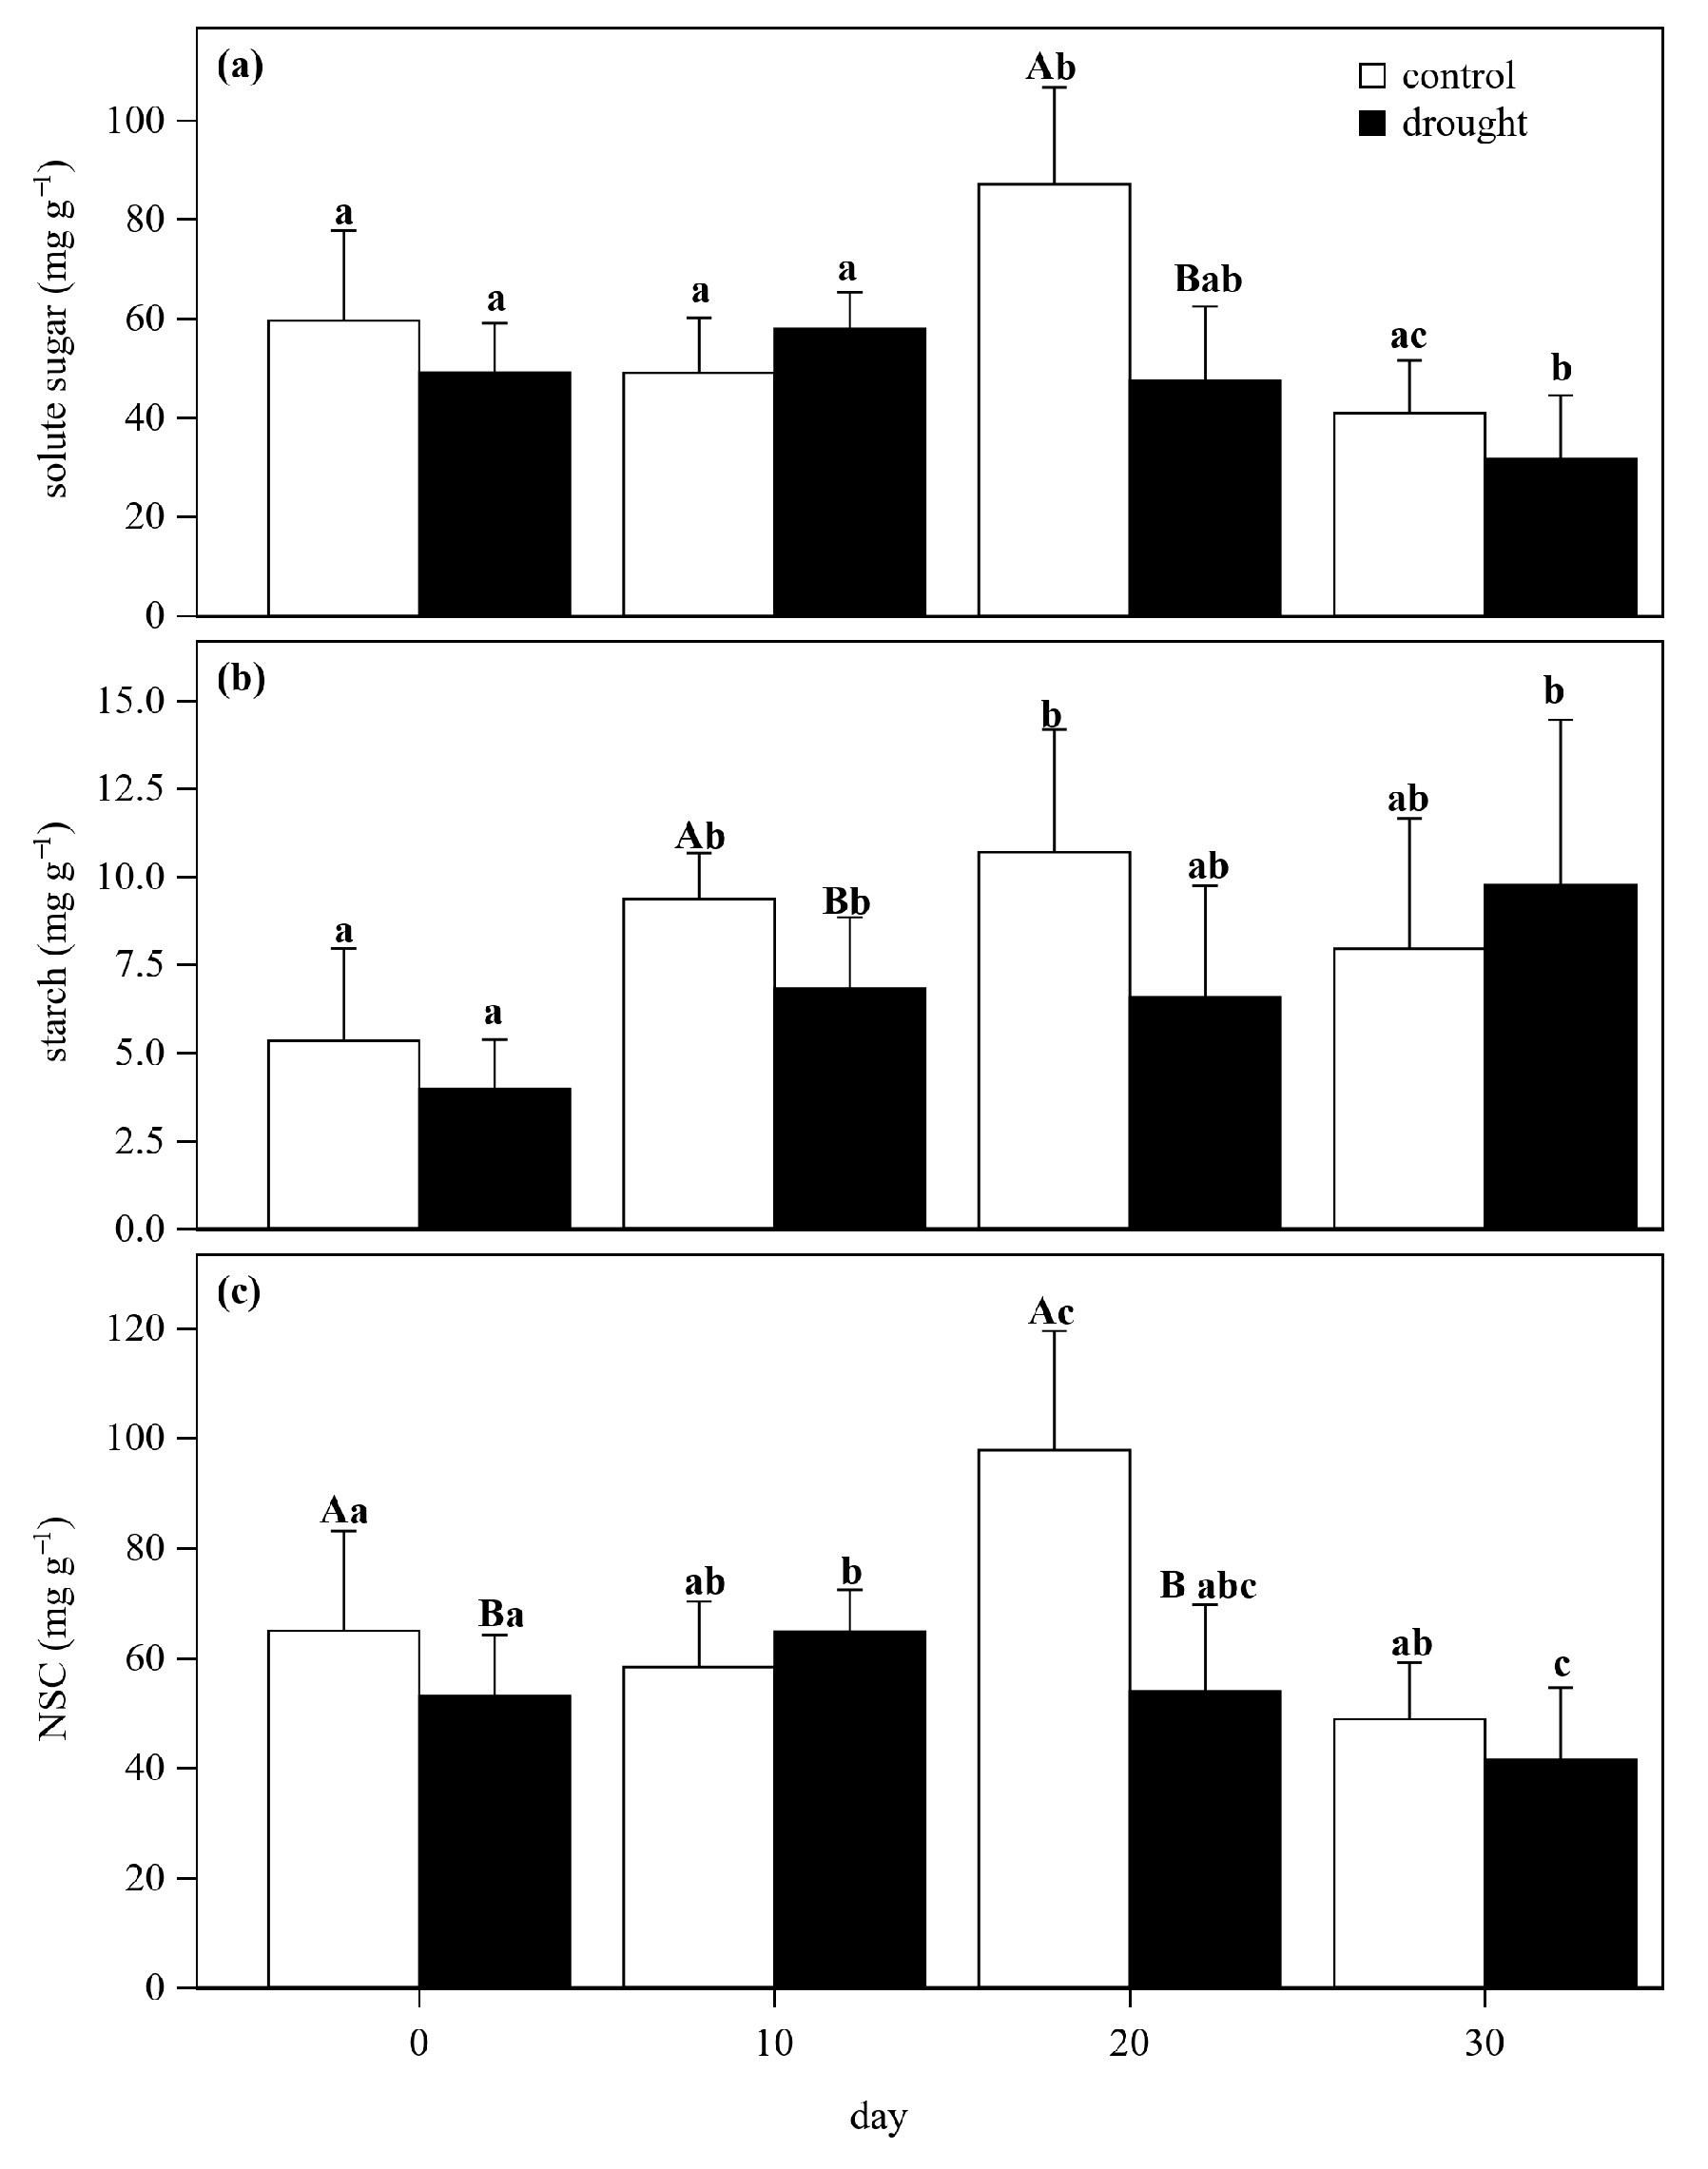
3.2. Nonstructural Carbon Dynamics

On all four measurement days, the solute sugar concentrations of all organs (leaf, stem, and root) were significantly higher than the starch concentrations (p < 0.05; Figure 5, Figure 6 and Figure 7), accounting for most parts of NSC (85 ± 6%, 77 ± 7%, 87 ± 5% in leaf, stem, and root, respectively). In all the organs, the concentrations of solute sugar and NSC on day 30 were significantly lower than those on day 0 (p < 0.05; Figure 5, Figure 6 and Figure 7). However, the concentration of starch between these two days was not significantly different in the leaves and stems or even higher in the roots on day 30 (p < 0.05; Figure 7b).

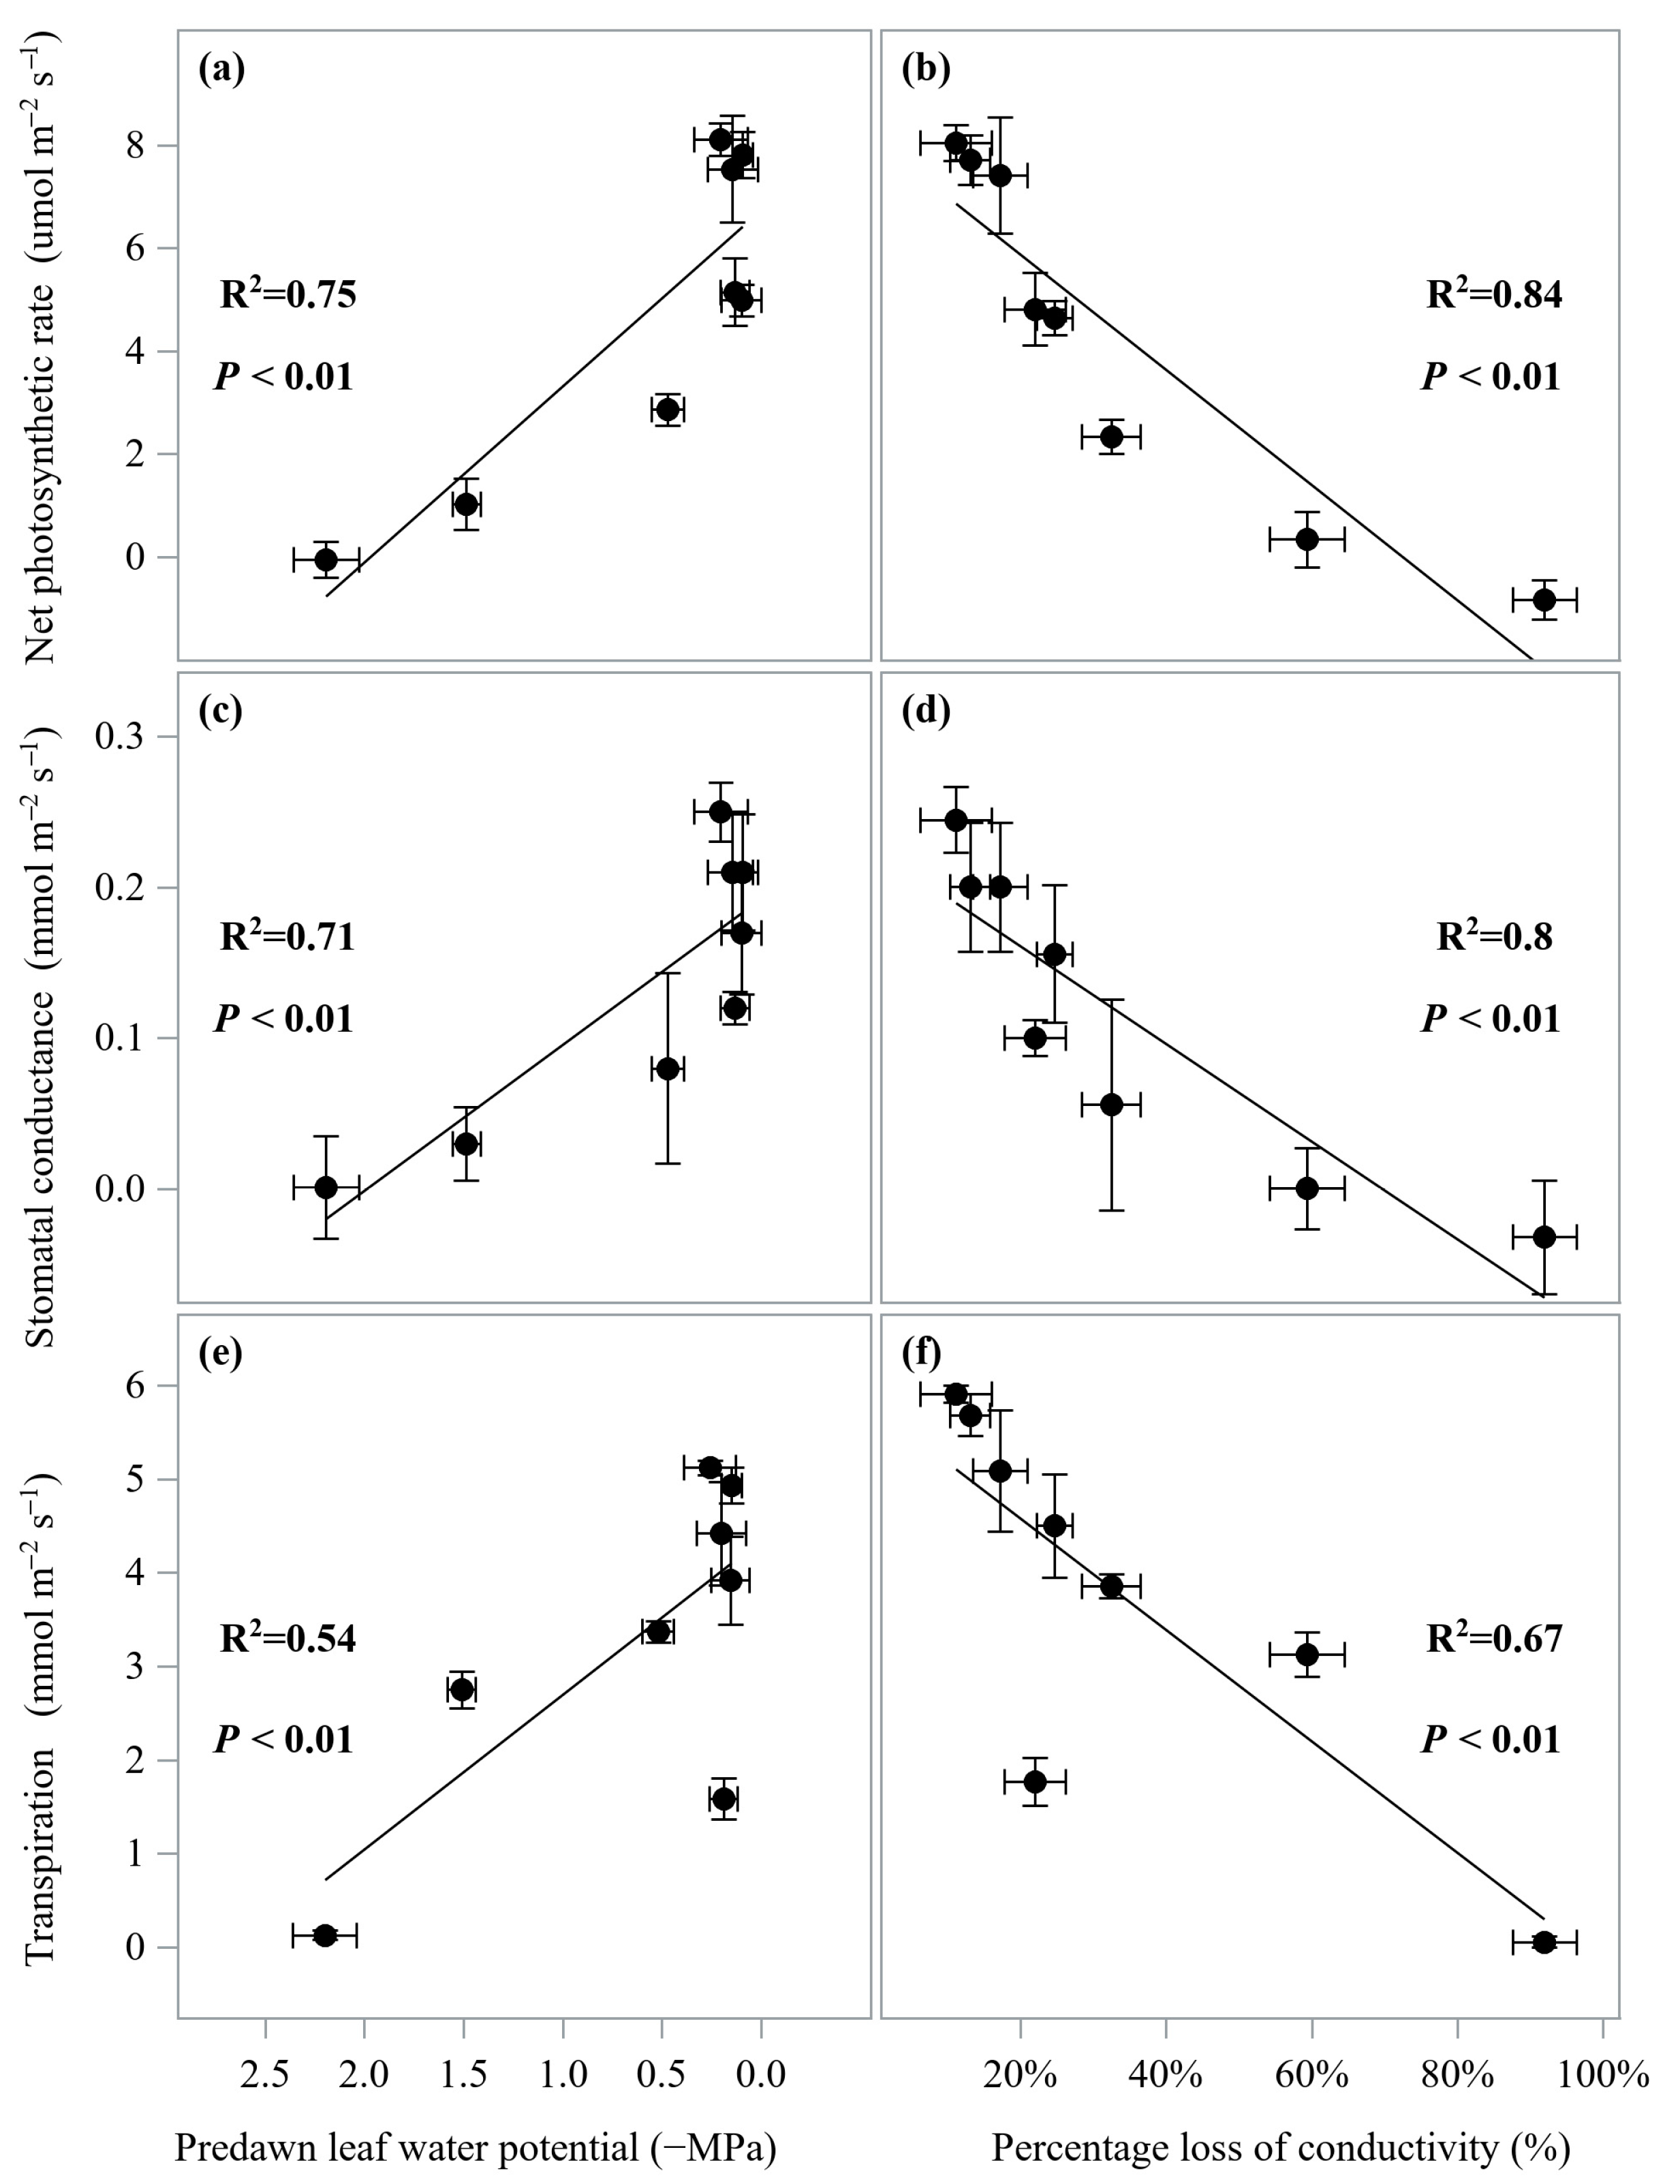
3.3. Correlation among Traits

Leaf water potential, stem PLC, and Pn were significantly correlated with SWC (p < 0.05; Figure 8). Among them, leaf water potential and Pn were significantly and positively correlated with SWC, while stem PLC was negatively correlated. Moreover, PLC was significantly and negatively correlated with leaf water potential (p < 0.05; Figure 9). Leaf Pn, gs, and Tr were all significantly and positively correlated with leaf water potential and significantly and negatively correlated with stem PLC (p < 0.05; Figure 10). However, none of these parameters were correlated with changes in NSC (p > 0.05).

4. Discussion

In this study, the dynamics of leaf water potential and the stem PLC of seedlings in the drought-treated group are in line with the previous study on Masson pine [17]. The sustained drought gradually decreased the water supply by embolizing the hydraulic paths, which worsened the water status of leaves [33,36]. However, the stem PLC exceeded 50% and 85% on days 20 and 30 after the onset of the drought under a high temperature (~32 °C in daytime and 28 °C in nighttime), which took largely fewer days (~half time) than the drought experiment at a mild temperature condition [17]. The faster increase in PLC at the condition of drought and high temperature means less water supply to Masson pine seedlings, which caused the relative water content to decrease faster to ~60% and 50% when PLC reached 50% and 85% [17,18]. In the study by Duan et al., the seedlings were regularly rewatered for 15 days after the PLC reached 50% and 85%, and then they observed 0% and 75% mortality rates at the two PLC levels, respectively [17]. Additionally, under the higher temperature, the time for PLC changing from 50% to 85% under drought stress was less (10 days) than that under a mild temperature (~25 days) [17,18].
Our results (Figure 4) confirmed the previous findings by other studies, i.e., drought constrained the leaf gas exchange and reduced carbon sequestration [18,21,23,37]. Stomatal closure is a fast defensive mechanism for plants to cope with drought stress, which can protect plants from dehydration and damage to the transportation ability of vascular systems [36]. However, when plants face a sustained drought, the vascular systems were further damaged and inversely constrained the leaf water status and gas exchange [17]. In this study, the gas exchange traits (Pn, gs, and Tr) of Masson pine seedlings were significantly and negatively correlated with the stem PLC and positively with the leaf water potential (Figure 10). The quick decrease in Pn meant less or even no carbon sequestration, which may cause Masson pine seedlings to deplete carbon storage to maintain physiological activity.
As one of the two most common drought-induced mortality mechanisms, carbon starvation has usually been linked to the depletion of NSC [14,29]. The carbon starvation hypothesis proposed that the trees would approach death under a sustained drought due to the depletion of all stored carbon caused by the limitation or shutdown of carbon fixation. In this study, we found that in all the organs, the concentrations of solute sugar and NSC on day 30 were significantly lower than those on day 0 (Figure 5, Figure 6 and Figure 7). The results contrast with the previous studies on Masson pine seedlings [17,37] in which NSC fluctuated over the drought process and was higher at the end of the drought treatment. The contrasting results may be attributed to the different stress levels, as this study had a more stressful condition when incorporating a high temperature the drought design. Considering the largely decreased photosynthesis, the depletion of NSC reflected an imbalanced carbon budget, which further implied that carbon starvation might play a role in inducing the mortality of Masson pine seedlings. However, the role of carbon starvation may not be as significant as hydraulic failure. Unlike the significantly increasing PLC within the drought development (Figure 3), NSC remained a more constant trend before it was significantly reduced on day 30 (Figure 5, Figure 6 and Figure 7). The results indicate that the adjustment or response of hydraulic traits precedes that of NSC. On day 30, PLC reached 85% but NSC was not fully depleted. The non-synchronization between PLC and NSC led to a non-significant relationship between them, which agrees with the previous finding [17].

5. Conclusions

Compared with previous studies, this study demonstrated that high temperature accelerated the drought response of Masson pine seedlings, leading the seedlings to mortality risk sooner. Additionally, within the drought development, hydraulic dysfunction preceded the carbohydrate depletion, which may indicate a more significant role for the percentage loss of hydraulic conductivity than nonstructural carbohydrate depletion on the drought-induced mortality. The findings can improve our understanding of drought-coping strategies of Masson pine and provide some theoretical basis for Masson pine forest management.

Author Contributions

Conceptualization, D.F. and S.J.; data curation, D.F.; formal analysis, D.F.; funding acquisition, D.F. and S.J.; investigation, D.F., H.Y., Y.H., W.L. and T.M.; methodology, D.F., H.Y., Y.H., W.L. and T.M.; project administration, S.J.; resources, D.F.; software, D.F. and H.Y.; supervision, S.J.; validation, D.F., Y.H., T.M. and S.J.; visualization, D.F.; writing—original draft, D.F., H.Y. and T.M.; writing—review and editing, D.F., H.Y., Y.H., W.L., T.M. and S.J. All authors have read and agreed to the published version of the manuscript.

Funding

This research was funded by the National Key Research and Development Project (2019YFE0118900), the National Natural Science Foundation of China (31971641), and the Scientific Research Foundation of Jiyang College of Zhejiang A &F University (grant number: 05251700038).

Data Availability Statement

The data presented in this study are available on request from the corresponding author.

Conflicts of Interest

The authors declare no conflict of interest.

References

  1. Adams, H.D.; Macalady, A.K.; Breshears, D.D.; Allen, C.D.; Stephenson, N.L.; Saleska, S.R.; Huxman, T.E.; McDowell, N.G. Climate-Induced Tree Mortality: Earth System Consequences. Eos Trans. Am. Geophys. Union 2010, 91, 153–154. [Google Scholar] [CrossRef]
  2. Allen, C.D.; Macalady, A.K.; Chenchouni, H.; Bachelet, D.; McDowell, N.; Vennetier, M.; Kitzberger, T.; Rigling, A.; Breshears, D.D.; Hogg, E.H.; et al. A Global Overview of Drought and Heat-Induced Tree Mortality Reveals Emerging Climate Change Risks for Forests. For. Ecol. Manag. 2010, 259, 660–684. [Google Scholar] [CrossRef]
  3. Klein, T.; Hartmann, H. Climate Change Drives Tree Mortality. Science 2018, 362, 758. [Google Scholar] [CrossRef]
  4. Powers, J.S.; Vargas, G.G.; Brodribb, T.J.; Schwartz, N.B.; Pérez-Aviles, D.; Smith-Martin, C.M.; Becknell, J.M.; Aureli, F.; Blanco, R.; Calderón-Morales, E.; et al. A Catastrophic Tropical Drought Kills Hydraulically Vulnerable Tree Species. Glob. Chang. Biol. 2020, 26, 3122–3133. [Google Scholar] [CrossRef]
  5. Senf, C.; Buras, A.; Zang, C.S.; Rammig, A.; Seidl, R. Excess Forest Mortality Is Consistently Linked to Drought across Europe. Nat. Commun. 2020, 11, 6200. [Google Scholar] [CrossRef]
  6. IPCC. Global Warming of 1.5 °C. An IPCC Special Report on the Impacts of Global Warming of 1.5 °C above Pre-Industrial Levels and Related Global Greenhouse Gas Emission Pathways, in the Context of Strengthening the Global Response to the Threat of Climate Change, Sustainable Development, and Efforts to Eradicate Poverty; Masson-Delmotte, V., Zhai, P., Pörtner, H.-O., Roberts, D., Skea, J., Shukla, P.R., Pirani, A., Moufouma-Okia, W., Péan, C., Pidcock, R., et al., Eds.; World Meteorological Organization: Geneva, Switzerland, 2018. [Google Scholar]
  7. IPCC. Climate Change 2022: Impacts, Adaptation and Vulnerability. Contribution of Working Group II to the Sixth Assessment Report of the Intergovernmental Panel on Climate Change; Pörtner, H.-O., Roberts, D.C., Tignor, M., Poloczanska, E.S., Mintenbeck, K., Alegría, A., Craig, M., Langsdorf, S., Löschke, S., Möller, V., et al., Eds.; Cambridge University Press: Cambridge, UK; New York, NY, USA, 2022. [Google Scholar]
  8. FAO. Proactive Approaches to Drought Preparedness—Where Are We Now and Where Do We Go from Here? FAO: Rome, Italy, 2019. [Google Scholar]
  9. Hoerling, M.; Eischeid, J.; Kumar, A.; Leung, R.; Mariotti, A.; Mo, K.; Schubert, S.; Seager, R. Causes and Predictability of the 2012 Great Plains Drought. Bull. Am. Meteorol. Soc. 2014, 95, 269–282. [Google Scholar] [CrossRef]
  10. Yuan, X.; Ma, Z.; Pan, M.; Shi, C. Microwave Remote Sensing of Short-term Droughts during Crop Growing Seasons. Geophys. Res. Lett. 2015, 42, 4394–4401. [Google Scholar] [CrossRef]
  11. Yuan, X.; Wang, L.; Wu, P.; Ji, P.; Sheffield, J.; Zhang, M. Anthropogenic Shift towards Higher Risk of Flash Drought over China. Nat. Commun. 2019, 10, 4661. [Google Scholar] [CrossRef]
  12. Jentsch, A.; Kreyling, J.; Beierkuhnlein, C. A New Generation of Climate-Change Experiments: Events, Not Trends. Front. Ecol. Environ. 2007, 5, 365–374. [Google Scholar] [CrossRef]
  13. O’Brien, M.J.; Ong, R.; Reynolds, G. Intra-Annual Plasticity of Growth Mediates Drought Resilience over Multiple Years in Tropical Seedling Communities. Glob. Chang. Biol. 2017, 23, 4235–4244. [Google Scholar] [CrossRef] [PubMed]
  14. Choat, B.; Jansen, S.; Brodribb, T.J.; Cochard, H.; Delzon, S.; Bhaskar, R.; Bucci, S.J.; Feild, T.S.; Gleason, S.M.; Hacke, U.G.; et al. Global Convergence in the Vulnerability of Forests to Drought. Nature 2012, 491, 752–755. [Google Scholar] [CrossRef] [PubMed]
  15. Xu, L.; Chen, N.; Zhang, X. A Comparison of Large-Scale Climate Signals and the North American Multi-Model Ensemble (NMME) for Drought Prediction in China. J. Hydrol. 2018, 557, 378–390. [Google Scholar] [CrossRef]
  16. Duan, H.; Resco de Dios, V.; Wang, D.; Zhao, N.; Huang, G.; Liu, W.; Wu, J.; Zhou, S.; Choat, B.; Tissue, D.T. Testing the Limits of Plant Drought Stress and Subsequent Recovery in Four Provenances of a Widely Distributed Subtropical Tree Species. Plant Cell Environ. 2022, 45, 1187–1203. [Google Scholar] [CrossRef] [PubMed]
  17. Duan, H.; Shao, C.; Luo, X.; Resco de Dios, V.; Tissue, D.T.; Ding, G. Root Relative Water Content Is a Potential Signal for Impending Mortality of a Subtropical Conifer during Extreme Drought Stress. Plant Cell Environ. 2023, 46, 2763–2777. [Google Scholar] [CrossRef] [PubMed]
  18. Shao, C.; Duan, H.; Ding, G.; Luo, X.; Fu, Y.; Lou, Q. Physiological and Biochemical Dynamics of Pinus massoniana Lamb. Seedlings under Extreme Drought Stress and during Recovery. Forests 2022, 13, 65. [Google Scholar] [CrossRef]
  19. Ding, G.; Zhou, Z.; Wang, Z. Cultivation and Utilization of Pulpwood Stand for Pinus massoniana; China Forestry Publishing House: Beijing, China, 2006. [Google Scholar]
  20. Tong, C.; Zhang, X.; Xie, J.; Mei, T.; Fang, D.; Li, Y. Water Use Strategies of Different Aged Moso Bamboo Culms under Summer Drought. For. Ecol. Manag. 2021, 498, 119567. [Google Scholar] [CrossRef]
  21. Yu, F.; Xu, X.; Guy, R. Effects of Water Plus Heat Stress on Gas Exchange and Water Use Efficiency in Four Species of Coniferous Seedlings. Sci. Silvae Sin. 2004, 40, 38–44. [Google Scholar]
  22. Wang, Y.; ZHAN, C.; Ding, G.; LI, Z. Effect of Water Stress on Physiology and Photosynthesis Properties of Ectomycorrhizal Pinus massoniana Seedlings. J. Zhejiang For. Sci. Technol. 2019, 39, 471. [Google Scholar]
  23. Deng, X.; Shi, Z.; Xiao, W.; Zeng, L.; Lei, L. Effects of Drought and Shading on Growth and Photosynthetic Characteristics of Pinus massoniana Seedlings. Acta Ecol. Sin. 2020, 40, 2735–2742. [Google Scholar]
  24. Du, M.; Ding, G.; Zhao, X. Responses to Continuous Drought Stress and Drought Resistance Comprehensive Evaluation of Different Masson Pine Families. Sci. Silvae Sin. 2017, 53, 21–29. [Google Scholar]
  25. Li, M.; Wang, H.; Zhao, X.; Lu, Z.; Sun, X.; Ding, G. Role of Suillus placidus in Improving the Drought Tolerance of Masson Pine (Pinus massoniana Lamb.) Seedlings. Forests 2021, 12, 332. [Google Scholar] [CrossRef]
  26. Quan, W.; Ding, G. Root Tip Structure and Volatile Organic Compound Responses to Drought Stress in Masson Pine (Pinus massoniana Lamb.). Acta Physiol. Plant. 2017, 39, 258. [Google Scholar] [CrossRef]
  27. Wang, Y.; Ding, G. Physiological Responses of Mycorrhizal Pinus massoniana Seedlings to Drought Stress and Drought Resistance Evaluation. Chin. J. Appl. Ecol. 2013, 24, 639–645. [Google Scholar]
  28. Shi, Z.; Deng, X.; Zeng, L.; Shi, S.; Lei, L.; Xiao, W. Acclimation Strategy of Masson Pine (Pinus massoniana) by Limiting Flavonoid and Terpenoid Production under Low Light and Drought. Int. J. Mol. Sci. 2022, 23, 8441. [Google Scholar] [CrossRef] [PubMed]
  29. Anderegg, W.R.L.; Anderegg, L.D.L.; Kerr, K.L.; Trugman, A.T. Widespread Drought-Induced Tree Mortality at Dry Range Edges Indicates That Climate Stress Exceeds Species’ Compensating Mechanisms. Glob. Chang. Biol. 2019, 25, 3793–3802. [Google Scholar] [CrossRef] [PubMed]
  30. Sevanto, S.; Mcdowell, N.G.; Dickman, L.T.; Pangle, R.; Pockman, W.T. How Do Trees Die? A Test of the Hydraulic Failure and Carbon Starvation Hypotheses. Plant Cell Environ. 2014, 37, 153–161. [Google Scholar] [CrossRef]
  31. Tomasella, M.; Casolo, V.; Aichner, N.; Petruzzellis, F.; Savi, T.; Trifilò, P.; Nardini, A. Non-Structural Carbohydrate and Hydraulic Dynamics during Drought and Recovery in Fraxinus Ornus and Ostrya Carpinifolia Saplings. Plant Physiol. Biochem. 2019, 145, 1–9. [Google Scholar] [CrossRef]
  32. Tomasella, M.; Nardini, A.; Hesse, B.D.; Machlet, A.; Matyssek, R.; Häberle, K.-H. Close to the Edge: Effects of Repeated Severe Drought on Stem Hydraulics and Non-Structural Carbohydrates in European Beech Saplings. Tree Physiol. 2019, 39, 717–728. [Google Scholar] [CrossRef]
  33. Rowland, L.; Ramírez-Valiente, J.-A.; Hartley, I.P.; Mencuccini, M. How Woody Plants Adjust Above- and below-Ground Traits in Response to Sustained Drought. New Phytol. 2023, 239, 1173–1189. [Google Scholar] [CrossRef]
  34. Sperry, J.S.; Donnelly, J.R.; Tyree, M.T. A Method for Measuring Hydraulic Conductivity and Embolism in Xylem. Plant Cell Environ. 1988, 11, 35–40. [Google Scholar] [CrossRef]
  35. Hernández, E.I.; Vilagrosa, A.; Pausas, J.G.; Bellot, J. Morphological Traits and Water Use Strategies in Seedlings of Mediterranean Coexisting Species. Plant Ecol. 2010, 207, 233–244. [Google Scholar] [CrossRef]
  36. Gupta, A.; Rico-Medina, A.; Caño-Delgado, A.I. The Physiology of Plant Responses to Drought. Science 2020, 368, 266–269. [Google Scholar] [CrossRef] [PubMed]
  37. Deng, X.; Xiao, W.; Shi, Z.; Zeng, L.; Lei, L. Combined Effects of Drought and Shading on Growth and Non-Structural Carbohydrates in Pinus massoniana Lamb. Seedlings. Forests 2019, 11, 18. [Google Scholar] [CrossRef]
Figure 1. Dynamic of soil water content in the drought-treated pots compared to those in control. Values are arithmetical means ± SD (n = 5,) and SD stands for standard deviation.
Forests 14 02320 g001
Figure 2. Dynamic of (a) predawn and (b) midday leaf water potential in the drought-treated and control pots. Values are arithmetical means ± SD (n = 5), and SD stands for standard deviation. The different upper-case letters on a measurement day indicate significant differences between treatments, and the different lower-case letters on the same treatment indicate significant differences between measurement days (p < 0.05).
Forests 14 02320 g002
Figure 3. Dynamic of percentage loss of conductivity (PLC) of the drought-treated and control Masson pine (Pinus massoniana Lamb.) seedlings. Values are arithmetical means ± SD (n = 5), and SD stands for standard deviation. The different upper-case letters on a measurement day indicate significant differences between treatments, and the different lower-case letters on the same treatment indicate significant differences between measurement days (p < 0.05).
Forests 14 02320 g003
Figure 4. Dynamic of (a) net photosynthetic rate, (b) stomatal conductance, and (c) transpiration of the drought-treated and control Masson pine (Pinus massoniana Lamb.) seedlings. Values are arithmetical means ± SD (n = 5), and SD stands for standard deviation. The different upper-case letters on a measurement day indicate significant differences between treatments, and the different lower-case letters on the same treatment indicate significant differences between measurement days (p < 0.05).
Forests 14 02320 g004
Figure 5. Dynamic of leaf (a) solute sugar, (b) starch, and (c) nonstructural carbohydrates of the drought-treated and control Masson pine (Pinus massoniana Lamb.) seedlings. Values are arithmetical means ± SD (n = 5), and SD stands for standard deviation. The different upper-case letters on a measurement day indicate significant differences between treatments, and the different lower-case letters on the same treatment indicate significant differences between measurement days (p < 0.05).
Forests 14 02320 g005
Figure 6. Dynamic of stem (a) solute sugar, (b) starch, and (c) nonstructural carbohydrates of the drought-treated and control Masson pine (Pinus massoniana Lamb.) seedlings. Values are arithmetical means ± SD (n = 5), and SD stands for standard deviation. The different upper-case letters on a measurement day indicate significant differences between treatments, and the different lower-case letters on the same treatment indicate significant differences between measurement days (p < 0.05).
Forests 14 02320 g006
Figure 7. Dynamic of root (a) solute sugar, (b) starch, and (c) nonstructural carbohydrates (NSC) of the drought-treated and control Masson pine (Pinus massoniana Lamb.) seedlings. Values are arithmetical means ± SD (n = 5), and SD stands for standard deviation. The different upper-case letters on a measurement day indicate significant differences between treatments, and the different lower-case letters on the same treatment indicate significant differences between measurement days (p < 0.05).
Forests 14 02320 g007
Figure 8. The response of (a) predawn leaf water potential (Ψpd), (b) leaf water potential (Ψmd), (c) percentage loss of conductivity (PLC), and (d) net photosynthetic rate (Pn) of both the drought-treated and control Masson pine (Pinus massoniana Lamb.) seedlings to the soil water content.
Forests 14 02320 g008
Figure 9. The correlation of stem percentage loss of conductivity (PLC) and predawn leaf water potential of both the drought-treated and control Masson pine (Pinus massoniana Lamb.) seedlings.
Forests 14 02320 g009
Figure 10. The (a,b) net photosynthetic rate, (c,d) stomatal conductance, and (e,f) transpiration in relation to the stem percentage loss of conductivity (left column) and predawn leaf water potential (right column) of both the drought-treated and control Masson pine (Pinus massoniana Lamb.) seedlings.
Forests 14 02320 g010
Disclaimer/Publisher’s Note: The statements, opinions and data contained in all publications are solely those of the individual author(s) and contributor(s) and not of MDPI and/or the editor(s). MDPI and/or the editor(s) disclaim responsibility for any injury to people or property resulting from any ideas, methods, instructions or products referred to in the content.

