Article

Effects of Different Nitrogen Application Rates on Root Growth and Distribution of Fine Root Length across Diameter Classes of Wolfberry (Lycium barbarum L.)

1
Key Laboratory of Forest Silviculture and Conservation of the Ministry of Education, The College of Forestry, Beijing Forestry University, Beijing 100083, China
2
National Wolfberry Engineering Research Center, Wolfberry Science Research Institute, Ningxia Academy of Agriculture and Forestry Sciences, Yinchuan 750002, China
*
Author to whom correspondence should be addressed.
Forests 2023, 14(12), 2317; https://doi.org/10.3390/f14122317
Submission received: 14 October 2023 / Revised: 10 November 2023 / Accepted: 23 November 2023 / Published: 25 November 2023
(This article belongs to the Section Forest Ecophysiology and Biology)

Abstract

:
The optimized cultivation process of wolfberry (Lycium barbarum L.) to maintain a consistently high and stable yield relies on the prolonged use of significant amounts of nitrogen fertilizers. However, this practice leads to increased production costs and various issues, such as soil pollution and compaction. To address these concerns, a three-year field trial was conducted involving different nitrogen application rates: N1 (20% nitrogen (N) reduction, 540 kg·hm−2), N2 (medium N, 675 kg·hm−2), and N3 (20% nitrogen increase, 810 kg·hm−2). The results showed that the inter-annual growth and development of wolfberry roots had two rapid growth peaks. In comparison with the N3 treatment, the root morphological characteristics index increased significantly under the N1 and N2 treatments. Among the different diameter classes, the most significant increase in fine root length, with an average diameter between 0.4 and 0.8 mm, occurred under the N1, N2, and N3 treatments, accounting for 50.6%, 50.92%, and 47.72% of the total annual growth of root length increments, respectively. Concerning the distribution of fine roots, the active layer depth extended under the N2 treatment suggesting that medium nitrogen application favored the longitudinal extension of fine roots. Leaf nitrogen content and the chlorophyll meter values (SPAD values) in the upper part of the plant, at the tip of shoots/branches, were the most sensitive indicators to changes in nitrogen application rates. These values increased significantly with higher nitrogen application amounts. Similarly, the contents of total sugar, betaine, and β-carotene increased with increasing nitrogen application rates, while the contents of Lycium barbarum polysaccharides (LBPs) and total flavonoids decreased. Finally, based on a comprehensive principal component evaluation, the rankings for root growth and plant development under various nitrogen application treatments were as follows: N2 (1.891) > N1 (0.002) > N3 (−1.894). The results showed that both the aboveground and belowground growth and development of wolfberry plants were most optimized under the N2 treatment. These findings provide a foundational reference for constructing good root morphology of wolfberry through cultivation practices such as nitrogen fertilizer management.

1. Introduction

Wolfberry is a perennial deciduous shrub of the genus Lycium in the Solanaceae family. It is one of the oldest living plant species with a discrete distribution in the world, mainly in temperate and subtropical regions in Eurasia, North America, South America, southern Africa, and Australia [1,2]. In China, a total of seven species and three varieties of wolfberry plants are naturally found. Wolfberry is highly regarded as China’s herbal treasure, and its fruits are abundant in essential biological components, such as Lycium barbarum polysaccharides, flavonoids, and carotenoids. It is a distinctive plant in Ningxia, renowned for its dual role as “medicine and food”, offering benefits such as kidney tonification, liver nourishment, lung moisture, vision enhancement, immune system support, antiaging properties, and antitumor potential [3]. Ningxia serves as the native habitat and primary production region for wolfberry, and its cultivation traces back to the Tang and Song dynasties [4]. In recent years, with the development of the wolfberry industry, the planting area of wolfberry has been expanding continuously to many ecological regions such as Qinghai, Xinjiang, Inner Mongolia, and Gansu. However, the most authentic wolfberry finished product is still produced from the Ningxia wolfberry.
Nitrogen is an essential nutrient for plant growth, yield, and fruit quality [5]. In the agricultural system, large amounts of nitrogen fertilizer are applied to maintain the high and stable yield of crops for a long time, but a large portion of the nitrogen stored in the soil is not absorbed by crops and is lost through leaching. In addition, the excessive application of nitrogen fertilizer causes not only an increase in production costs but also serious environmental pollution, which comes from various processes such as eutrophication in terrestrial and aquatic ecosystems, global ocean acidification, and stratospheric ozone depletion [6]. Since the 1980s, the use of nitrogen fertilizer in China has seen a substantial increase, while the efficiency of this input has significantly dropped. On average, the utilization efficiencies for the three types of fertilizers, namely, nitrogen, phosphorus, and potassium, were 27.2%, 11.1%, and 31.1%, respectively. These values are notably lower in the vast regions with less fertile soils in Northwest China compared with the national averages [7,8].
The yield and quality of wolfberry fruits are greatly dependent on fertilizers, especially the availability of soil nitrogen, phosphorus, and potassium. Some studies have already been published on the effect of nitrogen fertilizer application on the yield and quality of wolfberry fruit. Some scholars have concluded that with the increase in fertilizer application under the drip irrigation system, the number of fruit branches, new branches, and the longest new branches of wolfberry plants increased significantly, and the yields were in the order of high fertilizer > medium fertilizer > conventional fertilizer > low fertilizer > nonfertilizer (control) [9]. Some scholars have found no significant difference in the yield and commodity grade of wolfberry fruits under different nitrogen levels. However, with the increase in nitrogen application, the contents of the main nutrients of wolfberry changed [10]. On the other hand, certain scholars propose that reducing the nitrogen application rate by 40% to 60%, based on the customary nitrogen application methods of farmers and using nitrification inhibitors, can lead to higher yields and improved nitrogen absorption in wolfberry plants [11]. It is worth noting that both excessive and insufficient nitrogen fertilizer can hinder the growth and development of wolfberry plants. Therefore, it is crucial to adopt a scientific and balanced fertilization approach to ensure the high quality and yield of wolfberry. The root system, being highly sensitive to changes in the soil environment, has long been a challenging “black box” due to the difficulty in its observation. Consequently, during the cultivation process, fertilization and irrigation practices have traditionally been guided solely by the response of the above-ground parts of plants. While these agricultural practices serve the purpose of providing water and nutrients to some extent, there is undoubtedly room for improvement in maximizing the water and nutrient uptake and utilization efficiency of the root system. Therefore, it is of particular significance to investigate how the root growth and radial distribution of fine roots in wolfberry respond to different nitrogen application rates. The literature shows that a reasonable amount of water and fertilizer can promote the growth and development of crop plant roots, increase the contact area between roots and soil, and facilitate the absorption and utilization of soil water by roots, thereby improving the water and nitrogen utilization efficiency [12,13]. Plant root morphological characteristics are closely related to soil nitrogen levels. For example, studies on rice and other crops have demonstrated that root number, length, thickness, volume, dry mass, and total absorption area all increase with increasing nitrogen levels [14]. However, excess nitrogen supply may reduce the vertical extension of the root system, thereby reducing its capacity to absorb nutrients from deep soil layers and limiting its growth [15].
At present, the effects of different nitrogen levels on root growth and the distribution of fine root diameter are not clear. Furthermore, in scientific research and the practical breeding of wolfberry, the improvement of morphological and physiological characteristics of the root, a very important organ in the plant, has not been specifically reflected, which is due to the lack of knowledge and information about specific and clear root morphological traits related to nitrogen absorption and use efficiency. Therefore, it is necessary to determine the effects of different nitrogen application rates on root growth, morphological characteristics, and diameter distribution in wolfberry. To solve the abovementioned problems, the present study specified three objectives as follows: (1) To preliminarily determine the interannual growth and development peaks of the wolfberry root system through field experiments. (2) To investigate the root morphological characteristics and the distribution of the fine root diameter of wolfberry under the same field management practices and different nitrogen fertilization regimes. (3) To conduct a comprehensive assessment using principal component analysis and determine the ideal nitrogen fertilizer application rate; this aids in formulating strategies for managing the fine root structure in wolfberry plants. This research offers theoretical guidance for effective nitrogen application to main wolfberry varieties in Northwest China and serves as a strong foundation for improving the root morphology of wolfberry through cultivation practices, particularly nitrogen fertilizer management.

2. Materials and Methods

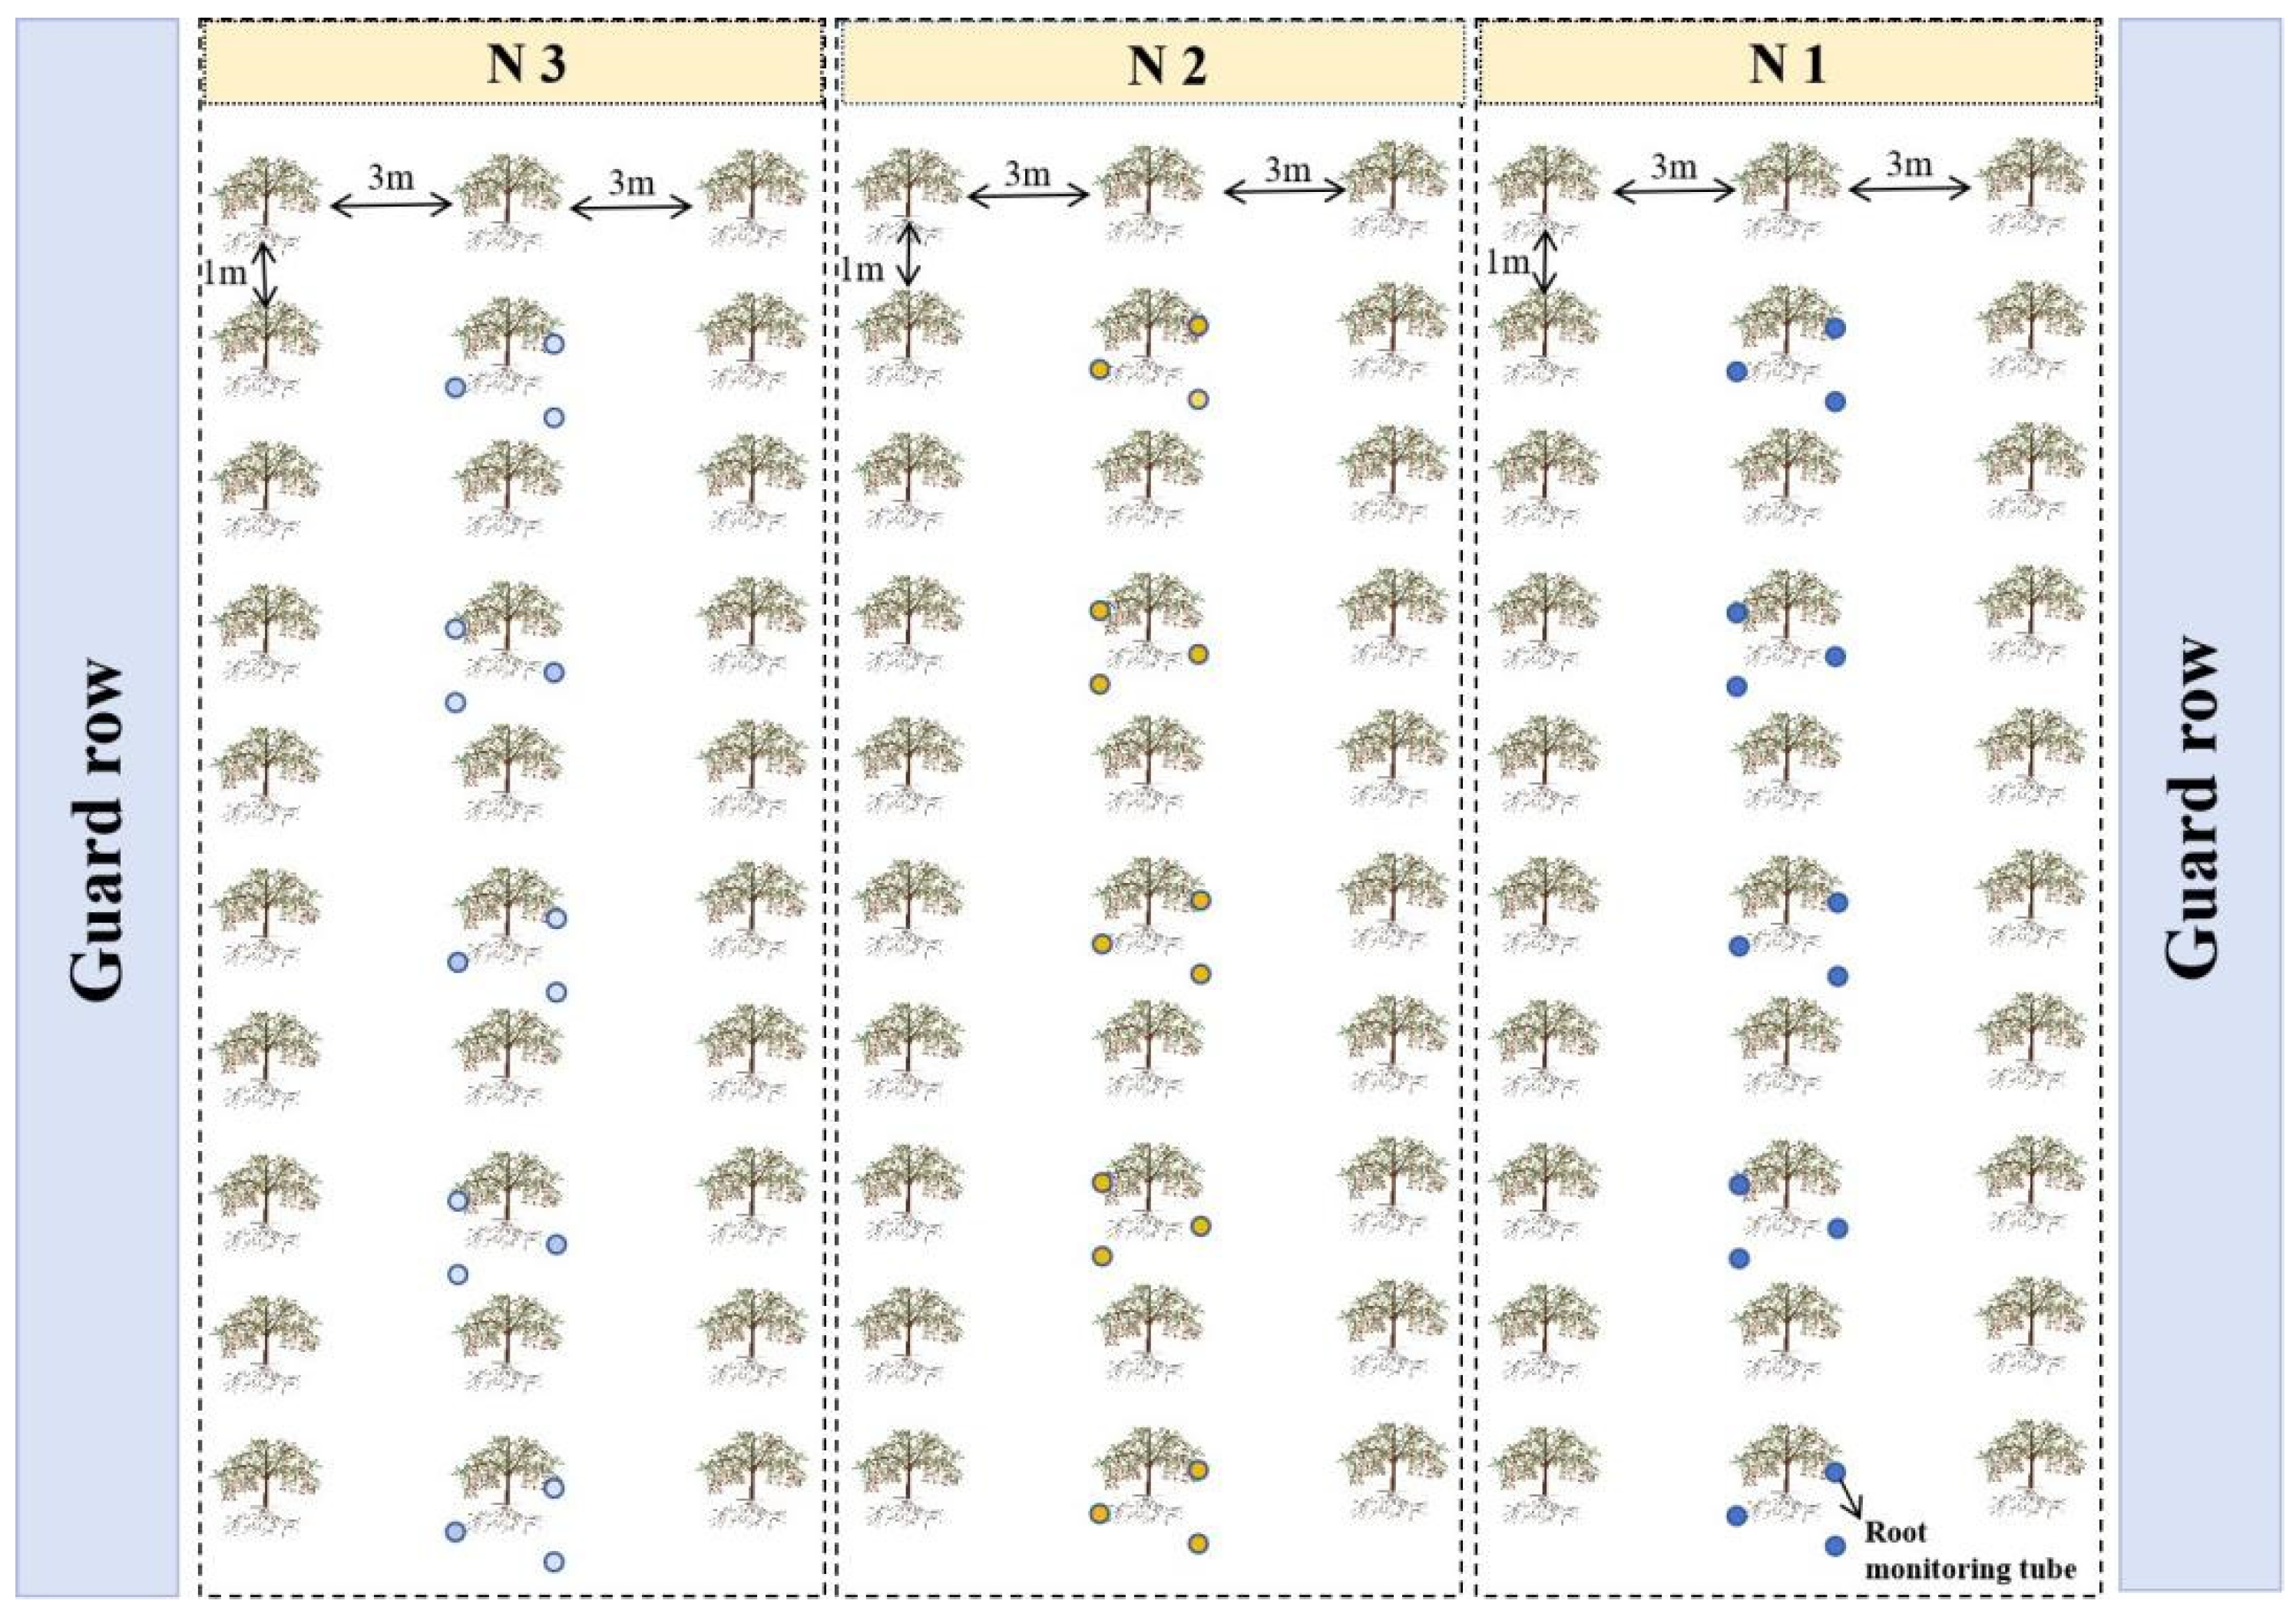
2.1. Basic Conditions of the Experimental Site and Experimental Design

The experiment was conducted at the base of Qiyuan Lvfeng Agriculture and Forestry Technology Co., LTD., Sanhe Town, Haiyuan County, Zhongwei City, Ningxia (106°09′00″ E, 36°25′48″ N, altitude of 1428.5 m) from April 2020 to September 2022, with an average annual precipitation of 367 mm and an average annual temperature of 7.5 °C. The terrain of the experiment was flat, with deep, high-quality, and uniformly fertile soils. The basic physical and chemical properties of the topsoil (0–20 cm) were a pH of 7.82, a total salt content of 3.02 g·kg−1, an organic matter content of 9.76 g·kg−1, a total nitrogen content of 1.25 g·kg−1, a total phosphorus content of 0.54 g·kg−1, a total potassium content of 11.4 g·kg−1, an available nitrogen content of 51.6 mg·kg−1, an available phosphorus content of 4.7 mg·kg−1, and an available potassium content of 118 mg·kg−1. The tested variety was the four-year-old Ningqi No. 7 plants, the main variety of wolfberry. The selected test materials had great growth potential with no pests or diseases.
The experiment followed a single-factor randomized block design, with each plot measuring 6 m × 9 m and the plants spaced 1 m apart within rows that were 3 m apart (Figure 1). We conducted a one-way analysis of variance (ANOVA) with three treatments and five replications. Treatments included ① N1 (low fertilizer): 20% nitrogen reduction, pure nitrogen of 540 kg·hm2; ② N2 (medium fertilizer): medium nitrogen, pure nitrogen of 675 kg·hm2; and ③ N3 (high fertilizer): increase nitrogen by 20%, pure nitrogen of N 810 kg·hm2, which is a local conventional nitrogen application amount. The nitrogen (N), phosphorus (P), and potassium (K) fertilizers used were urea (N 46%), superphosphate (P2O5 50%), and potassium sulfate (K2O 50%), respectively, and P and K fertilizers were applied at the same rate for each treatment, (450 kg·hm−2 and 300 kg·hm−2, respectively). According to the phenological period of wolfberry, these three fertilizers were applied in batches at 5 different fertilization times starting from approximately 20 April (the process of budding and unfolding), 20 May (green fruit stage), 15 June (fruit ripening process), late July to early August (fruiting period in autumn), and late September (resting period in autumn). Before 20 May, the application rates of nitrogen fertilizer accounted for more than 50% of the annual application amount, while those of phosphorus and potassium fertilizers accounted for less than 40% of the annual application amount. After June, however, the application rates of nitrogen fertilizer accounted for less than 50% of the annual fertilizer amount, and those of P and K fertilizers accounted for more than 60% of the annual fertilizer amount. This approach resulted in the creation of nitrogen gradients among the various treatments. Regarding field water management, we followed the traditional irrigation method commonly practiced by local farmers. This method typically involved watering within 1–2 days after fertilization or based on soil moisture (whether the soil was dry or wet). Irrigation was typically carried out approximately nine times throughout the growth period.

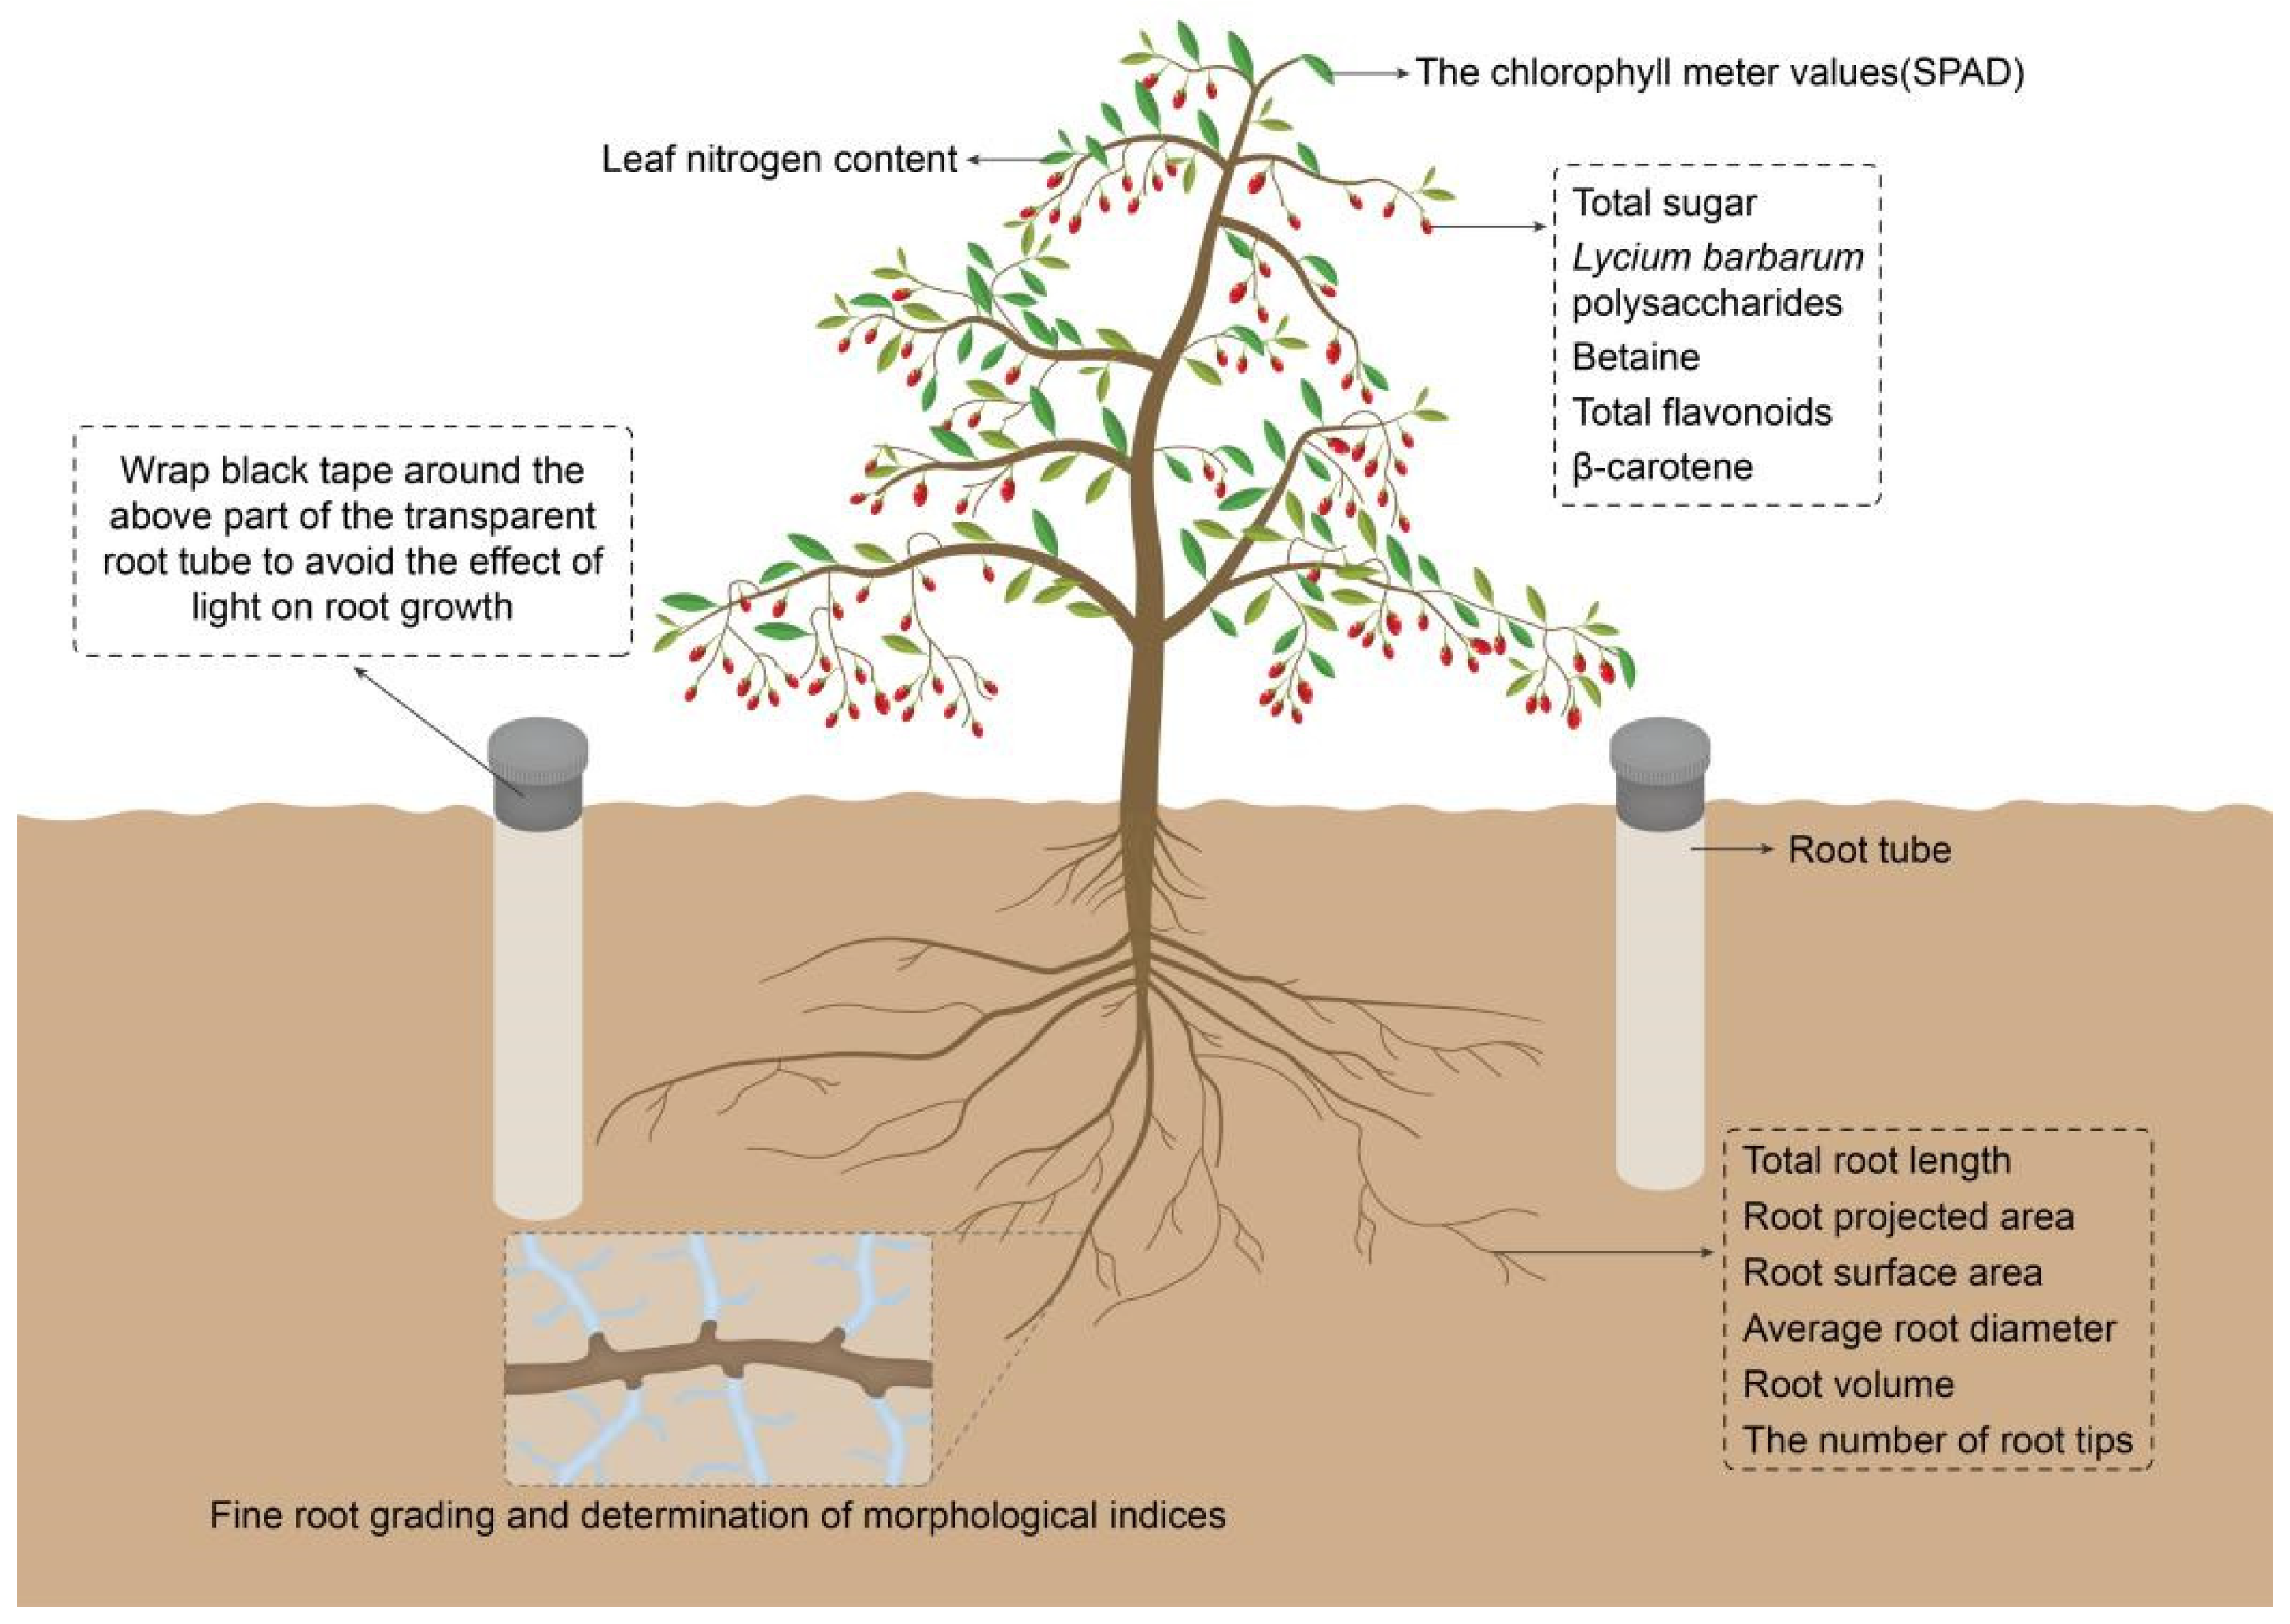
2.2. Investigated Parameters and Determination Methods

2.2.1. Root Morphological Indices

The CI-600 root monitoring system (Figure 2D) was installed at the experimental site in April 2020. Five healthy uniformly grown plants from the middle row of the plot were selected for each treatment, and organic glass tubes, hereinafter referred to as rooting tubes (1 m long and 10 cm diameter, Figure 2C), were placed 20 cm away from the trunk, around each wolfberry tree at the three vertices of an equilateral triangle and a depth of approximately 80 cm below ground.
The root system of wolfberry plants was disturbed after the installation of the root monitoring system, and thus, different fertilization treatments were applied without the observation of root growth, which was later made in March 2021. To ensure the data’s reliability, the root growth data presented in this paper pertain to the year 2022. Starting in April 2022, we conducted dynamic monitoring of wolfberry root growth under various nitrogen application rates. This monitoring occurred a total of six times on the 10th day of each month until September 10. During monitoring, a CI-600 root scanner (Figure 2D) was used to capture the images of the root systems of wolfberry plants (Figure 2E), and the WinRHIZOTron MF 2015b software (Regent Corporation, Richmond, BC, Canada) was used to analyze the data from images on root morphological indices such as total root length, root projected area, root surface area, average root diameter, root volume, and the number of root tips.

2.2.2. Fine Root Grading and Determination of Morphological Indices

Plant roots are commonly divided into fine roots (with a diameter of less than 2 mm) and coarse roots (with a diameter of 2 mm or higher). In this study, a diameter of 0.1 mm was selected as the basis for grading the root indices, based on which, data were classified into six grades of 0.4 mm, 0.8 mm, 1.2 mm, 1.6 mm, 2.0 mm, and larger than 2.0 mm.
For the analysis of differently graded long of fine roots, this study used the online tool iRoot-Web (http://www.irootanalysis.cn/index/indexHome, accessed on 10 April 2023), with U-net semantic image segmentation based on deep learning. First, one or more RGB images that can represent root and background features were selected, and the Image Annotation Tool was used to mark each pixel attribute in the image as root or background. RGB images and annotated images were divided into multiple subimages of 512 pix × 512 pix. Subsequently, distortion and color noise were introduced, increasing number of samples and annotations. Using the U-Net neural network model, weight values between each pixel of the annotated image corresponding to the RGB values of each pixel were computed, creating a weight dataset or the weight model. The RGB image of the roots served as an input for the weight model, which had been trained using the U-Net neural network. This process generated a probability map following the conversion of probability after thresholding. Subsequently, the probability distribution map of the root was binarized based on a predefined probability threshold for the root. Using the binary map, the number of pixel points in the root images was tallied, and the projected area was calculated. The root skeleton was extracted from the binary map, and the root length, root diameter, and number of root tips were computed based on the extracted skeleton. The root surface area and volume were calculated according to the root length and root diameter, and the graded root morphological parameters were calculated according to the graded root diameter. Deep learning has the advantages of achieving accurate segmentation of the root system against the background from a large number of root images and reducing human error [16,17,18].To illustrate, the process of obtaining root morphological characteristic data based on deep learning from a root image in this experiment is shown in Figure 3.

2.2.3. Determination of Soil Chemical Properties

Soil pH was determined using a DDSJ-319L electrode pH meter (INESA Co., Ltd., Shanghai, China) with a 1:2.5 soil/water (w/v) suspension. Additionally, in accordance with the Chinese national standard test methods, various other soil physicochemical properties were assessed, including total nitrogen (TN, NY/T1121.24–2012) [19], total phosphorus (TP, NY/T 88–1988) [20], total potassium (TK, NY/T 87–1988) [21], available nitrogen (AN, LY/T1228–2015) [22], available phosphorus (AP, NY/T1121.7–2014) [23], available potassium (AK, NY889–2004) [24], soil organic matter (OM, NY/T1121.6–2006) [25] and electrical conductivity (EC, HJ 802–2016) [26]. For the period from 2020 to 2022, the soil physical and chemical indices under various nitrogen application rates are provided in the Supplementary Materials (Tables S1–S4).

2.2.4. Determination of Leaf Nitrogen Content

From May to September 2022, on the 10th of each month, plants other than those monitored by the root monitoring system were selected for sampling from each treatment. For each sampling time, 8 to 10 fruit branches were selected from different directions of the crown of each wolfberry tree, and leaves were picked from the tip, middle, and base of each fruit branch. Five wolfberry trees were randomly selected as 5 replicates and transferred to the laboratory for leaf nitrogen content determination using the semimicro-Kjeldahl method [27].

2.2.5. Determination of Relative Chlorophyll Content

Starting in May 2022, on the 10th day of each month, a handheld SPAD-502 chlorophyll meter was employed to assess the chlorophyll meter values (abbreviated as SPAD) from five wolfberry trees equipped with root tubes for each treatment. A total of five measurements were taken each month, with the data collection continuing until 10 September.
The readings obtained from the SPAD chlorophyll analyzermay may vary depending on the leaf’s position. Therefore, it is important not to select leaves randomly during the investigation and detection. Instead, a specific leaf location should be consistently chosen for comparison to assess the differences between various treatments. For each measurement, 5 fruit branches were selected from different directions in the crown of each plant. Thereafter, the SPAD values of the leaves of the tip, middle, and base of each fruit branch were measured once each, and then, the average value for each measurement was taken.

2.2.6. Determination of the Nutritional Composition of Wolfberry Fruits

After the application of different nitrogen fertilizer treatments to batches and the harvesting of the fresh fruits of wolfberry from the experimental area, the values of total sugar, Lycium barbarum polysaccharides, betaine, total flavonoids, and β-carotene in dry fruits after drying were determined. All measurements were conducted in triplicate, and the average value was calculated. The contents of Lycium barbarum polysaccharides and total sugar were determined using the method outlined in GB/T 18672–2014 [28]. The betaine content was determined through high-performance liquid chromatography (HPLC) using the specific method adopted by Fang et al. [29]. Total flavonoid contents were determined by spectrophotometry, and rutin was used as the standard product for making the standard curve according to the method by Zhang et al. [30]. The beta-carotene content was determined as in ultraviolet spectrophotometry using the method of Mi et al. [31].The investigated parameters involved in this test are shown in Figure 4.

2.2.7. Data Processing

Microsoft Office Excel 2007 was used for data sorting, whereas SPSS Statistics 23.0 (SPSS Inc., Chicago, IL, USA) was employed for statistical analysis, and graph plotting was performed using Origin 9 (OriginLab Corporation, Northampton, MA, USA).

3. Results

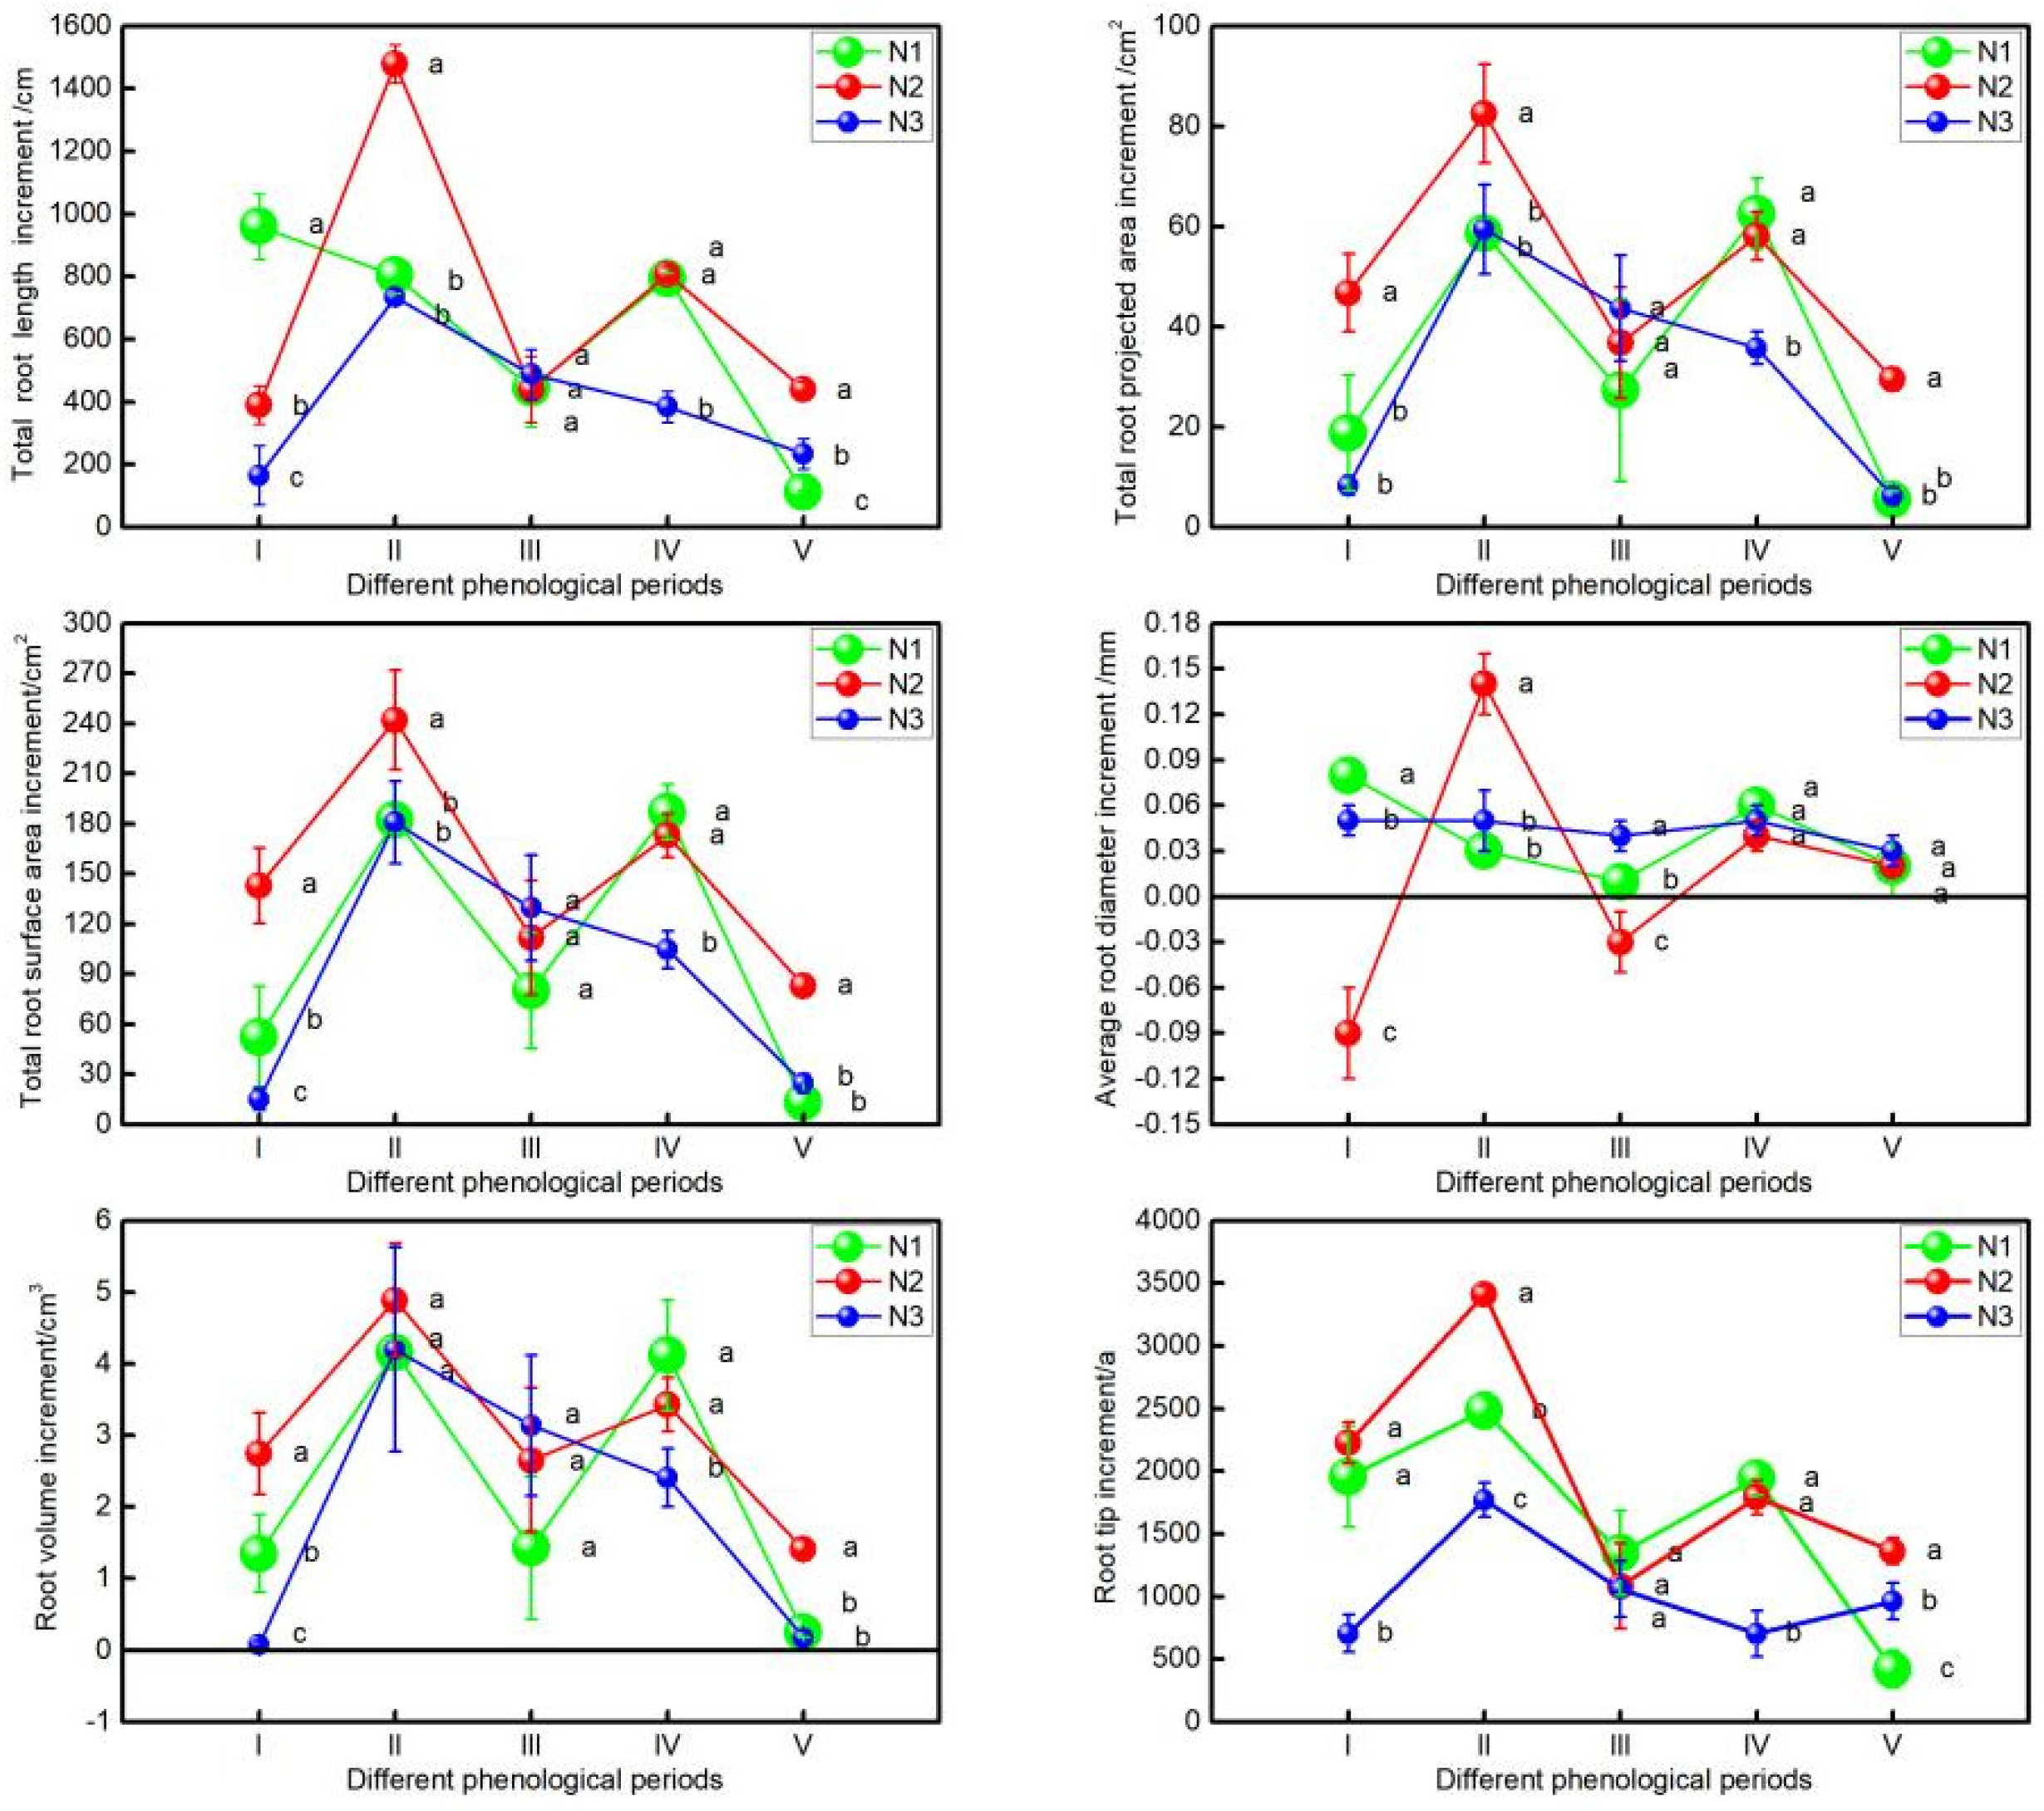
3.1. ANOVA of the Increment of Root Growth of Wolfberry under Different Nitrogen Application Treatments

Overall, the increase in morphological characteristics of the wolfberry root system was more pronounced during periods II and IV. In other words, there were two peaks in root growth and development within the annual cycle. These correspond to the leaf growth period and flowering period, as well as the autumn branch budding period and autumn flowering period (see Figure 5).
In the context of root growth, the N2 treatment showed a significantly greater root length increase than the N3 treatment, except during period III (p < 0.05). Additionally, the N1 treatment exhibited the second-highest root length increase, following N2. During period III, there were no significant differences in root projected area and root surface area increments (p > 0.05). However, in periods I, II, and V, the increments under N2 conditions were significantly higher than those under N1 and N3 treatments (p < 0.05). Notably, there were no significant differences in the increment between the N1 and N2 treatments in period IV (p > 0.05), but both the N1 and N2 treatments showed significantly higher increments than the N3 treatment (p < 0.05).
Regarding root diameter growth, the increment under the N2 treatment was significantly higher than that under the other two treatments only in period II (p < 0.05). In other periods, the root diameter increment was lower or significantly lower than that under the N1 and N3 treatments, which can be attributed to the higher proportion of fine roots in the N2 treatment. In terms of root volume growth, there were no significant differences among the different treatments in periods II and III (p > 0.05). However, during periods I, IV, and V, the root volume increment under the N2 treatment had a distinct advantage.
Concerning the increase in the number of root tips, during periods I, II, and IV, the N1 and N2 treatments exhibited significantly higher increments than the N3 treatment, except in stage III (p < 0.05). In period V, there were significant differences in the number increment of root tips among different nitrogen application rates (p < 0.05), with the order being N2 > N3 > N1.
According to Table 1, the increment of total root length of wolfberry under the N2 treatment during the budding and unfolding stage was the largest (959.58 cm), significantly higher than that for N1 and N3 treatments (p < 0.05), which displayed no significant difference, and the value followed the order of N2 > N1 > N3. During the phases of leaf growth and flowering, the N1 treatment resulted in the highest increase in the total root length of wolfberry (1479.95 cm), which was significantly greater than the increments observed in the other treatments (p < 0.05). For both the N2 and N3 treatments, the root length increase was minimal, and there was no significant difference between them. In the summer fruiting period, the wolfberry root system entered a slower growth phase. During this time, there were no significant differences in the root length increment among all treatments, with the order being N3 > N2 > N1. The root length increment of wolfberry throughout the branch budding and flowering periods in autumn was large under N1 and N2, both having significantly higher values than the N3 treatment group (p < 0.05), which showed a minimal increase. The root length increment of wolfberry during the autumn season had its maximum value in N1 (440.55 cm), which was significantly higher than that under the N2 and N3 treatment groups (p < 0.05), between which there was no significant difference.
Overall, the root length increment of wolfberry throughout different phenological periods was observed to be large under the N1 and N2 treatments. The N application treatments showed the cumulative increments of N2, N1, and N3 in descending order, indicating that the conditions of low nitrogen and medium nitrogen were most favorable to the growth and development of wolfberry roots.

3.2. ANOVA of the Increment of Root Growth of Wolfberry in Different Diameter Classes under Different Nitrogen Application Treatments

As shown in Table 2, during the budding and unfolding stage, the root length increment for the diameter range of 0.41~0.8 mm was significantly higher than that for other diameter classes (p < 0.05), followed by that for the diameter range of 0~0.4 mm, and there was no significant difference in the root length increment among other diameter classes. During the leaf growth and flowering periods, as well as in the summer fruiting period and autumn branch budding and flowering, the most substantial root length increment occurred for diameters ranging from 0.41 to 0.8 mm. However, in the fine root length increment of wolfberry during the autumn fruiting period, there were no significant differences among all diameter classes (p > 0.05).
In summary, the growth of fine roots of wolfberry was observed to be steadier from the budding and unfolding stage to the fruiting period in autumn under the N1 treatment, and the diameter class with the largest root length increment was 0.41–0.8 mm, with its value accounting for 50.6% of the increment of annual root length growth.
Table 3 illustrates that during the budding and unfolding stage, the most significant root growth increment occurred for diameters between 0.41 and 0.8 mm, with a notable difference compared with other diameter classes (p < 0.05). The second-highest increment was observed for the diameter class of 0~0.4 mm. The increments of root growth for other diameter classes were low, without a significant difference among them. During the leaf growth and flowering periods, the root length increment for the diameter range of 0.41~0.8 mm had its largest value, significantly higher than that for other diameter classes (p < 0.05), followed by the increment for the diameter classes of 0.81~1.2 mm and 0~0.4 mm. For other diameter classes, however, the increment was low, with no significant difference among them, and throughout the fruiting period in summer, the root growth increment was not significantly different among all the diameter classes. Additionally, in the autumn branch budding and flowering periods, the highest root length increment was observed for the diameter class between 0.41 and 0.8 mm, significantly surpassing the increments for other diameter classes (p < 0.05).This was followed by increments for the diameter classes of 0.81 to 1.2 mm and 0 to 0.4 mm. On the other hand, the increments for the remaining diameter classes were minimal, with no significant differences among them. The fruiting period in autumn exhibited the largest root length increment with a diameter range of 0.41~0.8 mm, which was significantly higher than that for other treatments (p < 0.05), followed by the value obtained for the diameter class of 0~0.4 mm, with no significant difference in the root length increment among other diameter classes.
In summary, it can be seen that the most rapid growth of fine roots of wolfberry under the N2 treatment occurred between the leaf growth and the flowering periods, and the diameter class with the largest root growth increment of wolfberry was within a range of 0.41~0.8 mm, whose increment accounted for 50.92% of the increment of annual total root length growth.
As shown in Table 4, during the budding and unfolding stage, the fine root length increment for the diameter range of 0.41~0.8 mm was significantly higher than that for other diameter classes (p < 0.05), and there was no significant difference in the root length increments among other diameter classes. During the leaf growth and flowering periods, the fruiting period in summer, and branch budding and flowering periods in autumn, the root lengths for diameters of 0.41~0.8 mm and 0.81~1.2 mm showed a large increment, with no significant difference among them. Likewise, no significant difference was observed in the root length increment of fine roots among other diameter classes. Throughout the fruiting period in autumn, the root length increment was large for the diameter ranges of 0~0.4 mm and 0.41~0.8 mm, which were not significantly different, similar to no significant difference among other diameter classes.
In summary, a significant increase in the fine root growth of wolfberry under the N3 treatment was observed from the leaf growth and flowering periods to the autumn branch budding and flowering periods. The diameter classes of 0.41 to 0.8 mm and 0.81 to 1.2 mm exhibited the most substantial values, contributing to 47.72% and 29.97% of the total annual root length increment, respectively.

3.3. Monthly Growth Increment of Fine Roots in Different Diameter Classes at Different Soil Depths

As shown in Figure 6, there were differences in the root length increments of fine roots in different soil layers. With the increase in soil depth, the increment of fine root length in the budding and unfolding stage first decreased and then increased. In the leaf growth and flowering periods, the fruiting period in summer, and branch budding and flowering periods in autumn, the increment of fine root length showed a downward trend. However, during the fruiting period in autumn, except for the fine roots with a diameter range of 0.41–0.8 mm, which showed an upward trend, the root length increments of other diameter classes revealed an initial decrease, followed by a decrease. In summary, under N1, the most active growth of fine roots occurred in the 0–20 cm soil layer across a diameter range of 0.41–0.8 mm.
Figure 7 shows differences in the increment of fine root length at different soil layers. With the increase in soil depth, the value during budding and unfolding first decreased and then increased. This contrasts with the leaf growth and flowering periods and the autumn branch budding and flowering periods, during which initially increasing and subsequently decreasing trends were observed. The fine root length increment over the fruiting period in summer, however, showed an overall downward trend, while during the fruiting period in autumn, it followed an upward trend. In summary, under the N2 treatment, fine roots grew most actively in the 0–20 cm and 20–40 cm soil layers and optimally with a diameter class ranging from 0.41 to 0.8 mm.
Figure 8 demonstrates that the root length increment of fine roots was different in different soil layers. With increasing soil depth, the fine root length increment in the budding and unfolding stage, leaf growth and flowering periods, fruiting period in summer, branch budding and flowering in the autumn season, and fruiting during autumn all showed an overall downward trend. In summary, under N3, the most active growth of fine roots was detected at the 0–20 cm soil layer and across a diameter range of 0.41–0.8 mm.

3.4. ANOVA of Nitrogen Contents and SPAD Values of Wolfberry Leaves under Different Nitrogen Application Treatments

As shown in Table 5, in terms of nitrogen content in tender leaves at the tip, the value was significantly higher under the N2 and N3 treatments than under the N1 treatment (p < 0.05). The nitrogen contents in the middle and basal leaves displayed significant differences under different nitrogen application rates (p < 0.05), with the order of N2 > N3 > N1.
Regarding the SPAD value, similar to the N content, leaves at the tip exhibited significantly higher values under the N2 and N3 treatments than under N1 (p < 0.05). SPAD values in the middle leaves showed significant differences among the various N application treatments (p < 0.05), with the order being N2, N3, and N1 in descending order. However, basal leaf SPAD values were the highest under the N2 treatment, and were significantly higher than those under the N1 and N3 treatments (p < 0.05), which did not differ significantly.

3.5. ANOVA of the Nutritional Composition of Wolfberry Fruits under Different Nitrogen Application Treatments

Table 6 shows that the total sugar content and total flavonoid content in wolfberry fruits were significantly different among the different nitrogen application treatments (p < 0.05). The total sugar content varied from 34.90 to 39.60 g·100 g−1 under all fertilization conditions, with N3, N2, and N1 in a descending order. The variation in the total flavonoid content ranged from 0.048 to 0.057 g·100 g−1, in the order of N1 > N2 > N3. The Lycium barbarum polysaccharide content in wolfberry fruits showed a declining trend with an increase in the amount of nitrogen applied. The polysaccharide content under the N1 treatment group was 5.62 g·100 g−1, which was significantly higher than that obtained for the N2 and N3 treatment groups (p < 0.05), which exhibited no significant difference. In terms of betaine content, wolfberry fruits under N1 and N2 treatment conditions had significantly lower values than those under the N3 treatment group (1.54 g·100 g−1; (p < 0.05). There was an increase in the β-carotene content in wolfberry as the amount of nitrogen applied increased, ranging between 9.66 and 10.61 g·100 g−1. The N1 treatment group exhibited a significantly lower value compared with the N2 and N3 treatment groups (p < 0.05), with no significant difference observed in the β-carotene content between the N2 and N3 treatment groups.

3.6. Comprehensive Evaluation of the Effects of Different Nitrogen Application Levels on the Growth and Development of Wolfberry Plants

In this study, we calculated 13 indicators for the roots, leaves, and fruits of wolfberry plants under various nitrogen application rates using principal component analysis (PCA) in SPSS 23.0. The results indicated that the characteristic values for the first principal component (PC1) and the second principal component (PC2) were 7.698 and 5.302, respectively, both exceeding 1. The cumulative variance contribution rate of PC1 and PC2 reached 100%. These first two principal components captured almost all the variation in the original variables, so they were derived from the standardized variables to replace the initial 13 original indicators for the comprehensive assessment of wolfberry plant roots, leaves, and fruits under different nitrogen levels. The thirteen initial indicators were reduced to two unrelated principal components to achieve dimensionality reduction. Moreover, the higher the absolute value of the principal component eigenvector is, the greater its ability to represent a weight for each eigenvalue.
As shown in Table 7, the variance contribution rate of the first principal component was 59.212%. In PC1, the characteristic vectors for the increment of total root length, root tip number increment, average leaf nitrogen content, total fruit sugar content, and fruit betaine content had high values. Among them, the increments of total root length and root tip number were positively correlated with PC1, while the remaining indicators were negatively correlated with PC1. The variance contribution rate of the second principal component was 40.788%. In PC2, the root projected area increment, root surface area increment, root average diameter increment, root volume increment, average leaf SPAD value, Lycium barbarum polysaccharide content, total fruit flavonoid content, and fruit carotene content all had high values. Among them, the average root diameter increment, polysaccharide content, and total flavonoid content of fruits were negatively correlated with PC2, which, in contrast, showed positive correlations with all the remaining indicators.
The principal component scores were obtained using SPSS 23.0 (Table 8). The ranking based on these scores could better reveal the growth and development of wolfberry plants under different nitrogen application treatments, demonstrating the order of N2 > N1 > N3 for PC1 and N2 > N3 > N1 for PC2. Due to the differing variance contribution rates of these two principal components, their cumulative contribution rates were considered during the evaluation process. A comprehensive evaluation was constructed by adding the principal component scores for variables weighted by their corresponding weights as follows: F = 0.59212F1 + 0.40788F2. Thus, the weights of indices during the process of comprehensive evaluation were in the order of betaine content > total sugar content > increment of total root length > root tip number increment > average leaf nitrogen content > root volume increment > Lycium barbarum polysaccharide content > total flavonoid content > average leaf SPAD value > root surface area increment > root average diameter increment > root projected area increment > carotene content.
In the comprehensive evaluation of principal component expression functions, F is the comprehensive score for the growth and development of wolfberry plants under different nitrogen application conditions. According to the comprehensive evaluation model, the ranking results obtained for different treatments are as follows: N2 (medium nitrogen), N1 (low nitrogen), and N3 (high nitrogen) in descending order. In conclusion, the use of an appropriate amount of nitrogen fertilizer is greatly advantageous for growth and development of wolfberry plants ensuring both the stability of fruit yield and quality.

4. Discussion

4.1. Effects of Different Nitrogen Application Rates on the Root Growth of Wolfberry

The root system is the only important organ through which plants connect with soil water and nutrients and obtain feedback information, and it directly affects the growth, development, and yield formation of crops [32]. The root system’s ability to effectively transport soil nutrients and water is linked to changes in its morphological and physiological characteristics. The morphology and distribution of the root system are primarily influenced by soil fertility and the distribution of water and nitrogen [33]. Research on the impact of soil nitrogen on plant root morphological characteristics has yielded somewhat contradictory results. Some studies indicate that when soil nitrogen levels are insufficient, root morphological parameters such as root length and root surface area tend to decrease significantly, while the crown–root ratio would increase [34]. On the other hand, there are studies suggesting that under conditions of nitrogen deficiency, the total root length, surface area, projected area, and number of secondary roots of Pingyi sweet tea hydroponic seedlings significantly increase, with only root activity showing a significant decrease [35]. The application of nitrogen fertilizer can promote root growth, increase root hair density, and improve physiological root functions, and its proper amount could significantly improve the morphological characteristics of the root system of corn plants, whereas excessive nitrogen fertilizer inputs slightly promoted the growth of deep roots, but exerted an inhibitory effect on the total amount of nitrogen [36]. Some studies have concluded that excessive nitrogen application causes an increase in the proportion of nitrate nitrogen in the soil, which would continue to stimulate the secretion of cytokinins by plants, antagonize the production of IAA, and simultaneously increase ethylene secretion and inhibit fine root growth [37,38,39,40]. In this study, the increments of total root length, root projected area, root surface area, average root diameter, root volume, and root tip number of wolfberry were large under the low-nitrogen and medium-nitrogen treatments. However, the increment of root morphological characteristics decreased significantly under the high-nitrogen treatment, that is, with an increase in the nitrogen application, the increment showed an increasing trend before decreasing. Excessive nitrogen application had an inhibitory effect on the growth and development of the root system of Lycium chinense. Similar findings have been observed in previous studies on temperate Schrenk’s spruce [41].

4.2. Effects of Different Nitrogen Application Rates on the Distribution of Wolfberry Fine Roots in Different Diameter Size Classes

Fine roots (with a diameter of 2 mm or less) represent a relatively small yet functionally crucial component of plant biomass. They play a pivotal role in regulating water and nutrient uptake and exert a significant influence on biogeochemical cycles due to their rapid biomass turnover [42]. Fine roots are characterized by their high physiological activity [43] and have garnered substantial attention in research, particularly because of their easily measurable morphological attributes, such as fine root diameter, length, the ratio of fine root length to root dry mass, and tissue density. Among these, diameter is the most straightforward indicator for assessing the morphological features of fine roots. In comparison with fine roots with larger diameters, those with smaller diameters primarily handle the absorption and utilization of water and nutrients in the soil [44,45]. In terms of the response of fine root diameter to nitrogen addition, there is a large difference in previous research results. In studies on Fraxinus mandshurica [46], Pinus koraiensis [47], and Pinus tabuliformis [48], the results showed that nitrogen addition increased root diameter, while root diameters of Larix kaempferi and Cryptomeria japonica [49] tended to decrease after the addition of nitrogen. Research results on Phellodendron amurense [47] indicated that fine root diameters did not respond to nitrogen addition. In this study, as the amount of nitrogen application increased, the root length increment for fine roots (0 to 0.8 mm) with a smaller diameter gradually decreased, whereas for thick roots (0.8 to 2.0 mm) and coarse roots (>2.0 mm), it gradually increased in proportion to the total root length increase, indicating that the root diameter of wolfberry increased with the increase in the amount of applied nitrogen. Moreover, previous studies have emphasized the importance of distinguishing between fine roots in different soil layers and taking into account their morphological variations when assessing the impact of nitrogen addition on fine root characteristics. Such differentiation is crucial for understanding the physiological absorption capacity of tree fine roots [50]. In this study, the layer in which fine roots actively grew under the low- and high-nitrogen treatments was found to be the 0–20 cm soil layer, while fine roots under the medium-nitrogen treatment were mostly concentrated in the 0–20 cm and 20–40 cm soil layers, indicating that low or excessive nitrogen application is not conducive to the vertical extension of fine roots. It was further proven that a reasonable rate of fertilization can not only improve soil fertility but also promote the stretching and spatial distribution of roots in the cultivated layer.

4.3. Effects of Different Nitrogen Application Rates on Nitrogen Contents and SPAD Values of Wolfberry Leaves

Leaves are an important source of energy supply for plants, and the chlorophyll content in leaves is an important indicator to measure the energy obtained by plants. The chlorophyll content is generally positively correlated with the nitrogen content in plants, and it can indirectly reflect the nutritional status of plants [51,52]. In terms of leaf nitrogen content, most studies have shown an increase with the increase in the amount of applied N [53,54,55]. In this study, the tender leaves of the tip were more sensitive to the amount of nitrogen applied, whose increase led to an increase in the nitrogen content in leaves. The nitrogen content in leaves of the middle and basal branches, however, increased first and then decreased with the increase in the N application rate. Many previous studies have reported the change in leaf SPAD values of plants under different nitrogen levels, but slightly different results were obtained. In rice studies, a significant increase in leaf SPAD values was found with an increase in nitrogen levels [56]. In maize, although an increase in SPAD values in leaves occurred with increasing nitrogen application, this effect was not significant when fertilizer was applied beyond the rate needed to reach a maximum yield level [57].

4.4. Effects of Different Nitrogen Application Rates on the Quality of Wolfberry Fruits

According to some studies, there is a parabolic relationship among crop yield, water, and nitrogen content, which indicates that water and fertilizer levels above a certain threshold inhibit crop growth and yield [58,59,60]. Numerous studies have investigated the impact of nitrogen addition on the nutritional composition of wolfberry fruits. For instance, the research on black wolfberry fruits indicated that with the increase in applied nitrogen, the levels of Lycium barbarum polysaccharides, anthocyanins, and proanthocyanidins gradually increased. Meanwhile, the total flavonoid content exhibited an initial increase followed by a decrease [61]. Similarly, some studies found that the contents of total sugar, betaine, and carotenoids in red wolfberry fruits exhibited a noticeable increase followed by a decrease as the amount of applied nitrogen increased. In contrast, the content of Lycium barbarum polysaccharides showed a significant decrease [62]. In the present study, there was an upward trend for the content of total sugar, betaine, and beta-carotene in wolfberry with an increase in the nitrogen application rate, whereas the contents of polysaccharides and total flavonoids showed a declining trend, which is consistent with previous research results. However, an increase in the Lycium barbarum polysaccharide content in the red fruit wolfberry with increased nitrogen application was reported [63]. The reason for this difference may be the different concentrations of fertilizers used in the experiment. Lycium barbarum polysaccharide is an important secondary metabolite in wolfberry fruits, and adverse conditions may promote an increase in its content. On the other hand, its synthesis also requires nitrogen as a base material. Insufficient nitrogen restricts its synthesis, which is otherwise stimulated as the result of the combined effects of adverse conditions and nitrogen supply.

5. Conclusions

There are two peak periods of the growth and development of the root system of wolfberry during its phenological period, including the leaf growth and flowering periods and branch budding and flowering periods in autumn. Under the same field management practices but different nitrogen fertilization levels, root morphological characteristics all increased significantly under low nitrogen (N1) and medium nitrogen (N2) treatments. And fine roots with an average diameter of 0.4–0.8 mm accounted for the largest proportion of total root length under different treatment conditions. Concerning the distribution of fine roots, an appropriate amount of nitrogen supports the vertical expansion of fine roots, ultimately enhancing the efficiency of water and fertilizer uptake by wolfberry plants from the soil. Combined with the physiological indexes of leaves and fruits, it was found that the growth and development of wolfberry plants under medium nitrogen treatment (N2) was the best. The research findings offer theoretical guidance for the effective application of nitrogen in significant wolfberry production regions. They also serve as a foundational reference for understanding and managing fine wolfberry root morphology through practices such as efficient nitrogen fertilizer management, among others.

Supplementary Materials

The following supporting information can be downloaded at: https://www.mdpi.com/article/10.3390/f14122317/s1, Table S1: Difference analysis of soil physical and chemical properties under different nitrogen ap-plication rates in 2020; Table S2: Difference analysis of soil physical and chemical properties under different nitrogen ap-plication rates in March 2021; Table S3: Analysis on the difference of soil available nitrogen content under different treatments in the test area in June and August 2021; Table S4: Difference analysis of soil physical and chemical properties under different nitrogen ap-plication rates in July 2022; Table S5: One-way analysis of variance (ANOVA) of root growth increment of wolfberry under the N1 treatment determined every month from April until September; Table S6: One-way analysis of variance (ANOVA) of root growth increment of wolfberry under the N2 treatment determined every month from April until September; Table S7: One-way analysis of variance (ANOVA) of root growth increment of wolfberry under the N3 treatment determined every month from April until September.

Author Contributions

Investigation, X.L., Y.L. and Y.W.; data curation, writing—original draft preparation, X.L.; writing—review and editing, W.A. and S.S. All authors have read and agreed to the published version of the manuscript.

Funding

This research was funded by the Science and Technology Support Project for Ecological Environmental Protection and High-quality Development in the Yellow River Basin (2021BEF02004) and the Central Finance Forestry Reform and Development Fund “Forest Seed Cultivation”.

Data Availability Statement

No new data were created or analyzed in this study. Data sharing is not applicable to this article. The data presented in this study are available on request from the corresponding author.

Conflicts of Interest

The authors declare no conflict of interest.

References

  1. Fukuda, T.; Yokoyama, J.; Ohashi, H. Phylogeny and biogeography of the genus Lycium (Solanaceae): Inferences from chloroplast DNA sequences. Mol. Phylogenet. Evol. 2001, 19, 246–258. [Google Scholar] [CrossRef]
  2. Amagase, H.; Farnsworth, N.R. A review of botanical characteristics, phytochemistry, clinical relevance in efficacy and safety of Lycium barbarum fruit (Goji). Food Res. Int. 2011, 44, 1702–1717. [Google Scholar] [CrossRef]
  3. Meng, J.; Liu, Z.H.; Gou, C.H.; Rogers, K.; Yu, W.; Zhang, S.H.; Yuan, Y.; Zhang, L. Geographical origin of Chinese wolfberry (goji) determined by carbon isotope analysis of specific volatile compounds. J. Chromatogr. 2019, 1105, 104–112. [Google Scholar] [CrossRef] [PubMed]
  4. Wang, Y.; Jin, H.; Dong, X.; Yang, S.; Ma, S.; Ni, J. Quality evaluation of Lycium barbarum (wolfberry) from different regions in China based on polysaccharide structure, yield and bioactivities. Chin. Med. 2019, 14, 49. [Google Scholar] [CrossRef] [PubMed]
  5. Chung, R.S.; Chen, C.C.; Ng, L.T. Nitrogen fertilization affects the growth performance, betaine and polysaccharide concentrations of Lycium barbarum. Ind. Crop Prod. 2010, 32, 650–655. [Google Scholar] [CrossRef]
  6. Wu, K.; Wang, S.; Song, W.; Zhang, J.; Wang, Y.; Liu, Q.; Yu, J.; Ye, Y.; Li, S.; Chen, J.; et al. Enhanced sustainable green revolution yield via nitrogen-responsive chromatin modulation in rice. Science 2020, 367, eaaz3046. [Google Scholar] [CrossRef] [PubMed]
  7. Zhang, F.; Wang, J.; Zhang, W.; Cui, Z.; Ma, W.; Chen, X.; Jiang, R. Nutrient use efficiencies of major cereal crops in China and measures for improvement. Acta Pedol. Sin. 2008, 45, 915–924. [Google Scholar]
  8. Wu, D.L.; Xu, X.X.; Chen, Y.L.; Shao, H.; Sokolowski, E.; Mi, G.H. Effect of different drip fertigation methods on maize yield, nutrient and water productivity in two-soils in northeast China. Agric. Water Manag. 2019, 213, 200–211. [Google Scholar] [CrossRef]
  9. Zhang, Y.; Wei, Y.; Zheng, G.; Wang, X.; Liu, G.; Zhang, Y.; Li, M. Effects of Different Fertilization Amounts on Growth, Yield and Appearance Quality of Lycium barbarum in Southern Xinjiang. Xinjiang Agric. Sci. 2018, 55, 2203. [Google Scholar]
  10. Shi, Z.; Wei, F.; Wan, R.; Li, Y.; Wang, Y.; An, W.; Qin, K.; Dai, G.; Cao, Y.; Feng, J. Impact of nitrogen fertilizer levels on metabolite profiling of the Lycium barbarum L. fruit. Molecules 2019, 24, 3879. [Google Scholar] [CrossRef]
  11. Lv, J.; Sheng, H.; Hua, M.; Nie, Y.; Gao, Y.; Xu, M.; Wei, J. Effects of Different Nitrogen Application Rates Combined with Nitrification Inhbibitor on Wolfberry Yield, Nitrogen Uptake and Utilization in Qaidam. Acta Agric. Boreali-Occident. Sin. 2023, 32, 1058–1067. [Google Scholar]
  12. Zeng, X.; Li, W.; Qiang, S.; Pan, J.; Zhang, Y.; Qi, G. Effects of straw mulch and irrigation on growth and water use efficiency of Lycium. Agric. Res. Arid. Areas 2013, 31, 61–65. [Google Scholar]
  13. Song, Y.; Chen, X.; Ren, X.; Gao, X. Effects of regulated deficit irrigation and reduced nitrogen fertilization on growth and yield of Lycium barbarum. Acta Agric. Boreali-Occident. Sin. 2019, 28, 1666–1673. [Google Scholar]
  14. Li, H.; Sun, Y.; Qu, J.; Wei, C.; Sun, G.; Zhao, Y.; Chai, Y. Influence of nitrogen levels on morphological and physiological characteristics of root system in japonica rice in northeast China. Chin. J. Rice Sci. 2012, 26, 723–730. [Google Scholar]
  15. Brinkman, M.; Rho, Y. Response of three oat cultivars to N fertilizer. Crop Sci. 1984, 24, 973–977. [Google Scholar] [CrossRef]
  16. Zhao, X.; Cai, F.; Li, R.; Wang, X.; Xie, Y.; Wen, R.; Jia, Q. Optimal Resolution and Probability Threshold for the Semantic Segmentation of Spring Maize Root Image. J. Nucl. Agric. Sci. 2023, 37, 1690–1699. [Google Scholar]
  17. Jia, Q.; Xie, Y.; Zhao, Y.; Wang, R.; Liu, J.; Wen, R. Research on automatic recognition of plant root system image. J. Meteorol. Environ. 2022, 38, 105–111. [Google Scholar]
  18. Jia, Q.; Liu, X.; Xie, Y. A Root Image Recognition Method. CN114266903A, 1 April 2022. [Google Scholar]
  19. NY/T 1121.24–2012; Soil Testing—Part 24: Determination of Total Nitrogen in Soil—Automatic Kjeldahl Apparatus Method. Agricultural Industry Standards of People’s Republic of China: Beijing, China, 1 September 2012.
  20. NY/T 88–1988; Method for Determination of Soil Total Phosphorus. Agricultural Industry Standards of People’s Republic of China: Beijing, China, 1 March 1989.
  21. NY/T 87–1988; Method for Determination of Total Potassium in Soils. Agricultural Industry Standards of People’s Republic of China: Beijing, China, 1 March 1989.
  22. LY/T1228–2015; Nitrogen Determination Methods of Forest Soils. Forestry industry standard of the People’s Republic of China: Beijing, China, 1 January 2016.
  23. NY/T1121.7–2014; Soil Testing—Part 7: Method for Determination of Available Phosphorus in Soil. Agricultural Industry Standards of People’s Republic of China: Beijing, China, 1 January 2015.
  24. NY889–2004; Determination of Exchangeable Potassium and Non-Exchangeable Potassium Content in Soil. Agricultural Industry Standards of People’s Republic of China: Beijing, China, 1 February 2005.
  25. NY/T1121.6–2006; Soil Testing—Part 6: Method for Determination of Soil Organic Matter. Agricultural Industry Standards of People’s Republic of China: Beijing, China, 1 October 2006.
  26. HJ 802-2016; Soil Quality—Determination of Conductivity-Electrode Method. National Environmental Protection Standards of People’s Republic of China: Beijing, China, 1 August 2016.
  27. Trikilidou, E.; Samiotis, G.; Tsikritzis, L.; Amanatidou, E. Performance of Semi-Micro-Kjeldahl Nitrogen Method–uncertainty and nitrate interference. Int. J. Environ. Anal. Chem. 2022, 102, 6204–6214. [Google Scholar] [CrossRef]
  28. GB/T 18672-2014; Wolfberry. National Standards of People’s Republic of China: Beijing, China, 27 October 2014.
  29. Fang, L.; Zhu, M.; Zheng, C.H. Determination of Betaine in Lycium chinense by HPLC. Drug Stand. China 2011, 12, 288–291. [Google Scholar]
  30. Zhang, Y.; Zhang, L.; Zhou, H. Determination of Flavonoids in Lycium barbarum from Different Places. Chin. J. Tradit. Med. Sci. Technol. 2004, 2, 102–103. [Google Scholar]
  31. Mi, J.; Lv, L.; Dai, G.; He, X.; Li, X.; Yan, Y.; Qin, K. Correlations between Skin Color and Carotenoid Contents in Wolfberry. Food Sci. 2018, 39, 81–86. [Google Scholar]
  32. Tian, Z.H.; Fan, Y.; Yin, M.; Wang, F.; Cai, J.; Jiang, D.; Dai, T. Genetic improvement of root growth and its relationship with grain yield of wheat cultivars in the middle-lower Yangtze River. Acta Agron. Sin. 2015, 41, 613–622. [Google Scholar] [CrossRef]
  33. Joseph, M. Competition for nutrients and optimal root allocation. Plant Soil 2006, 285, 171–185. [Google Scholar]
  34. Li, X.; Lin, L.; Wang, K.; Cai, M.; Cao, C.; Jiang, Y. Root characteristics of Cry2A* transgenic rice under different nitrogen fertilizer conditions. J. Huazhong Agric. Univ. 2023, 42, 125–131. [Google Scholar] [CrossRef]
  35. Qiao, H.; Yang, H.; Shen, W.; Jiang, Q.; You, S.H.; Zhang, L.; Ran, K.; Zhang, X. Effect of nitrogen-deficient and iron-deficient on root architecture of young seedlings of Malus hupehensis (Pamp) Rehd. Acta Hortic. Sin. 2009, 36, 321–326. [Google Scholar]
  36. Kang, S.H.; Shi, W.; Zhang, J. An improved water-use efficiency for maize grown under regulated deficit irrigation. Field Crops Res. 2000, 67, 207–214. [Google Scholar] [CrossRef]
  37. Ju, X.; Pan, J.; Liu, X. Study on the fate of nitrogen fertilizer in winter wheat/summer maize rotation system in Beijing suburban. Plant Nutr. Fertil. Sci. 2003, 9, 264–270. [Google Scholar]
  38. Walch, L.; Ivanov, I.; Filleur, S.; Gan, Y.; Remans, T.; Forde, B. Nitrogen regulation of root branching. Ann. Bot. 2006, 97, 875–881. [Google Scholar] [CrossRef]
  39. Tian, Q.; Chen, F.; Liu, J.; Zhang, F.; Mi, G. Inhibition of maize root growth by high nitrate supply is correlated with reduced IAA levels in roots. J. Plant Physiol. 2008, 165, 942–951. [Google Scholar] [CrossRef]
  40. Tian, Q.; Sun, P.; Zhang, W. Ethylene is involved in nitrate-dependent root growth and branching in Arabidopsis thaliana. New Phytol. 2009, 184, 918–931. [Google Scholar] [CrossRef]
  41. Zhu, H.; Zhao, J.; Gong, L. The morphological and chemical properties of fine roots respond to nitrogen addition in a temperate Schrenk’s spruce (Picea schrenkiana) forest. Sci. Rep. 2021, 11, 3839. [Google Scholar] [CrossRef] [PubMed]
  42. Sierra Cornejo, N.; Hertel, D.; Becker, J.N.; Hemp, A.; Leuschner, C. Biomass, Morphology, and Dynamics of the Fine Root System Across a 3000-M Elevation Gradient on Mt. Kilimanjaro. Front. Plant Sci. 2020, 11, 13. [Google Scholar] [CrossRef] [PubMed]
  43. Chen, G.; Tu, L.; Peng, Y.; Hu, H.; Hu, T.; Xu, Z.H.; Liu, L.; Tang, Y. Effect of nitrogen additions on root morphology and chemistry in a subtropical bamboo forest. Plant Soil 2017, 412, 441–451. [Google Scholar] [CrossRef]
  44. Kong, D.; Wang, J.; Zeng, H.; Liu, M.; Yuan, M.; Wu, H.; Kardol, P. The nutrient absorption-transportation hypothesis: Optimizing structural traits in absorptive roots. New Phytol. 2016, 213, 1569–1572. [Google Scholar] [CrossRef]
  45. Wang, Y.; Dong, X.; Wang, H.; Wang, Z.H.; Gu, J. Root tip morphology, anatomy, chemistry and potential hydraulic conductivity vary with soil depth in three temperate hardwood species. Tree Physiol. 2016, 36, 99–108. [Google Scholar] [CrossRef]
  46. Hodge, A. The plastic plant: Root responses to heterogeneous supplies of nutrients. New Phytol. 2004, 162, 9–24. [Google Scholar] [CrossRef]
  47. Wang, W.; Wang, Y.; Hoch, G.; Wang, Z.H.; Gu, J. Linkage of root morphology to anatomy with increasing nitrogen availability in six temperate tree species. Plant Soil 2018, 425, 189–200. [Google Scholar] [CrossRef]
  48. Wang, G.; Fahey, T.; Xue, S.; Liu, F. Root morphology and architecture respond to N addition in Pinus tabuliformis, west China. Oecologia 2013, 171, 583–590. [Google Scholar] [CrossRef]
  49. Noguchi, K.; Nagakura, J.; Kaneko, S. Biomass and morphology of fine roots of sugi (Cryptomeria japonica) after 3 years of nirogen fertilization. Front. Plant Sci. 2013, 4, 347. [Google Scholar] [CrossRef]
  50. Geng, P.; Jin, G. Fine root morphology and chemical responses to N addition depend on root function and soil depth in a Korean pine plantation in Northeast China. For. Ecol. Manag. 2022, 520, 120407. [Google Scholar] [CrossRef]
  51. Zhu, L.; Li, J.; Song, S. Relationships between SPAD Readings and the Contents of Chlorophy II and Nitrogen in Chinese Cabbage Leaves. North. Hortic. 2010, 23, 15–17. [Google Scholar]
  52. Song, Y. Study on absolute SPAD value and relative SPAD value of maize leaves in different treatments. China Seed Ind. 2021, 7, 66–69. [Google Scholar]
  53. Zhang, J.; Li, G.; Yuan, J.; Yan, L.; Wei, X.; Liu, S.H. Effects of water and nitrogen regulation on soil and leaf stoichiomertic characteristics of spring wheat in dry farming. Arid. Zone Res. 2021, 38, 1750–1759. Available online: http://kns.cnki.net/kcms/detail/65.1095.X.20210928.1840.004.html (accessed on 26 May 2023).
  54. Zhu, Q.; Mo, B.; Zh, E. Different nitrogen rate on growth and flowering of pepper. Guizhou Agric. Sci. 2008, 36, 438–442. [Google Scholar]
  55. Li, Z.; Li, A.; Zh, L.; Cao, C.H.; Tian, S. Effect of nitrogen fertilizer application on nitrogen content of different position leaves and yield of Jindan 84. J. Shanxi Agric. Sci. 2015, 43, 1285–1289. [Google Scholar]
  56. Maiti, D.; Das, D.; Karak, T.; Banerjee, M. Management of nitrogen through the use of leaf color chart (LCC) and soil plant analysis development (SPAD) or chlorophyll meter in rice under irrigated ecosystem. Sci. World J. 2004, 4, 838–846. [Google Scholar] [CrossRef] [PubMed]
  57. Yu, H.; Wu, H.; Wang, Z.H. Evaluation of SPAD and Dualex for in-season corn nitrogen status estimation. Acta Agron. Sin. 2010, 36, 840–847. [Google Scholar]
  58. Sandhu, O.; Gupta, R.; Thind, H.; Jat, M.; Sidhu, H.; Singh, Y. Drip irrigation and nitrogen management for improving crop yields, nitrogen use efficiency and water productivity of maize-wheat system on permanent beds in northwest India. Agric. Water Manag. 2019, 219, 19–26. [Google Scholar] [CrossRef]
  59. Liu, X.; Ma, L.; Li, J.; Yang, R.; Liu, Y.; Zi, H. Effect of drip fertigation on lycium yield and quality in sandy land in northern shaanxi. J. Irri. Drain. 2020, 39, 13–16. [Google Scholar] [CrossRef]
  60. Liu, Y.; Zhou, X.; Han, H.; Yang, Q.; Liu, X. Coupling scheme optimization of panax notoginseng considering yield, quality and water-fertilizer use efficiency. Trans. Chin. Soc. Agric. Eng. 2021, 37, 139–146. [Google Scholar] [CrossRef]
  61. Ma, X.; Guo, Y.; Li, M.; Ma, X.; Zhang, Z.H.; Zhu, W.D. Leaf CO2 response curve and fruit medicinal components of Lycium ruthenicum affected by nitrogen application in the arid area. Acta Bot. Boreali-Occident. Sin. 2020, 40, 1209–1218. [Google Scholar]
  62. Ma, B.; Tian, J. Advance in research on water and fertilizer effect on yield and quality of Lycium Barbarum L. Water Sav. Irrig. 2020, 11, 6–11. [Google Scholar]
  63. Ma, Z.H.; Yin, J.; Yang, Y.; Sun, F.; Yang, Z.H. Effect of water and nitrogen coupling regulation on the growth, physiology, yield, and quality attributes and comprehensive evaluation of wolfberry (Lycium barbarum L.). Front. Plant Sci. 2023, 14, 1130109. [Google Scholar] [CrossRef] [PubMed]
Figure 1. Schematic drawing of the experimental set up.The dots of different colors in the figure represent the root tubes arranged for different treatments, and the specifications and arrangement of the root tubes are completely consistent.
Forests 14 02317 g001
Figure 2. Field layout and experimental conditions of the study area. (A) General view of the test site; (B) Wolfberry fruit branch of Ningqi No.7; (C) Rooting tubes placement; (D) CI-600 root monitoring system; (E) Photo of roots in soil.
Forests 14 02317 g002
Figure 3. Acquisition process of wolfberry root morphological characteristic data based on deep learning.
Forests 14 02317 g003
Figure 4. Survey index map of aboveground and underground part of wolfberry plant in this experiment.
Forests 14 02317 g004
Figure 5. Incremental variance analysis of root morphological characteristics of Lycium barbarum L. at each phenological period under different nitrogen application levels. The horizontal axes I, II, III, IV, and V represent the budding and unfolding stage, leaf growth period and flowering period, summer fruit period, autumn branch budding period and autumn flowering period, and autumn fruit period, respectively; the results of one-way ANOVA test according to the Student–Newman–Keuls (S–N–K) test; different lowercase letters in the same phenological period indicate that the indicators were significantly different from each other (p < 0.05).
Forests 14 02317 g005
Figure 6. Growth of fine roots in each diameter class at different soil depths under the N1 treatment. (a) The corresponding phenological period is the budding and unfolding stage; (b) The leaf growth and flowering periods; (c) The fruiting period in summer; (d) The branch budding and flowering periods in autumn; and (e) The fruiting period in autumn.
Forests 14 02317 g006
Figure 7. Growth of fine roots in each diameter class at different soil depths under the N2 treatment. (a) The corresponding phenological period is the budding and unfolding stage; (b) The leaf growth and flowering periods; (c) The fruiting period in summer; (d) The branch budding and flowering periods in autumn; and (e) The fruiting period in autumn.
Forests 14 02317 g007
Figure 8. Growth of fine roots in each diameter class at different soil depths under the N3 treatment. (a) The corresponding phenological period is the budding and unfolding stage; (b) The leaf growth and flowering periods; (c) The fruiting period in summer; (d) The branch budding and flowering periods in autumn; and (e) The fruiting period in autumn.
Forests 14 02317 g008
Table 1. One-way ANOVA of the increment of total root length of wolfberry under different nitrogen application rates in specific phenological period.
Different TreatmentBudding and
Unfolding Stage
Leaf Growth
Period and
Flowering Period
Summer Fruit PeriodAutumn Branch
Budding Period and
Autumn Flowering Period
Autumn Fruiting PeriodCumulative
Increment
N1959.58 ± 104.98 a803.20 ± 57.04 b443.69 ± 123.66 a795.19 ± 14.72 a111.99 ± 5.37 b3113.65
N2389.81 ± 61.66 b1479.95 ± 61.83 a440.25 ± 106.10 a806.94 ± 24.63 a440.55 ± 22.57 a3557.5
N3165.21 ± 94.08 b734.15 ± 24.49 b489.26 ± 79.42 a384.08 ± 48.84 b234.30 ± 48.57 b2007
Note: Results of one-way ANOVA test according to Student–Newman–Keuls (S–N–K); Different lowercase letters in the same column indicate that the indicators were significantly different from each other (p < 0.05). The data in the table represent the mean ± standard deviation.
Table 2. One-way ANOVA of the increment of root growth of wolfberry in different diameter classes under the N1 treatment determined every month from April until September.
Phenological PeriodTimeIncrement of Different-Class Fine root Growth/(cm)
Diameter
0–0.4 mm
Diameter
0.41–0.8 mm
Diameter
0.81–1.2 mm
Diameter
1.21–1.6 mm
Diameter
1.61–2.0 mm
Diameter
>2.0 mm
Budding and unfolding stage4.10–5.10211.49 ± 23.51 b547.44 ± 183.85 a159.51 ± 20.26 bc30.40 ± 8.22c7.64 ± 0.42 c3.09 ± 1.37 c
Leaf growth period and flowering period5.10–6.10186.68 ± 42.75 b303.55 ± 99.97 a237.46 ± 52.30 ab51.94 ± 3.71 c15.16 ± 3.25 c8.40 ± 2.51 c
Summer fruit period6.10–7.10139.64 ± 53.15 ab234.52 ± 119.65 a52.45 ± 44.94 b13.87 ± 32.09 b2.76 ± 12.60 b0.47 ± 8.88 b
Autumn branch budding period and autumn flowering period7.10–8.10109.57 ± 22.97 c389.85 ± 39.43 a235.89 ± 31.38 b41.29 ± 23.30 d13.20 ± 12.95 d5.39 ± 9.92 d
Autumn fruiting period8.10–9.10−36.68 ± 103.88 a65.34 ± 38.78 a14.50 ± 18.47 a0.69 ± 2.53 a−0.66 ± 0.97 a1.22 ± 1.81 a
Cumulative root growth610.701540.70699.81138.1938.1018.57
The proportion of the total increment of the annual root length20.0%50.6%23.0%4.5%1.3%0.6%
Note: One-factor analysis of variance (ANOVA) based on S–N–K; different lowercase letters indicate that the increment of fine root length measured in the same month is significantly different among the fine roots in different diameter classes (p < 0.05). Data in the table present the mean ± standard deviation.
Table 3. One-way ANOVA of the increment of root growth of wolfberry in different diameter classes under the N2 treatment determined every month from April until September.
Phenological PeriodTimeIncrement of Different-Class Fine Root Growth/(cm)
Diameter
0–0.4 mm
Diameter
0.41–0.8 mm
Diameter
0.81–1.2 mm
Diameter
1.21–1.6 mm
Diameter
1.61–2.0 mm
Diameter
>2.0 mm
Budding and unfolding stage4.10–5.10121.85 ±18.11b326.30 ± 62.33 a−51.61 ± 21.32 c−6.91 ± 3.70 c0.77 ± 0.35 c−0.59 ± 2.91 c
Leaf growth period and flowering period5.10–6.10306.19 ± 37.39 c601.35 ± 33.75 a460.92 ± 134.65 b87.98 ± 30.65 d17.26 ± 9.96 d6.24 ± 2.38 d
Summer fruit period6.10–7.1059.74 ± 27.30 a162.95 ± 142.64 a166.50 ± 165.23 a38.11 ± 30.80 a9.51 ± 7.40 a3.44 ± 3.85 a
Autumn branch budding period and autumn flowering period7.10–8.10135.10 ± 28.36 b438.28 ± 65.68 a194.79 ± 57.76 b31.18 ± 10.15 c6.00 ± 1.87 c1.59 ± 0.99 c
Autumn fruiting period8.10–9.1094.06 ± 56.63 b282.44 ± 50.95 a55.25 ± 20.41 bc8.19 ± 4.67 c0.47 ± 0.99 c0.15 ± 0.26 c
Cumulative root growth716.941811.32825.85158.5534.0110.83
The proportion of the total increment of the annual root length20.15%50.92%23.21%4.46%0.96%0.30%
Note: One-factor analysis of variance (ANOVA) based on S–N–K; different lowercase letters indicate that the increment of fine root length measured in the same month is significantly different among the fine roots in different diameter classes (p < 0.05). Data in the table present the mean ± standard deviation.
Table 4. One-way ANOVA of the increment of root growth of wolfberry in different diameter classes under the N3 treatment determined every month from April until September.
Phenological PeriodTimeIncrement of Different-Class Fine Root Growth/(cm)
Diameter
0–0.4 mm
Diameter
0.41–0.8 mm
Diameter
0.81–1.2 mm
Diameter
1.21–1.6 mm
Diameter
1.61–2.0 mm
Diameter
>2.0 mm
Budding and unfolding stage4.10–5.104.39 ± 0.25 b138.47 ± 8.25 a5.61 ± 0.05 b9.52 ± 0.52 b5.43 ± 0.58 b1.79 ± 0.76 b
Leaf growth period and flowering period5.10–6.10101.96 ± 70.45 b290.77 ± 40.54 a263.78 ± 110.95 a58.89 ± 34.27 b12.46 ± 6.41 b6.29 ± 2.42 b
Summer fruit period6.10–7.1046.85 ± 2.44 b193.43 ± 40.00 a183.52 ± 112.72 a49.36 ± 35.85 b11.54 ± 9.54 b4.56 ± 5.06 b
Autumn branch budding period and autumn flowering period7.10–8.10−37.02 ± 75.36 b228.53 ± 62.77 a154.85 ± 58.04 a26.43 ± 19.63 b6.00 ± 3.95 b5.28 ± 7.02 b
Autumn fruiting period8.10–9.10135.75 ± 43.14 a106.45 ± 61.55 a−6.29 ± 15.68 b−1.49 ± 3.70 b−0.11 ± 1.33 b−0.02 ± 0.33 b
Cumulative root growth251.93957.65601.47142.7135.3217.9
The proportion of the total increment of the annual root length12.55%47.72%29.97%7.11%1.76%0.89%
Note: One-factor analysis of variance (ANOVA) based on S–N–K; different lowercase letters indicate that the increment of fine root length measured in the same month is significantly different among the fine roots in different diameter classes (p < 0.05). Data in the table present the mean ± standard deviation.
Table 5. Nitrogen contents and SPAD values of wolfberry leaves under different nitrogen treatments.
Leaf Blade PartNitrogen ContentSPAD
N1N2N3N1N2N3
The tender tip leaf9.42 ± 1.93 b9.64 ± 2.03 a10.54 ± 1.04 a21.47 ± 6.40 b22.13 ± 6.22 a24.93 ± 3.21 a
Middle leaf11.48 ± 0.32 c12.02 ± 0.98 a11.74 ± 1.51 b27.88 ± 5.46 c29.62 ± 3.10 a28.74 ± 4.76 b
Basal leaf12.30 ± 1.36 c12.52 ± 1.36 a12.50 ± 1.30 b21.22 ± 4.30 b31.20 ± 4.92 a31.14 ± 4.12 b
Note: One-way ANOVA according to S–N–K; different lower-case letters indicate that the index is significantly different among treatments (p < 0.05). The data in the table present the mean ± standard deviation.
Table 6. One-way ANOVA of the nutritional composition of wolfberry fruits under different nitrogen treatments.
Different Nitrogen TreatmentTotal Sugar/(g·100 g−1)Lycium Barbarum Polysaccharide/(g·100 g−1)Total Flavonoids/(g·100 g−1)Betaine/(g·100 g−1)β-Carotene/(g·100 g−1)
N134.90 ± 0.00 c5.62 ± 0.07 a0.057 ± 0.000 a1.22 ± 0.01b9.66 ± 0.07 b
N235.63 ± 0.15 b4.96 ± 0.13 b0.049 ± 0.000 b1.22 ± 0.03b10.43 ± 0.19 a
N339.60 ± 0.00 a4.75 ± 0.19 b0.048 ± 0.000 c1.54 ± 0.03a10.61 ± 0.38 a
Note: Using S–N–K one-way ANOVA, different lower-case letters in the same column indicate that the index is significantly different between treatments (p < 0.05). The data in the table are presented as the “mean ± standard deviation”.
Table 7. Eigenvectors, eigenvalues, contribution rates, and cumulative contribution rates of the 2 principal components (PC1 and PC2) to the explained variance of the variables.
ProjectPC1PC2
Total root length increment0.3460.120
Total root projection area increment0.2350.330
Total root surface area increments0.2370.327
Root mean diameter increment−0.221−0.344
Root volume increment0.2520.311
The number of root tips increment0.3360.158
Mean leaf nitrogen content−0.2850.266
Mean leaf SPAD−0.2160.348
Total sugar−0.3560.064
Lycium barbarum polysaccharide0.247−0.317
Total flavonoids0.210−0.353
Betaine−0.3600.001
β-carotene−0.2320.332
Eigenvalue7.6985.302
Contribution rate of variance59.21240.788
Cumulative variance contribution rate59.212100.000
Table 8. Comprehensive quality ranking based on the F1 and F2 axes of PCA of the growth and development of wolfberry plants under different nitrogen application treatments.
Different TreatmentsF1F2FRank
N11.594−2.3080.0022
N21.6092.3011.8911
N3−3.2030.006−1.8943
Disclaimer/Publisher’s Note: The statements, opinions and data contained in all publications are solely those of the individual author(s) and contributor(s) and not of MDPI and/or the editor(s). MDPI and/or the editor(s) disclaim responsibility for any injury to people or property resulting from any ideas, methods, instructions or products referred to in the content.

