Article

Functional Diversity Accelerates the Decomposition of Litter Recalcitrant Carbon but Reduces the Decomposition of Labile Carbon in Subtropical Forests

1
Jiangxi Academy of Forestry, Nanchang 330032, China
2
Institute of Geographic Sciences and Natural Resources Research, Chinese Academy of Sciences, Beijing 100101, China
*
Authors to whom correspondence should be addressed.
These authors contributed equally to this work.
Forests 2023, 14(11), 2258; https://doi.org/10.3390/f14112258
Submission received: 22 October 2023 / Revised: 9 November 2023 / Accepted: 14 November 2023 / Published: 16 November 2023
(This article belongs to the Topic Litter Decompositions: From Individuals to Ecosystems)

Abstract

:
The biodiversity of litter can regulate carbon and nutrient cycling during mixed decomposition. It is common knowledge that the decomposition rates of mixed litters frequently deviate from those predicted for these component litter species. However, the direction and magnitude of the nonadditive effects on the degradation of mixed litters remain difficult to predict. Previous studies have reported that the different carbon fractions of leaf litters responded to litter mixture differently, which may help to explain the ambiguous nonadditive effect of diversity on bulk litter decomposition. Therefore, we conducted decomposition experiments on 32 litter mixtures from seven common tree species to test the responses of different carbon fractions to litter diversity in subtropical forests. We found that the overall mass loss of the mixed litter was faster than that estimated from single species. The relative mixing effects (RMEs) of different carbon fractions exhibited different patterns to litter diversity and were driven by different aspects of litter functional dissimilarity. Soluble carbon fractions decomposed more slowly than expected from single species, while lignin fractions decayed more quickly. Moreover, we found that the RMEs of bulk litter decomposition may be determined by the lignin fraction decomposition. Our findings further support that distinguishing the response of different carbon fractions to litter diversity is important for elucidating the nonadditive effects of total litter decomposition.

1. Introduction

The increasing loss of biodiversity worldwide has raised concerns about its associated changes to ecosystem functioning [1]. The biodiversity of litter can modify carbon and nutrient retention and release during mixed decomposition [2,3]. An earlier assessment found that 50% of all litter mixtures accelerated decomposition (synergistic effect) and 20% of all cases retarded mass losses (antagonistic effect) when compared to those estimated from single species [4]. Recent meta-analysis reviews also indicated that decomposition was faster when litter contained multiple species [5,6]. Up to now, these studies have not yet summarized a generalized nonadditive relationship between biodiversity and leaf litter decomposition [7,8].
The magnitude and direction of litter mixing effects may depend on the definition and measurement of litter diversity and decomposition [5,8]. Diversity has been distinguished as species richness, functional diversity, and phylogenetic diversity [9,10,11]. Indeed, both species richness and phylogenetic diversity were found to have poor predictability for mixing effects on litter decomposition [12,13]. The underlying reasons behind the weak correlation may be that litter’s functional traits, rather than its taxonomic or phylogenetic identity, modulate decomposition [8,14]. Several studies have reported the significant relationships between litter mixing effects and functional diversity [6,15,16,17], which may provide differential information on multiple traits among different litter species [18].
In addition, exploring the potential process of litter decomposition may help to understand the ambiguous nonadditive effect of diversity on decomposition [5]. Previous studies have summarized roughly four mechanisms which are examining the complex consequences of litter diversity effects on decomposition [2,3,15,19]. (1) Nitrogen transfer from nitrogen-rich to nitrogen-poor litter can facilitate decomposition [2,20]. (2) Microclimatic conditions are improved in litters with a high water-holding capacity, or habitat diversity is increased in structurally diverse litter layers [21,22]. (3) Specific compounds such as polyphenols released from species-specific litter may stimulate or inhibit decomposition [18]. (4) Priming induced by a fast-decomposing carbon pool may accelerate or decelerate the decomposition of a slower-decomposing pool [23].
Focusing on the decomposition processes of different carbon fractions may provide a new perspective for us to understand litter diversity effects [8]. Plant litters usually consist of water-soluble compounds, hemicellulose, cellulose, and lignin [24]. Labile carbon, such as water-soluble compounds in litters, may be consumed by decomposers or leached with rainfall in the early decomposition stage [3], while recalcitrant carbon fractions (hemicellulose, cellulose, and lignin) are degraded by microorganisms or specialist microorganisms during the middle and later decomposition stages [25]. Due to the contrasting decomposition difficulty and different release order [26,27,28], it can be expected that different carbon fractions may respond differently to litter mixture [8,19]. One previous study has reported that synergistic effects dominate in the early stage of decomposition, while the mixing effects switched to antagonistic effects in the later stages of decomposition [29]. If we only focus on the decomposition of the litter’s overall mass, we are likely to overlook the litter diversity effects of different carbon fractions, thus blurring the overall diversity effects [19].
Although different carbon fractions may have different responses to litter mixture, they have rarely been evaluated. Currently, there are only two relevant research studies, reported by [8,19]. The former showed that litter mixture slowed the decomposition of the labile carbon fraction, while having no effect on the recalcitrant carbon. The latter reported that litter diversity accelerated the decomposition of the labile carbon while slowing down the recalcitrant carbon. These two studies have showed completely opposite results in different carbon fractions, and the mechanism behind these opposite results is still unclear. Therefore, the effects of litter diversity on the litter decomposition of different carbon fractions remain uncertain and is worth further exploration.
To enrich the diversity effects of litter decomposition on the overall mass and different carbon fractions, we conducted experiments on mixed litter decomposition and single-species litter decomposition using seven common tree species in subtropical forests. We hypothesize that (1) the overall mass loss of the mixed litter may be faster than that estimated from the single species; (2) different carbon fractions may have different responses to litter diversity, and the faster overall mass loss may be owing to the faster loss of the labile carbon fraction; and (3) the functional dissimilarity of mixed litter traits may drive the mixing effects of different carbon fractions.

2. Method

2.1. Experiment Site

The study was conducted in Wugongshan forest farm, Anfu County, Jiangxi Province, China (27°18′ E, 114°16′ N; 200–290 m a.s.l.). The mean annual temperature is 17.7 °C, with mean annual precipitation of 1400–1600 mm, belonging to a subtropical monsoon climate; the substrate is predominantly ultisols. The forest is dominated by evergreen coniferous species such as Pinus massoniana, Cunninghamia lanceolata, Pinus taeda, and Pinus elliottii. The shrub layer mainly includes Loropetalum chinense, Camellia oleifera, and Vitex negundo var. cannabifolia, among others. In this study, the decomposition experiment was conducted in a pure Masson pine forest. General information on forest stand and soil are shown in the Supplementary Materials (Table S1).

2.2. Experimental Design

This study established 39 combinations, including 7 single-species treatments (P. massoniana, Liquidambar formosana, Schima superba, Quercus glauca, Quercus rubra, Castanopsis sclerophylla, and Phoebe bournei) and 32 multiple-species mixture treatments (Table 1). Two gradients were included in the experiment: the tree species diversity gradient and the functional trait diversity gradient (Table 1). On the tree species diversity gradient, combinations ranging from 2 to 7 tree species were established. For each tree species diversity gradient, all possible litter combinations of the gradient were listed, and the functional diversity index (FDis) was calculated using the FD software package in R language (Version 4.3.0). After calculating the functional diversity index (FDis), six combinations were selected from each tree species gradient based on the ascending order of FDis. The selection criteria were that the six combinations were evenly distributed in the functional diversity index. For the six-tree-species and seven-tree-species litter combinations, all seven possible combinations of six tree species and one combination of seven tree species were selected for the experiment.
In autumn 2020 and spring 2021, freshly senesced leaf litters were collected from the forest floor in Wugongshan forest farm, and placed indoors to dry naturally. For each combination, litterbags were filled with air-dried litters (6 g oven-dried mass at 65 °C), with each component species in equal proportions. The air-dried litter leaves were dried in an oven to calculate the moisture content of each species for converting the oven-dried weight. The litterbags were made of nylon mesh (1 mm aperture) with a size of 20 × 25 cm. On 16 April 2021, 624 litterbags (39 treatments × 4 replicates × 4 harvests) were placed on the pure Masson pine forest floor in four blocks. The bags were randomly located within blocks and separated from each other by at least 20 cm. Litterbags were harvested about every three months from the four blocks on 30 July 2021, 25 October 2021, 13 January 2022, and 16 April 2022, respectively. The bags were brought back to the laboratory, and the litters were manually cleaned of adhering soil, allochthonous litter, ingrown plant material, and soil animals, and were separated by tree species. The remaining litter were then oven-dried (65 °C for 48 h) and weighed.

2.3. Litter Traits Determination

The litter carbon fractions were measured via a proximate analysis [30]. The carbon fractions of litter included water-soluble extractables (water-soluble carbon, nitrogen, phosphorus, and simple sugars), non-polar extractables (keratin, waxes, and phenolic compounds), acid-hydrolyzable components (hemicellulose and cellulose), and acid-unhydrolyzable components (lignin, condensed tannins, and their decomposition products). The non-polar extractables and water-soluble extractables were extracted using the Soxhlet extraction method and the water bath heating method [31]. Then, 72% sulfuric acid was added to extract the acid-hydrolyzable components, and the remaining residue that was washed with boiling distilled water was the acid-unhydrolyzable components. In this study, we combine water-soluble compounds and non-polar extractables as “Soluble” carbon fractions hereafter, and define acid-hydrolyzable components as “Cellulose” and acid-unhydrolyzable components as “Lignin” carbon fractions.
To calculate the functional diversity of the litter mixtures, we analyzed the physical and chemical properties of each species. The physical properties include the specific leaf area (SLA), leaf thickness (LT), leaf toughness (TH), tensile strength (TS), standard water-holding capacity (Wstd), and saturated water-holding capacity (Wmax). The specific leaf area was calculated based on the ratio of the leaf area to the dry weight of the leaf litter. The leaf thickness was measured using a vernier caliper. The toughness and tensile strength were measured using a tensile tester. The standard water-holding capacity was calculated based on the ratio of the difference between the leaf weight after soaking for 1 h and the dry weight. The saturated water-holding capacity was calculated based on the ratio of the difference between the leaf weight after soaking for 24 h and the dry weight [32]. The chemical properties include the total carbon (C), nitrogen (N), phosphorus (P), potassium (K), copper (Cu), magnesium (Mg), manganese (Mn), iron (Fe), zinc (Zn), calcium (Ca), lignin, and cellulose. The chemical elements were measured through a multi-element analyzer (FLASH 2000 CHNS/O). The lignin and cellulose content of litters were determined using the acid-washing method [33,34]. We also computed the C/N, C/P, N/P, lignin/N, and lignin/P ratios as litter stoichiometry traits. All trait information for the seven tree species is given in the Supplementary Materials (Table S2). Based on these litter traits and the relative abundance of the single-species litter in the litter mixtures, we calculated the litter functional dissimilarity (FD) using Rao’s quadratic entropy [35] as follows:
F D i k = i = 1 N k = 1 N p i × p k × d i k
where pi and pk are the relative abundance (masses) of functional types i and k, respectively, and dik is the trait dissimilarity based on the pairwise Euclidean distance between species i and k in the functional trait space.

2.4. Data Analysis

To analyze the diversity effects on the litter decomposition, we first calculate the decomposition rate of total mass and different carbon fractions (soluble, cellulose, and lignin carbon fractions). The remaining rates (R) of litter total mass or carbon fractions were calculated using the following formula:
R = M t × C t M 0 × C 0 × 100 %
where M0 and Mt are the dry litter mass of the initial and each harvest, respectively. C0 and Ct are the carbon fraction concentrations of the initial and each harvest, respectively. To compute the decomposition rates (k), we fitted the remaining rates (R) of the litter mass and carbon fractions with the three commonly used models: (1) the single exponential, (2) double exponential, and (3) asymptotic decomposition models [31,36]. Based on the corrected Akaike Information Criterion, the single exponential model had better fitting performance than the double exponential or asymptotic models in this study.
To determine the effects of litter mixing on the decomposition of the litter total mass/carbon fractions, we calculated the relative mixing effects (RMEs) [37] of each litter mixture through the observed and expected mass loss or decomposition rate (k) as follows:
R M E s = O b e E x p E x p × 100 %
where Obe is the observed mass loss or decomposition rate (k) and Exp is the average mass loss or decomposition rate (k) calculated based on the values decomposed separately by the composed species. The mean RMEs and 90% confidence intervals are calculated in the Supplementary Materials (Table S3). When a given mixture’s confidence interval does not include 0, its RME is nonadditive. Nonadditive RMEs indicate either a lower (antagonistic) or a higher (synergistic) rate of decomposition than what is expected based on a single species (RMEs = 0). Mixtures that conform to expectations are considered to have decomposed additively.
To detect the mixing effects in the process of decomposition, we analyzed the relationships between the RMEs and litter total mass/carbon fraction losses. To assess the relationships between the functional diversity of the mixtures and the RMEs of the litter total mass/carbon fraction losses, we used a principal components analysis (PCA) to synthesize the multiple indices of the litter’s functional dissimilarity. Then, we used Pearson correlations to visualize the relations between the PCA axes of the litters’ functional diversity and the RMEs of the litter total mass/carbon fractions in the PCA maps. We used multiple mixed-effects regression modeling to explore the relationship between the PCA axes of the litters’ functional diversity and the RMEs of the litter total mass/carbon fraction decomposition rates (k), and then fitted the simple mixed-effects linear regressions with the smallest p-value PCA axes in multiple mixed linear regressions (Table S4). The structure of the models was as follows:
Y ~ X i β i + B l o c k / M i t u r e   T y p e   μ + ε
where Y is the dependent variable (RMEs of litter total mass or different fractions’ decomposition rates), Xi is the known vector of values for a given fixed predictor, i (PCA axes of the litters’ functional diversity), β is an unknown vector of fixed effects for predictor i, μ is an unknown vector of random effects corresponding to the random effect of the mixture type nested in the block, and ε is an unknown vector of random errors.
To clarify the driving factors of decomposition of the litter total mass/carbon fractions, the partial least squares regression (PLS-R) models were used to explore the effects of the initial litter’s physical and chemical traits on the decomposition rates (k) of the litter total mass/carbon fractions. Because the litter traits were usually autocorrelated, the partial least squares models could effectively eliminate multicollinearity between the trait variables [38]. The relative influence of a single trait variable on the decomposition rate may be represented by the variable importance of projection (VIP), which is the sum of the variable’s influence over all model dimensions divided by the total variation explained by the model. If the VIP value is greater than 1, it indicates that the single trait variable is the most relevant and significant for explaining the decomposition rate [31]. The model strength was assessed based on the proportion of variance in the dependent variable that was explained by the model (R2) and the proportion of variance in the dependent variable that was predicted by the model (Q2). A PLS component is considered significant when Q2 exceeds a critical value of 0.097 [39].
A one-way ANOVA with Tukey’s multiple comparisons was applied to examine the differences in mass loss and decomposition rate between species. All data were checked for normal distribution and homoscedasticity of residuals. The one-way ANOVAs were conducted with SPSS 16.0 (SPSS Inc., Chicago, IL, USA). Mixed-effects models were fit using the lmer function in the lme4 R package with a log-likelihood criterion [40].

3. Results

3.1. The Decomposition Patterns of Litter Mass and Carbon Fractions

There were significant differences in the litter total mass and different carbon fraction loss and decomposition rate among the different tree species (Table 2 and Figure 1). After one year of decomposition, the litter mass loss ranged from 23.1% (P. bournei) to 51.6% (L. formosana). The decomposition of the soluble carbon fraction (ranging from 54.9% to 79.7%), cellulose carbon fraction (27.3%–66.2%) and lignin carbon fraction (14.9%–28.9%) showed similar patterns (Table 2). Overall, the decomposition rate of the soluble carbon fraction was the fastest, while that of the lignin carbon fraction was the slowest (Figure 1). Species at the early successional stage such as P. massoniana, L. formosana, and S. superba had higher decomposition rates, and species in the later stage of succession such as P. bournei and C. sclerophylla had lower decomposition rates.

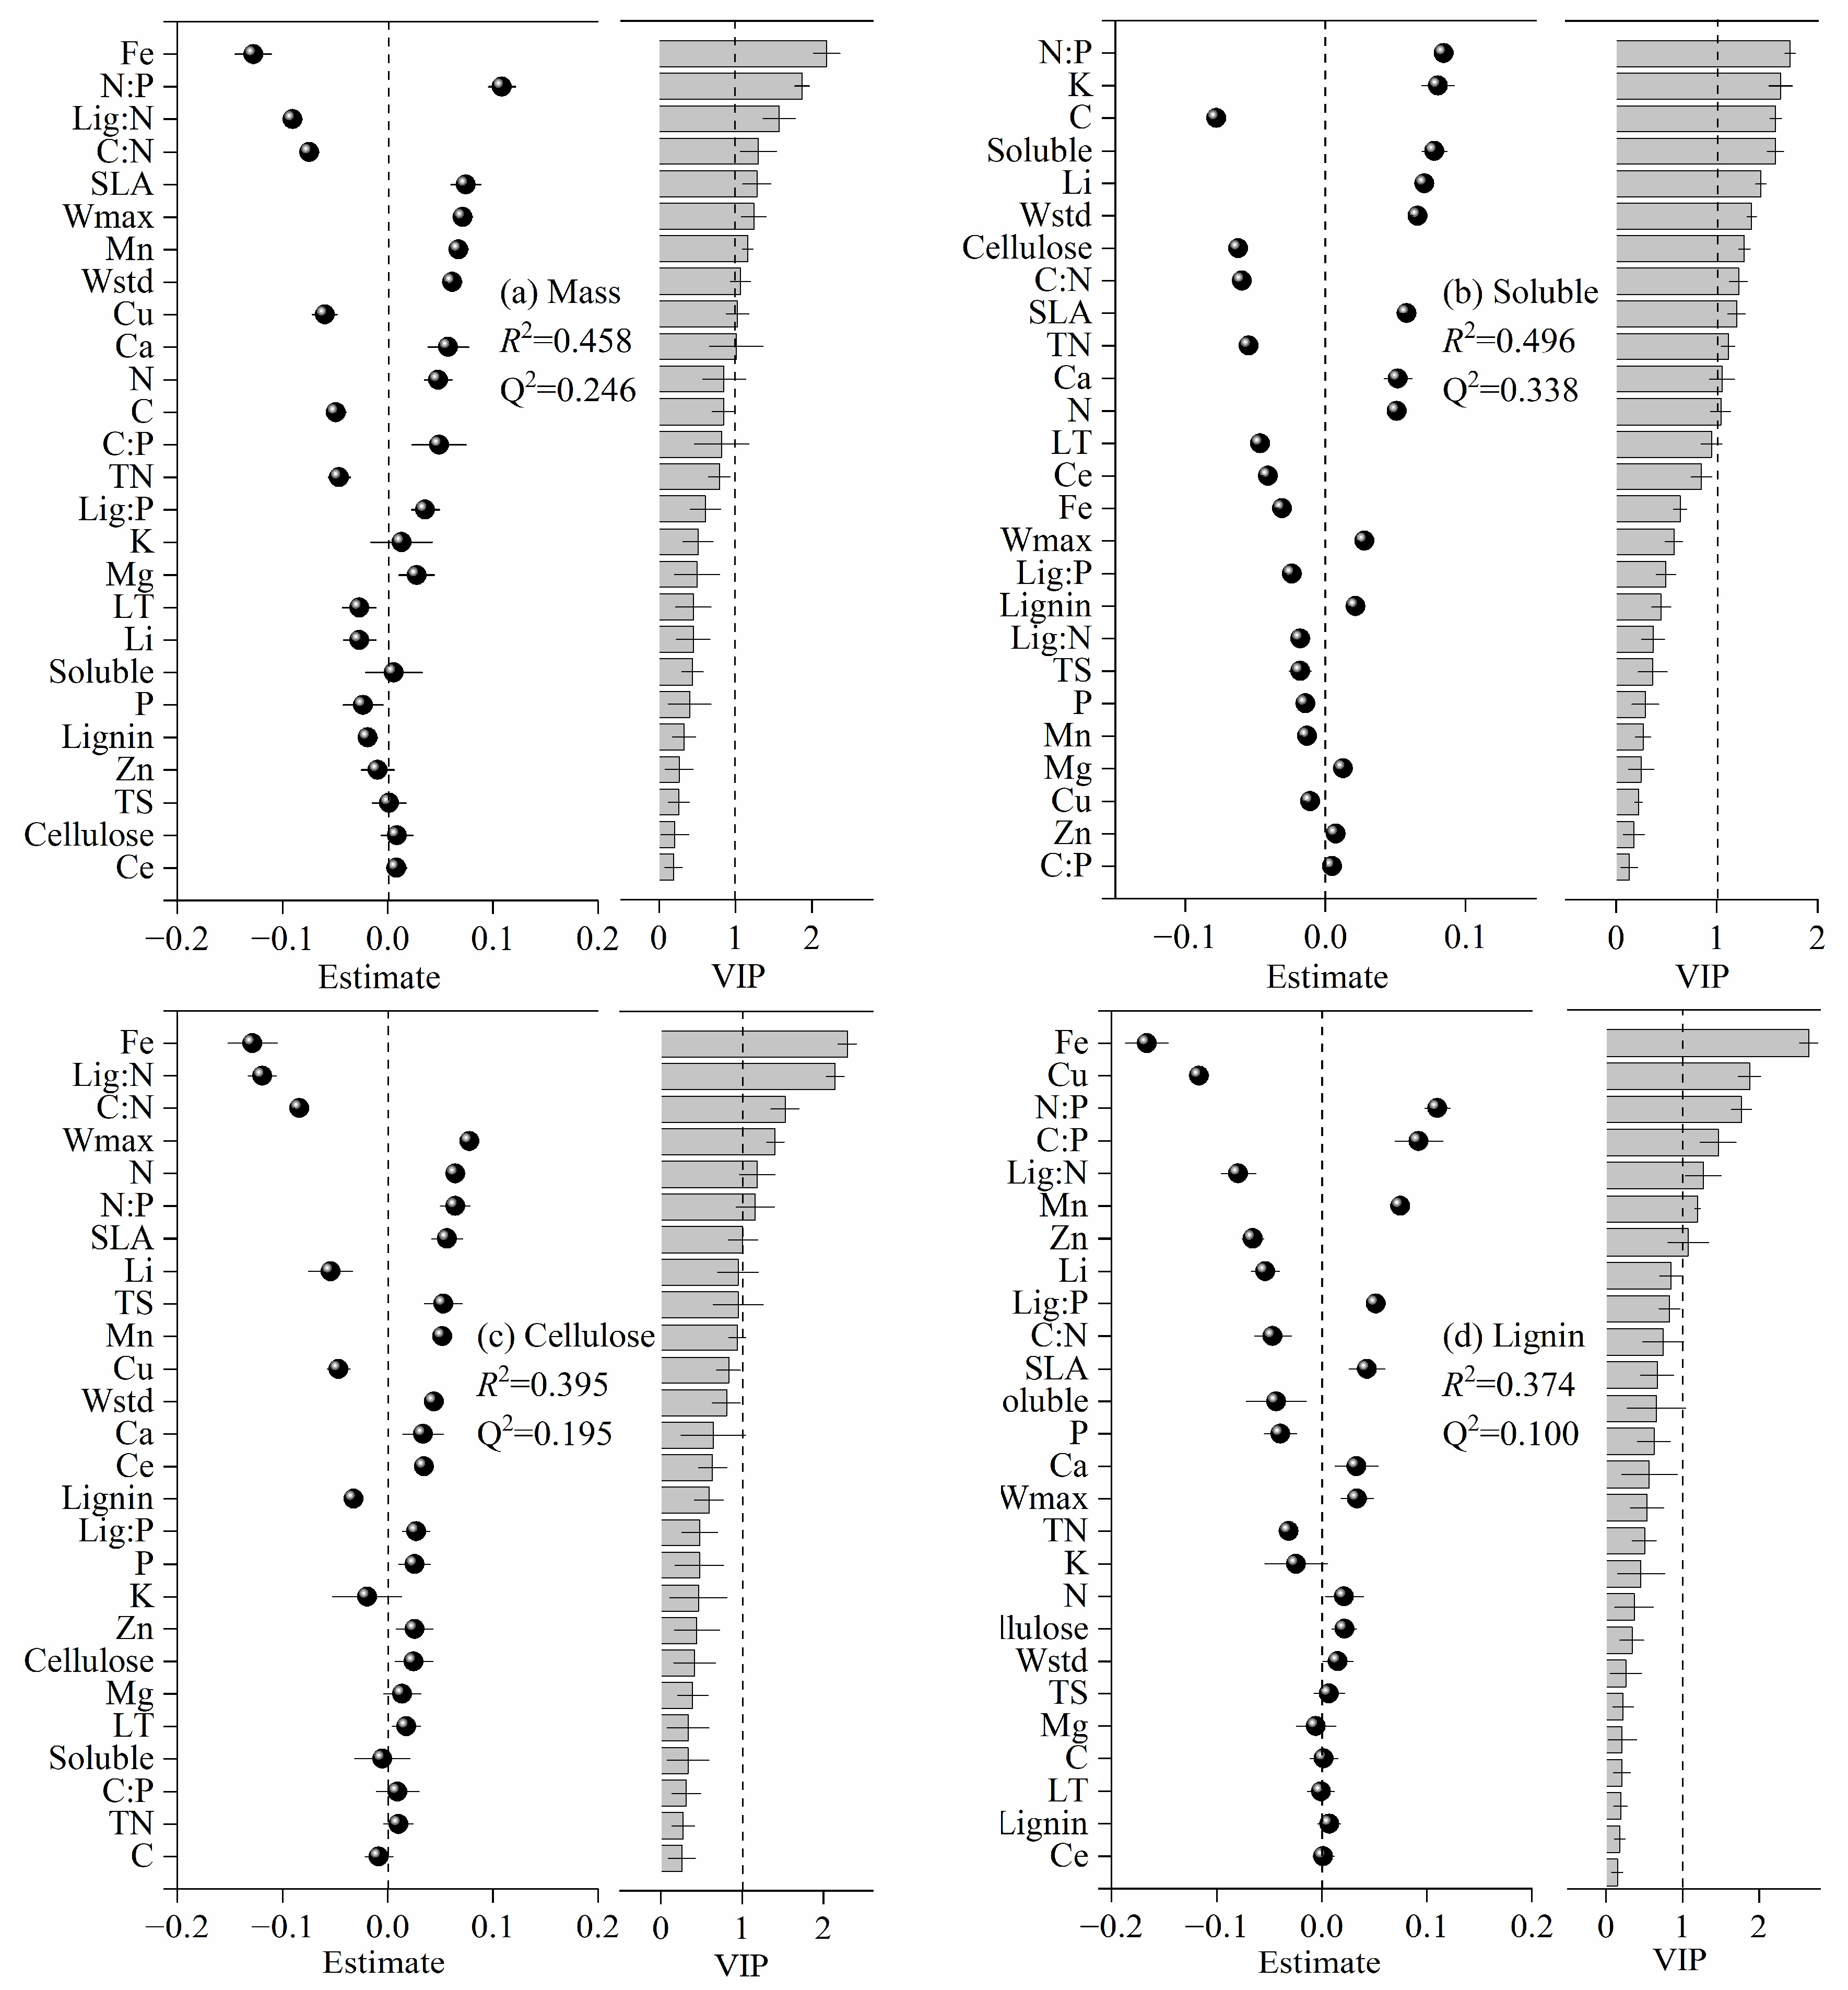
3.2. Relationships between Litter Traits and Decomposition

The initial litter’s physical, chemical, and stoichiometric traits explained 37.4%~49.6% of the decomposition rates, which not only strongly drove the decomposition rates of the litter total mass, but also significantly regulated the decomposition rate of the different carbon fractions (Figure 2). Higher initial litter chemistry traits for N, Mn, and Ca significantly accelerated the decomposition rates of the litter total mass and carbon fractions, while initial C, Fe, and Cu suppressed the decomposition. Initial litter physical traits of SLA, Wstd, and Wmax significantly promoted the decomposition of the litter total mass and carbon fractions, except for the lignin fraction. A higher initial litter stoichiometric trait for N/P also supported the decomposition rates, while C/N and Lig/N significantly limited the decomposition. For the litter’s carbon quality, higher initial litter soluble compounds had a significant positive effect on the decomposition rates of the soluble fractions.

3.3. The Relative Mixing Effects of Litter Mass and Carbon Fractions

Overall, the relative mixing effects of the litter total mass and carbon fraction decomposition were mostly manifested as nonadditive effects (Table 3); 72% of the decomposition of the litter total mass was faster than expected based on a single species (synergistic), and six mixtures were consistent with the expected decomposition rate (additive), whereas only three mixtures were slower than expected (antagonistic). Different carbon fractions exhibited different patterns. All soluble carbon fractions decomposed more slowly than expected, while almost lignin fractions decomposed more quickly than expected, and about 43% of cellulose fractions exhibited antagonistic effects.
In the litter decomposition process, the total mass loss was higher than expected based on a single species and showed synergistic effects for the mixtures. The RMEs of the total mass loss gradually increased with time, with an average RME of 8.09% across harvests (p < 0.001; Figure 3a). The soluble fraction loss was slower than expected based on a single species and showed an overall antagonistic effect for the mixtures. The RMEs of the soluble fraction loss increased with time, switching from negative to near-null, with an average RME of −29.34% across harvests (p < 0.001; Figure 3b). The RMEs of the cellulose fraction loss increased with time, with an average RME of −3.33% across harvests, switching from negative to positive (p < 0.001; Figure 3c). The lignin fraction loss was faster than expected based on a single species and showed an overall synergistic effect. The RMEs of lignin loss decreased with time, with an average RME of 207.72% across harvests (Figure 3d).

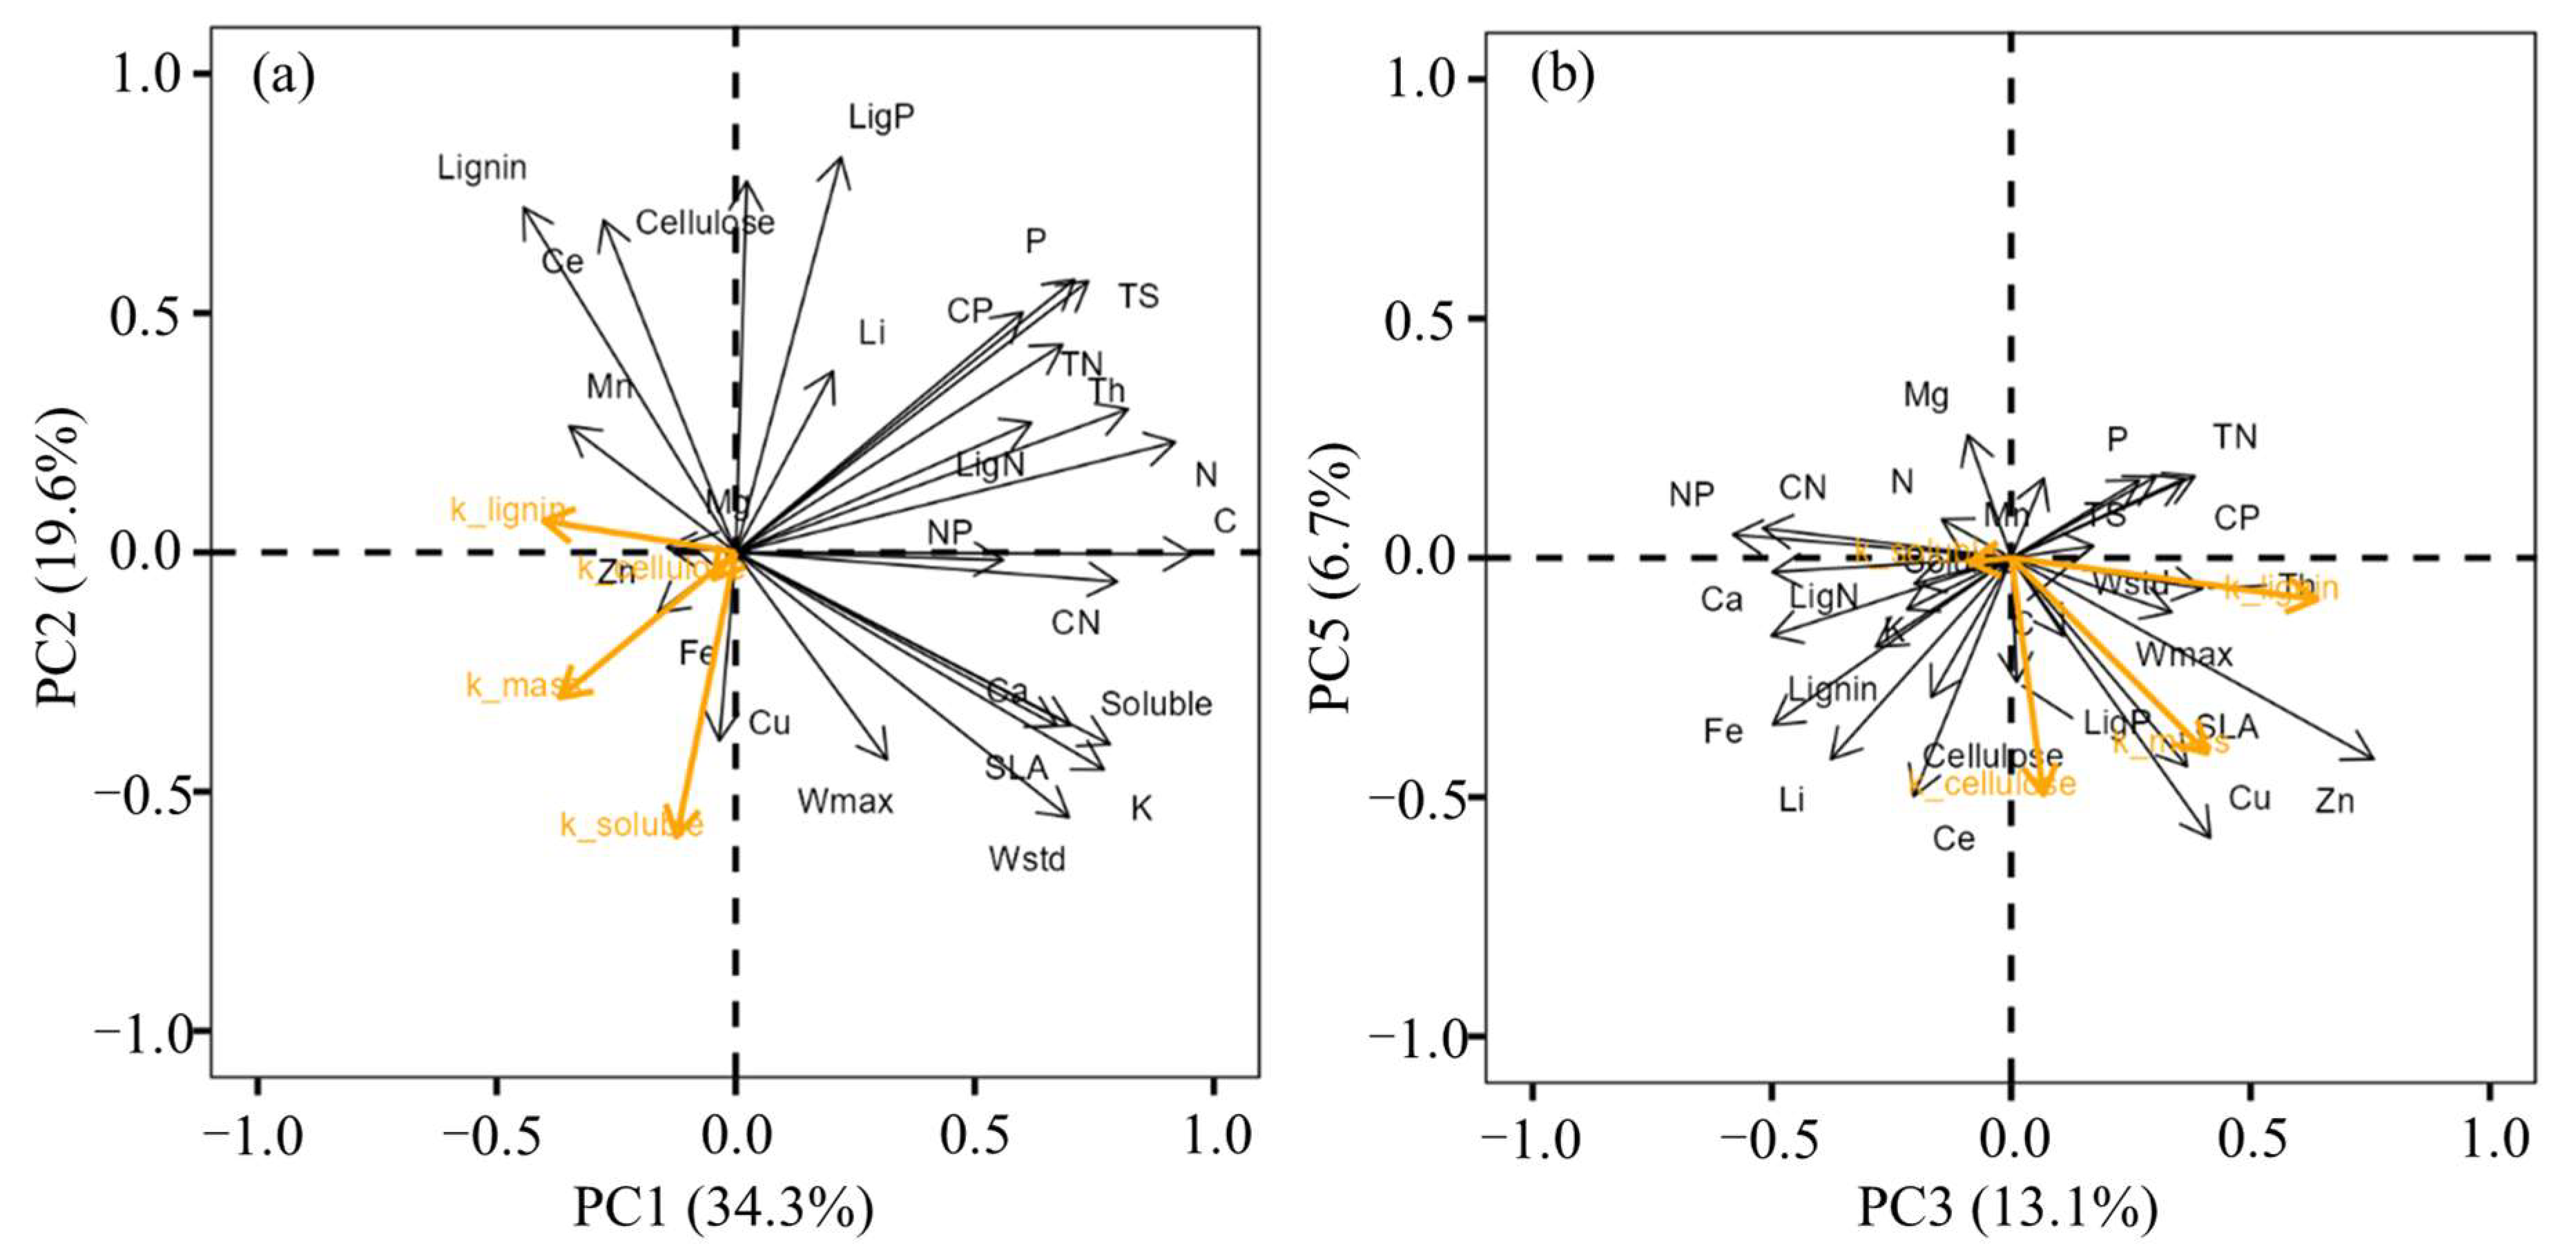
3.4. Relationships between Functional Dissimilarity and RMEs

The RMEs of the decomposition rates (k) of the litter total mass showed a synergistic effect and increased with the third PC axis of the litters’ functional diversity (PC3, p < 0.05; Figure 4b and Figure 5a), which was positively related to a dissimilarity in C, Zn, Cu, SLA, Wmax, Wstd, Th, and Lig/P and negatively related to a dissimilarity in N, Ca, Mg, Mn, C/N, N/P, and Lig/N (Figure 4b). The RMEs of the k of the soluble fraction showed an antagonistic effect and decreased with the second PC axis of the litters’ functional diversity (PC2, p < 0.001; Figure 4a and Figure 5b), which was positively related to a dissimilarity in K, Zn, Fe, Cu, Ca, SLA, Wmax, Wstd, and solubles and negatively related to a dissimilarity in P, TS, TN, C/P, Lig/P, and cellulose (Figure 4a). The RMEs of the k of the cellulose fraction decreased with the fifth PC axis of the litters’ functional diversity (PC5, p < 0.01; Figure 4b and Figure 5c), which was positively related to a dissimilarity in C, K, Fe, Cu, cellulose, and Lig/P and negatively related to a dissimilarity in N, P, Mg, and Mn (Figure 4b). The RMEs of the k of the lignin fraction showed a synergistic effect and increased with the third PC axis of the litters’ functional diversity (PC3, p < 0.001; Figure 4b and Figure 5d), which was positively related to a dissimilarity in P, Zn, Cu, Th, and C/P and negatively related to a dissimilarity in N, Fe, Ca, C/N, N/P, Lig/N, and lignin (Figure 4b).

4. Discussion

4.1. The Decomposition Patterns of Different Carbon Fractions

The decomposition rates of different carbon fractions vary depending on their own chemical properties. We found that the soluble fraction decomposed the fastest, while the cellulose and lignin fractions decomposed more slowly. Previous studies have confirmed that litter mass loss can be divided into three “pools”, with a rapidly decomposing labile pool, an intermediate pool, and a recalcitrant pool [27,28]. The soluble carbon compounds such as sugars and amino acids decompose the most rapidly, followed by nonlignified cellulose and hemicellulose, and then lignified cellulose and lignin [41,42,43]. Soluble compounds in leaf litters could be degraded by decomposers or leached with rainfall in the early stage of decomposition [44], while the decomposition of more recalcitrant fractions would occur slowly over many years [8]. Interestingly, we also found that the higher the content of the soluble carbon fraction in tree species (such as P. massoniana, L. formosana, or S. superba), the faster the loss of the soluble carbon fraction. We speculated that this faster decomposition may be related to them being pioneer tree species. Their litter might contain higher soluble carbon components, enabling faster decomposition and nutrient cycling. Another study also found that basswood litter had the highest initial levels of hemicellulose and bound proteins, which were depleted in this carbon fraction more rapidly than any other species, and inferred that if the experimental observation was long enough, the same result would be seen in lignin fraction decomposition [8].

4.2. Initial Litter Traits Influence the Decomposition Rates of Litter Mass and Carbon Fractions

The decomposition rate of litter is related to various factors, which can be summarized into three parts: climatic factors, biological factors, and litter quality [45,46]. The chemistry and stoichiometry of the litter, and its physical features, can have a strong effect on the abundance and activity of decomposers, leading to different rates of decomposition [47]. In this study, the initial litter’s physical, chemical, and stoichiometric traits also strongly regulated the magnitudes and directions of the decomposition of the total mass/carbon fractions. Higher initial N, Ca, and Mn supported the decomposition of the litter total mass and carbon fractions, while initial C, Fe, and Cu suppressed the decomposition (Figure 2). This finding is consistent with the current consensus that high-N litter with low C or lignin content (similar to low C/N or lignin/N) decomposes more rapidly, especially in the early stages of decomposition [44,46,48,49]. Tree species that are rich in calcium were associated with increased native earthworm or oribatid mite abundance and diversity [50,51], thus facilitating the fragmentation and translocation of decomposing litter. Although we used 1 mm mesh litterbags to prevent earthworms from entering, small earthworms and mite larvae were still found in the bags during the sample harvests. Many studies have observed that the litter manganese concentration is positively related to the degradation of lignin across a wide variety of forest ecosystems [52,53,54], because Mn is a necessary element for the production of manganese peroxidase, found in white-rot fungi, essential for the degradation of lignin [55,56,57]. Since Cu is a bactericide and fungicide, the decomposition rate of higher-Cu litter could be reduced due to a decrease in soil microbial activity [58]. Interactions of lignin and iron have been proposed to specifically protect lignin from decomposition [59,60]. Iron oxides can preferentially associate with aromatic lignin constituents via sorption and coprecipitation to protect lignin C from microbial attacks [61,62,63,64]. The initial litter physical traits of SLA, Wstd, and Wmax significantly promoted the decomposition of the litter total mass and carbon fractions, which is consistent with previous studies [21,32,65,66]. A higher litter water-holding capacity strongly improves the microclimate for decomposers as it determines water acquisition and retention [21,32]. A higher specific leaf area represents a larger area of leaves in contact with the decomposer and greater light exposure, thereby increasing the decomposition rate [65]. The initial physical traits did not have a significant impact on the lignin carbon fraction, indicating that physical traits may have a greater impact on the early decomposition of litter.

4.3. The Relative Mixing Effects of Litter Mass and Carbon Fractions

In this study, mixing litters from different plant species generally accelerated the litter mass loss compared to what was predicted based on single species, in line with our first hypothesis. Recent meta-analysis reviews also indicate that the synergistic effects in the decomposition of litter mixtures are overall predominant in forests worldwide [5,6]. Moreover, classical litter diversity studies often focus on the decomposition of overall litter mass, while neglecting the decomposition of different carbon components [19]. In our study, litter carbon fractions showed different mixing effects based on litter diversity, with antagonistic effects for soluble fractions and synergistic effects for the lignin fraction. This deviation of mixing effects on carbon fractions from that of the litter total mass was consistent with the previous two studies [8,19]. In the study of Grossman et al. (2020), litter diversity also slowed the decomposition of the labile carbon fraction, while having no effect on the recalcitrant carbon [8]. The decomposition of the soluble carbon fraction accounts for 80% of the initial mass loss of litter, which is jointly influenced by microbial decomposition and leaching [67]. The slow decomposition of the soluble carbon fraction after mixing may be due to litter diversity limiting the abundance or aggregation of single efficient and specific decomposers [8]. However, in another related work of Wang et al. (2022), litter diversity accelerated the decomposition of the labile carbon while slowing down the recalcitrant carbon; it is assumed that this contrasting response to litter diversity was related to the stability of the carbon fractions, and more labile carbon fractions were more easily decomposed in the mixed litter decomposition [19]. Clearly, our results do not support this hypothesis. For lignin carbon fractions, previous studies have shown that, due to their slow decomposition rate in the early stages of decomposition, they exhibited insensitively additive or even antagonistic effects based on litter diversity [8,19]. However, given the paucity of data available, it is difficult to put forward specific reasons and associated mechanisms for the synergistic effects of the lignin fraction in our study. Although there were differences in the response direction of the carbon fractions to the litter diversity, we can still conclude that the decomposition of the litter total mass and carbon fractions have different responses to litter diversity, which is consistent with our second hypothesis. Interestingly, whether with additive or nonadditive effects, we found that bulk litter decomposition had the same response to litter diversity as lignin carbon fraction decomposition in both our study and the previous two studies [8,19]. This might be due to the larger proportion of the lignin carbon fraction (25.7%–40.1%) than the soluble carbon fraction (16.0%–30.9%) in the litter mass, and its mixing effect would have a stronger impact on the overall litter decomposition performance based on diversity, which is inconsistent with our second hypothesis. Although we are still unclear about the mechanisms underlying the mixing effects of different carbon fractions, distinguishing carbon fractions to observe their mixing effects is of great significance for us to deeply understand the nonadditive decomposition of mixed leaf litter.

4.4. Functional Dissimilarity may Drive the Mixing Effects of Different Carbon Fractions

The relationships between the litter mixing effects (RMEs) and the litters’ functional dissimilarity indicated that the litter diversity effects of different litter carbon fractions were driven by the litter traits’ dissimilarity, which was consistent with our third hypothesis. The RMEs of the soluble carbon fraction were positively related to a dissimilarity in the water-holding capacity of the litter species (Wmax and Wstd), which could be explained by the improved microclimatic conditions via the component species’ dissimilarity in their water-holding capacity. Studies have found that a higher dissimilarity in the standardized or maximum water-holding capacity between the component litter species in a mixture increased the nonadditive effects in litter mixtures under limiting moisture conditions [19,21]. The RMEs of the cellulose carbon fraction were positively related to a dissimilarity in cellulose concentrations among the mixed litter species. The initial litter cellulose content was used as a carbon source by the decomposers to prime the decomposition of lignin [23,68], and thus, the cellulose-rich litter was susceptible to the co-metabolization of lignin and cellulose by the decomposers [8,69]. However, another work on litter decay showed that low cellulose levels in litter induces carbon limitation and causes decomposers to mine the litter for cellulose despite the presence of lignin. Therefore, the dissimilarity in cellulose concentrations could accelerate the decomposition of the cellulose carbon fraction in mixed litter. The RMEs of the lignin carbon fraction were negatively related to a dissimilarity in Fe concentrations among the mixed litter species. Iron oxides have been proposed to specifically protect lignin from decomposition [59,60]; thus, the dissimilarity in Fe concentrations in the litter combination may inhibit the mineralization of the lignin carbon fraction.

5. Conclusions

Our study on litter decomposition in subtropical forests indicated that the bulk litter decomposition of the mixed litter was faster than that estimated from the single species. The relative mixing effects (RMEs) of the different carbon fractions deviated from that of the litter total mass, with an antagonistic effect for soluble fractions and a synergistic effect for the lignin fraction. And the RMEs of the bulk litter decomposition were mainly determined by the lignin fraction’s decomposition. The different responses of litter fractions to litter diversity could provide a new perspective for us to understand the nonadditive effect of total litter decomposition and identify its underlying mechanisms. Considering the effect of litter diversity on the decomposition of a particular litter carbon fraction allows for a more refined understanding of the potential consequences of biodiversity on the cycling of nutrients and energy in forest ecosystems.

Supplementary Materials

The following supporting information can be downloaded at: https://www.mdpi.com/article/10.3390/f14112258/s1, Table S1: General information on forest stand and soil of the sample plots; Table S2: Initial litter physical and chemical characteristics of seven tree species. Table S3: The relative mixing effects for mass and each carbon fraction of 32 litter mixtures. Table S4: Output of multiple linear regression between the variable (RMEs on total litter, soluble, cellulose, and lignin) (k constant) and the five first axes of the PCA of litter functional dissimilarity.

Author Contributions

Conceptualization, G.Z. and S.M.; Methodology, G.Z., S.M. and C.Y.; Software, Z.G.; Validation, J.W.; Formal analysis, S.H.; Investigation, G.Z., W.D. and S.H.; Writing—original draft, G.Z.; Writing—review & editing, C.Y.; Visualization, J.W.; Supervision, Q.D. and C.Y. All authors have read and agreed to the published version of the manuscript.

Funding

This research was financially supported by the Post-Doctoral Initiation Program of Jiangxi Academy of Forestry, the Doctor Initiation Program of Jiangxi Academy of Forestry, and the Basic Research and Talent Research Project of Jiangxi Academy of Forestry (2022512901).

Data Availability Statement

Data will be made available on request.

Acknowledgments

The authors thank all colleagues who assisted with the field work, data processing, and manuscript composition for Qin Lihou, Xiao Pingjiang, Wang Junbo, Hu Zhengliang, and Li Guilan. We are most grateful to the three anonymous reviewers for their constructive comments on this manuscript.

Conflicts of Interest

The authors declare no conflict of interest. The funders had no role in the design of the study; in the collection, analyses, or interpretation of data; in the writing of the manuscript, or in the decision to publish the results.

References

  1. Vellend, M.; Baeten, L.; Becker-Scarpitta, A.; Boucher-Lalonde, V.; McCune, J.L.; Messier, J.; Myers-Smith, I.H.; Sax, D.F. Plant biodiversity change across scales during the anthropocene. Annu. Rev. Plant Biol. 2017, 68, 563–586. [Google Scholar] [CrossRef] [PubMed]
  2. Hättenschwiler, S.; Tiunov, A.V.; Scheu, S. Biodiversity and litter decomposition in terrestrial ecosystems. Annu. Rev. Ecol. Evol. Syst. 2005, 36, 191–218. [Google Scholar] [CrossRef]
  3. Gessner, M.O.; Swan, C.M.; Dang, C.K.; McKie, B.G.; Bardgett, R.D.; Wall, D.H.; Hättenschwiler, S. Diversity meets decomposition. Trends Ecol. Evol. 2010, 25, 372–380. [Google Scholar] [CrossRef] [PubMed]
  4. Gartner, T.B.; Cardon, Z.G. Decomposition dynamics in mixed-species leaf litter. Oikos 2004, 104, 230–246. [Google Scholar] [CrossRef]
  5. Kou, L.; Jiang, L.; Hättenschwiler, S.; Zhang, M.; Niu, S.; Fu, X.; Dai, X.; Yan, H.; Li, S.; Wang, H. Diversity-decomposition relationships in forests worldwide. eLife 2020, 9, e55813. [Google Scholar] [CrossRef]
  6. Mori, A.S.; Cornelissen, J.H.C.; Fujii, S.; Okada, K.-i.; Isbell, F. A meta-analysis on decomposition quantifies afterlife effects of plant diversity as a global change driver. Nat. Commun. 2020, 11, 4547. [Google Scholar] [CrossRef]
  7. Srivastava, D.S.; Cardinale, B.J.; Downing, A.L.; Duffy, J.E.; Jouseau, C.; Sankaran, M.; Wright, J.P. Diversity has stronger top-down than bottom-up effects on decomposition. Ecology 2009, 90, 1073–1083. [Google Scholar] [CrossRef]
  8. Grossman, J.J.; Cavender-Bares, J.; Hobbie, S.E. Functional diversity of leaf litter mixtures slows decomposition of labile but not recalcitrant carbon over two years. Ecol. Monogr. 2020, 90, e01407. [Google Scholar] [CrossRef]
  9. Laliberté, E.; Legendre, P. A distance-based framework for measuring functional diversity from multiple traits. Ecology 2010, 91, 299–305. [Google Scholar] [CrossRef]
  10. Finerty, G.E.; de Bello, F.; Bílá, K.; Berg, M.P.; Dias, A.T.C.; Pezzatti, G.B.; Moretti, M. Exotic or not, leaf trait dissimilarity modulates the effect of dominant species on mixed litter decomposition. J. Ecol. 2016, 104, 1400–1409. [Google Scholar] [CrossRef]
  11. Purschke, O.; Schmid, B.C.; Sykes, M.T.; Poschlod, P.; Michalski, S.G.; Durka, W.; Kühn, I.; Winter, M.; Prentice, H.C. Contrasting changes in taxonomic, phylogenetic and functional diversity during a long-term succession: Insights into assembly processes. J. Ecol. 2013, 101, 857–866. [Google Scholar] [CrossRef]
  12. Cardinale, B.J.; Matulich, K.L.; Hooper, D.U.; Byrnes, J.E.; Duffy, E.; Gamfeldt, L.; Balvanera, P.; O’Connor, M.I.; Gonzalez, A. The functional role of producer diversity in ecosystems. Am. J. Bot. 2011, 98, 572–592. [Google Scholar] [CrossRef] [PubMed]
  13. Lin, G.; Zeng, D.-H. Functional identity rather than functional diversity or species richness controls litter mixture decomposition in a subtropical forest. Plant Soil 2018, 428, 179–193. [Google Scholar] [CrossRef]
  14. Tardif, A.; Shipley, B. The relationship between functional dispersion of mixed-species leaf litter mixtures and species’ interactions during decomposition. Oikos 2015, 124, 1050–1057. [Google Scholar] [CrossRef]
  15. Lecerf, A.; Marie, G.; Kominoski, J.S.; LeRoy, C.J.; Bernadet, C.; Swan, C.M. Incubation time, functional litter diversity, and habitat characteristics predict litter-mixing effects on decomposition. Ecology 2011, 92, 160–169. [Google Scholar] [CrossRef]
  16. Barantal, S.; Schimann, H.; Fromin, N.; Hättenschwiler, S. C, N and P fertilization in an Amazonian rainforest supports stoichiometric dissimilarity as a driver of litter diversity effects on decomposition. Proc. R. Soc. B Biol. Sci. 2014, 281, 20141682. [Google Scholar] [CrossRef]
  17. Handa, I.T.; Aerts, R.; Berendse, F.; Berg, M.P.; Bruder, A.; Butenschoen, O.; Chauvet, E.; Gessner, M.O.; Jabiol, J.; Makkonen, M.; et al. Consequences of biodiversity loss for litter decomposition across biomes. Nature 2014, 509, 218–221. [Google Scholar] [CrossRef]
  18. Hättenschwiler, S.; Jørgensen, H.B. Carbon quality rather than stoichiometry controls litter decomposition in a tropical rain forest. J. Ecol. 2010, 98, 754–763. [Google Scholar] [CrossRef]
  19. Wang, L.; Zhou, Y.; Chen, Y.; Xu, Z.; Zhang, J.; Liu, Y.; Joly, F.-X. Litter diversity accelerates labile carbon but slows recalcitrant carbon decomposition. Soil Biol. Biochem. 2022, 168, 108632. [Google Scholar] [CrossRef]
  20. Schimel, J.P.; Hättenschwiler, S. Nitrogen transfer between decomposing leaves of different N status. Soil Biol. Biochem. 2007, 39, 1428–1436. [Google Scholar] [CrossRef]
  21. Makkonen, M.; Berg, M.P.; van Logtestijn, R.S.P.; van Hal, J.R.; Aerts, R. Do physical plant litter traits explain non-additivity in litter mixtures? A test of the improved microenvironmental conditions theory. Oikos 2013, 122, 987–997. [Google Scholar] [CrossRef]
  22. Kominoski, J.S.; Hoellein, T.J.; Kelly, J.J.; Pringle, C.M. Does mixing litter of different qualities alter stream microbial diversity and functioning on individual litter species? Oikos 2009, 118, 457–463. [Google Scholar] [CrossRef]
  23. Talbot, J.M.; Treseder, K.K. Interactions among lignin, cellulose, and nitrogen drive litter chemistry–decay relationships. Ecology 2012, 93, 345–354. [Google Scholar] [CrossRef]
  24. Moorhead, D.L.; Sinsabaugh, R.L. A theoretical model of litter decay and microbial interaction. Ecol. Monogr. 2006, 76, 151–174. [Google Scholar] [CrossRef]
  25. Shipley, B.; Tardif, A. Causal hypotheses accounting for correlations between decomposition rates of different mass fractions of leaf litter. Ecology 2021, 102, e03196. [Google Scholar] [CrossRef]
  26. Berg, B.; Matzner, E. Effect of N deposition on decomposition of plant litter and soil organic matter in forest systems. Environ. Rev. Doss. Environ. 1997, 5, 1–25. [Google Scholar] [CrossRef]
  27. Berg, B. Decomposition patterns for foliar litter—A theory for influencing factors. Soil Biol. Biochem. 2014, 78, 222–232. [Google Scholar] [CrossRef]
  28. Adair, E.C.; Parton, W.J.; Del Grosso, S.J.; Silver, W.L.; Harmon, M.E.; Hall, S.A.; Burke, I.C.; Hart, S.C. Simple three-pool model accurately describes patterns of long-term litter decomposition in diverse climates. Glob. Chang. Biol. 2008, 14, 2636–2660. [Google Scholar] [CrossRef]
  29. Butenschoen, O.; Krashevska, V.; Maraun, M.; Marian, F.; Sandmann, D.; Scheu, S. Litter mixture effects on decomposition in tropical montane rainforests vary strongly with time and turn negative at later stages of decay. Soil Biol. Biochem. 2014, 77, 121–128. [Google Scholar] [CrossRef]
  30. Preston, C.M.; Nault, J.R.; Trofymow, J.A. Chemical changes during 6 years of decomposition of 11 litters in some canadian forest sites. Part 2. 13C abundance, solid-state 13C NMR spectroscopy and the meaning of “Lignin”. Ecosystems 2009, 12, 1078–1102. [Google Scholar] [CrossRef]
  31. Wang, L.; Chen, Y.; Zhou, Y.; Zheng, H.; Xu, Z.; Tan, B.; You, C.; Zhang, L.; Li, H.; Guo, L.; et al. Litter chemical traits strongly drove the carbon fractions loss during decomposition across an alpine treeline ecotone. Sci. Total Environ. 2021, 753, 142287. [Google Scholar] [CrossRef] [PubMed]
  32. Makkonen, M.; Berg, M.P.; Handa, I.T.; Hättenschwiler, S.; van Ruijven, J.; van Bodegom, P.M.; Aerts, R. Highly consistent effects of plant litter identity and functional traits on decomposition across a latitudinal gradient. Ecol. Lett. 2012, 15, 1033–1041. [Google Scholar] [CrossRef]
  33. Terashima, N.; Kitano, K.; Kojima, M.; Yoshida, M.; Yamamoto, H.; Westermark, U. Nanostructural assembly of cellulose, hemicellulose, and lignin in the middle layer of secondary wall of ginkgo tracheid. J. Wood Sci. 2009, 55, 409–416. [Google Scholar] [CrossRef]
  34. Ververis, C.; Georghiou, K.; Christodoulakis, N.; Santas, P.; Santas, R. Fiber dimensions, lignin and cellulose content of various plant materials and their suitability for paper production. Ind. Crop. Prod. 2004, 19, 245–254. [Google Scholar] [CrossRef]
  35. Rao, C.R. Diversity and dissimilarity coefficients: A unified approach. Theor. Popul. Biol. 1982, 21, 24–43. [Google Scholar] [CrossRef]
  36. Wider, R.K.; Lang, G.E. A Critique of the analytical methods used in examining decomposition data obtained from litter bags. Ecology 1982, 63, 1636–1642. [Google Scholar] [CrossRef]
  37. Wardle, D.A.; Bonner, K.I.; Nicholson, K.S. Biodiversity and plant litter: Experimental evidence which does not support the view that enhanced species richness improves ecosystem function. Oikos 1997, 79, 247–258. [Google Scholar] [CrossRef]
  38. Wold, S.; Sjöström, M.; Eriksson, L. PLS-regression: A basic tool of chemometrics. Chemom. Intell. Lab. Syst. 2001, 58, 109–130. [Google Scholar] [CrossRef]
  39. Trap, J.; Akpa-Vinceslas, M.; Margerie, P.; Boudsocq, S.; Richard, F.; Decaëns, T.; Aubert, M. Slow decomposition of leaf litter from mature Fagus sylvatica trees promotes offspring nitrogen acquisition by interacting with ectomycorrhizal fungi. J. Ecol. 2017, 105, 528–539. [Google Scholar] [CrossRef]
  40. Bates, D.; Mächler, M.; Bolker, B.; Walker, S. Fitting linear mixed-effects models using lme4. J. Stat. Softw. 2015, 67, 1–48. [Google Scholar] [CrossRef]
  41. Aber, J.D.; Melillo, J.M.; McClaugherty, C.A. Predicting long-term patterns of mass-loss, nitrogen dynamics, and soil organic-matter formation from initial fine litter chemistry in temperate forest ecosystems. Can. J. Bot.-Rev. Can. Bot. 1990, 68, 2201–2208. [Google Scholar] [CrossRef]
  42. Berg, B.; Hannus, K.; Popoff, T.; Theander, O. Changes in organic-chemical components of needle litter during decomposition—Long-term decomposition in a scots pine forest.1. Can. J. Bot.-Rev. Can. Bot. 1982, 60, 1310–1319. [Google Scholar] [CrossRef]
  43. Berg, B.; Agren, G.I. Decomposition of needle litter and its organic-chemical components—Theory and field experiments—Long-term decomposition in a scots pine forest.3. Can. J. Bot.-Rev. Can. Bot. 1984, 62, 2880–2888. [Google Scholar] [CrossRef]
  44. Djukic, I.; Kepfer-Rojas, S.; Schmidt, I.K.; Larsen, K.S.; Beier, C.; Berg, B.; Verheyen, K.; Caliman, A.; Paquette, A.; Gutiérrez-Girón, A.; et al. Early stage litter decomposition across biomes. Sci. Total Environ. 2018, 628–629, 1369–1394. [Google Scholar] [CrossRef]
  45. Parton, W.; Silver, W.L. Global-scale similarities in nitrogen release patterns during long-term decomposition. Science 2007, 315, 361–364. [Google Scholar] [CrossRef]
  46. Cornwell, W.K.; Cornelissen, J.H.C.; Amatangelo, K.; Dorrepaal, E.; Eviner, V.T.; Godoy, O.; Hobbie, S.E.; Hoorens, B.; Kurokawa, H.; Pérez-Harguindeguy, N.; et al. Plant species traits are the predominant control on litter decomposition rates within biomes worldwide. Ecol. Lett. 2008, 11, 1065–1071. [Google Scholar] [CrossRef] [PubMed]
  47. Taylor, B.R.; Parkinson, D.; Parsons, W.F.J. Nitrogen and lignin content as predictors of litter decay rates: A microcosm test. Ecology 1989, 70, 97–104. [Google Scholar] [CrossRef]
  48. Agethen, S.; Knorr, K.-H. Juncus effusus mono-stands in restored cutover peat bogs—Analysis of litter quality, controls of anaerobic decomposition, and the risk of secondary carbon loss. Soil Biol. Biochem. 2018, 117, 139–152. [Google Scholar] [CrossRef]
  49. Zhou, Y.; Wang, L.; Chen, Y.; Zhang, J.; Liu, Y. Litter stoichiometric traits have stronger impact on humification than environment conditions in an alpine treeline ecotone. Plant Soil 2020, 453, 545–560. [Google Scholar] [CrossRef]
  50. Reich, P.B.; Oleksyn, J.; Modrzynski, J.; Mrozinski, P.; Hobbie, S.E.; Eissenstat, D.M.; Chorover, J.; Chadwick, O.A.; Hale, C.M.; Tjoelker, M.G. Linking litter calcium, earthworms and soil properties: A common garden test with 14 tree species. Ecol. Lett. 2005, 8, 811–818. [Google Scholar] [CrossRef]
  51. Norton, R.A.; Behanpelletier, V.M. Calcium-carbonate and calcium-oxalate as cuticular hardening agents in oribatid mites (acari, oribatida). Can. J. Zool.-Rev. Can. Zool. 1991, 69, 1504–1511. [Google Scholar] [CrossRef]
  52. Berg, B.; Ekbohm, G.; Johansson, M.B.; McClaugherty, C.; Rutigliano, F.; DeSanto, A.V. Maximum decomposition limits of forest litter types: A synthesis. Can. J. Bot.-Rev. Can. Bot. 1996, 74, 659–672. [Google Scholar] [CrossRef]
  53. Berg, B.; Davey, M.P.; De Marco, A.; Emmett, B.; Faituri, M.; Hobbie, S.E.; Johansson, M.B.; Liu, C.; McClaugherty, C.; Norell, L.; et al. Factors influencing limit values for pine needle litter decomposition: A synthesis for boreal and temperate pine forest systems. Biogeochemistry 2010, 100, 57–73. [Google Scholar] [CrossRef]
  54. Sun, T.; Cui, Y.; Berg, B.; Zhang, Q.; Dong, L.; Wu, Z.; Zhang, L. A test of manganese effects on decomposition in forest and cropland sites. Soil Biol. Biochem. 2019, 129, 178–183. [Google Scholar] [CrossRef]
  55. Berg, B.; Erhagen, B.; Johansson, M.-B.; Nilsson, M.; Stendahl, J.; Trum, F.; Vesterdal, L. Manganese in the litter fall-forest floor continuum of boreal and temperate pine and spruce forest ecosystems—A review. For. Ecol. Manag. 2015, 358, 248–260. [Google Scholar] [CrossRef]
  56. Perez, J.; Jeffries, T.W. Roles of manganese and organic-acid chelators in regulating lignin degradation and biosynthesis of peroxidases by phanerochaete-chrysosporium. Appl. Environ. Microbiol. 1992, 58, 2402–2409. [Google Scholar] [CrossRef]
  57. Hofrichter, M. Review: Lignin conversion by manganese peroxidase (MnP). Enzym. Microb. Technol. 2002, 30, 454–466. [Google Scholar] [CrossRef]
  58. Freedman, B.; Hutchinson, T.C. Effects of smelter pollutants on forest leaf litter decomposition near a nickel-copper smelter at sudbury, ontario. Can. J. Bot.-Rev. Can. Bot. 1980, 58, 1722–1736. [Google Scholar] [CrossRef]
  59. Hall, S.J.; Silver, W.L.; Timokhin, V.I.; Hammel, K.E. Iron addition to soil specifically stabilized lignin. Soil Biol. Biochem. 2016, 98, 95–98. [Google Scholar] [CrossRef]
  60. Hall, S.J.; Silver, W.L.; Timokhin, V.I.; Hammel, K.E. Lignin decomposition is sustained under fluctuating redox conditions in humid tropical forest soils. Glob. Chang. Biol. 2015, 21, 2818–2828. [Google Scholar] [CrossRef]
  61. Eusterhues, K.; Neidhardt, J.; Haedrich, A.; Kuesel, K.; Totsche, K.U. Biodegradation of ferrihydrite-associated organic matter. Biogeochemistry 2014, 119, 45–50. [Google Scholar] [CrossRef]
  62. Liao, C.; Huang, W.; Wells, J.; Zhao, R.; Allen, K.; Hou, E.; Huang, X.; Qiu, H.; Tao, F.; Jiang, L.; et al. Microbe-iron interactions control lignin decomposition in soil. Soil Biol. Biochem. 2022, 173, 108803. [Google Scholar] [CrossRef]
  63. Riedel, T.; Zak, D.; Biester, H.; Dittmar, T. Iron traps terrestrially derived dissolved organic matter at redox interfaces. Proc. Natl. Acad. Sci. USA 2013, 110, 10101–10105. [Google Scholar] [CrossRef] [PubMed]
  64. Wang, Y.; Wang, H.; He, J.-S.; Feng, X. Iron-mediated soil carbon response to water-table decline in an alpine wetland. Nat. Commun. 2017, 8, 15972. [Google Scholar] [CrossRef]
  65. Liu, G.; Wang, L.; Jiang, L.; Pan, X.; Huang, Z.; Dong, M.; Cornelissen, J.H.C. Specific leaf area predicts dryland litter decomposition via two mechanisms. J. Ecol. 2018, 106, 218–229. [Google Scholar] [CrossRef]
  66. Vaieretti, M.V.; Harguindeguy, N.P.; Gurvich, D.E.; Cingolani, A.M.; Cabido, M. Decomposition dynamics and physico-chemical leaf quality of abundant species in a montane woodland in central argentina. Plant Soil 2005, 278, 223–234. [Google Scholar] [CrossRef]
  67. Berg, B.; Mcclaugherty, C. Plant Litter. Decomposition, Humus Formation, Carbon Sequestration; Springer: Berlin/Heidelberg, Germany, 2008. [Google Scholar]
  68. Kuzyakov, Y.; Friedel, J.K.; Stahr, K. Review of mechanisms and quantification of priming effects. Soil Biol. Biochem. 2000, 32, 1485–1498. [Google Scholar] [CrossRef]
  69. Lindahl, B.D.; Tunlid, A. Ectomycorrhizal fungi—Potential organic matter decomposers, yet not saprotrophs. New Phytol. 2015, 205, 1443–1447. [Google Scholar] [CrossRef] [PubMed]
Figure 1. Species-level decomposition rates (k; yr−1) for litter mass and different carbon fractions. Different lowercase letters indicate significant differences in decomposition rate between different species based on Tukey’s multiple comparisons (p < 0.05). Error bars indicate standard error.
Forests 14 02258 g001
Figure 2. Partial least squares regression model was used to explore the effects of initial litter physical and chemical traits on decomposition rate (k) of (a) litter total mass loss, (b) soluble fraction loss, (c) cellulose fraction loss, and (d) lignin fraction loss. The relative influence of a single trait variable on the decomposition rate was represented by the variable importance of projection (VIP).
Forests 14 02258 g002
Figure 3. The dynamics of relative mixing effects (RMEs) on (a) litter total mass loss, (b) soluble fraction loss, (c) cellulose fraction loss, and (d) lignin fraction loss in the litter decomposition process. Black lines represent the regression lines between RMEs and litter total mass/carbon fraction losses, with grey areas representing the 95% confidence intervals of regression lines.
Forests 14 02258 g003
Figure 4. Principal component analysis (PCA) of litter functional diversity. Black lines depict the variable loadings, and the yellow lines depict the correlation between the PCA axes and the RMEs on decomposition rates (k) of litter total mass and different carbon fractions.
Forests 14 02258 g004
Figure 5. The relationships between relative mixing effects (RMEs) on decomposition rates (k) of (a) litter total mass, (b) soluble carbon fraction, (c) cellulose carbon fraction, and (d) lignin carbon fraction and the PC3, PC2, PC5, and PC3 scores of litter functional dissimilarity, with grey areas representing the 95% confidence intervals of regression lines.
Forests 14 02258 g005
Table 1. The established 32 litter mixtures that were selected along two independent gradients of species richness (SR) and functional dispersion (FDis), and the mass losses and relative mixing effects (REMs) of litter total mass and different carbon fractions.
No.Litter MixturesSRFDisMass LossREMs
TotalSolubleCelluloseLigninTotalSolubleCelluloseLignin
M1Qg + Cs22.7042.8954.8351.19822.7815.81−20.205.90119.84
M2Qg + Pb22.9336.5444.0940.00329.0820.14−33.718.89159.76
M3Ss + Cs22.7443.4247.1249.75030.714.16−30.62−10.84150.94
M4Qg + Qr23.4944.9653.0048.62136.9838.26−14.948.62255.00
M5Lf + Pb23.0734.3864.5737.65710.75−7.97−10.17−13.59−34.52
M6Lf + Qg23.8043.2561.7939.68734.18−3.10−18.82−26.74119.43
M7Qg + Cs + Pb33.3735.0847.4236.21326.678.28−28.29−13.54141.81
M8Ss + Qg + Cs33.2048.9662.7553.22334.6021.32−9.430.48201.41
M9Ss + Qg + Pb33.6338.4252.1940.32329.176.88−23.09−12.06144.94
M10Pm + Qg + Qr34.7543.4250.8448.81233.8716.19−23.14−1.13185.47
M11Pm + Lf + Qg34.9043.0459.4852.16222.96−5.29−20.43−7.2333.21
M12Lf + Qg + Qr34.0648.0457.8256.92132.2723.61−17.3213.59173.30
M13Ss + Qg + Cs + Pb43.6736.0846.6244.38419.180.09−30.66−5.6564.60
M14Pm + Qg + Cs + Pb44.3139.6352.2248.57521.559.87−22.976.1458.46
M15Pm + Ss + Qg + Cs44.2942.9632.6851.57737.992.20−53.33−5.41171.35
M16Pm + Lf + Qr + Pb44.6037.5846.3444.34625.460.83−31.90−6.4075.92
M17Lf + Qg + Qr + Pb43.9739.7853.0347.83623.4513.87−15.958.1997.36
M18Pm + Lf + Qg + Qr44.9342.2155.1251.49624.673.16−21.74−1.9275.61
M19Pm + Ss + Qg + Cs + Pb54.3839.5044.6949.37324.413.26−34.570.1979.82
M20Qr + Ss + Qg + Cs + Pb53.9441.4648.1650.23626.5420.85−25.188.57161.45
M21Lf + Ss + Qg + Cs + Pb54.0942.9247.2450.50630.619.61−32.961.63125.16
M22Pm + Lf + Qg + Qr + Cs54.8639.0045.3449.14322.74−2.52−34.79−5.1868.05
M23Pm + Lf + Ss + Qg + Qr54.7946.5048.7450.93940.3010.36−30.79−7.07189.12
M24Pm + Lf + Qg + Qr + Pb54.6639.1351.3746.96423.874.72−25.30−0.4575.03
M25Pm + Lf + Ss + Qg + Qr + Cs64.7244.5047.7048.78237.308.08−31.52−9.27175.82
M26Pm + Lf + Ss + Qg + Qr + Pb64.6838.3342.1946.29027.48−1.63−38.88−7.54101.89
M27Pm + Lf + Ss + Qg + Cs + Pb64.6142.3844.9450.38531.214.70−36.46−1.69110.29
M28Pm + Lf + Ss + Qr + Cs + Pb64.6942.4449.6946.90232.709.55−26.93−7.36136.37
M29Pm + Lf + Qg + Qr + Cs + Pb64.6743.8350.1951.26534.3417.85−26.467.37158.85
M30Pm + Ss + Qg + Qr + Cs + Pb64.5034.1726.9941.27429.36−6.22−59.04−14.43144.44
M31Lf + Ss + Qg + Qr + Cs + Pb64.1938.6752.4046.04821.353.99−22.84−5.1978.12
M32Pm + Lf + Ss + Qg + Qr + Cs + Pb74.6440.0453.0245.73325.603.75−22.65−8.5892.50
Notes: Pm, Pinus massoniana; Lf, Liquidambar formosana; Ss, Schima superba; Qg, Quercus glauca; Qr, Quercus rubra; Cs, Castanopsis sclerophylla; Pb, Phoebe bournei.
Table 2. Species means (and standard errors) for decomposition loss of total mass and carbon fractions.
Tree SpeciesMass Loss (%)
Total MassSolubleCelluloseLignin
Pinus massoniana47.1(0.43) a73.1(0.19) a62.8(0.52) a22.9(0.56) a
Liquidambar formosana51.6(6.15) a79.1(3.01) ab66.2(4.40) a28.9(6.06) a
Schima superba47.0(1.51) a70.5(1.58) bc64.6(0.74) a15.9(2.44) a
Quercus glauca37.7(1.86) b76.6(1.13) cd47.5(1.93) b17.4(1.99) a
Quercus rubra27.3(1.47) b54.9(3.00) de47.1(0.55) b18.2(2.91) a
Castanopsis sclerophylla36.4(0.48) c66.8(0.55) e50.5(1.80) b17.9(2.06) a
Phoebe bournei23.1(0.81) c62.4(1.21) f27.3(1.58) c14.9(9.73) a
Notes: Different lowercase letters indicate significant differences in decomposition rate between different species based on Tukey’s multiple comparisons (p < 0.05). Soluble, soluble carbon fraction; Cellulose, cellulose carbon fraction; Lignin, lignin carbon fraction.
Table 3. The mixing effects of litter total mass and carbon fraction decomposition.
Decomposition TypeAdditiveSynergisticAntagonistic
Total mass6233
Soluble0032
Cellulose9914
Lignin0311
Disclaimer/Publisher’s Note: The statements, opinions and data contained in all publications are solely those of the individual author(s) and contributor(s) and not of MDPI and/or the editor(s). MDPI and/or the editor(s) disclaim responsibility for any injury to people or property resulting from any ideas, methods, instructions or products referred to in the content.

