Article

Combining Artificial Neural Network and Response Surface Methodology to Optimize the Drilling Operating Parameters of MDF Panels

Faculty of Furniture Design and Wood Engineering, Transilvania University of Brasov, Bd-ul Eroilor nr. 29, 500036 Brasov, Romania
*
Author to whom correspondence should be addressed.
Forests 2023, 14(11), 2254; https://doi.org/10.3390/f14112254
Submission received: 24 October 2023 / Revised: 10 November 2023 / Accepted: 13 November 2023 / Published: 16 November 2023
(This article belongs to the Special Issue Wood Quality and Wood Processing)

Abstract

:
Most of the parts of furniture made of medium density fiberboards (MDF) require at least one hole to be assembled. The drilling technological parameters influence the quality of holes. Factors such as tip angle of the drill bit, feed rate, type and diameter of the drill bit, and spindle rotational speed could affect the drilling process. Therefore, the right choosing of drilling parameters is a mandatory condition to improve the drilling efficiency that is expressed through tool durability, cost, and quality of the drilling. Thus, in this work, we are proposed an approach that consists in combining two modelling techniques, which were successfully applied in various fields, namely artificial neural network (ANN) and response surface methodology (RSM), to analyze and optimize the drilling process of MDF boards. Four artificial neural network models with a reasonable accuracy were developed to predict the analyzed responses, namely delamination factor at inlet, delamination factor at outlet, thrust force, and drilling torque. These models were used to complete the experimental design that was requested by the RSM. The optimum values of the selected factors and their influence on the drilling process of the MDF boards were revealed. A part of optimum combinations among analyzed factors could be used both during the drilling of the MDF boards and prelaminated wood particleboards.

1. Introduction

Nowadays, some parts of furniture could be made of medium density fiberboards (MDF). To be assembly, these parts should be drilled at different locations, according to technical documentation. The selection of drilling parameters represents a mandatory step to obtain a high-quality drilling process. The efficiency of the drilling process is expressed through tool durability, cost, and quality of the drilling. Factors such as tip angle of the drill bit, feed rate, type of drill (flat or helical), diameter of drill, spindle speed, and material properties could affect the drilling process [1,2].
To optimize the drilling process, considerable research was carried out on drilling to increase the hole quality, which in most cases is classified by delamination factor and surface roughness [2]. Moreover, topics such as cutting force, drill deflection, and tool condition monitoring are presented in the literature [2,3,4]. Cutting forces affect the energy consumption, tool wear, and the quality of the surface [2]. The adhesive layer negatively influences the accuracy of the position and the angle of the holes during plywood drilling [3]. Kurek et al. [4] proposed a new approach that can be used to predict the drill bit condition during drilling of wood and wood-based materials. The approach is based on the physical parameters of the drilling system, namely, noise levels, current/voltage values, and vibrations.
However, most of the published results refer to drilling of prelaminated wood particleboards. Regarding the drilling of MDF, up to now, scholars investigated by means of different methods the influence of factors that affect the drilling process. Ispas and Răcășan [5] analyzed the influence of the tip angle of the drill bit and the feed speed on the drilling quality of MDF panels that were evaluated through the delamination factor at inlet and outlet. The authors obtained that a small tip angle with a low feed rate led to a lower delamination factor during drilling. Davim et al. [6], Palanikumar et al. [7], and Prakash et al. [8] obtained that the delamination factor decreases when the cutting speed is increased. Additionally, the same authors obtained that delamination factor increased when the feed rate and drill diameter were increased. The research performed by Valarmathi et al. [9] showed that the delamination during the drilling of prelaminated MDF wood panels could be minimized with a high spindle speed, a low feed rate, and a small drill diameter.
Regarding the applied methods to study the influence of factors and to reveal the optimum combinations of factors during drilling of MDF boards, the scholars involved approaches such as response surface methodology (RSM), Taguchi optimization method, and grey relational analysis (GRA). Prakash et al. [8] revealed by means of response surface methodology RSM that the delamination factor in the drilling of MDF is mostly affected by feed speed. Gaitonde et al. [10] applied the Taguchi optimization method to minimize the delamination factor during drilling of melamine-coated MDF boards. In this research, the delamination factor was minimized by assuring a high cutting speed and low feed speed.
In addition, Ayyildiz et al. [11] by means of the Taguchi technique revealed the most important factor that affects the surface roughness during drilling of MDF panels is the feed rate. Prakash et al. [12] applied the grey relational analysis (GRA) method to optimize the drilling parameters of MDF panels and obtained that the feed rate is the most important factor that affects both the surface roughness and delamination factor. Prakash and Palanikumar [13] applied the Taguchi experimental design technique and response surface methodologies (RSM) for predicting the surface roughness in drilling MDF by taking into account the spindle rotational speed, the feed rate, and the drill bit diameter. They obtained that the surface roughness is mostly influenced by the feed speed.
Another modeling method that was applied to model the drilling process or the wood machining process is the artificial neural network (ANN), which is a machine learning model that simulates the working mechanism of the human brain. Among other machine learning models, namely, fuzzy, neuro-fuzzy, and support vector machine (SVM), the ANN is applied in wood machining to model various processes. Bedelean et al. [14] developed an ANN model that is able to predict the delamination factor, thrust force, and drilling torque during the drilling of prelaminated wood particleboards based on drill type, drill tip angle, and tooth bite. Szwajka et al. [15] applied ANN to predict the tool wear during milling of wood. The input variables were feed rate, cutting speed, and the force in the X and Y directions. Zbieć [16] developed a neural network to monitor tool wear in MDF milling based on machined surface temperature, cutting, and thrust force and power consumption. Tiryaki et al. [17] used artificial neural networks for predicting the surface roughness and power consumption in abrasive machining of wood. The inputs were pressure, machining speed, wood species, abrasive types, and grit number of abrasives. Additionally, Tiryaki et al. [18] designed an ANN model with four neurons in the input layer, namely wood species, feed rate, number of cutter, and cutting depth, to predict the power consumption during the wood planning. Özşahin and Singer [19] designed an ANN model to reveal the influence of wood species, cutting width, number of blades, and cutting depth on noise emission in the machining process. Nasir and Cool [20] involved the artificial neural networks modelling technique to predict the dust emission at various cutting conditions based on signals received from an acoustic emission sensor. Rabiei and Yaghoubi [21] studied the influence of various factors, such as depth of cut, feed rate, and spindle speed on the surface roughness and the process time by using an artificial neural network and the bees optimization algorithm (BA). Demir et al. [22] designed an ANN model to determine the CNC operating parameters (tool diameter, spindle speed, and feed) in order to attain the best surface quality for spruce and beech wood. Additionally, Cakmak et al. [23] developed an artificial neural network model to predict the surface roughness and cutting power based on spindle speed, feed rate, depth of cut, and moisture content. Gürgen et al. [24] developed an ANN model for prediction of surface roughness during processing of Scotch pine (Pinus sylvestris L.) on the CNC machine based on spindle speed, feed rate, depth of cut, and axial depth of cut. Sofuoglu [25] employed the artificial neural network approach to model the surface roughness of massive wooden edge-glued panels during processing on a CNC. The independent variables were cutter type, tool clearance strategy, spindle speed, feed rate, and depth of cut.
Regarding the tool monitoring condition, various machine learning models were applied in conjunction with power, sound, vibration, and acoustic sensors. Nasir et al. [26] used an adaptive neuro-fuzzy inference system (ANFIS) to monitor the cutting power and waviness in the wood circular sawing process based on an acoustic emissions signal. ANFIS is a neural network that is used for adaptive learning. Nasir and Cool [27] predicted the cutting power and waviness during circular sawing of wood using vibrational signals that was processed by using a self-organizing map (SOM), which is a type of artificial neural network ANN that is trained using unsupervised learning. This machine learning technique was combined with an ANN model or with an ANFIS model in order to predict the desired outputs. Nasir et al. [28] combined the signal obtained from power, vibration, sound, and acoustic sensors with various machine-learning methods for tool condition monitoring during wood sawing. Tool classification was performed using extreme gradient boosting (XGBoost), random forest (RF), and support vector machine (SVM) algorithms. Nasir et al. [29] analyzed the influence of cut depth, rotation speed, and feed speed on the tool temperature during circular sawing of wood by monitoring the power, sound, vibration, and acoustic emission. Based on the information received from the sensors, various random forest (RF) models were trained to predict the tool temperature during circular sawing of wood. Stanojevic [30] applied the neuro-fuzzy approach to establish the influence of feed rate, cutting depth, and rake angle on surface roughness and power consumption during wood milling. Ahmed et al. [31] used acoustic emissions and a residual network (ResNets), which is a specific type of neural network, to monitor the tool health during the milling of wood. Kurek et al. [4] classified drill wear by means of classification algorithms (random forest RF, decision tree, support vector machine SVM, extreme gradient boosting XGBoost, etc.). The best result was obtained in the case of the XGBoost extreme gradient boosting classification algorithms. The inputs of the drilling system were noise levels, current or voltage values and vibration. Jegorowa et al. [32] applied the support vector machine (SVM) to identify the tool wear during drilling of chipboard based on indirect inputs, namely, feed force, cutting torque, acceleration of jig vibration, audible noise, and ultrasonic acoustic emission signals.
Based on the information presented above, the reader could observe that most of the published studies regarding the drilling of MDF boards analyze the quality of holes through delamination factors and surface roughness. However, to optimize the drilling process of MDF boards, two outputs that affect the energy consumption should also be considered, namely the thrust force and drilling torque. Therefore, the aim of this work, is to figure out the optimal combinations of drill tip angle, tooth bite, and drill type (flat or helix) to minimize the delamination factor, thrust force, and drilling torque, by combining two modelling techniques, namely ANN and RSM. Despite the fact that RSM was successfully applied to optimize the drilling process of wood particleboards, there is limited information regarding the application of ANN modelling technique in the drilling of MDF boards and other wood-based materials. Additionally, one could observe that there is limited information in the literature regarding the monitoring of the drilling process or other wood machining processes. Therefore, more research is needed in order to develop methodologies based on machine learning and sensor fusion that could be used to monitor and optimize the drilling process of wood or wood-based materials in order to assure the transition towards the Industry 4.0 concept—the fourth phase in the industrial revolution that is focused on interconnectivity, machine learning, automation, and real-time data processing [33,34].

2. Materials and Methods

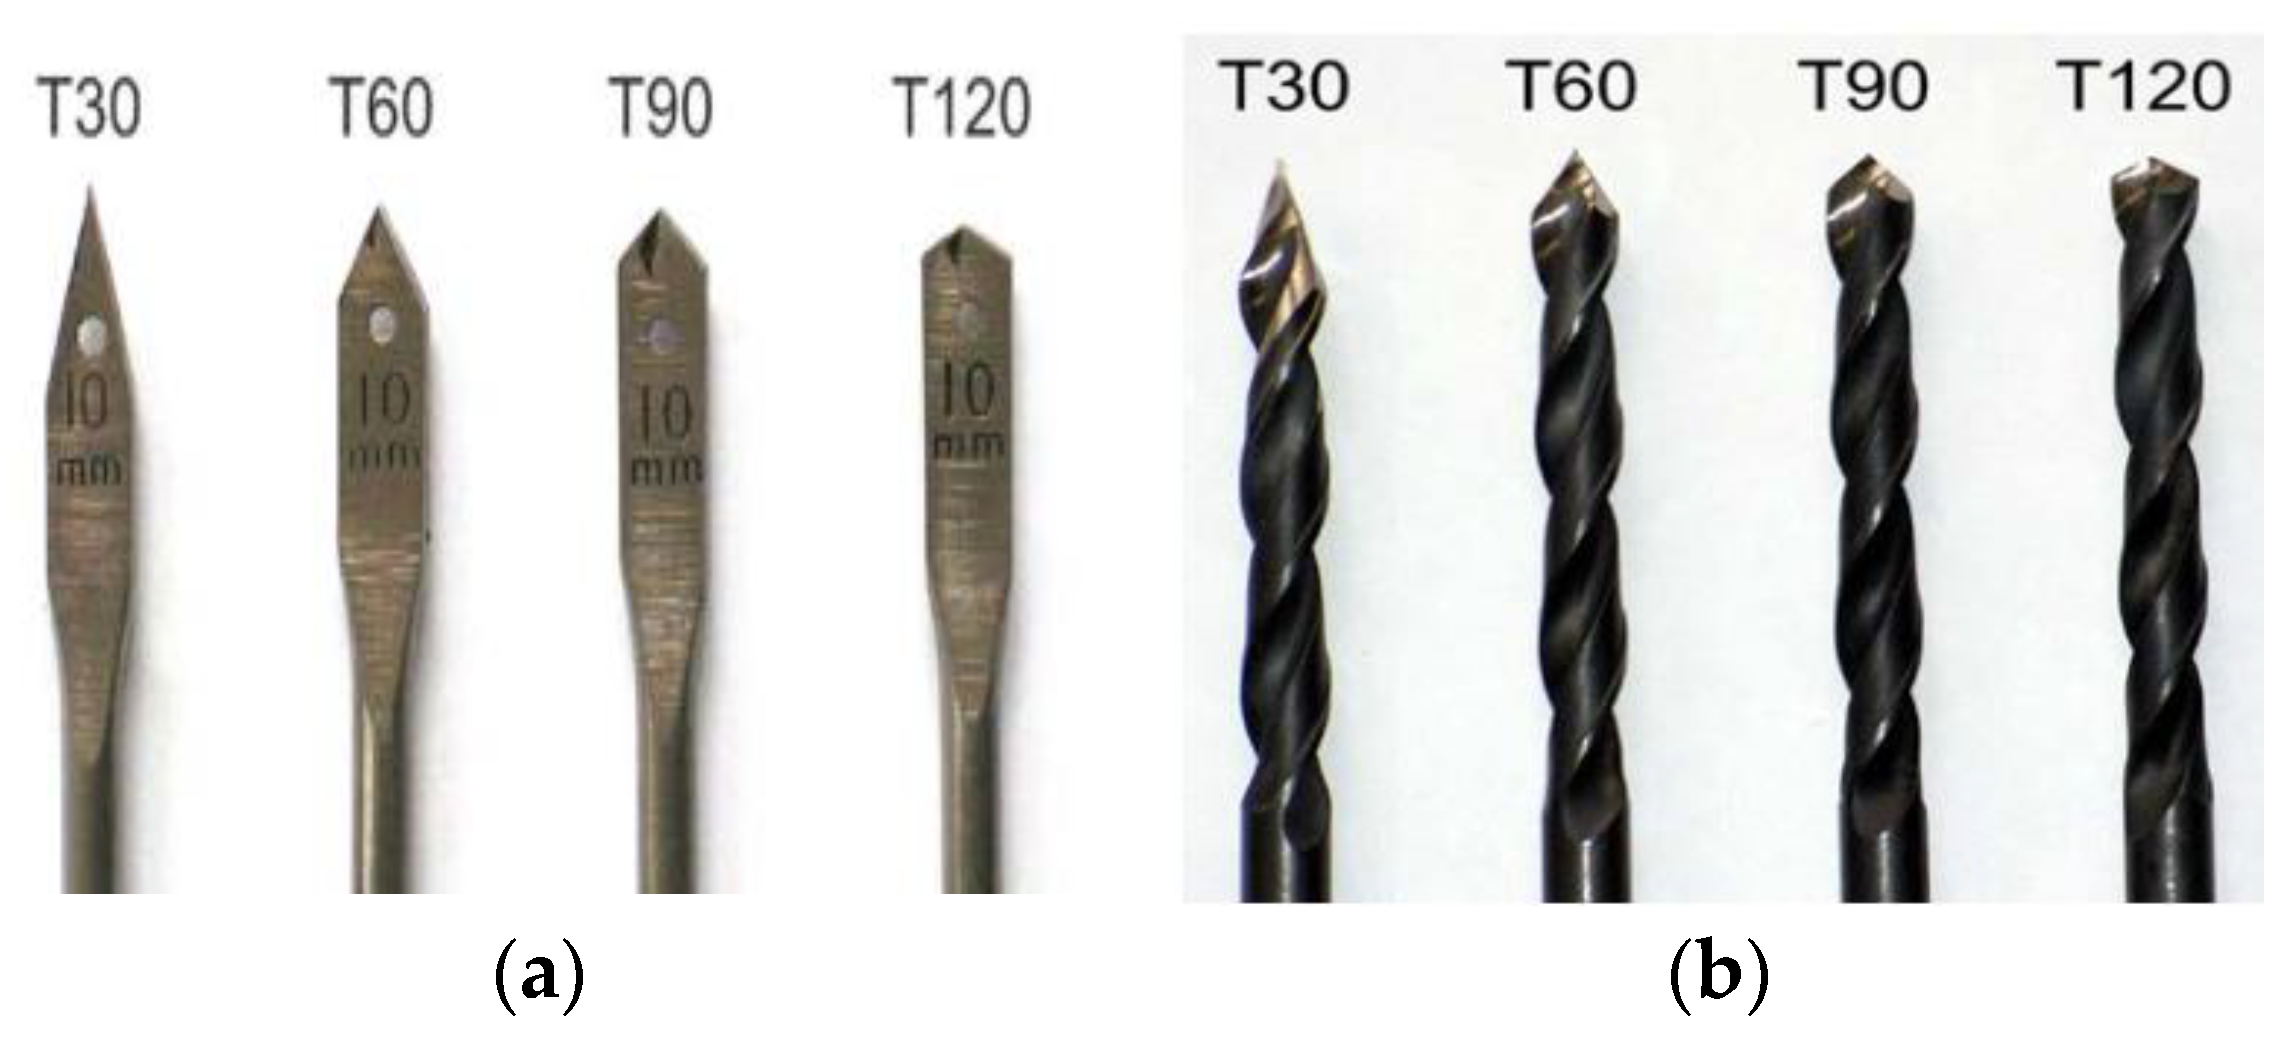
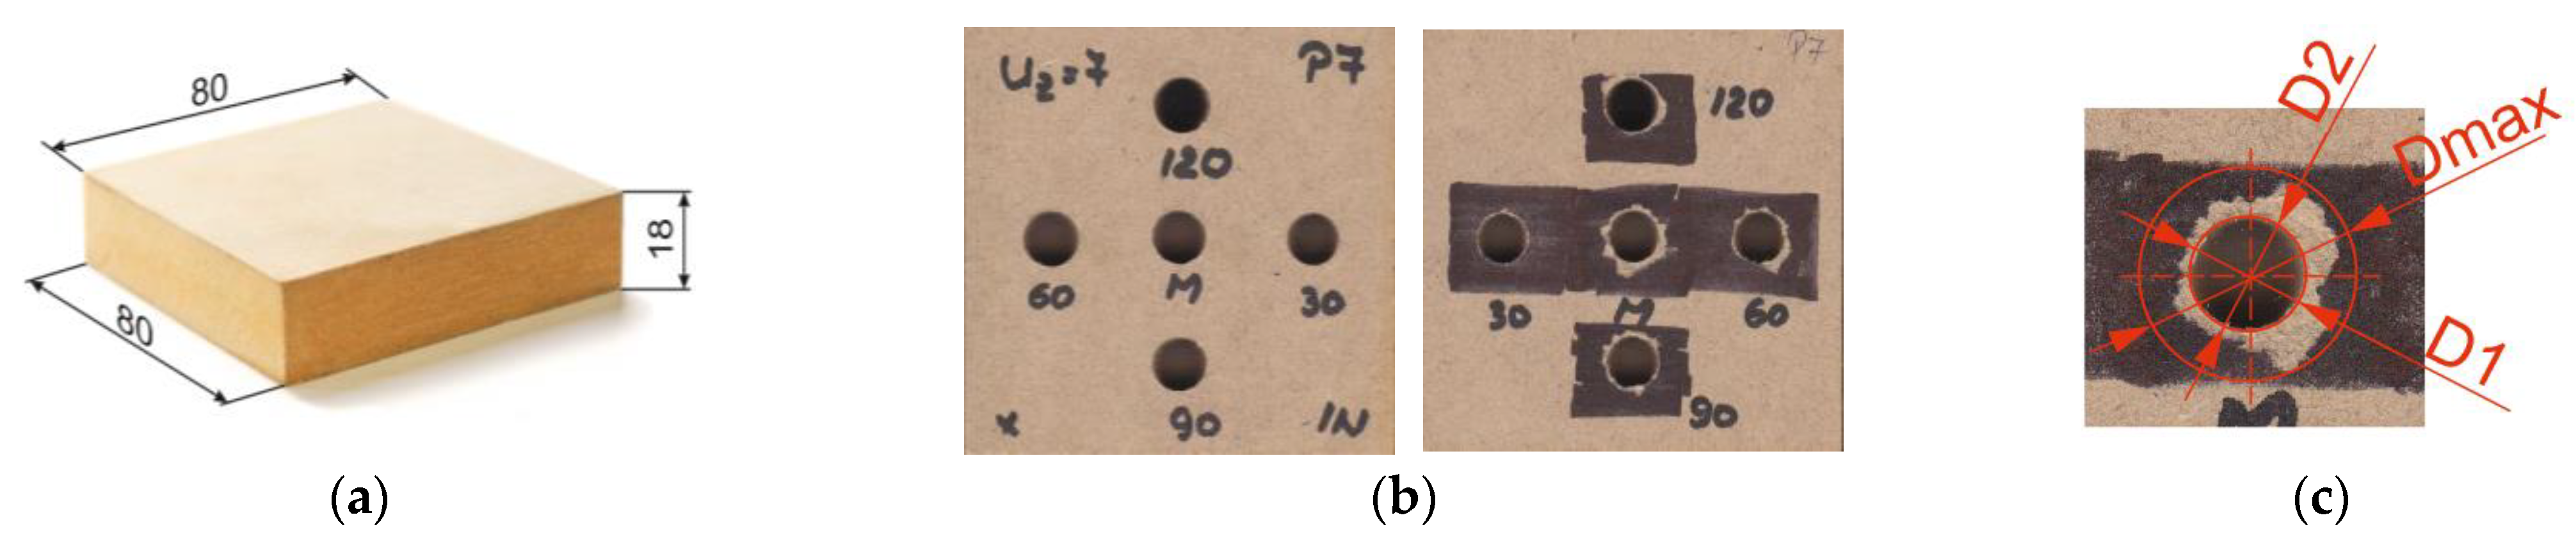
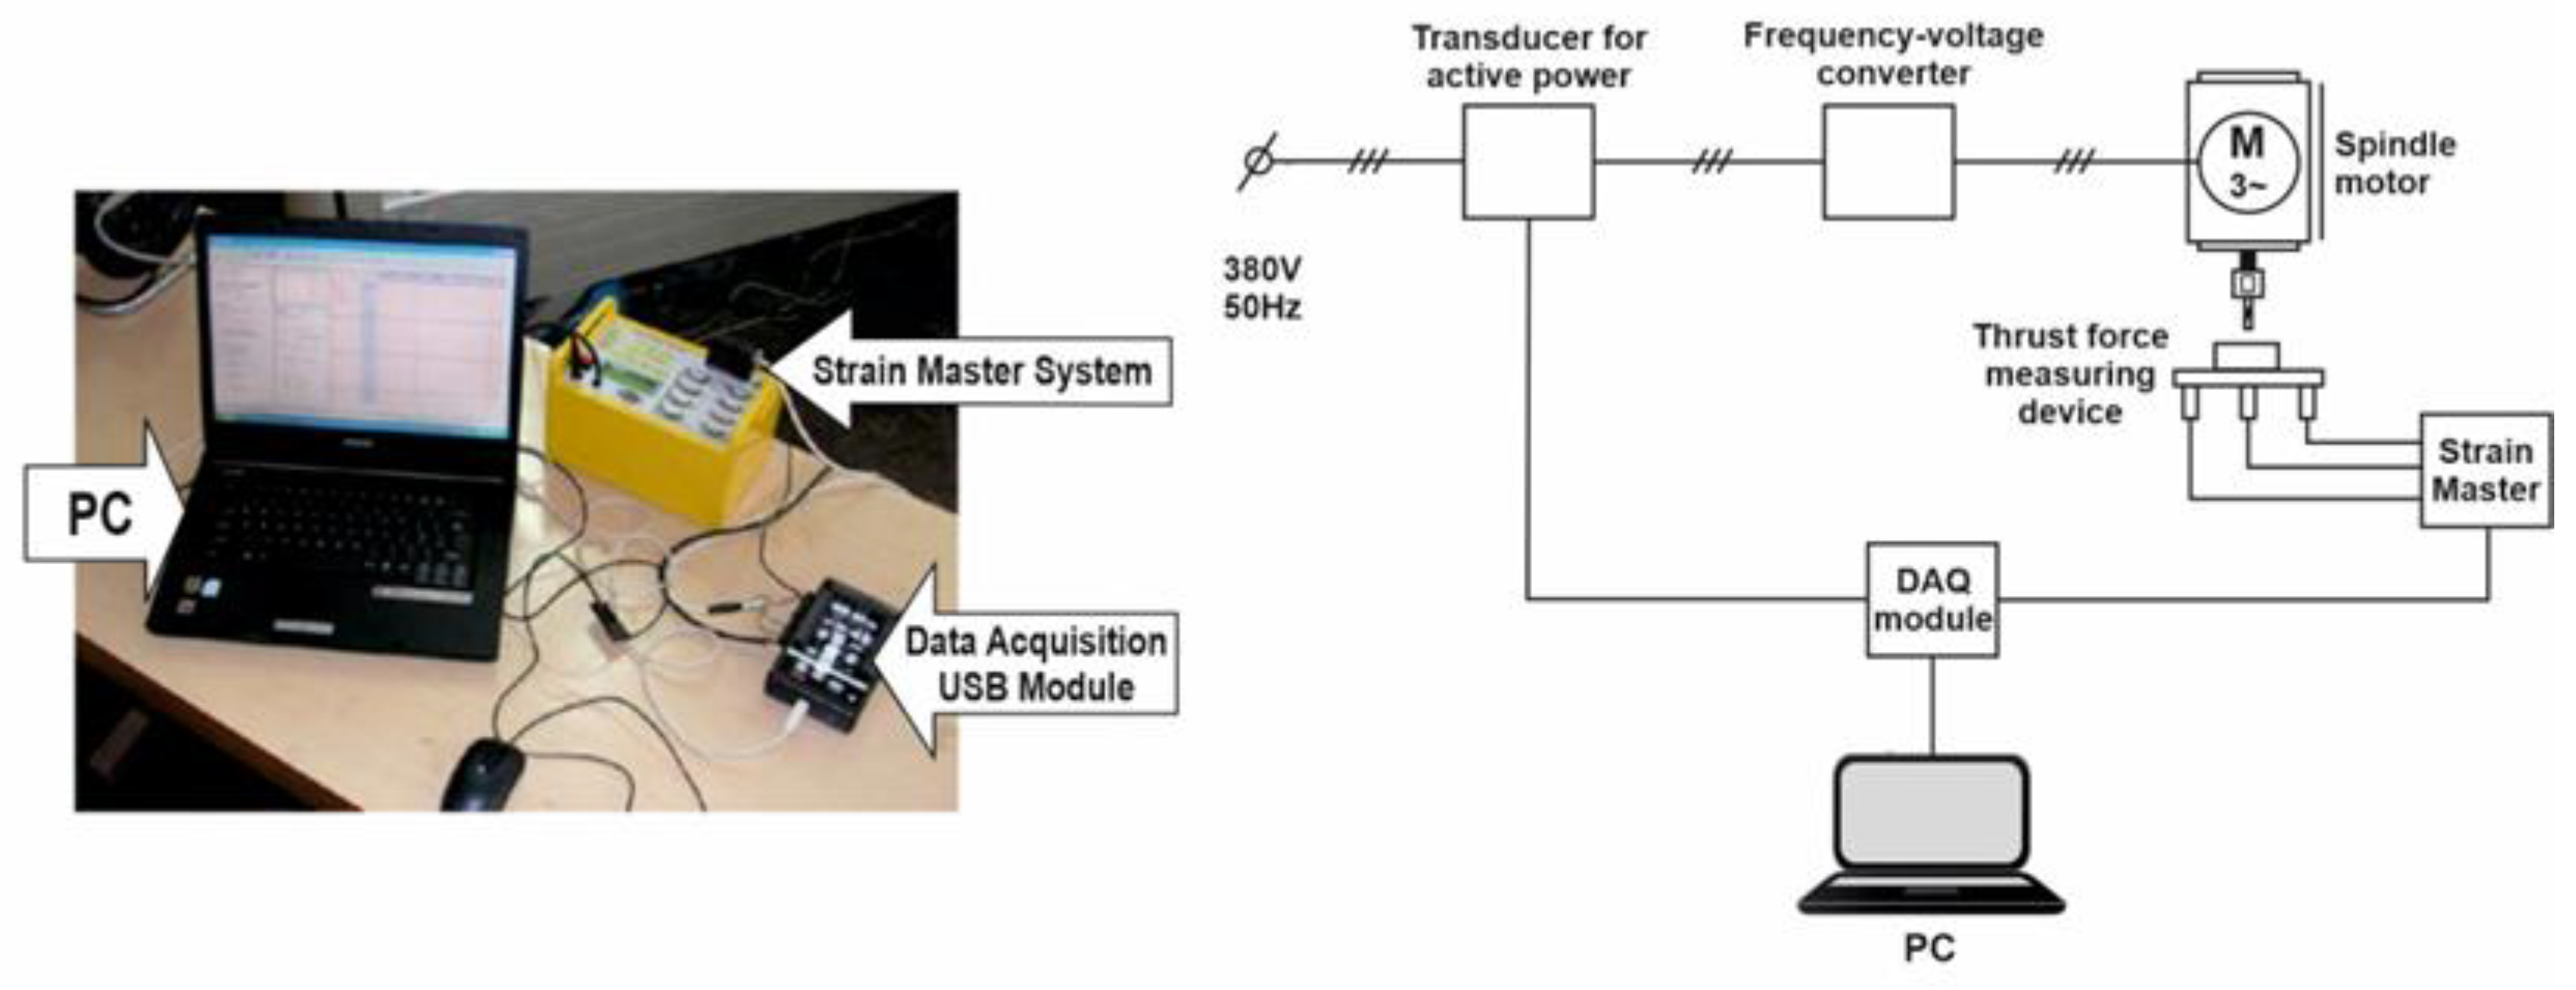
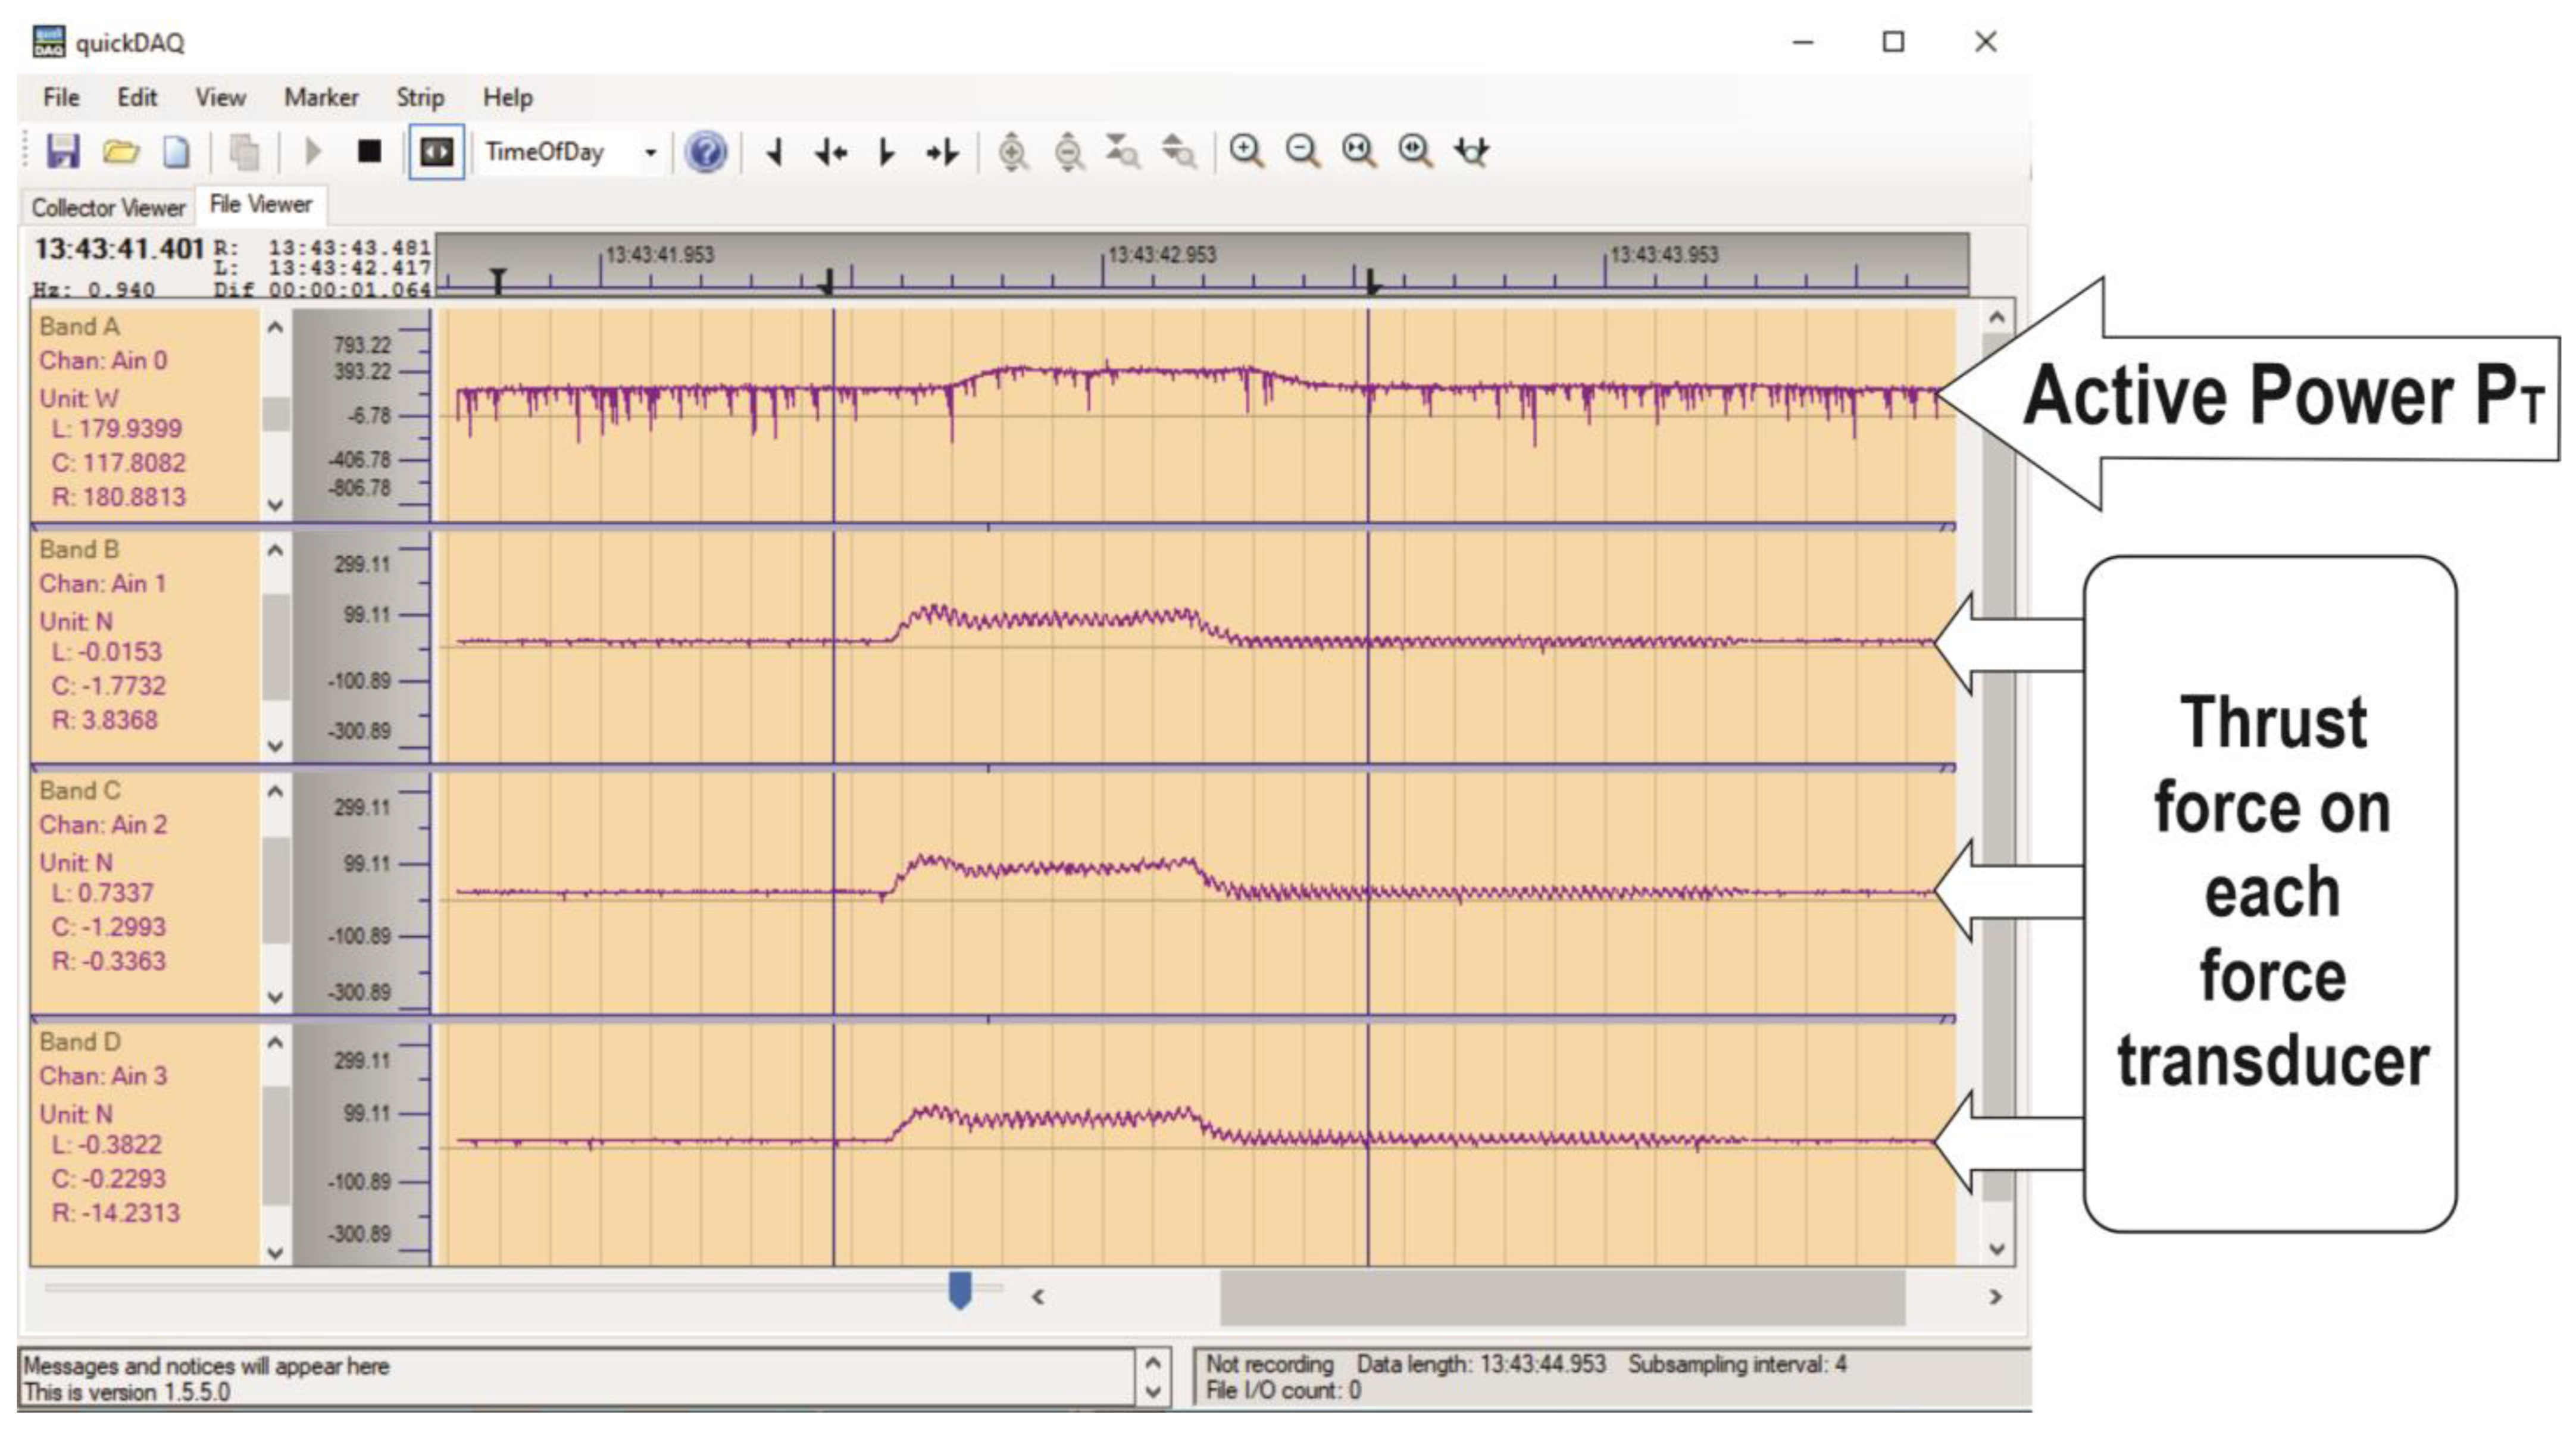
2.1. The Experiments

Eight drill bits with 10 mm cutting diameter were used: 4 flat drill bits (rake angle γ = 0°) and 4 twist (helical) drill bits. They had different tip angles (2κr = 30°, 60°, 90°, and 120°). The selected drills are presented in Figure 1. The clearance angle of the drills was α = 20°. The drills used were coded with symbols according to the tip angle: T30, T60, T90, and T120.
The 80 samples used for the experiments were cut from an 18 mm-thick MDF board. They had a square shape with dimensions of 80 × 80 mm (Figure 2a).
The samples were divided into two groups of 40. One group was processed with flat drills, and the other with helical drills. Each group of 40 samples was divided into four groups of 10. The drilling of each group was conducted with a different tooth bite (0.1, 0.3, 0.5, and 0.7 mm, respectively). Given that the rotation speed of the drills was 3000 rpm, the feed speeds used were 0.6, 1.8, 3.0, and 4.2 m/min, respectively. Finally, each specimen was drilled with 4 drills having different tip angles: 30°, 60°, 90°, and 120°.
The machine used for drilling was an ISEL GFV/GFY numerically controlled machining center (Figure 3a). A device with three HBS S2 force transducers (nominal force 500N) was used to measure the thrust force (Figure 3b).
The equipment used for measuring and recording experimental data is shown in Figure 4. The signal received from the force transducers was amplified using the Strain Masters signal amplifier, with 8 independent channels.
The drilling torque was determined indirectly. Initially, the active electrical power consumed by the spindle motor was measured. A Sineax P530/Q531 (Camille Bauer) active/reactive power transducer was used. A Keithley Model KUSB-3108 DAQ board was used for data recording. Figure 4 shows the equipment used for measurements and the connection diagram.
Keithley KUSB QuickDataAcq software v. 1.5.5.0 package was used to store the data (Figure 5). The data acquisition was conducted on four channels simultaneously, the first was dedicated to the active power PT consumed by the spindle motor, and the other three were dedicated to the forces in the feed movement direction of the drill bit, measured by the three force transducers.
The active power consumed by the motor PT comprises both the power consumed for idle running P0 and the power consumed for actual drilling PD, while the sum of the values recorded by the force transducers represents the thrust force FT.
By DAQ, a total of 320 data files were obtained, one for each drill operation (2 drill bit types × 4 drill bits × 4 feed speeds × 10 samples = 320 drilling operations).
Microsoft Excel was used for data processing. First, the acquired data were converted to .xls format. Then, the data were filtered with a fourth-order Butterworth digital filter in order to remove the noise and other parasite components of the signals.
After filtering, the data from the channels 2, 3, and 4 were summed 3 by 3 to obtain the variation in the thrust force (Figure 6).
A quick look at Figure 5 and Figure 6 would give the impression that the power and force signals are not synchronized. This could be a sign that the equipment was faulty or that the measurements were affected by errors. In fact, this is not the case. The equipment was checked, and several tests were performed that showed that the equipment was in good working condition. However, a careful analysis of the data shows that the two signals are not out of phase, but that the power increases more slowly (less steeply) than the thrust force, even very slowly in the first moments after the drill touches the test piece. The physical explanation of the phenomenon can be attributed with certainty to the fact that the rotor of the working spindle acts as a flywheel, having a high inertia due to its high mass and high speed. As a result, the electric power absorbed from the grid by the electric motor (in order to sustain the spindle rotation) increases more slowly and gives the impression of a desynchronization of the measured signal (lag behind).
For subsequent calculations, the maximum values of the active power PT and the thrust force FT were taken into account.
Finally, using the data related to the consumed active power PT, and using Equation (1), the variation in the drilling torque TD was obtained [35].
T D = 9.55 P D n N m
where:
PD is the active power consumed only for drilling, PD = PTP0, in W;
P0 is the active power consumed for idle running (average of measured values at idle running), in W; and
n—spindle rotation speed, in rpm.
Equation (2) was used to calculate the delamination factor Fd [2]. Dmax is the diameter of the circumscribed circle of the delaminated area and the average diameter of the hole D was calculated based on two values measured with the caliper D1 and D2 (Figure 2c).
F d = D m a x D

2.2. Data Modeling

2.2.1. ANN Model Development

The ANN models were developed based on 70% of experimental data (218 experimental values) by means of NeuralWorks Predict Software (NeuralWare Inc., Carnegie, PA, USA). The designing phase included the training and testing of neural networks. The other part of the data set (93 experimental values) was used to validate the ANN models, namely to check out how well the developed networks perform with unknown values. The independent variables are presented in Table 1. The dependent variables were delamination factor at the inlet (Y1), delamination factor at outlet (Y2), thrust force (Y3), and drilling torque (Y4).
The NeuralWorks Predict Software has the ability to analyze and transform the data into forms suitable for neural networks. Moreover, the software uses a genetic algorithm to reveal the input variables that are good predictors of the output [36]. All models were designed to have a hyperbolic-tangent transfer function in the hidden layer and a sigmoid (logistic) transfer function in the output layer. The software involves the cascade-correlation learning algorithm. This constructive method starts with a minimal network, then automatically trains and adds new hidden units one by one. Consequently, the network determines its own size and topology [37]. The learning rate was equal to 0.01—the default value in the NeuralWorks Predict Software.
The performance of developed ANN models could be measured by means of various statistics indicators such as correlation coefficient (R), coefficient of determination (R2), mean square error (MSE), mean absolute error (MAE), root mean square error (RMSE), and so on. However, in this work, the designed ANN models were evaluated through correlation coefficient (Equation (3)) and coefficient of determination (Equation (4)), due to the fact that they are the most used statistical indicators in data modelling [38,39,40]. Moreover, the predicted values were plotted against experimental data, according to the approach presented in other studies [18,36].
R = i = 1 N ( p i p ¯ ) ( a i a ¯ ) i = 1 N ( p i p ¯ ) 2 i = 1 N ( a i a ¯ ) 2
R 2 = 1 i = 1 N a i p i 2 i = 1 N a i a ¯ 2
where N is the number of values, ai is the experimental value, pi is the predicted value, a ¯ is the mean of the experimental values, and p ¯ is the mean of the predicted values.

2.2.2. Response Surface Modeling

The response surface methodology (RSM) was used to figure out the influence of the analyzed independent variables, namely drill tip angle (X1), tooth bite (X2), and drill type (X3) on delamination factor at inlet (Y1), delamination factor at outlet (Y2), thrust force (Y3), and drilling torque (Y4), which are the dependent variables analyzed in this work. The values of analyzed input factors are presented in Table 2. Moreover, the RSM was used to find the optimum values of analyzed factors together with a Box–Wilson central composite design (CCD). This design contains:
  • two-level factorial points (Figure 7), which analyze all combinations of the low (−1) and high (+1) levels of analyzed factors, namely eight combinations (four combinations for flat drill and four combinations for helical drill), namely, combinations #1, #6, #8, #13, #16, #23, #24, and #25 (Table 3);
  • axial points (Figure 7 and Table 3), which are needed to estimate the non-linear effect of analyzed factors. In this work, the α was equal to 1, therefore a face centered design was applied. Eight combinations (four combination for each type of drill) were analyzed in this study, namely (combinations #3, #4, #10, #14, #17, #18, #19, and #22);
  • center points (Figure 7 and Table 3), which were needed to estimate the experimental error. A total of ten combinations were analyzed (five combinations for flat drill and five combinations for helical drill), namely, combinations #2, #5, #7, #9, #11, #12, #15, #20, #21, and #26.
The Design-Expert program (Version 9, Stat-Ease Inc., Minneapolis, MN, USA) was used to generate the experimental design (Table 3), statistical analysis, and process optimization. The values for each analyzed dependent variable were determined by means of developed ANN models.
Usually, a second order model is used together with response surface methodology. Its mathematical general form is presented in Equation (5) [41].
Y = β 0 + i = 1 k β i X i + i = 1 k β i i X i 2 + i = 1 k   j = 1 k β i j X i X j + ε
where Y is the analyzed response (delamination factor, thrust force or drilling torque), X i and X j are the analyzed independent variables (drill tip angle, tooth bite, and drill type), β 0 is the constant, β i , β i i , and β i j are the coefficients of the equation, ε is the error term, and k represents the number of analyzed factors. The value of coefficients of the equation is obtained through linear regression analysis. The model accuracy is revealed by means of coefficient of determination (R2).
The analysis of variance ANOVA is used to identify the factors that have a significant influence on the analyzed responses. The ANOVA is usually performed at a 5% significance level (α). If the calculated F-value is higher than the critical value (Fcrit), it could be stated that the analyzed factor has significant influence on the dependent variable (p-value < α). In addition, the ANOVA is used to a 1% significance level to check the validity of the developed model to predict the analyzed response.
The Design-Expert software v. 9.0.4 package uses the desirability function approach during the multiple response optimization study. In this study, the optimization criteria were to minimize the delamination factor at inlet and outlet, thrust force, and drilling torque (Table 4). The optimization, starts by converting each response (Yi), into an individual desirability function (di), which may have a value between 0 and 1. If the analyzed response fulfills the optimization goal, the di = 1. All individual desirabilities are combined by means of geometric mean that describes the overall desirability, D (Equation (6)) [42]:
D = d 1 Y 1 × d 2 Y 2 × ×   d n Y n 1 / n
where n represents the responses being optimized.

3. Results and Discussion
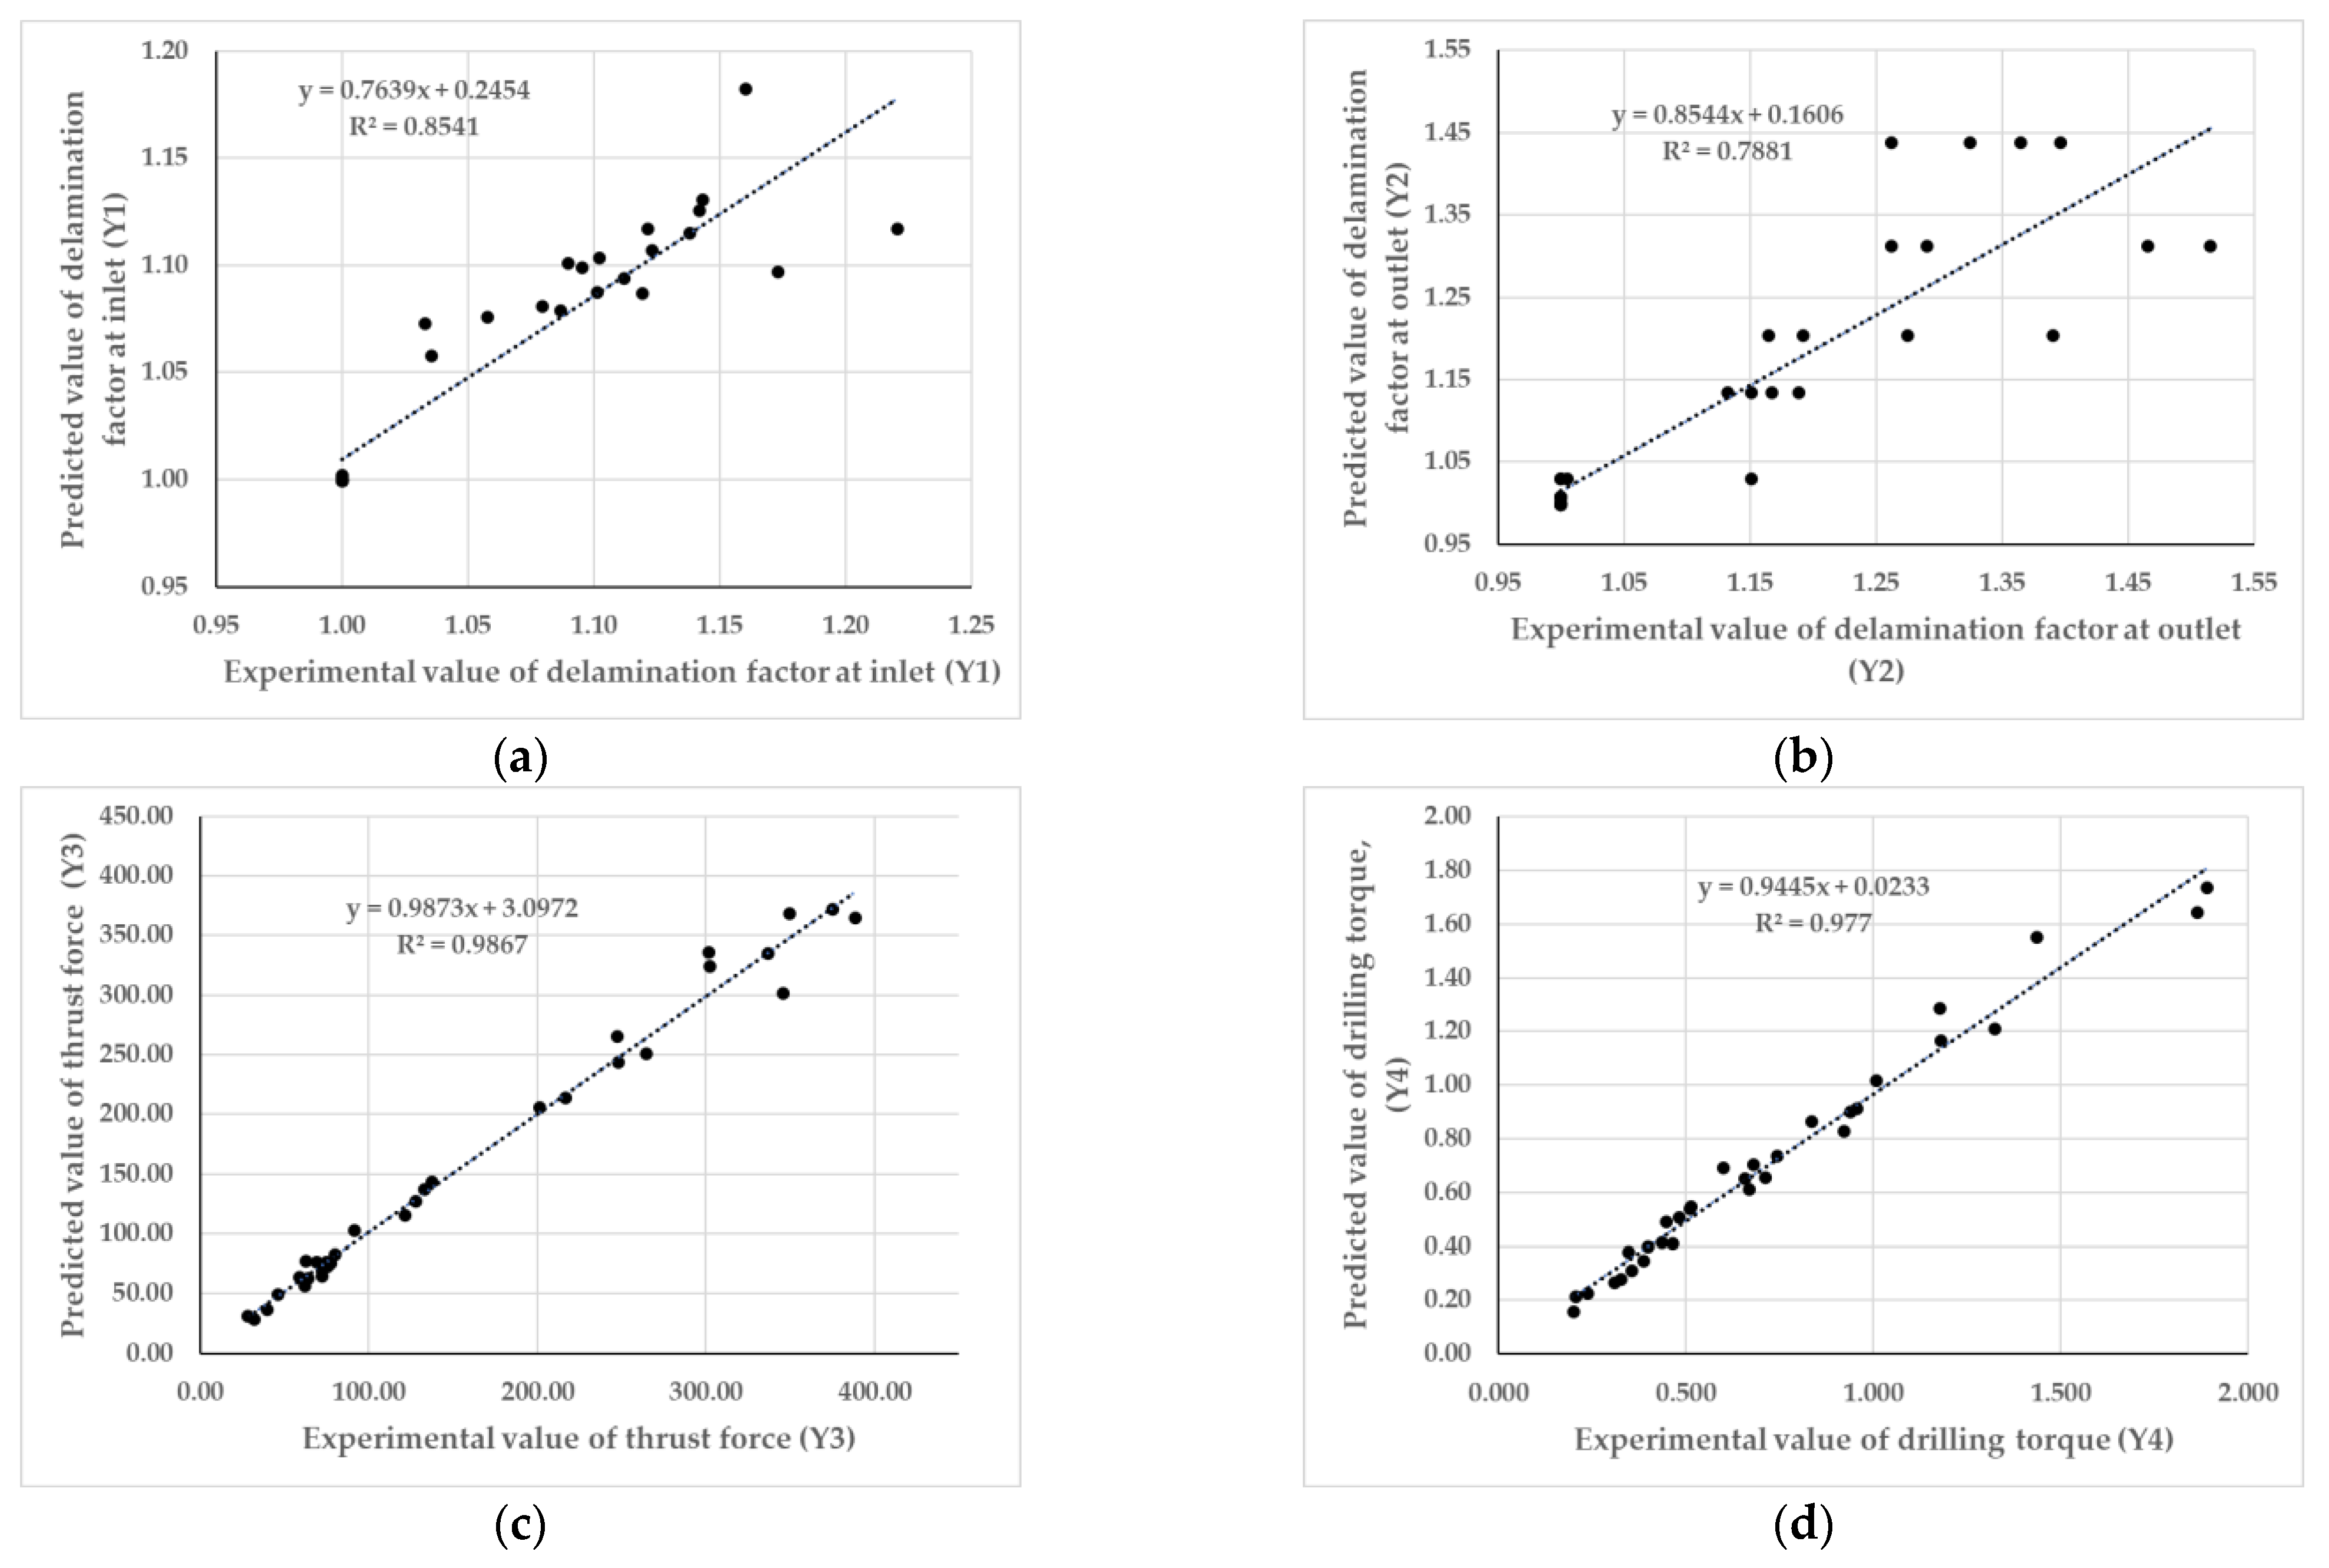
3.1. ANN Modeling

The architecture of ANN models, which can be used to predict the analyzed responses, namely, delamination factor at inlet, delamination factor at outlet, thrust force, and drilling torque in the case of MDF boards are presented Table 5 and Figure 8. Based on the obtained performance indicators during the training, testing, and validation phase, it could be concluded that the developed ANN models are able to predict adequately the dependent variables. Compare these results with the results presented in the literature [14], in which the same methodology was applied in the case of prelaminated particleboards drilling, one could observe that the overall performance of the developed artificial neural networks for the MDF boards is slightly better than the performance of the ANN models, which were designed for particleboards (Table 6). This could be due to the fact that the MFD boards have more of a homogenous structure than the prelaminated wood particleboards. Moreover, the topology structure of developed ANN models is different in the case of MDF boards from in the case of prelaminated wood particleboards (see the number of neurons in the hidden layer). Therefore, it could be concluded that the type of material influences the behavior of the artificial neural networks during the modelling of the drilling process of wood-based boards—a study that is underway by our group. The affirmation is also supported by the study performed by Podziewski et al. [43] that obtained that the machinability index based on quality criterion was not correlated with the index based on the cutting force criterion due to the different internal structure of analyzed materials, namely fiberboards, particle boards, and veneer boards.
The developed ANN models in this work have a coefficient of determination (R2) among 0.78 and 0.98. Therefore, it could be affirmed that the designed artificial neural network models could explain at least 78% in the model developed to predict the delamination factor at the outlet and at least 98% of the experimental values in the case of the model designed to forecast the drilling torque. The values of the performance indicator (R2) are in the range with data reporting in previous studies regarding the application of ANN modeling techniques in wood machining; namely, Özşahin and Singer [19] obtained a R2 of 0.98 for a neural network trained to predict the noise emission during wood machining. Nasir and Cool [20] obtained a coefficient of determination between 0.67 and 0.99 for various network architectures that were designed to predict the dust emission during wood sawing. Gürgen et al. [24] attained a R2 of 0.96 for an ANN model designed to predict the surface roughness. Tiryaki et al. [18] designed an ANN model that is able to predict the power consumption in wood planning with a R2 of 0.97. Additionally, the neural network designed by Zbieć [16] to monitor the tool wear during milling of MDF earned a high coefficient of determination (R2 = 0.99). In conclusion, the designed neural networks have a high predictability. How well the designed ANN models performed could be inspected, also from Figure 9, wherein one could observe that the predicted values are close to the experimental ones.

3.2. Response Surface Methodology

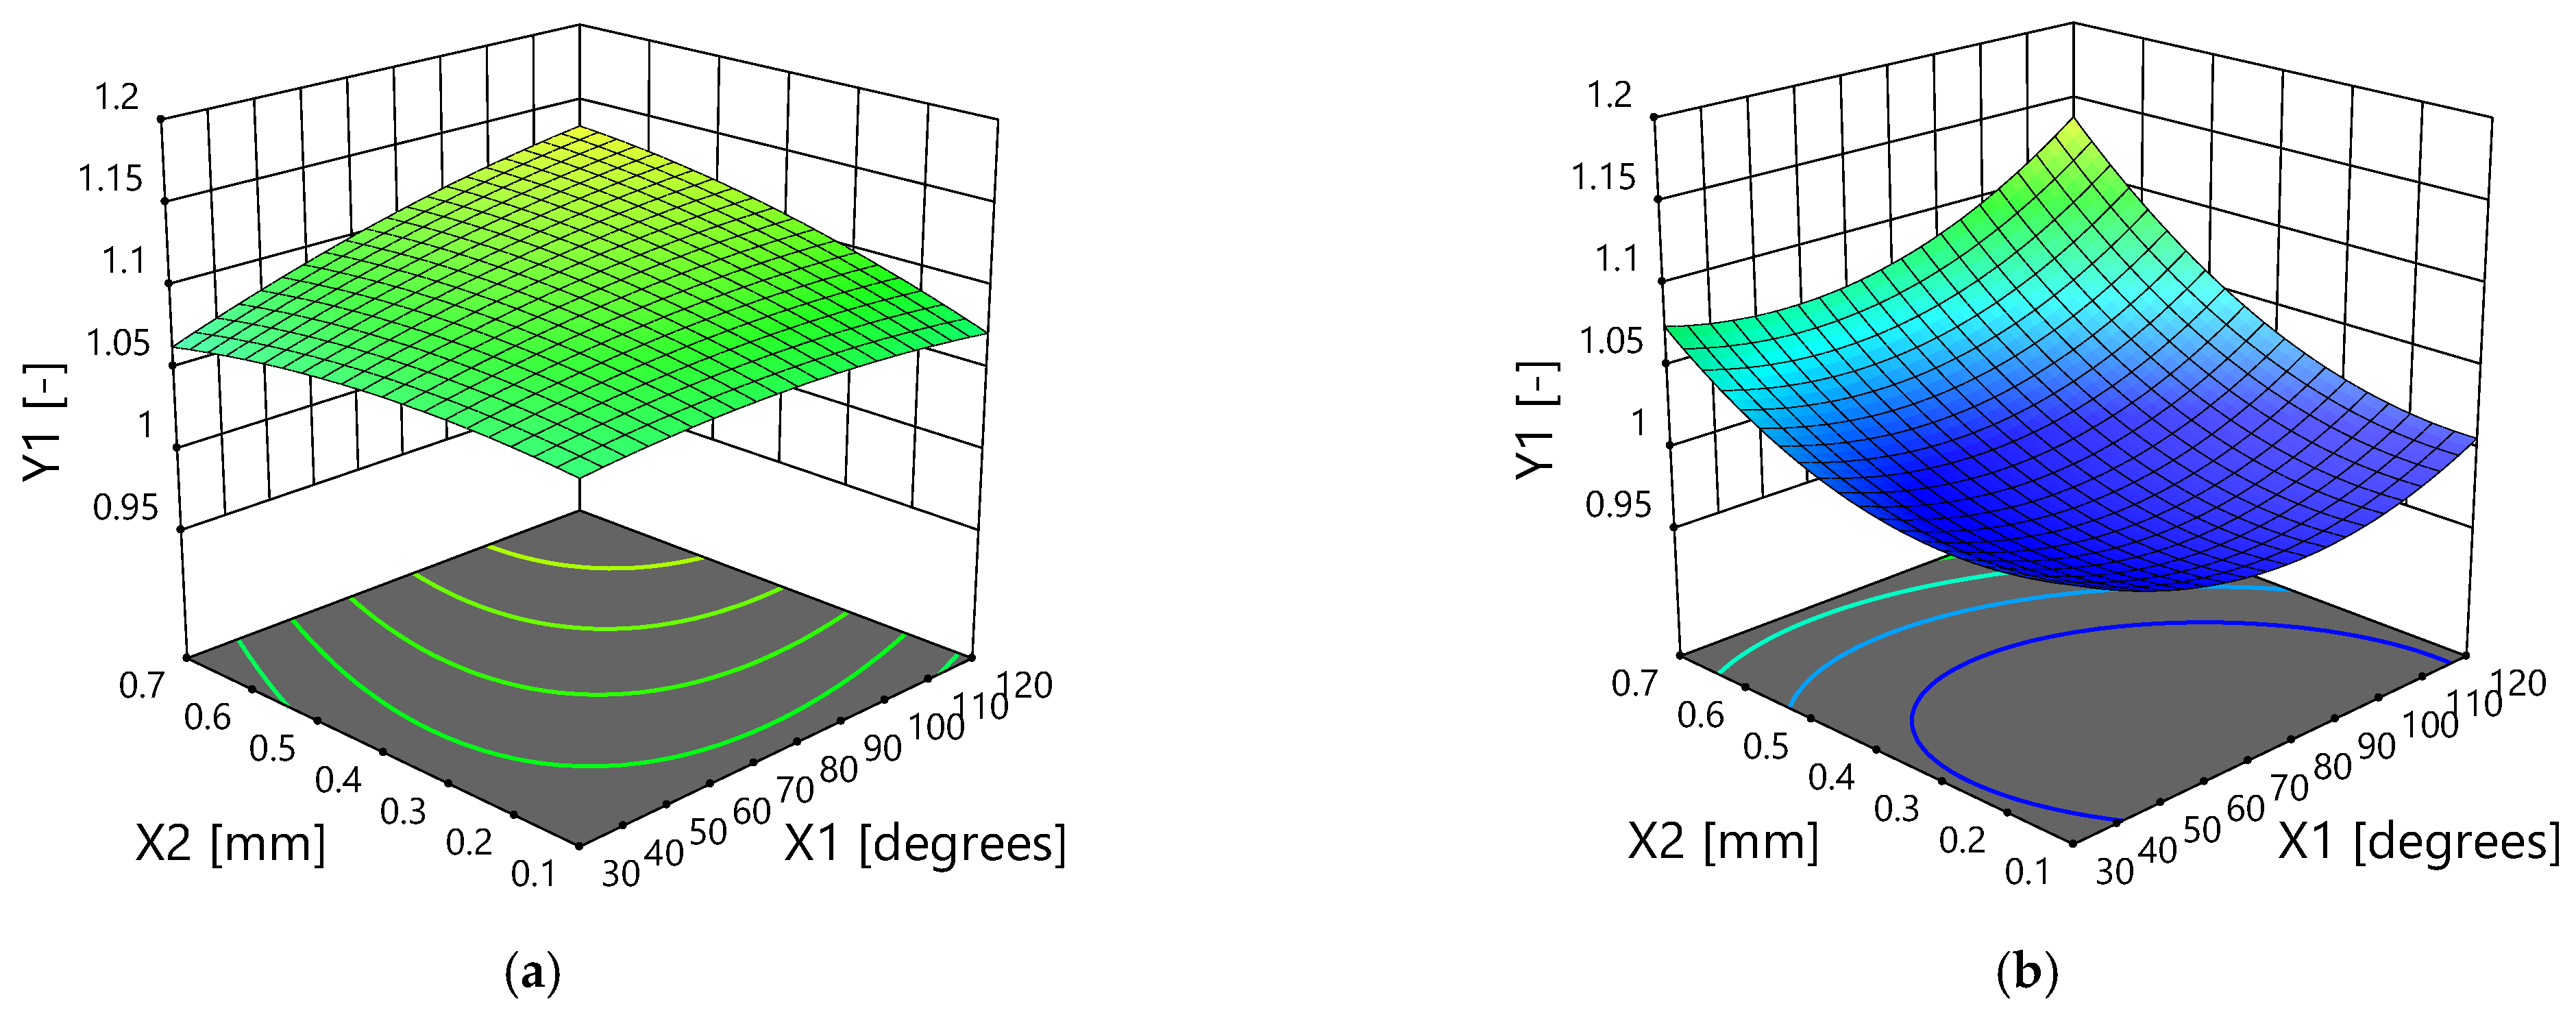
3.2.1. Delamination Factor at the Inlet

In the Equations (7)–(9) are presented the selected models, which are significant at 1%, for the prediction of delamination factor at inlet (Y1) in the case of the flat and helical drill.
Y 1 ^ coded = 1.05 + 0.015 X 1 + 0.030 X 2 -   0.057 X 3 + 0.018 X 1 X 2 0.001615 X 1 X 3 + 0.018 X 2 X 3 + 0.013 X 1 2 + 0.012 X 2 2 + 0.001686 X 1 X 2 X 3 + 0.021 X 1 2 X 3 + 0.022 X 2 2 X 3
Y 1 ^ flat = 1.05612 + 0.0004964 X 1 + 0.04166 X 2 + 0.00120 X 1 X 2 0.000004076 X 1 2 0.11385 X 2 2
Y 1 ^ helical =   1 . 10449   -   0.002835 X 1 - 0.25351 X 2 + 0.00145773 X 1 X 2 + 0.0000169914 X 1 2 + 0.37976 X 2 2 .
By comparing the factor coefficients of Equation (7), one could observe that drill type (X3) has a bigger influence than the drill tip angle (X1) and tooth bite (X2). This result is contrary to the results obtained in the case of prelaminated particleboards, where the most important factor that affects the delamination factor at inlet (Y1) is the tooth bite [14]. This result is correlated with data reported in the literature; namely, the feed rate and drill tip angle play an important role on the value of delamination factor [2,6,8,9,12]. In addition, in this study, it was found that there is an interaction between the independent variables. The most important interaction is between drill tip angle and drill type (X1X3) and between tooth bite and drill type (X2X3). Since there is a non-linear effect on the drill tip angle and tooth bite factor, the optimum values are inside the analyzed range (Table 1). The ANOVA results (α = 0.05) are presented in Table 7. In Figure 10, the influence of the drill tip angle (X1) and tooth bite (X2) on the delamination factor at the inlet during MDF drilling can be observed.

3.2.2. Delamination Factor at the Outlet
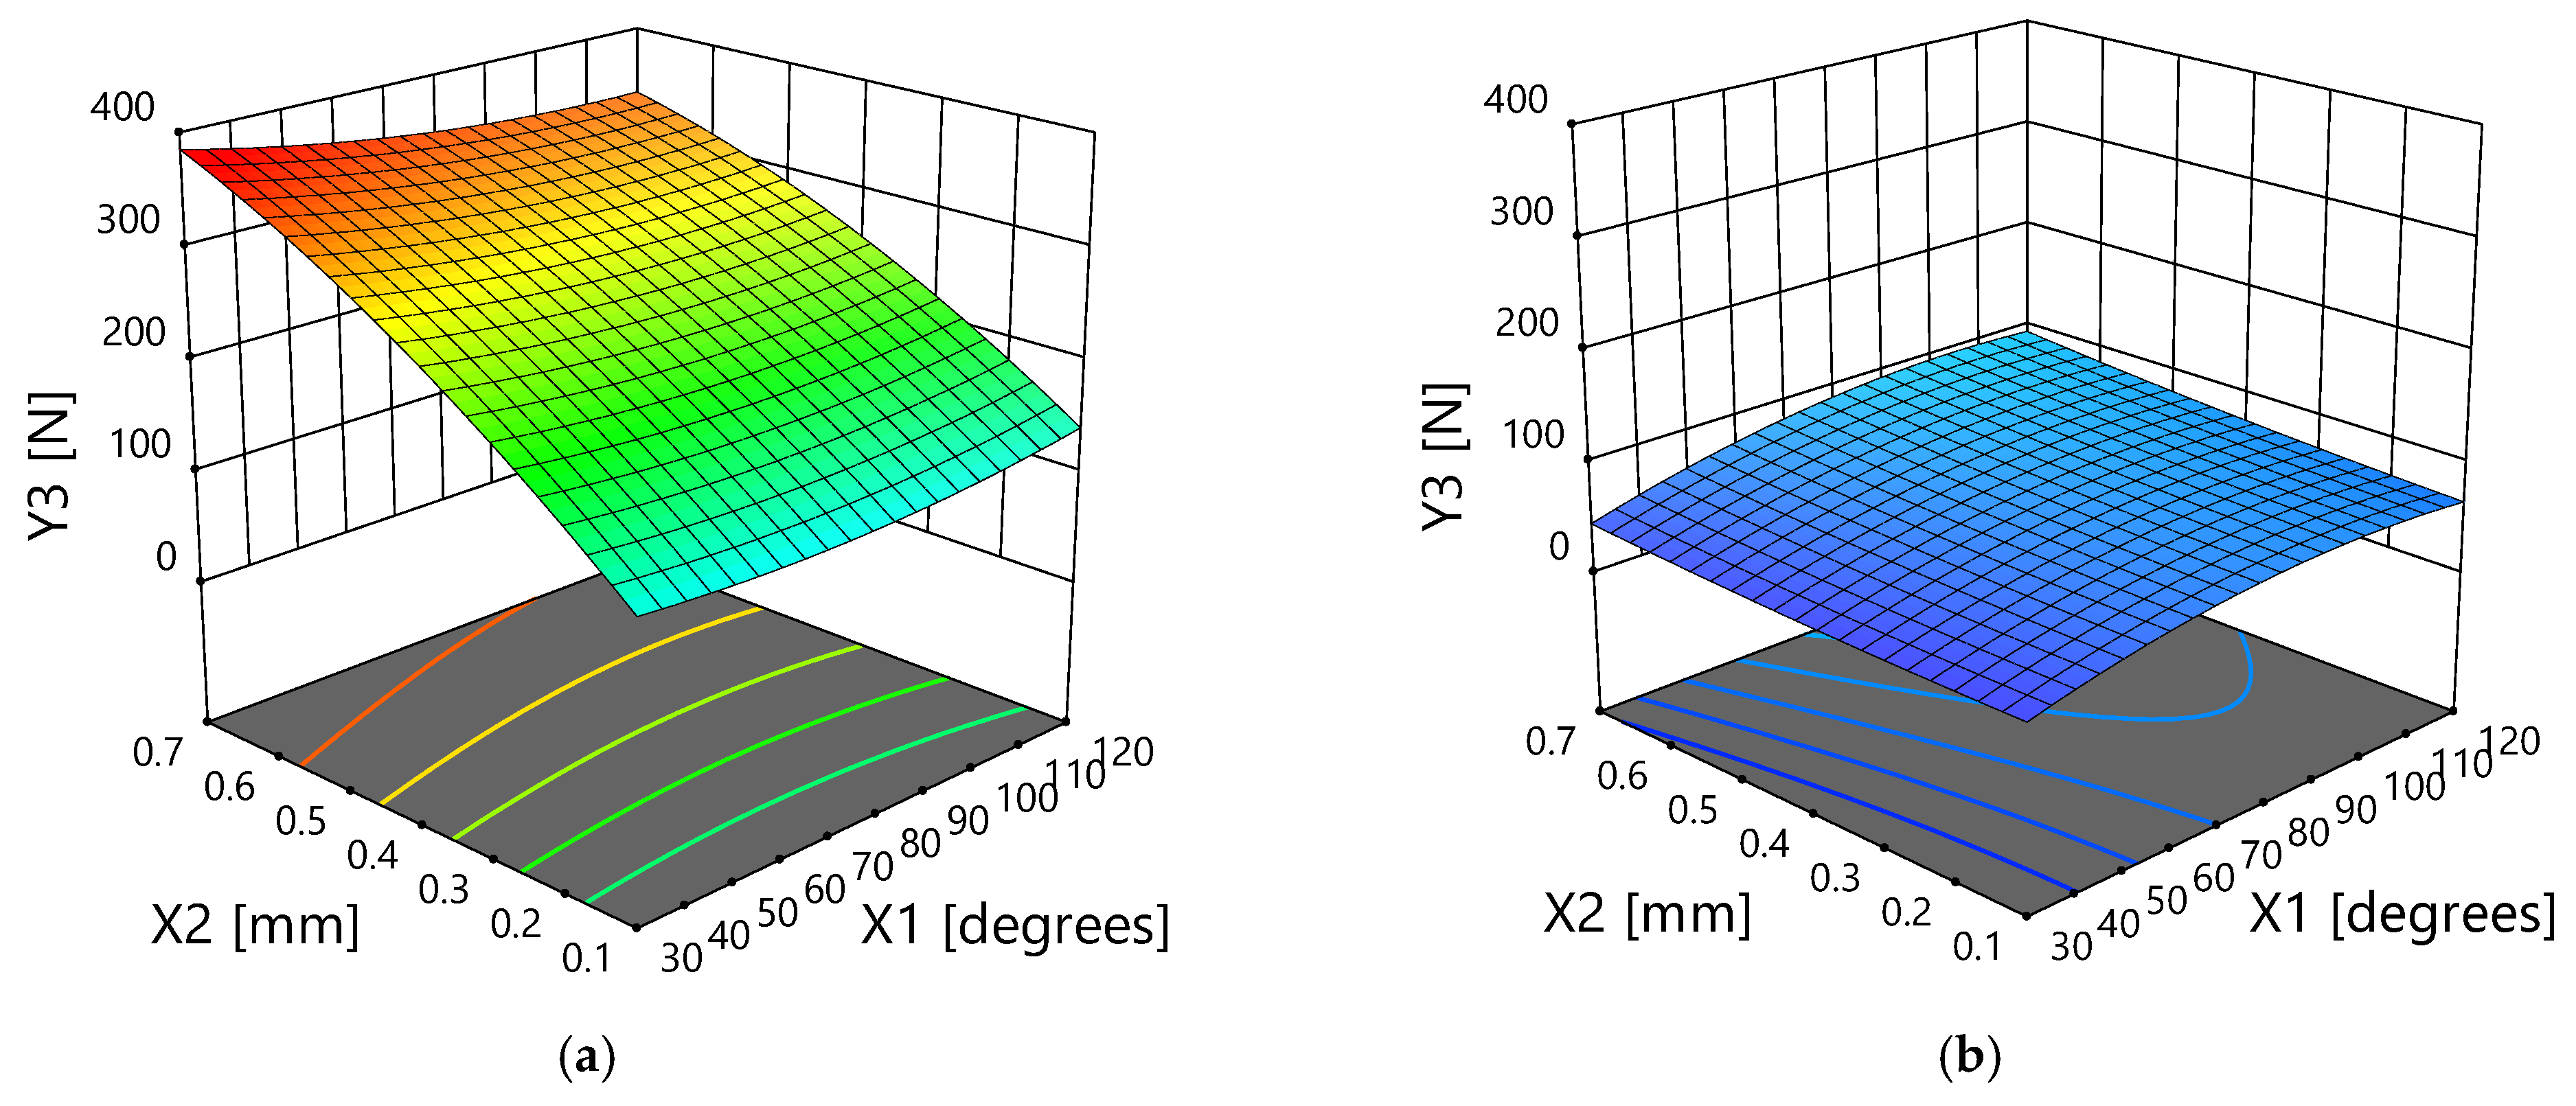
The regression equations obtained for the delamination factor at outlet (Y2) are presented by Equations (10)–(12). The models are significant at 1%. Based on Equation (9), one could observe that the most important factor that influences the delamination factor at outlet is the drill type (X3), which is similar with that obtained in the case of the delamination factor at inlet. The second factor is the drill tip angle (X1). The third one is the tooth bite (X2). Moreover, the results are similar with data reported in the literature; namely, a small tip angle with a low feed rate assures a lower delamination factor during drilling of MDF [2]. The most important interaction is between drill tip angle and tooth bite (X1X2). By comparing the results regarding the most important factor that affects the delamination factor at outlet during drilling of MDF boards, one could observe that the obtained result is the same as that obtained in the case of prelaminated wood particleboards [14]. The ANOVA results (α = 0.05) are presented in Table 8. In Figure 11 is presented the synergetic effects of the drill tip angle (X1) and tooth bite (X2) on the delamination factor at the outlet (Y2).
Y 2 ^ coded = 1.13 + 0.084 X 1 2.16   × 10 17 X 2 0.13 X 3 + 0.7586 X 1 X 2 0.068 X 1 X 3 0.2018 X 2 X 3 + 0.022 X 1 2 + 7.381 × 10 19 X 2 2
Y 2 ^ flat = 1.0675 + 0.0017 X 1 2.076   × 10 16 X 2 + 4.899   × 10 18 X 1 X 2 + 1.10   × 10 5 X 1 2 2.46031   × 10 17 X 2 2
Y 2 ^ helical =   1 . 033   -   0.0013 X 1 3.873   × 10 16 X 2 + 4.899   × 10 18 X 1 X 2 + 1.097   × 10 5 X 1 2 2.46   × 10 17 X 2 2 .

3.2.3. Thrust Force

The regression equations that can be used to predict the thrust force (Y3) are shown in Equations (13)–(15). The most important factor that influences the trust force during the drilling of MDF boards is the same as in the case of prelaminated wood particleboards, namely drill type [14]. The second one is the tooth bite and drill tip angle. The results are supported by the data in the literature, namely that the thrust force is affected by the feed rate [44,45]. The interaction between tooth bite and drill type has a bigger effect than the others, namely between tooth bite and drill tip angle or the interaction between drill tip angle and drill type. This interaction is pictured in Figure 11. The ANOVA results (α = 0.05) are presented in Table 9. In Figure 12 is presented the interaction effects of the drill tip angle (X1) and tooth bite (X2) on the thrust force (Y3).
Y 3 ^ coded = 166.96 + 6.22 X 1 + 62.15 X 2 91.97 X 3 5.25 X 1 X 2 + 14.31 X 1 X 3 51.75 X 2 X 3 3.12 X 1 2 10.05 X 2 2 + 9.61 X 1 X 2 X 3 16.23 X 1 2 X 3 + 13.49 X 2 2 X 3
Y 3 ^ flat = 82.13   0.71059 X 1 + 671.376 X 2 1.10 X 1 X 2 + 0.00647 X 1 2 261.59 X 2 2
Y 3 ^ helical = 11.058 + 1.759 X 1   20.074   X 2 + 0.323 X 1 X 2 0.00955 X 1 2 + 38.27 X 2 2 .

3.2.4. Drilling Torque

The tooth bite has a bigger influence on the drilling torque (Y4) than the other two analyzed factors. Drill tip angle affects more the drilling torque than the drill type. The obtained result is the same as that obtained in the case of prelaminated wood particleboards [14]. In addition, the findings are correlated with data from literature, namely that the drilling torque is influenced by the feed rate and tip angle during drilling of MDF [2].
Based on Equation (16), one could observe that there is an interaction effect on the drilling torque (X1X2 > X2X3 > X1X3). The ANOVA results are presented in Table 10. In Figure 13 is presented the influence of the drill tip angle and tooth bite on the drilling torque. Equations (17) and (18) could be used to predict the drilling torque (Y4) based on the drill tip angle (X1) and tooth bite (X2).
Y 4 ^ coded = 0.70   0.28 X 1 + 0.37 X 2 0.18 X 3 0.16 X 1 X 2 + 0.052 X 1 X 3 0.11 X 2 X 3
Y 4 ^ flat = 0.456   0.0028 X 1 + 2.455 X 2 0.01156 X 1 X 2
Y 4 ^ helical = 0.214   0.0005 X 1 + 1.732   X 2 0.0115 X 1 X 2 .
In Table 11 are presented the optimum solutions. The relative error between predicted and experimental values was calculated with Equation (19).
Comparing the results of this study with those obtained in our previous work [14], the following could be observed:
  • The helical drill, together with a low tooth bite assure a high quality and low energy consumption both for MDF panels and prelaminated wood particleboards.
  • Regarding the helical drill, the optimum value of the drill tip angle (X1) is 64° or 89° (Table 11). By rounding these values to nearest ones, we could affirm that a drill tip angle equal to 60° or 90° will perform well both in the case of MDF and prelaminated wood particleboard [1].
  • Regarding the flat drill, the optimum value of drill tip angle (X1) is 30° or 60° for MDF boards, compared to prelaminated wood particleboards wherein the value was 30°, 60°, or 90°. Therefore, it could be concluded that for flat drills, a drill tip equal to 30° or 60° assures a high drilling quality and a lower energy consumption both in the case of MDF and prelaminated wood particleboards.
  • The relative errors between predicted and experimental values are lower than those that were obtained in the case of our previous work regarding the drilling of prelaminated wood particleboards. In this study, the error was between 0.09 and 3.9% in the case of the delamination factor; 1.7 and 13.5% in the case of the thrust force; and 0.2 and 0.5% for the drilling torque. Therefore, it could be concluded that the developed regression equations for MDF boards performs better than those designed for prelaminated wood particleboards.
a—drill tip angle was considered equal to 60°; b—drill tip angle was considered equal to 90°.
E R = Y   -   Y ^ Y   ×   100
where ER is the relative error (%), Y is the experimental value and Y ^ is the predicted value.

4. Conclusions

It was shown that delamination factor at inlet and outlet, thrust force, and drilling torque during drilling of MDF boards could be reasonably predicted by means of the artificial neural network modeling technique. The independent variables were drill tip angle, tooth bite, and drill type. Additionally, it was shown that response surface methodology could reveal the optimal combination of factors during drilling of MDF boards. The experimental design used in this research was completed by means of four ANN models—one for each analyzed dependent variable. The results show that the helical drill performs much better than the flat ones in terms of hole quality and energy consumption during the drilling of MDF boards. Drill type (flat or helical) is the most important factor that affects both the delamination factor and thrust force. Regarding the drilling torque, it was observed that, the most important factor that influences its value is the tooth bite. A part of the optimum combinations among analyzed factors could be used both during the drilling of the MDF boards and prelaminated wood particleboards. The limits of the study are related to the relatively small number of independent parameters taken into account: drill type, drill tip angle, and tooth bite. Other parameters can also be taken into account, such as the diameter of the drill bit and other types of drill bits (e.g., Forstner drill bits), material type, thickness and properties that are processed, tool wear, rotation speed of the drills, and a wider range of feed speeds. All these are research directions that the authors consider for the future.

Author Contributions

Conceptualization, B.B. and M.I.; methodology, B.B., M.I. and S.R.; software, B.B. and S.R.; validation, B.B.; resources, S.R.; writing—original draft preparation, B.B. and M.I.; writing—review and editing, M.I. and B.B.; visualization, S.R. All authors have read and agreed to the published version of the manuscript.

Funding

This research received no external funding.

Data Availability Statement

The data presented in this study are available on request from the corresponding author. The data are not publicly available due to the fact that other studies are underway.

Conflicts of Interest

The authors declare no conflict of interest.

References

  1. Kamperidou, V. Drilling of Wood and Wood-Based Panels. In Proceedings of the Tenth Scientific and Technical Conference “Innovations in Forest Industry and Engineering Design” INNO 2020, Sofia, Bulgaria, 1–3 October 2020; Available online: https://www.researchgate.net/publication/344695192_DRILLING_OF_WOOD_AND_WOOD-BASED_PANELS (accessed on 11 November 2023).
  2. Szwajka, K.; Trzepiecinski, T. On the machinability of medium density fiberboard by drilling. Bioresources 2019, 13, 8263–8278. [Google Scholar] [CrossRef]
  3. Sydor, M.; Rogoziński, T.; Stuper-Szablewska, K.; Starczewski, K. The accuracy of holes drilled in the side surface of plywood. BioRes 2020, 15, 117–129. [Google Scholar] [CrossRef]
  4. Kurek, J.; Krupa, A.; Antoniuk, I.; Akhmet, A.; Abdiomar, U.; Bukowski, M.; Szymanowski, K. Improved Drill State Recognition during Milling Process Using Artificial Intelligence. Sensors 2023, 23, 448. [Google Scholar] [CrossRef] [PubMed]
  5. Ispas, M.; Răcășan, S. Study regarding the influence of the tool geometry and feed rate on the drilling quality of MDF panels. Pro Ligno 2017, 13, 174–180. [Google Scholar]
  6. Davim, P.J.; Clemente, V.C.; Silva, S. Drilling investigation of MDF (medium density fibreboard). J. Mater. Process. Technol. 2007, 203, 537–541. [Google Scholar] [CrossRef]
  7. Palanikumar, K.; Prakash, S.; Manoharan, N. Experimental Investigation and Analysis on Delamination in Drilling of Wood Composite Medium Density Fiber Boards. Mater. Manuf. Process. 2009, 24, 1341–1348. [Google Scholar] [CrossRef]
  8. Prakash, S.; Palanikumar, K.; Manoharan, N. Optimization of delamination factor in drilling medium-density fiberboards (MDF) using desirability-based approach. Int. J. Adv. Manuf. Technol. 2009, 45, 370–381. [Google Scholar] [CrossRef]
  9. Valarmathi, T.N.; Palanikumar, K.; Sekar, S. Parametric analysis on delamination in drilling of wood composite panels. Indian J. Sci. Technol. 2013, 6, 1–10. [Google Scholar] [CrossRef]
  10. Gaitonde, V.N.; Karnik, S.R.; Davim, J.P. Taguchi multiple-performance characteristics optimization in drilling of medium density fibreboard (MDF) to minimize delamination using utility concept. J. Mater. Process. Technol. 2008, 196, 73–78. [Google Scholar] [CrossRef]
  11. Ayyildiz, E.A.; Ayyildiz, M.; Kara, F. Optimization of Surface Roughness in Drilling Medium-Density Fiberboard with a Parallel Robot. Adv. Mater. Sci. Eng. 2021, 2021, 6658968. [Google Scholar] [CrossRef]
  12. Prakash, S.; LillyMercy, J.; Manoj, K.S.; Vineeth, K.S.M. Optimization of drilling characteristics using Grey Relational Analysis (GRA) in Medium Density Fiber Board (MDF). Mater. Today Proc. 2015, 2, 1541–1551. [Google Scholar]
  13. Prakash, S.; Palanikumar, K. Modeling for prediction of surface roughness in drilling MDF panels using response surface methodology. J. Compos. Mater. 2010, 45, 1639–1646. [Google Scholar] [CrossRef]
  14. Bedelean, B.; Ispas, M.; Răcășan, S.; Baba, M.N. Optimization of Wood Particleboard Drilling Operating Parameters by Means of the Artificial Neural Network Modeling Technique and Response Surface Methodology. Forests 2022, 13, 1045. [Google Scholar] [CrossRef]
  15. Szwajka, K.; Zielinska-Szwajka, J.; Gorski, J. Neural networks based in process tool wear prediction system in milling wood operations. In Proceedings of the Fifth International Symposium on Instrumentation Science and Technology, Shenyang, China, 12 January 2009. [Google Scholar] [CrossRef]
  16. Zbieć, M. Application of neural network in simple tool wear monitoring and identification system in MDF milling. Drv. Ind. 2011, 62, 43–54. [Google Scholar] [CrossRef]
  17. Tiryaki, S.; Özşahin, Ş.; Aydin, A. Employing artificial neural networks for minimizing surface roughness and power consumption in abrasive machining of wood. Eur. J. Wood Prod. 2017, 75, 347–358. [Google Scholar] [CrossRef]
  18. Tiryaki, S.; Malkoçoğlu, A.; Özşahin, Ş. Artificial neural network modeling to predict optimum power consumption in wood machining. Drewno 2016, 59, 109–125. [Google Scholar] [CrossRef]
  19. Özşahin, S.; Singer, H. Prediction of noise emission in the machining of wood materials by means of an artificial neural network. N. Z. J. For. Sci. 2022, 52, 1–10. [Google Scholar] [CrossRef]
  20. Nasir, V.; Cool, J. Characterization, optimization, and acoustic emission monitoring of airborne dust emission during wood sawing. Int. J. Adv. Manuf. Technol. 2020, 109, 2365–2375. [Google Scholar] [CrossRef]
  21. Rabiei, F.; Yaghoubi, S. A comprehensive investigation on the influences of optimal CNC wood machining variables on surface quality and process time using GMDH neural network and bees optimization algorithm. Mater. Today Commun. 2023, 36, 106482. [Google Scholar] [CrossRef]
  22. Demir, A.; Osman, E.C.; Aydin, I. Determination of CNC processing parameters for the best wood surface quality via artificial neural network. Wood Mater. Sci. Eng. 2022, 17, 685–692. [Google Scholar] [CrossRef]
  23. Cakmak, A.; Malkocoglu, A.; Ozsahin, S. Optimization of wood machining parameters using artificial neural network in CNC router. Mater. Sci. Technol. 2023, 39, 1728–1744. [Google Scholar] [CrossRef]
  24. Gürgen, A.; Çakmak, A.; Yildiz, S.; Malkoçoğlu, A. Optimization of CNC operating parameters to minimize surface roughness of Pinus sylvestris using integrated artificial neural network and genetic algorithm. Maderas. Cienc. Tecnol. 2022, 24, 1–12. [Google Scholar] [CrossRef]
  25. Sofuoglu, S.D. Using artificial neural networks to model the surface roughness of massive wooden edge-glued panels made of Scotch pine (Pinus sylvestris L.) in a machining process with computer numerical control. BioRes 2015, 10, 6797–6808. [Google Scholar] [CrossRef]
  26. Nasir, V.; Cool, J.; Sassani, F. Acoustic emission monitoring of sawing process: Artificial intelligence approach for optimal sensory feature selection. Int. J. Adv. Manuf. Technol. 2019, 102, 4179–4197. [Google Scholar] [CrossRef]
  27. Nasir, V.; Cool, J. Intelligent wood machining monitoring using vibration signals combined with self-organizing maps for automatic feature selection. Int. J. Adv. Manuf. Technol. 2020, 108, 1811–1825. [Google Scholar] [CrossRef]
  28. Nasir, V.; Dibaji, S.; Alaswad, K.; Cool, J. Tool wear monitoring by ensemble learning and sensor fusion using power, sound, vibration, and AE signals. Manuf. Lett. 2021, 30, 32–38. [Google Scholar] [CrossRef]
  29. Nasir, V.; Kooshkbaghi, M.; Cool, J.; Sassani, F. Cutting tool temperature monitoring in circular sawing: Measurement and multi-sensor feature fusion-based prediction. Int. J. Adv. Manuf. Technol. 2021, 112, 2413–2424. [Google Scholar] [CrossRef]
  30. Stanojevic, D.; Mandic, M.; Danon, G.; Svrzic, S. Prediction of the surface roughness of wood for machining. J. For. Res. 2017, 28, 1281–1283. [Google Scholar] [CrossRef]
  31. Ahmed, M.; Kamal, K.; Ratlamwala, T.A.H.; Hussain, G.; Alqahtani, M.; Alkahtani, M.; Alatefi, M.; Alzabidi, A. Tool Health Monitoring of a Milling Process Using Acoustic Emissions and a ResNet Deep Learning Model. Sensors 2023, 23, 3084. [Google Scholar] [CrossRef]
  32. Jegorowa, A.; Górski, J.; Kurek, J.; Kruk, M. Initial study on the use of support vector machine (SVM) in tool condition monitoring in chipboard drilling. Eur. J. Wood Prod. 2019, 77, 957–959. [Google Scholar] [CrossRef]
  33. Nasir, V.; Cool, J. A review on wood machining: Characterization, optimization, and monitoring of the sawing process. Wood Mater. Sci. Eng. 2020, 15, 1–16. [Google Scholar] [CrossRef]
  34. Nasir, V.; Sassani, F. A review on deep learning in machining and tool monitoring: Methods, opportunities, and challenges. Int. J. Adv. Manuf. Technol. 2021, 115, 2683–2709. [Google Scholar] [CrossRef]
  35. Budău, G.; Ispas, M. Woodworking Machine-Tools; Lux Libris Publishing House: Brasov, Romania, 2014. (In Romanian) [Google Scholar]
  36. Watanabe, K.; Korai, H.; Matsushita, Y.; Hayashi, T. Predicting internal bond strength of particleboard under outdoor exposure based on climate data: Comparison of multiple linear regression and artificial neural network. J. Wood Sci. 2015, 61, 151–158. [Google Scholar] [CrossRef]
  37. Fahlman, S.E.; Lebiere, C. The Cascade-Correlation Learning Architecture; Technical Report CMU-CS-90-100; School of Computer Science, Carnegie Mellon University: Pittsburgh, PA, USA, 1990. [Google Scholar]
  38. Avramidis, S.; Iliadis, L. Predicting wood thermal conductivity using artificial neural networks. Wood Fiber Sci. 2005, 37, 682–690. [Google Scholar]
  39. Monticeli, F.M.; Neves, R.M.; Ornaghi, H.L.; Almeida, J.H.S. Prediction of Bending Properties for 3D-Printed Carbon Fibre/Epoxy Composites with Several Processing Parameters Using ANN and Statistical Methods. Polymers 2022, 14, 3668. [Google Scholar] [CrossRef]
  40. Dubdub, I. Artificial Neural Network Study on the Pyrolysis of Polypropylene with a Sensitivity Analysis. Polymers 2023, 15, 494. [Google Scholar] [CrossRef]
  41. Myers, R.H.; Montgomery, D.C.; Anderson-Cook, C.M. Response Surface Methodology: Process and Product Optimization Using Designed Experiments; Wiley Series in Probability and Statistics; Wiley: Hoboken, NJ, USA, 2016; pp. 6–262. [Google Scholar]
  42. NIST/SEMATECH. e-Handbook of Statistical Methods. Available online: http://www.itl.nist.gov/div898/handbook/ (accessed on 18 October 2023).
  43. Podziewski, P.; Szymanowski, K.; Górski, J.; Czarniak, P. Relative machinability of wood-based boards in the case of drilling Experimental study. BioResources 2018, 13, 1761–1772. [Google Scholar] [CrossRef]
  44. Valarmathi, T.N.; Palanikumar, K.; Sekar, S. Modeling of thrust force in drilling of plain medium density fiberboard (MDF) composite panels using RSM. Procedia Eng. 2012, 38, 1828–1835. [Google Scholar] [CrossRef]
  45. Kumar, K.; Davim, J.P. Biodegradable Composites: Materials, Manufacturing and Engineering; De Gruyter: Berlin, Germany; Boston, MA, USA, 2019; pp. 167–182. [Google Scholar] [CrossRef]
Figure 1. The drill bits used for drilling of MDF boards: (a) flat drills; (b) helical drills.
Forests 14 02254 g001
Figure 2. MDF samples used for drilling experiments: (a) shape and dimensions; (b) processed sample; and (c) the approach used to measure the diameters in order to calculate the delamination factor.
Forests 14 02254 g002
Figure 3. The machine tool and the measuring device: (a) ISEL GFV/GFY CNC processing centre; (b) the forces measuring device.
Forests 14 02254 g003
Figure 4. The equipment used for the measurements (left) and the connection diagram (right).
Forests 14 02254 g004
Figure 5. Graphical interface of the DAQ software v. 1.5.5.0.
Forests 14 02254 g005
Figure 6. Variation in the active power PT (blue line) and the thrust force FT (pink line).
Forests 14 02254 g006
Figure 7. The representation of a face central composite design and the analyzed combinations among factors (−1 is the low level of factor; +1 is the high level of factor; 0—is the middle value of factor; and ±α is the axial or star points).
Forests 14 02254 g007
Figure 8. The architecture of ANN models, which were designed to predict the delamination factor at the inlet (Y1); delamination factor at the outlet (Y2); thrust force (Y3); and drilling torque (Y4).
Forests 14 02254 g008
Figure 9. A comparison between the predicted and experimental responses: (a) delamination factor at the inlet; (b) delamination factor at the outlet; (c) thrust force; and (d) drilling torque.
Forests 14 02254 g009
Figure 10. The influence of the drill tip angle and tooth bite on the delamination factor at the inlet: flat drill (a) and helical drill (b).
Forests 14 02254 g010
Figure 11. The influence of the drill tip angle and tooth bite on the delamination factor at the outlet: flat drill (a) and helical drill (b).
Forests 14 02254 g011
Figure 12. The influence of the drill tip angle and tooth bite on the thrust force: flat drill (a) and helical drill (b).
Forests 14 02254 g012
Figure 13. The influence of the drill tip angle and tooth bite on the drilling torque: flat drill (a) and helical drill (b).
Forests 14 02254 g013
Table 1. The analyzed independent variables.
Independent VariableAnalyzed Values
Drill point angle (X1), °306090120
Tooth bite (X2), mm0.10.30.50.7
Drill type (X3)FlatHelical
Table 2. The analyzed level of each factor that was considered in the study.
Numeric FactorLevel
−α *−10+1+α *
Drill tip angle (X1), °303075120120
Tooth bite (X2), mm0.10.10.40.70.7
Categoric FactorLevel 1Level 2
Drill type (X3)Flat (−1)Helical (+1)
* axial points.
Table 3. The experimental plan that was used for the optimization study.
Combination #Independent Variables (Factors)Dependent Variables (Responses)
Drill Tip Angle (X1), °Tooth Bite (X2), mmDrill Type (X3)Y1Y2Y3Y4
130 (−1)0.1 (−1)Flat (−1)1.071.13115.340.55
275 (0)0.4 (0)Flat (−1)1.101.25252.070.89
3120 (+α)0.4 (0)Flat (−1)1.111.44272.690.60
4120 (+α)0.4 (0)Helical (1)1.001.0368.530.33
575 (0)0.4 (0)Helical (1)1.001.0076.850.53
6120 (1)0.7 (1)Helical (1)1.181.03102.670.41
775 (0)0.4 (0)Helical (1)1.001.0076.850.53
8120 (1)0.1 (−1)Helical (1)1.001.0364.230.16
975 (0)0.4 (0)Helical (1)1.001.0076.850.53
1075 (0)0.7 (+α)Flat (−1)1.121.25366.901.52
1175 (0)0.4 (0)Flat (−1)1.101.25252.070.89
1275 (0)0.4 (0)Helical (1)1.001.0076.850.53
1330 (−1)0.7 (1)Helical (1)1.101.0049.871.17
1475 (0)0.1 (−α)Helical (1)1.001.0072.190.24
1575 (0)0.4 (0)Flat (−1)1.101.25252.070.89
1630 (−1)0.7 (1)Flat (−1)1.061.13372.291.74
1775 (0)0.1 (−α)Flat (−1)1.081.25138.160.36
1830 (−α)0.4 (0)Flat (−1)1.091.13305.671.28
1975 (0)0.7 (+α)Helical (1)1.001.0075.380.73
2075 (0)0.4 (0)Flat (−1)1.101.25252.070.89
2175 (0)0.4 (0)Flat (−1)1.101.25252.070.89
2230 (−α)0.4 (0)Helical (1)1.001.0033.460.77
23120 (1)0.1 (−1)Flat (−1)1.081.44137.270.23
24120 (1)0.7 (1)Flat (−1)1.131.44334.780.74
2530 (−1)0.1 (−1)Helical (1)1.001.0028.890.35
2675 (0)0.4 (0)Helical (1)1.001.0076.850.53
Table 4. Criteria for different factors and responses in optimization of MDF drilling.
Independent VariablesGoal SettingsMinimum
Value
Maximum ValueLevel of Factor Importance
Drill tip angle (X1)In range301203
Tooth bite (X2)0.10.73
Drill type (X3)FlatHelical3
Dependent Variables
Delamination factor at the inlet (Y1)Minimize11.183
Delamination factor at the outlet (Y2)11.433
Thrust force (Y3)28.88372.283
Drilling torque (Y4)0.151.733
Table 5. The performance criteria of selected ANN topology in the case of MDF drilling.
Model OutputNumber of Neurons in the Layers of ANN ModelsCoefficient of Correlation (R)Coefficient of Determination (R2)
InputHiddenOutletTrainingTestingValidationTrainingTestingValidation
Delamination factor at the inlet3610.860.890.920.730.790.85
Delamination factor at the outlet3910.850.880.880.720.770.78
Thrust force31010.990.980.990.980.960.98
Drilling torque31110.980.980.980.960.960.97
Table 6. The performance criteria of selected ANN topology in the case of particle boards (PB) drilling [14].
Model OutputNumber of Neurons in the Layers of ANN ModelsCoefficient of Correlation (R)Coefficient of Determination (R2)
InputHiddenOutletTrainingTestingValidationTrainingTestingValidation
Delamination factor at the inlet31310.760.720.670.570.510.44
Delamination factor at the outlet3610.880.880.900.770.770.82
Thrust force3410.940.950.960.880.900.92
Drilling torque3910.970.970.980.940.940.97
Table 7. ANOVA results regarding the delamination factor at inlet.
SourceSum of SquaresdfMean SquareF-Valuep-Value
Prob > F
Observation
Model0.067110.0061147.680.0003Significant
Drill tip angle (X1)0.026810.0026833.370.087Not significant
Tooth bite (X2)0.01110.01113.680.0024Significant
Drill type (X3)0.03810.03847.87<0.0001Significant
X1X20.0025910.002593.250.0928Not significant
X1X30.000031210.00003120.0390.8457Not significant
X2X30.00378910.0037894.760.0467Significant
X120.000944610.00094461.190.2943Not significant
X220.0007910.00079090.990.3357Not significant
X1X2X30.0000227410.000022740.0290.8682Not significant
X12X30.00251310.0025133.160.0973Not significant
X22 X30.00272510.0027253.420.0854Not significant
R20.85
Table 8. ANOVA results regarding the delamination factor at outlet.
SourceSum of SquaresdfMean SquareF-Valuep-Value
Prob > F
Observation
Model0.5980.0732409.57<0.0001Significant
Drill tip angle (X1)0.08410.0842757.18<0.0001Significant
Tooth bite (X2)01001Not significant
Drill type (X3)0.4410.4414587.86<0.0001Significant
X1X201001Not significant
X1X30.05510.0551826.64<0.0001Significant
X2X301001Not significant
X120.002710.002789.64<0.0001Significant
X2201001Not significant
R20.99
Table 9. ANOVA results regarding the trust force.
SourceSum of SquaresdfMean SquareF-Valuep-Value
Prob > F
Observation
Model311,0001128271171.78<0.0001Significant
Drill tip angle (X1)464.2781464.282.820.1152Not significant
Tooth bite (X2)46,351.60146,351.61281.66<0.0001Significant
Drill type (X3)98,114.63198,114.63596.19<0.0001Significant
X1X2220.321220.321.340.2666Not significant
X1X32458.8512458.8514.940.0017Significant
X2X332,092.03132,092.03195.007<0.0001Significant
X1253.67153.670.3260.5777Not significant
X22557.861557.863.390.086Not significant
X1X2X3739.121739.124.490.0524Not significant
X12X31454.2811454.288.840.0101Significant
X22X31005.8011005.806.110.0269Significant
R20.99
Table 10. ANOVA results regarding the drilling torque.
SourceSum of SquaresdfMean SquareF-Valuep-Value
Prob > F
Observation
Model3.78660.63166.44<0.0001Significant
Drill tip angle (X1)0.95710.957252.48<0.0001Significant
Tooth bite (X2)1.62511.625428.79<0.0001Significant
Drill type (X3)0.83510.835220.36<0.0001Significant
X1X20.1910.1951.35<0.0001Significant
X1X30.03210.0328.460.0090Significant
X2X30.1410.1437.24<0.0001Significant
R20.98
Table 11. The optimum combination of factors during drilling of MDF boards.
Solution No.X1X2X3Delamination Factor at the InletDelamination Factor at the OutletTrust Force (N)Drilling Torque (Nm)D
Y 1 ^ Y1ER1 Y 2 ^ Y2ER2 Y 3 ^ Y3ER3 Y 4 ^ Y4ER4
1640.1Helical0.9801 a2.000.9951 a0.5063.1462.09 a−1.70.2810.33 a0.330.95
2890.1Helical0.9791 b2.101.0041 b−0.4071.1462.7 b−13.50.2400.21 b0.210.95
3300.1Flat1.071.03−3.881.1291.130.09127.86121.23−5.50.5830.510.510.680
4580.1Flat1.081.06 a−1.891.201.16 a−3.45120.80127.62 a5.40.4700.44 a0.440.643
a—drill tip angle was considered equal to 60°; b—drill tip angle was considered equal to 90°.
Disclaimer/Publisher’s Note: The statements, opinions and data contained in all publications are solely those of the individual author(s) and contributor(s) and not of MDPI and/or the editor(s). MDPI and/or the editor(s) disclaim responsibility for any injury to people or property resulting from any ideas, methods, instructions or products referred to in the content.

