Article

Response of a Sylvan Moss Species (Didymodon validus Limpr.) with a Narrow Distribution Range to Climate Change

Key Laboratory of Vegetation Ecology, Ministry of Education, School of Life Sciences, Northeast Normal University, Changchun 130024, China
*
Authors to whom correspondence should be addressed.
Forests 2023, 14(11), 2227; https://doi.org/10.3390/f14112227
Submission received: 17 October 2023 / Revised: 6 November 2023 / Accepted: 9 November 2023 / Published: 11 November 2023
(This article belongs to the Section Forest Meteorology and Climate Change)

Abstract

:
Mosses are particularly susceptible to climate change owing to their close biological and ecological associations with climatic conditions. However, there is a limited understanding of the changes in distribution patterns of the moss species in forest ecosystems under climate change, especially in mosses with narrow ranges. Therefore, we reconstructed historical, simulated present, and predicted future potential distribution patterns of Didymodon validus, a narrow-range moss species in the forest ecosystem, using the MaxEnt model. The aim of this study was to explore its unique suitable habitat preference, the key environmental factors affecting its distribution, and the distributional changes of D. validus under climate change at a long spatial-time scale. Our findings indicate that the most suitable locations for D. validus are situated in high-altitude regions of southwestern China. Elevation and mean temperature in the wettest quarter were identified as key factors influencing D. validus distribution patterns. Our predictions showed that despite the dramatic climatic and spatial changes over a long period of time, the range of D. validus was not radically altered. From the Last Interglacial (LIG) to the future, the area of the highly suitable habitat of D. validus accounted for only 15.3%–16.4% of the total area, and there were weak dynamic differences in D. validus at different climate stages. Under the same climate scenarios, the area loss of suitable habitat is mainly concentrated in the northern and eastern parts of the current habitat, while it may increase in the southern and eastern margins. In future climate scenarios, the distribution core zone of suitable habitat will shift to the southwest for a short distance. Even under the conditions of future climate warming, this species may still exist both in the arid and humid regions of the QTP in China. In summary, D. validus showed cold and drought resistance. Our study provides important insights and support for understanding the impact of climate change on the distribution of D. validus, as well as its future distribution and protection strategies.

1. Introduction

Bryophytes, including mosses, liverworts, and hornworts, are a group of non-vascular plants that encompass over 20,000 recorded species worldwide. They inhabit diverse terrestrial habitats, ranging from tropical to polar regions and the sub-Antarctic [1,2]. Several studies have demonstrated the significant role of mosses in carbon and nutrient cycling processes [3,4], permafrost stability [4], water retention, pedogenesis [5], colonization by higher plants [6], and ecological restoration efforts [7]. Furthermore, due to their unistratose leaves and lack of well-developed cuticles, bryophytes have no resistance to ion exchange; thus, they are highly sensitive to changes in the surrounding environment [5]. Furthermore, bryophytes are more exposed to the effects of climate than vascular plants because their physiology is strongly linked to climatic factors, such as temperature and precipitation [8]. For example, it has been reported that bryophytes will increase, migrate, or become extinct due to climate change [9,10,11]. However, a limited number of studies have explored the response of key bryophyte taxa to climate change.
Didymodon is one of the largest genera in the Pottiaceae family, including about 140 species distributed worldwide, and it occurs in temperate areas, especially mountainous and drought-prone regions [12,13,14,15,16]. It has been reported that Didymodon species are the primary components of biological soil crusts in arid and semi-arid areas, with important ecological functions [17,18]. Furthermore, due to a strong sensitivity to climate change, Didymodon is recommended as a climate indicator [13,16]. Although Didymodon species generally have strong adaptability to extreme climate and environmental conditions, some individual species often face more survival challenges due to their unique habitats and adaptions.
Didymodon validus Limpr. is a sylvan moss species with a relatively narrow distribution range. It was described as a new species by Limpricht (1888) and has been reported to be distributed intermittently in Europe (Austria, Germany, Italy, Switzerland, Slovakia), Central (Kirghizstan) and Southwest Asia, the Arabian Peninsula, and Ethiopia (Tigray province) [19,20]. However, this species has been known in China for a relatively short time. Shuayib et al. (2017) first found D. validus on the Tomur Peak and the Altun Mountains in Xinjiang, China. Subsequently, D. validus samples were collected in forest regions in Yunnan and Xizang through our fieldwork. A previous study showed that climate change greatly affects the distribution of narrow-range species, which may be at risk of extinction [21]. However, there has been a lack of study on the distribution pattern, origin, and shifts of D. validus as climate change in different timelines.
The species distribution models (SDMs), also called ecological or environmental niche models, have a pivotal function in quantifying species–habitat relationships and projecting species distributions in ecological research, conservation, and environmental management [22,23,24]. Typical SDMs include MaxEnt, GARP, ENFA, and Bioclim [22,24,25,26]. Due to the advantages of high accuracy, simple operation, and the small size of the sample, MaxEnt has proven to be a top-performing algorithm in comparison to other methods [22,23,27,28]. The MaxEnt model has been widely applied to simulate the geographical distribution of specified species in the past [29], current [30], and future [24], which have also been utilized to predict the geographical distribution, including didymodon on regional scals [13,16,31]. However, no broad-scale studies have predicted the distribution patterns of Didymodon at the species level.
Under these circumstances, we utilized the MaxEnt model to simulate the distribution pattern of D. validus across China under different climatic scenarios. The objectives of this study include (1) revealing its unique suitable habitat preference for D. validus, (2) determining the relationship between the distribution of D. validus and climatic and topographic factors, and (3) exploring the geographical distribution changes of D. validus under different climatic conditions at a large spatial-time scale (from LIG to 2070). This study will enable the ongoing conservation of bryophytes and their habitats.

2. Materials and Methods

2.1. Species Traits

Because of previous confusion over the taxonomy and distribution of D. validus [32], we only considered data from within China in the present study. During our continuous investigation of xerophytic moss, particularly Didymodon Hedw., in different provinces in China, some D. validus specimens were collected in Tibet and Yunnan. Microscopic examinations and measurements were taken with a ZEISS Primo Star light microscope (ZEISS, Oberkochen, Germany). Morphological observations were obtained with a Canon EOS 70D camera (Minato Ward, Tokyo, Japan) mounted on a microscope. Specimens were examined in 2% KOH [33].

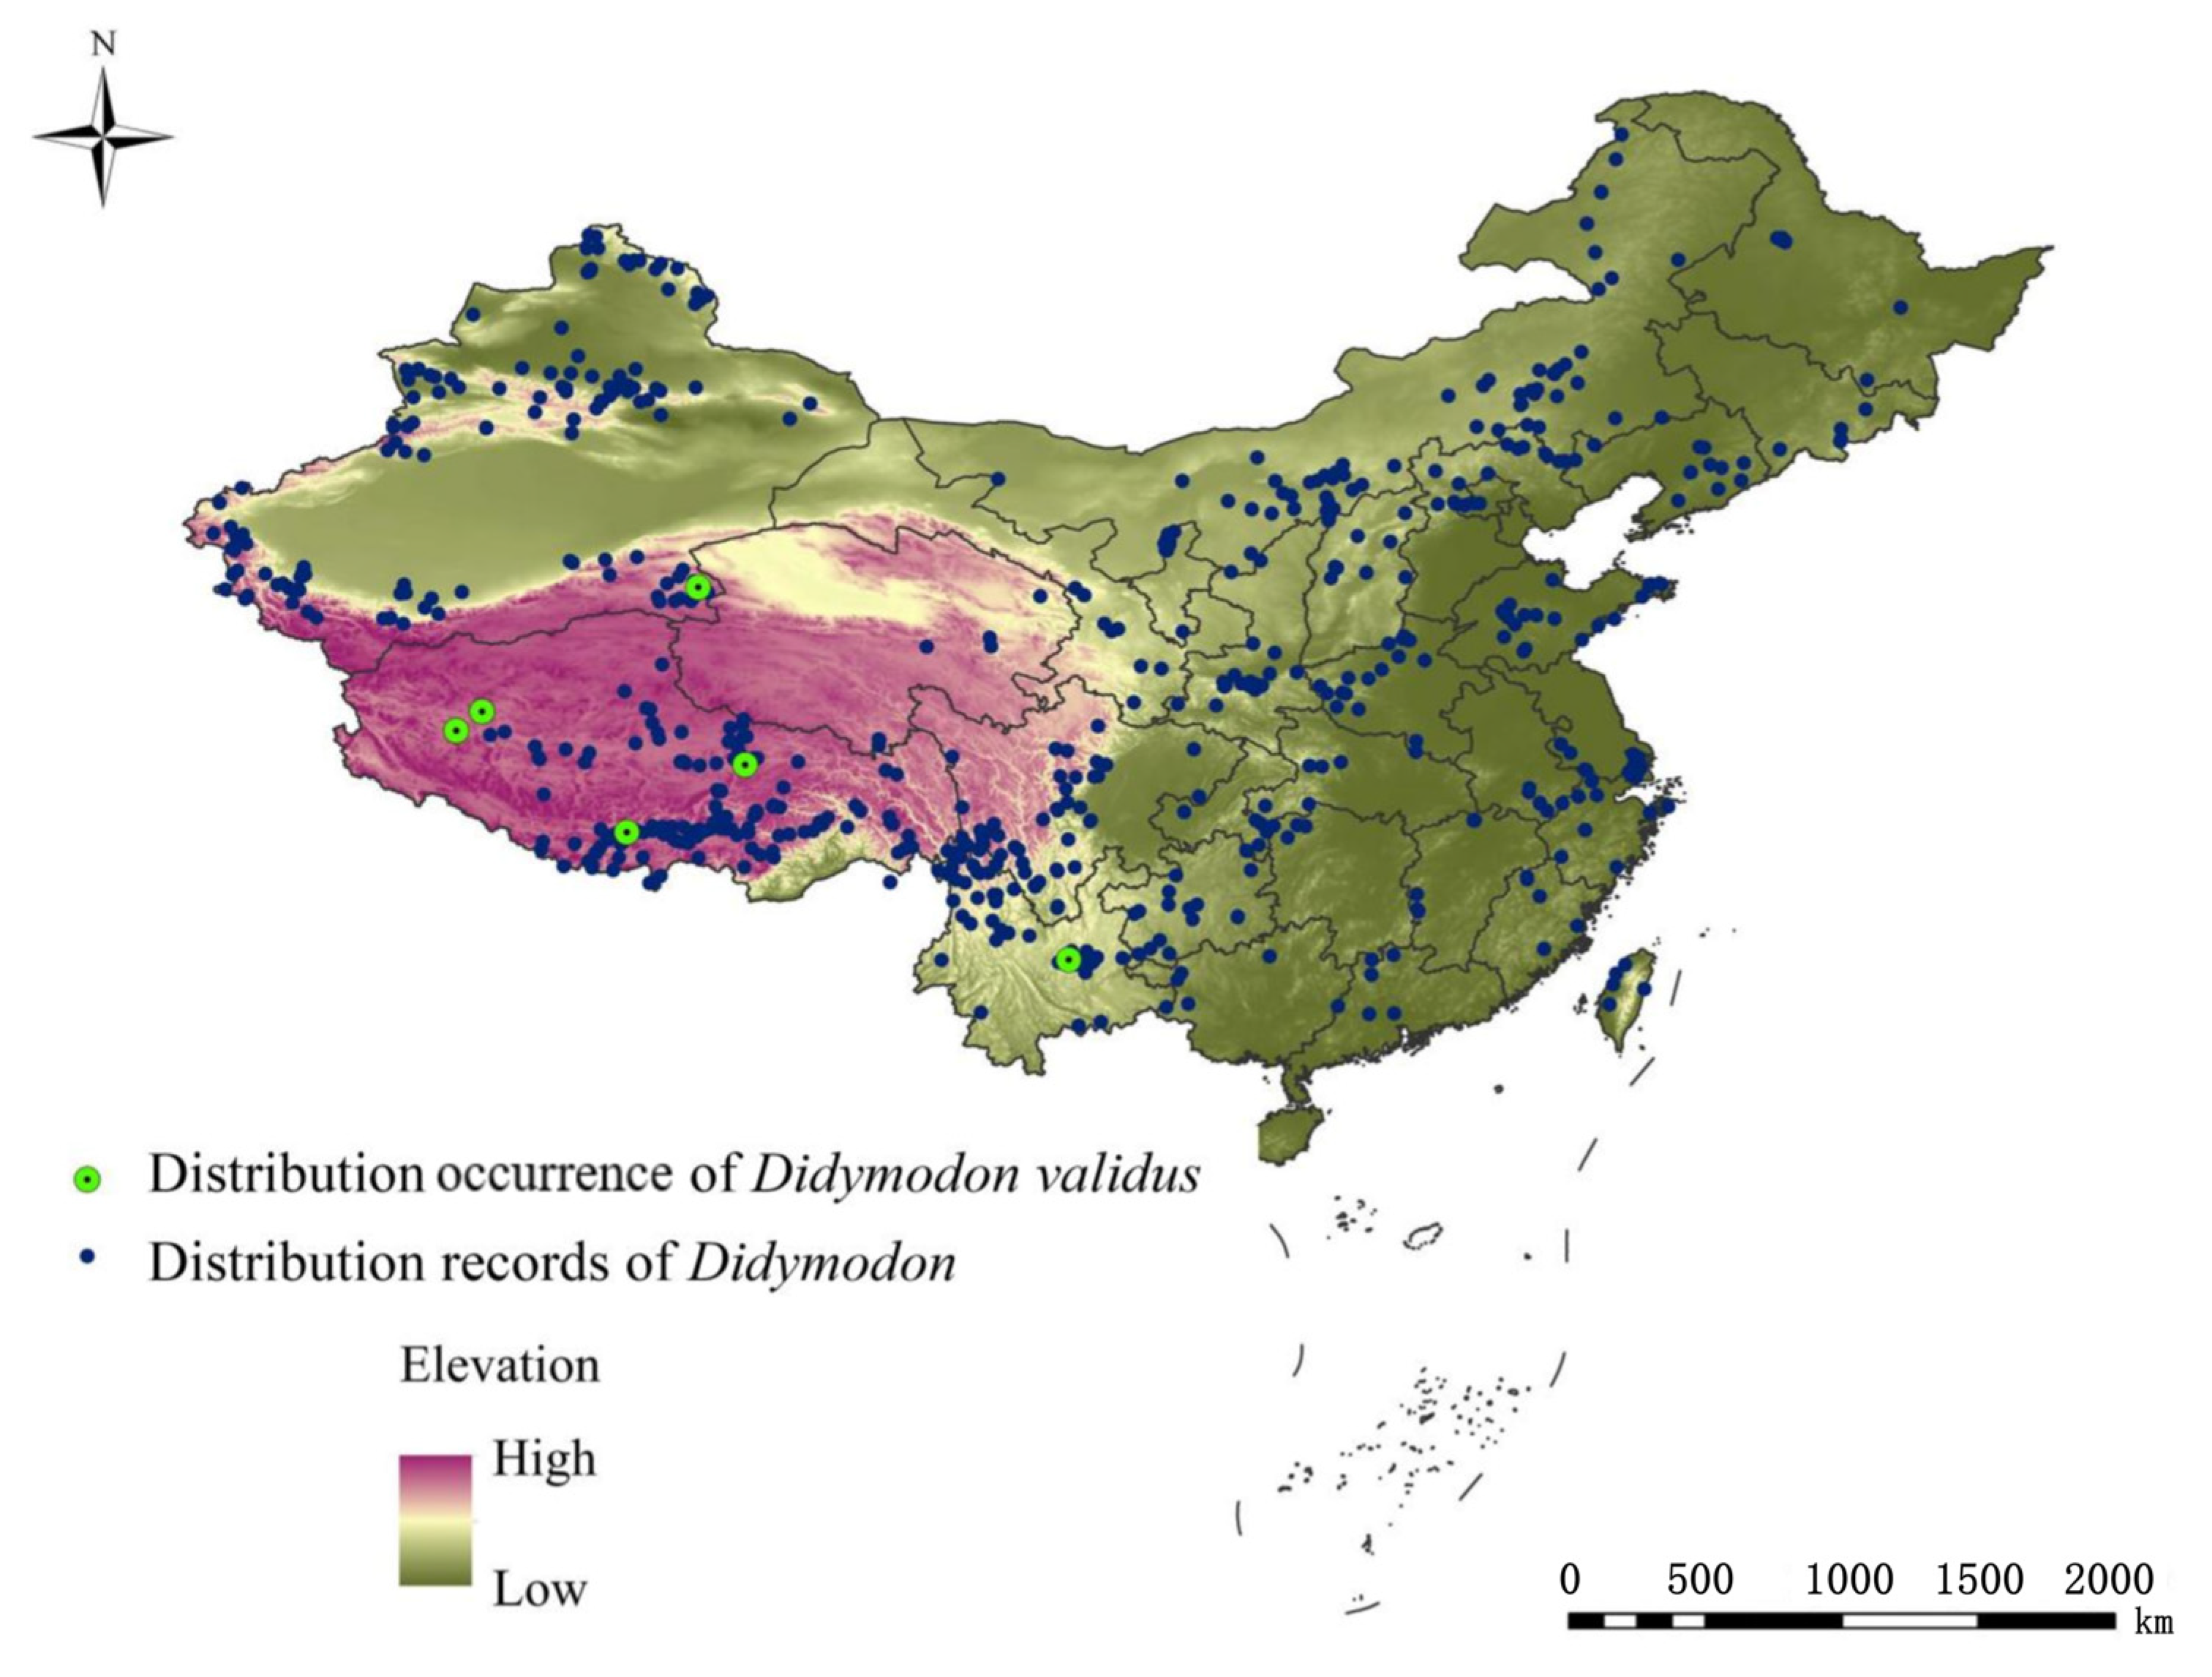
2.2. Study Area and Species Occurrence

We obtained occurrence data for D. validus from field investigations, documented literature, and checked herbarium information. The specific field investigation can be found in our previous study [15,16,33,34]. Recently, D. validus was collected and identified by us and other domestic researchers in the process of studying the genus Didymodon. Data and systematic survey results across China [13,16,31,35,36,37] indicate that its distribution range is limited to Xizang, Shilin, Yunnan, Tomur Peak in Tianshan, and Altun Mountain, Xinjiang. The environments in these areas were generally characterized by high altitude, strong solar radiation, low annual temperature variance, and high daily temperature variance [13,38,39]. Based on accurate species identification and distribution records, 8 distribution points of D. validus were used in our analysis (Figure 1). The national fundamental geographic data were provided by the National Geomatics Center of China (http://www.cehui8.com/3S/GIS/20130702/205.html (accessed on 5 November 2020)).

2.3. Environmental Variables and Climate Change Scenarios

Considering the importance of climatic and topographic data in determining past, present, and future distribution of D. validus in China, we used climatic data downloaded from the WorldClim database (http://www.worldclim.org/ (accessed on 5 June 2020)) from three paleoclimate datasets: Last Interglacial period (LIG, about 120–140 ka, a warm and humid climate), Last Glacial Maximum (LGM, about 22 ka, the climate became colder and drier), and Mid Holocene (MH, about 6 ka, the climate warmed up) in the Community Climate System Model four (CCSM4) global climate model; one present dataset: the Current (1970–2000); four Representative Concentration Pathways (RCPs) climate change data, where 2050 and 2070 use average emissions for the years 2041 to 2060 and 2061 to 2080, respectively. We used combinations of RCP 2.6–2050, RCP 2.6–2070, RCP 8.5–2050, and RCP 8.5–2070 with CCSM4 to simulate global climate responses to increased greenhouse gas emissions [40,41]. For the topographic variables, digital elevation model data were obtained from the USGS GTOPO 30 series (https://www1.gsi.go.jp/geowww/globalmap-gsi/gtopo30/gtopo30.html (accessed on 5 June 2020)) and then used to derive the aspect and slope data using ArcGIS 10.5 (Esri, Redlands, CA, USA). The climate data were used to run the model-covered areas in China. All environmental layers were resampled to a 2.5 min resolution in ArcGIS 10.5. To deal with collinearity, we performed variance inflation factors (VIFs) and Pearson correlation analyses. As a result, six bioclimatic variables (Bio2 (mean diurnal range), Bio8 (mean temperature of wettest quarter), Bio9 (mean temperature of driest quarter), Bio13 (precipitation of wettest month), Bio15 (precipitation seasonality), Bio19 (precipitation of coldest quarter)), and three topographic variables (elevation, slope, and aspect) were selected.

2.4. Distribution Modeling

The MaxEnt model (version 3.4.1, http://biodiversityinformatics.amnh.org/open_source/maxent/ (accessed on 14 July 2020)) was used to predict the probability of the distribution of D. validus across China [42]. A total of 80% of the occurrence data were used for model training and 20% for model testing to estimate the model’s capacity. The recommended default values were used for the convergence threshold (10−5), with the maximum iterations (500) and the maximum number of background points (10,000) using the recommended default parameters (i.e., regularization multiplier = 1). The selection of environmental variables and functions was carried out automatically under the default rules, and 10 random partitions were created in the occurrence data [43]. Furthermore, the jackknife approaches and response curves were plotted to demonstrate how the variables affected the potential species distribution [44]. We reclassified potentially suitable habitats into four categories: high (0.6–1), moderate (0.4–0.6), low (0.2–0.4), and none (0–0.2) [45]. We projected the fitted models onto past, current, and future climate conditions. All binary distribution projections were stacked from the different climate conditions to explore central tendencies in projections, and we selected overlapping areas among projections as a future distribution range [46]. The range change and core zone shifts were predicted by comparing the binary outputs in different periods above using a Python-based GIS toolkit SDM toolbox [47].

2.5. Model Evaluation

To further evaluate the performance of the modeling algorithms, the area under the curve (AUC) and the true skill statistic (TSS) were used [48,49]. The value of the AUC ranges between 0.5 and 1, with >0.9 representing excellent predictive performance of the model, 0.7–0.9 indicating moderately useful models, and 0.5 representing randomness [50,51]. The TSS ranges from −1 to 1, where −1 indicates a perfect inverse prediction, 1 indicates perfect performance, and 0 indicates randomness [48]. The threshold was set to the value at which the TSS was maximized (TSSmax). The R package Biomod2 was applied to conduct the TSS assessment [52]. Both the final values of AUC and TSS were produced by an average of 10 replicates.

3. Results

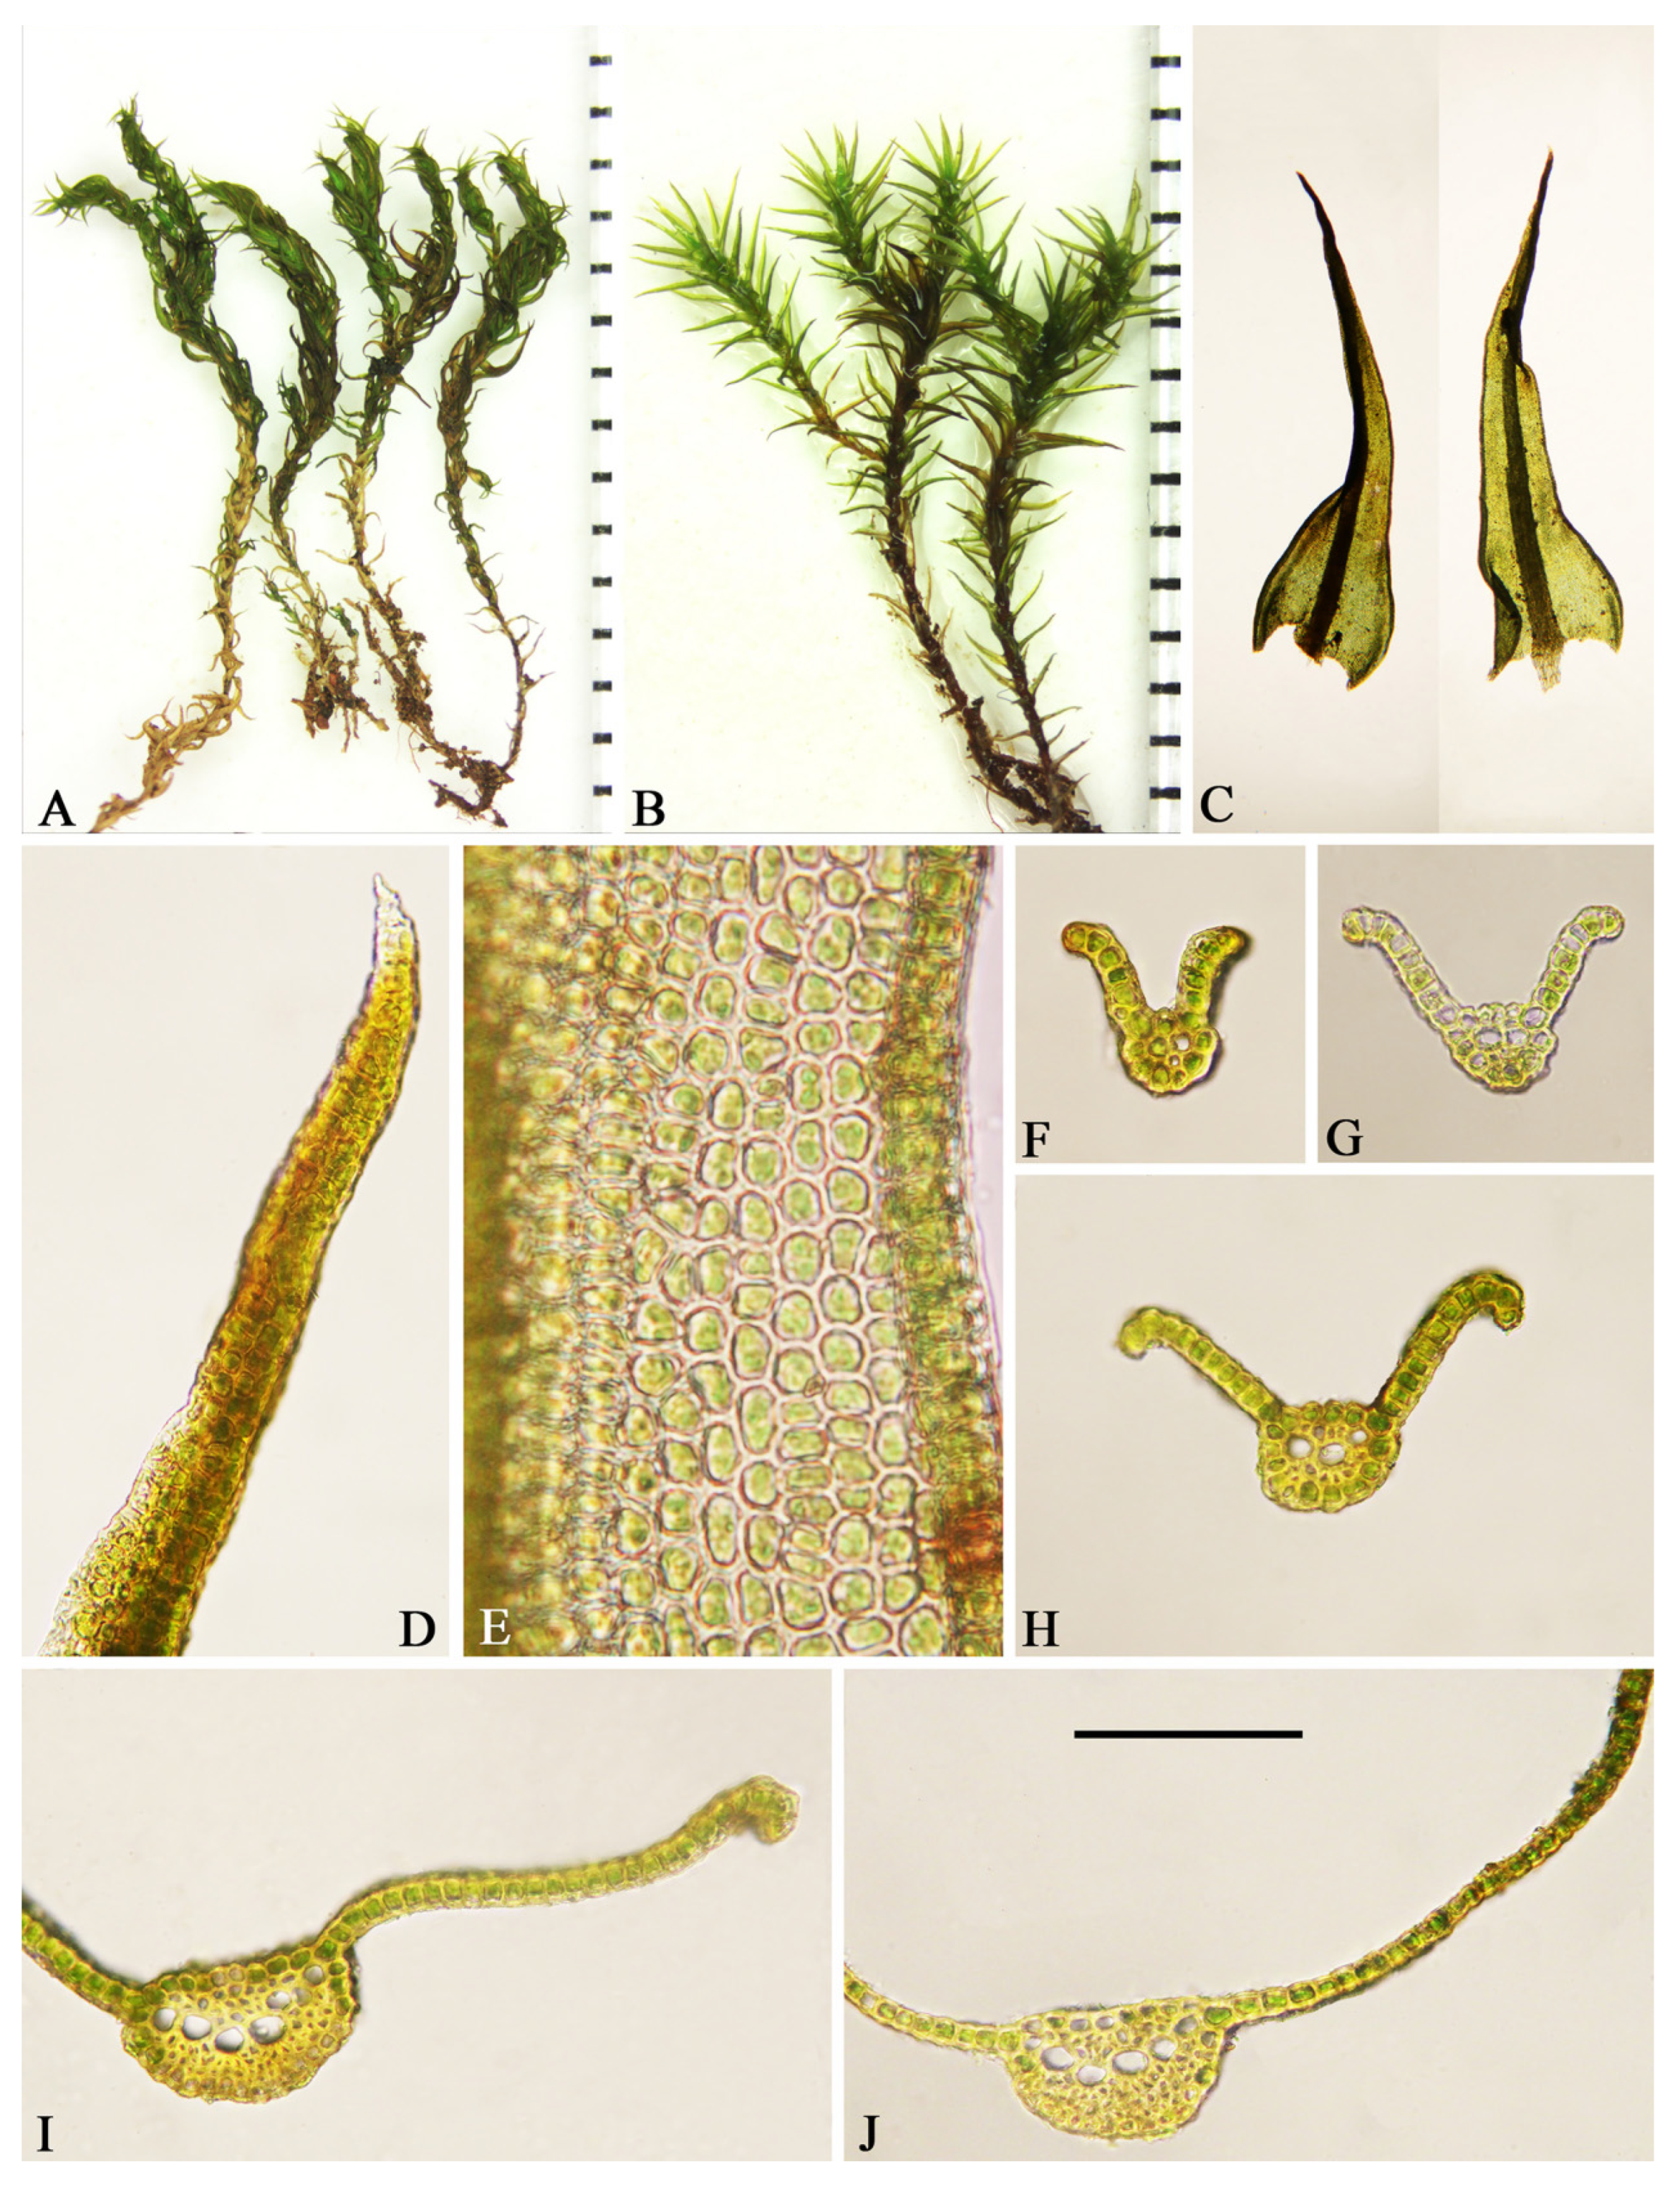
3.1. Morphological Characteristics

Plants, medium-sized, growing in dense turfs, brown below, green above. Stems, 1.5–2.1 cm high, erect to ascending, usually branched, weakly radiculose at base, in transverse section, rounded, hyalodermis absent, central strand differentiated, and sclerodermis present. Axillary hairs, filiform, long, usually 5–8 cells long, with one brown basal cell and hyaline upper ones. Rhizoidal tubers are absent. Leaves, twisted and incurved when dry, spreading when moist, 2–3 × 0.65–0.75 mm, channeled ventrally in the upper part, sheathing. Lamina is completely unistratose and yellow with KOH. Apex acuminate, not apiculate, not cucullate. Margins entire, recurved from base to 2/3 to 3/4 of the leaf, unistratose. Costa, 95–162.5 µm wide at the base, long-excurrent, and not spurred. Ventral cells of the costa in the upper middle part of the leaf quadrate or subquadrate, smooth or with low papillose. Dorsal cells of the costa in the upper middle part of the leaf quadrate or subquadrate, smooth. Transverse section semicircular to elliptic, with 4–7 guide cells in one layer below midleaf, 1–3 layers of ventral stereids, and 2–4 layers of dorsal stereids, without hydroids. Ventral surface cells are differentiated, not bulging, and smooth. Dorsal surface cells are differentiated and smooth. Upper and middle laminal cells subquadrate or oblate, 7–9.5 × 7.75–9.75 µm, smooth and thick-walled. Basal cells are not differentiated, smooth, basal juxtacostal cells short-rectangular to rectangular, 20–37.5 × 8.75–13.75 µm. Basal marginal cells oblate or quadrate, 5.25–8.75 × 7.5–12.75 µm. Gemmae are absent. Sporophytes are unknown. The morphological characteristics are shown in Figure 2.

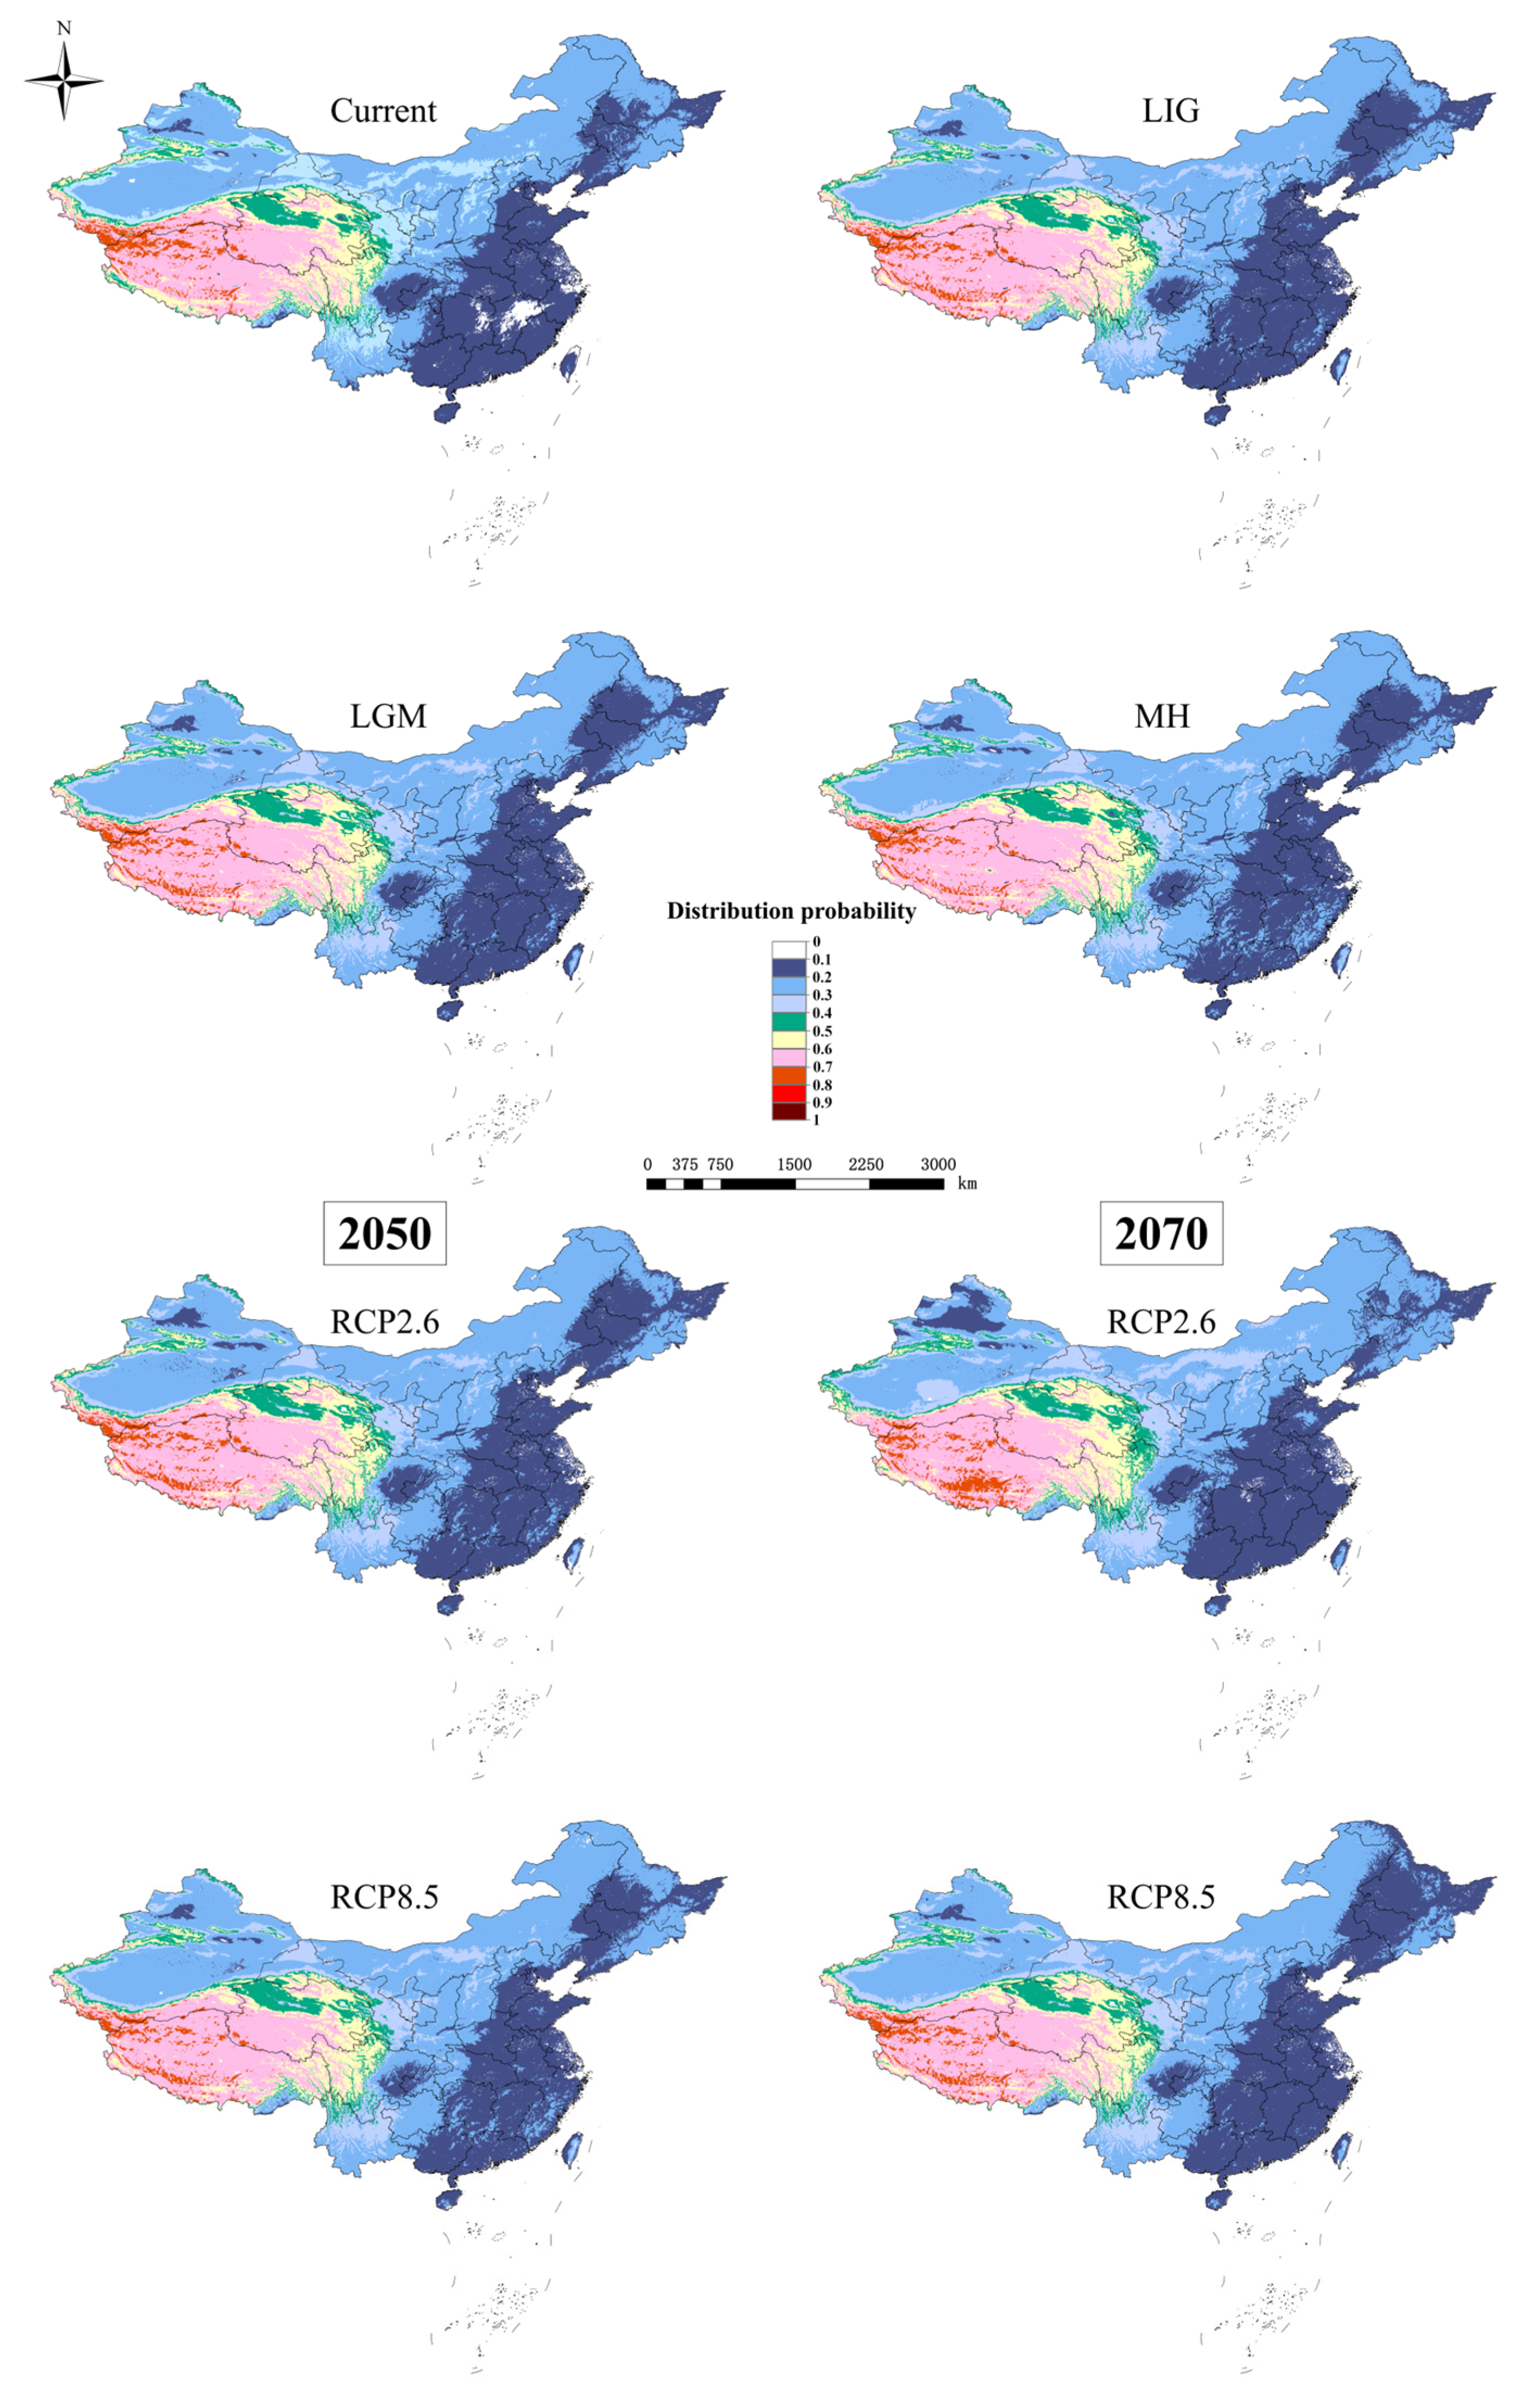
3.2. Potential Distribution Pattern of D. validus

Models for D. validus with a cross-validation AUC of 0.751 and a TSS value of 0.526 indicated that the model results (Figure 3) could be considered satisfactory for predicting potential suitable habitats for D. validus. The potential distribution pattern of D. validus is primarily located in Tibet, southern and central Xinjiang, southern and northern Qinghai, northwestern Sichuan, southwestern Gansu, and a small part of northwestern Yunnan. Among those, the most suitable areas (distribution probability over 0.6) are concentrated in the Qinghai–Tibet Plateau (QTP) and adjacent areas of southwestern China, especially in the high mountain area of 4000–6000 m, with a distribution probability greater than 0.7. In general, these areas with a high probability of distribution were relatively small and severely fragmented.
The proportions of areas within the four suitability classes of the potential distributions of D. validus in China are shown in Figure 4. For the different climate conditions, the area of the highly suitable habitat of D. validus accounted for only 15.3%–16.4% of the total area, indicating that the distribution of this species in China may be relatively narrow. In addition, there were weak dynamic differences in D. validus at different climate stages. In the historical climate period, we found that the proportion of highly suitable D. validus area in China was at a small increase stage and reached the highest value of 16.4% in the MH, which was reconstructed by the prediction model. In the current climate period, the highly suitable area of D. validus began to shrink, and the proportion of the highly suitable area reached its lowest value of 15.3% throughout the predicted climate period. Compared to the present distribution, the highly suitable habitat distribution range of the species was predicted to expand slightly in the future (2050s and 2070s), with the increase in suitable habitats in the RCP8.5 climate scenario being less than that in RCP2.6. In general, the potential distribution area of D. validus in China fluctuated little with climate change, and it had a relatively stable distribution and reproduction.

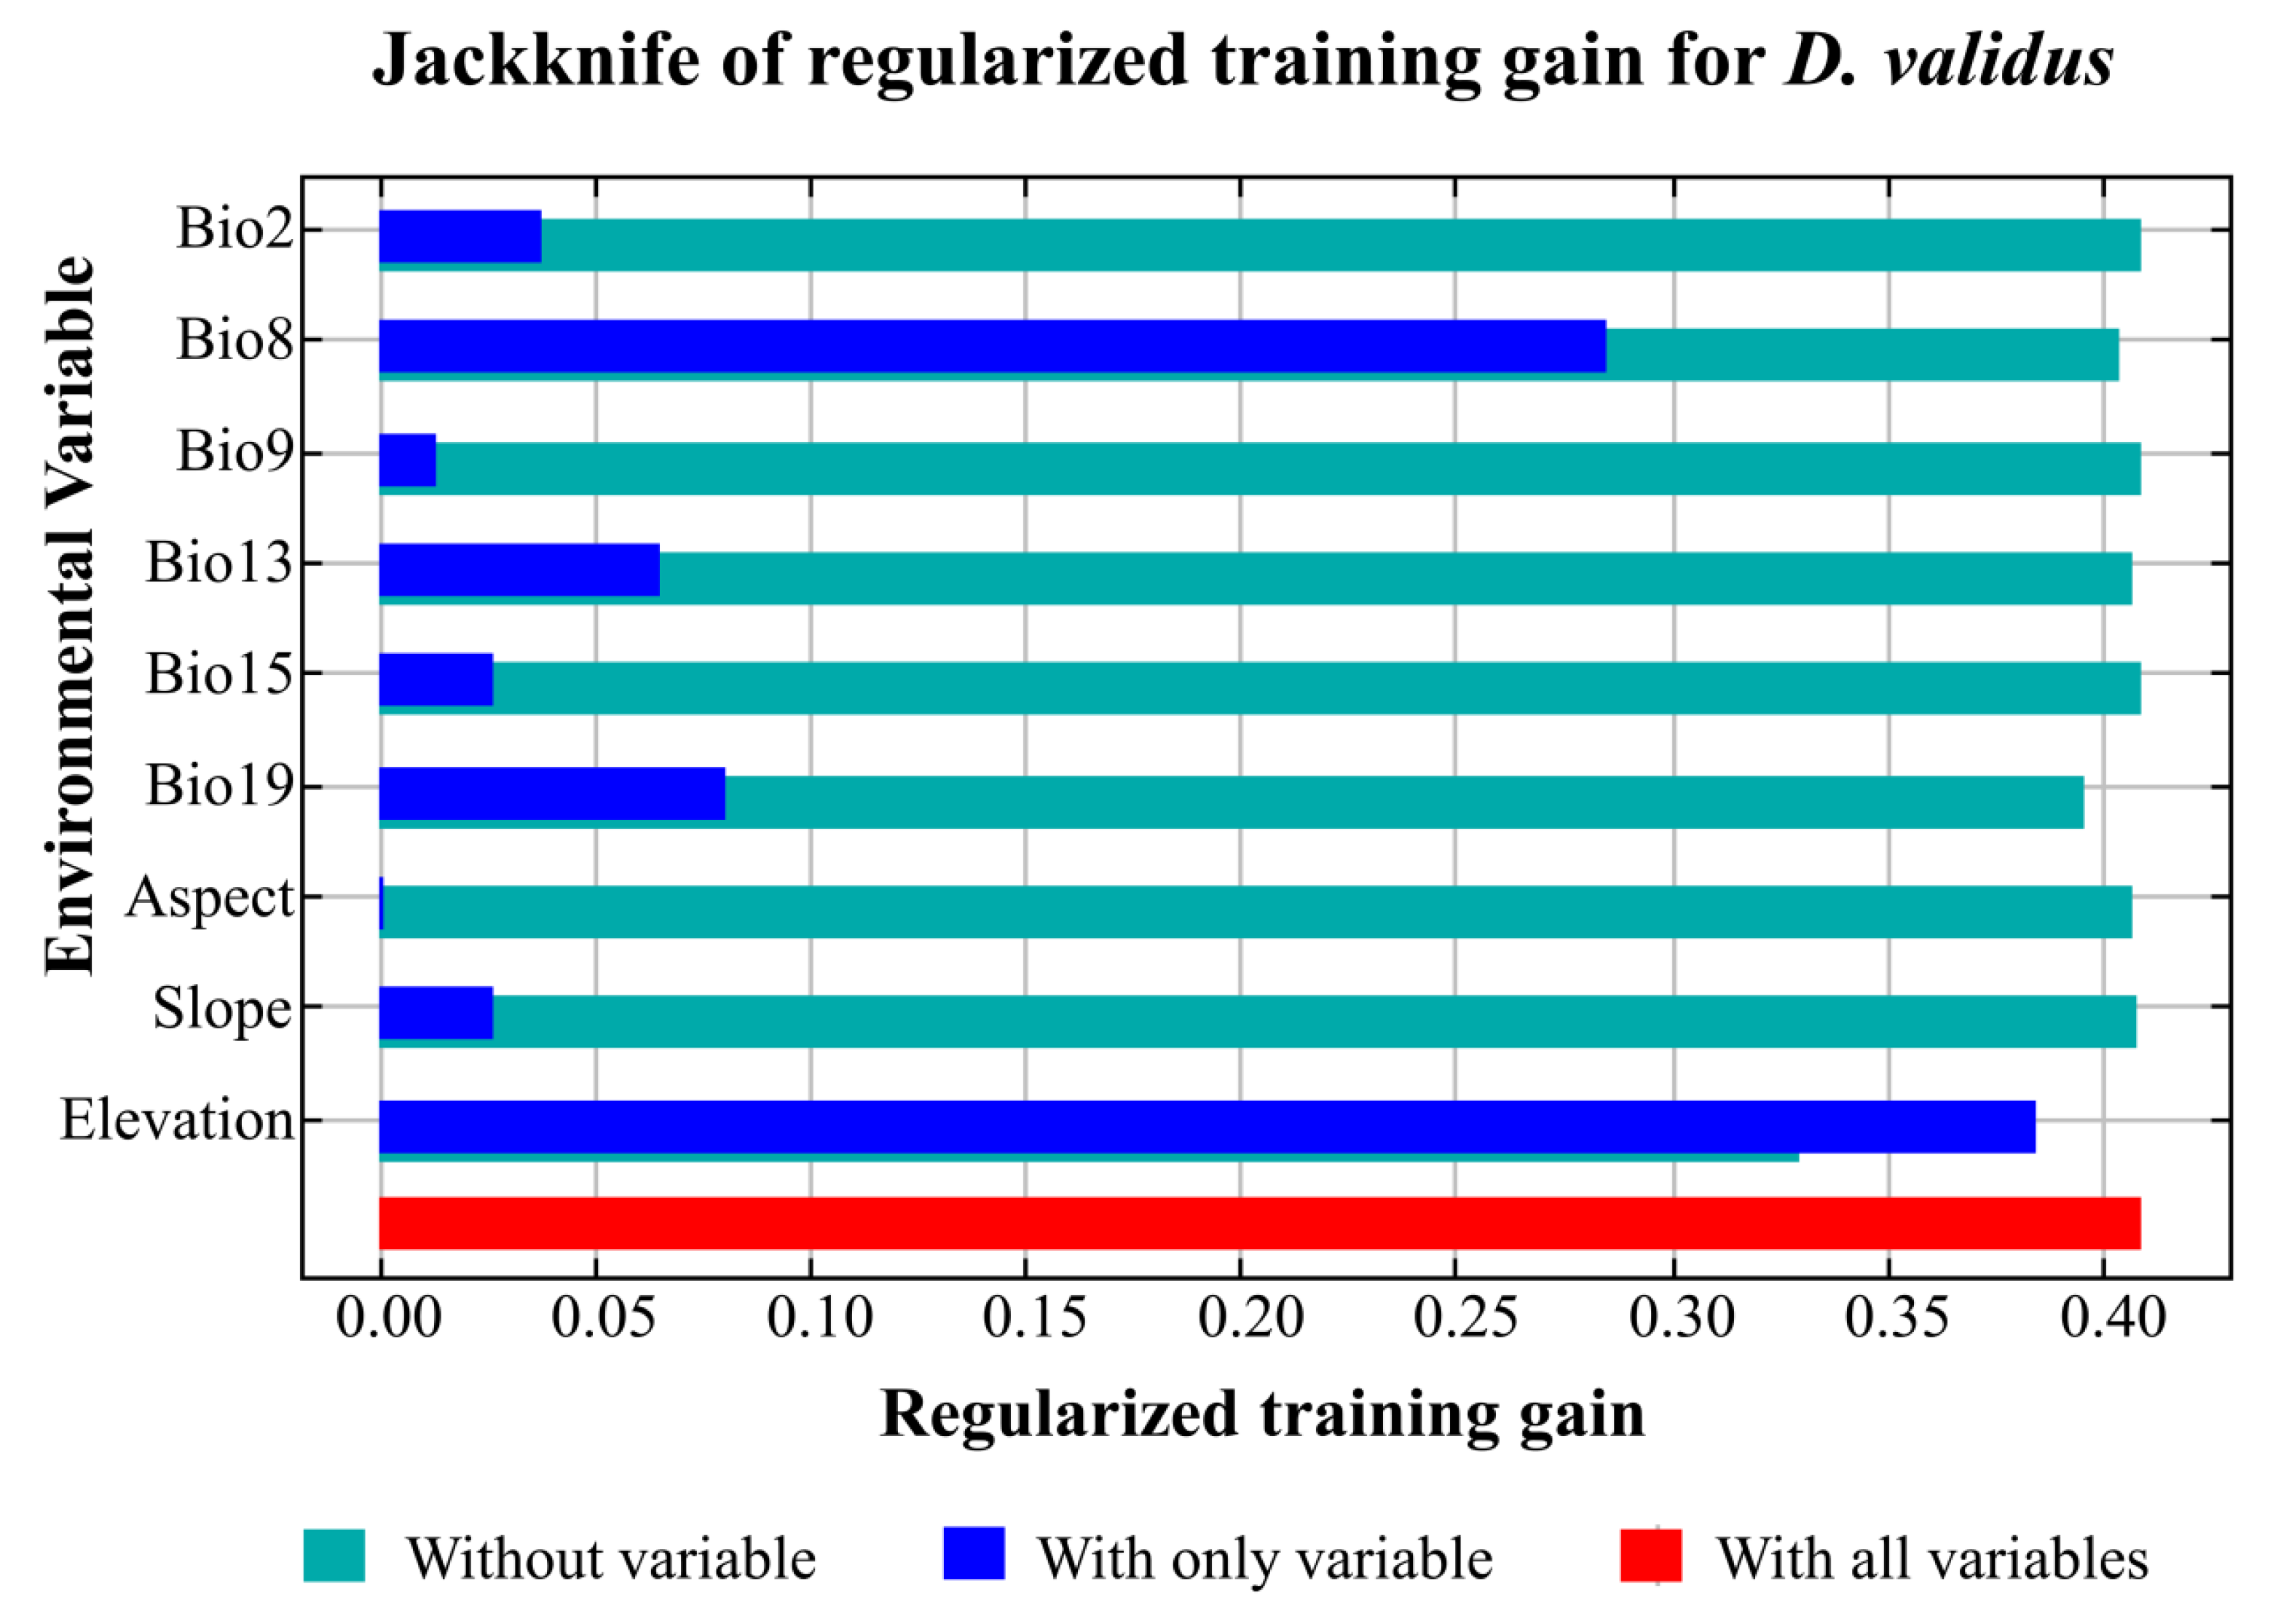
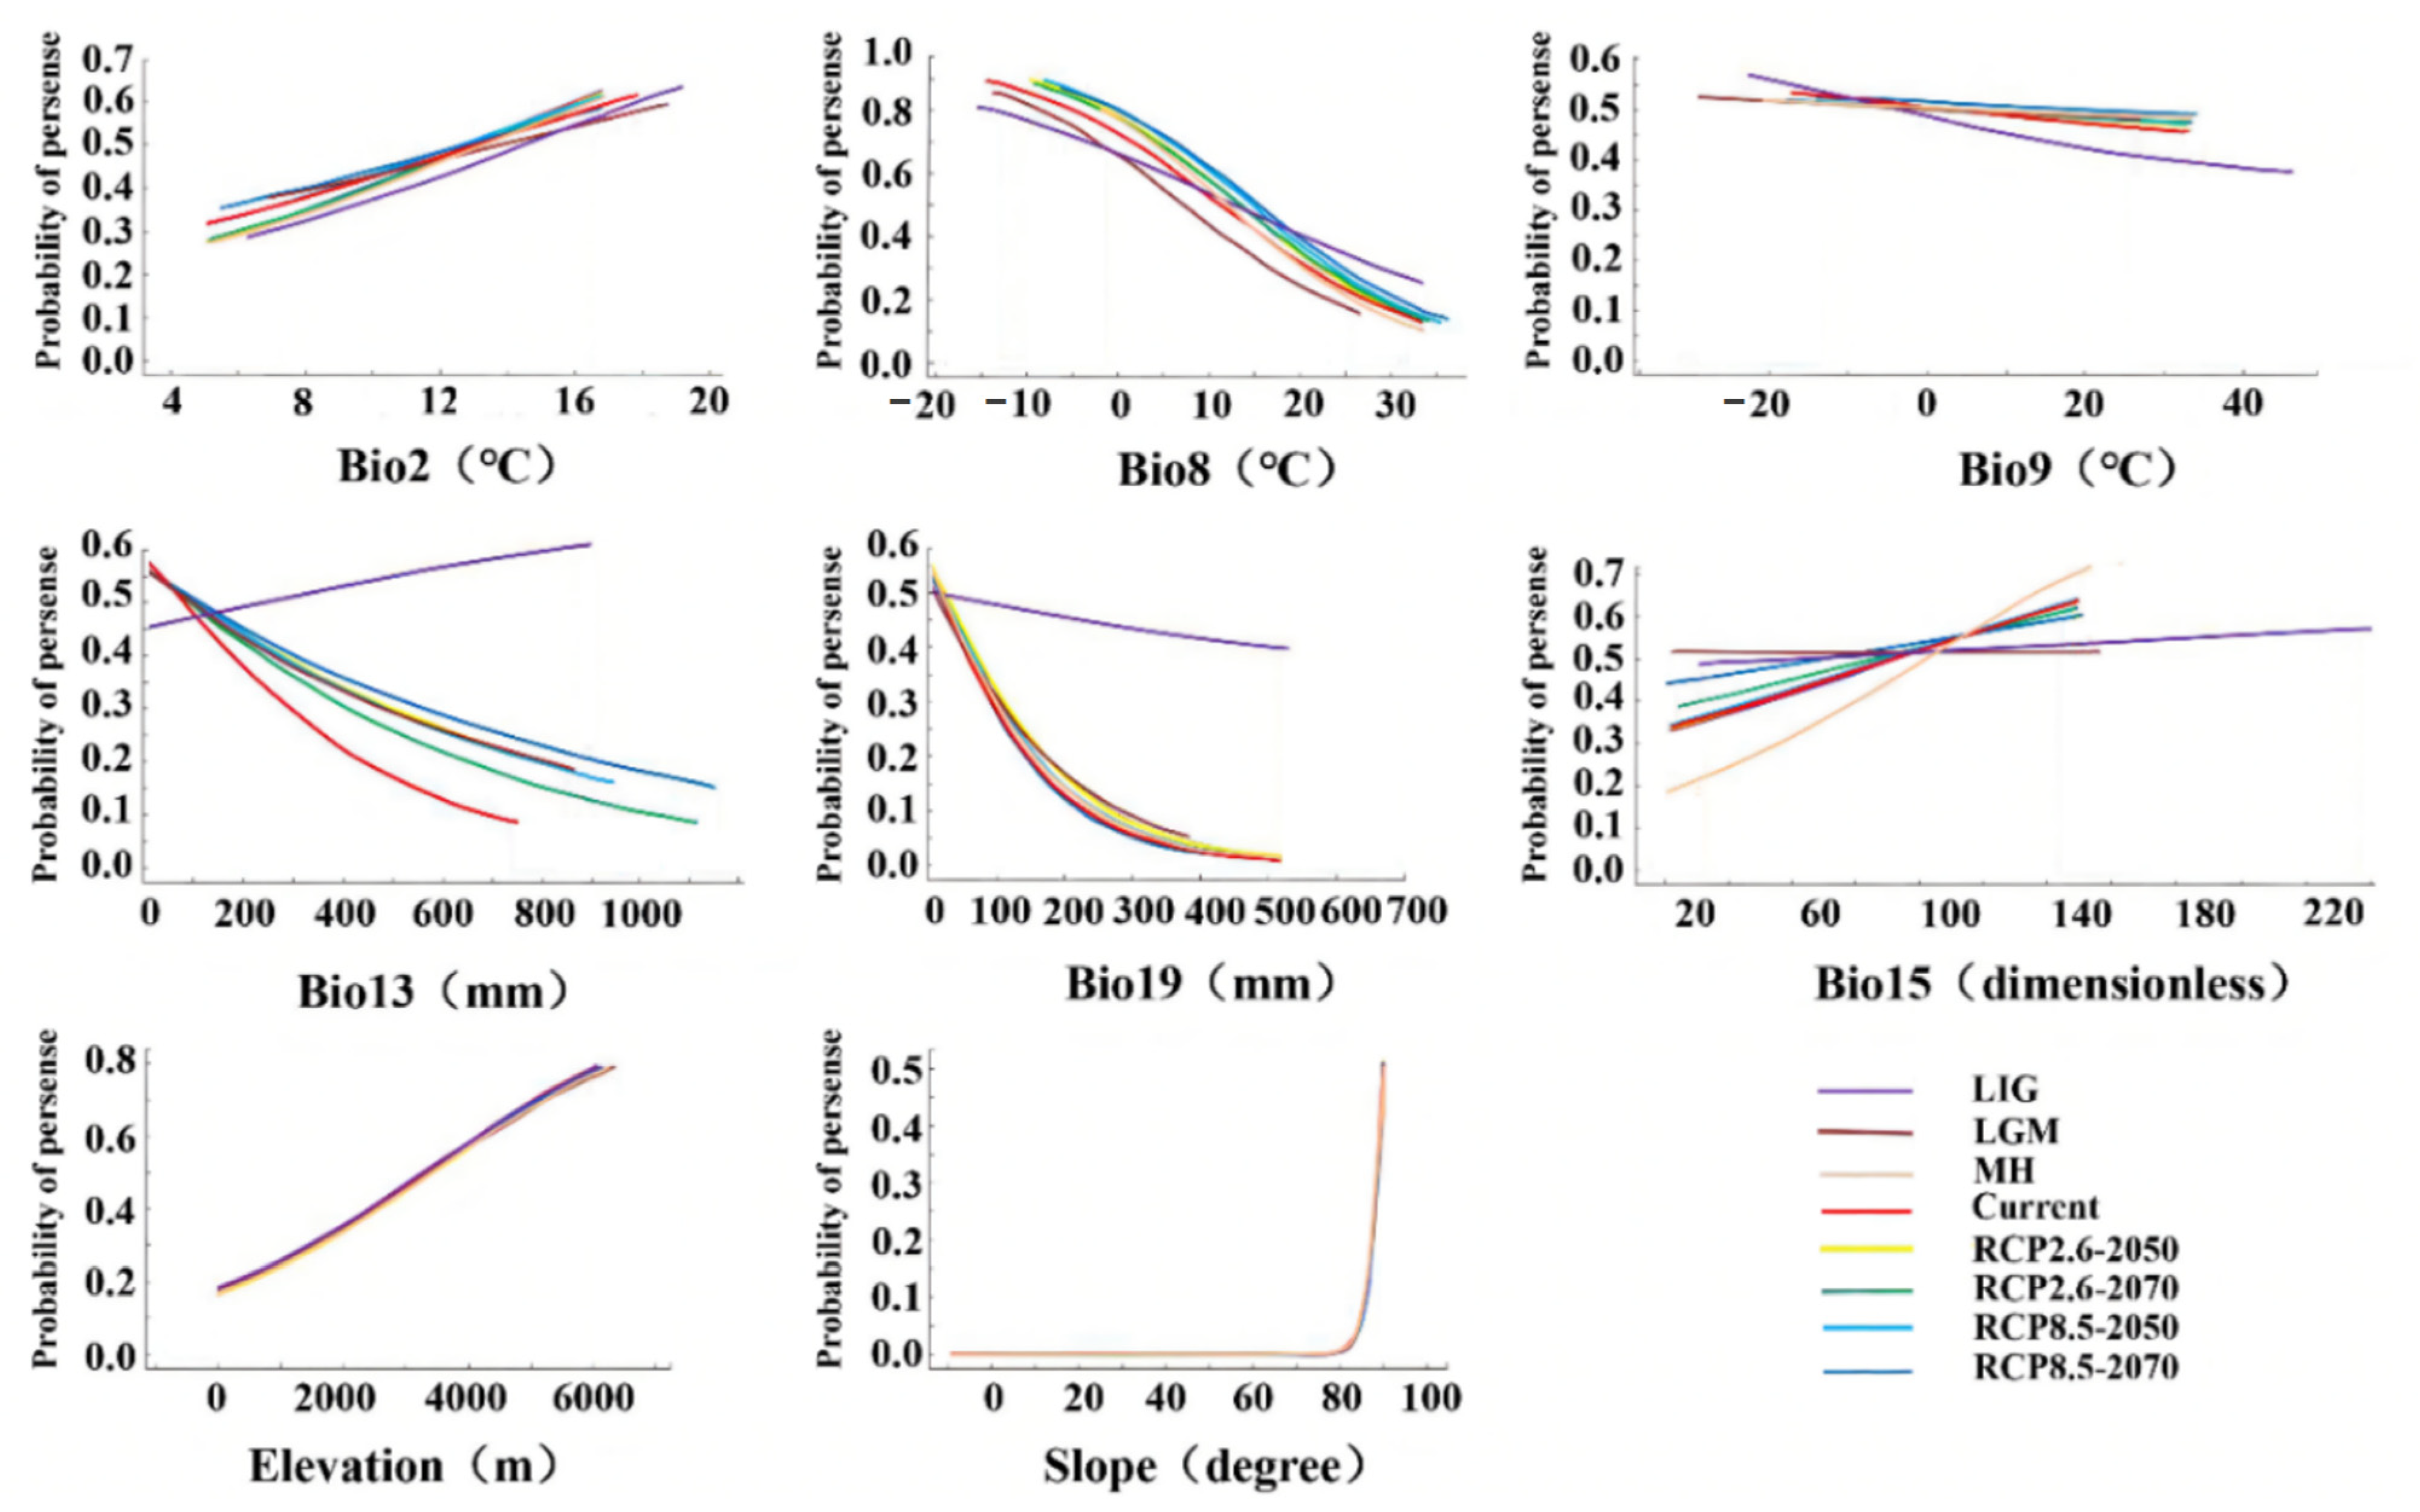
3.3. Relationship between Environmental Factors and the Distribution Pattern of D. validus

The importance of the relative contributions of the environmental variables considered in the modeling was evaluated using the jackknife test shown in Figure 5. The analysis revealed that the elevation exhibited the greatest gains in the MaxEnt model. The variables of mean temperature in the wettest quarter (Bio8) were important for shaping the D. validus distribution, and precipitation in the coldest quarter (Bio19) and precipitation in the wettest month (Bio13) were the main precipitation variables that influenced the potential distribution of D. validus. In contrast, the other variables exhibited relatively low gains, indicating that the weak contributions could almost be ignored.
The response curves of the nine variables for the habitat suitability of D. validus are shown in Figure 6. Based on the response curves of the major variables, the topography variables were stable environmental factors affecting the distribution of D. validus. It was predicted that D. validus mainly prefers habitats with high altitudes and large slopes in China, and within the predicted variable range, its survival probability gradually increased with the increase in elevation, reaching the maximum at about 6000 m altitude, indicating that D. validus is a typical alpine species in China. In addition, climatic variables were the main limiting factors for the potential distribution of D. validus. There were differences in the range of temperature and precipitation variables to which D. validus could adapt in different climatic periods. During the LIG period, D. validus seemed to have a wider climate adaptation. For example, when the mean temperature in the driest quarter (Bio9) was between −22 and 46 °C and the precipitation seasonality (Bio15) was from 30 to 240, D. validus may be present. However, from the MH period, the habitat adaptability of D. validus gradually tended to be stable. The occurrence probability was higher (over 0.5) when the mean temperature in the wettest quarter (Bio8) was −15–15 °C and precipitation in the coldest quarter (Bio19) was 0–20 mm. According to the response curves of the main variables, some precipitation variables and temperature variables were negatively correlated with the probability of D. validus distribution. For example, when the values of precipitation in the wettest month (Bio13) and precipitation in the coldest quarter (Bio19) increased, the probability of the presence of D. validus decreased. Similarly, as the value of the mean temperature in the wettest quarter (Bio8) decreased, the probability of the presence of D. validus increased. In general, D. validus is a typical alpine bryophyte adapted to cold and drought climates in China, with a relatively narrow range of optimum growth temperature and precipitation, and is mainly distributed at high elevations.

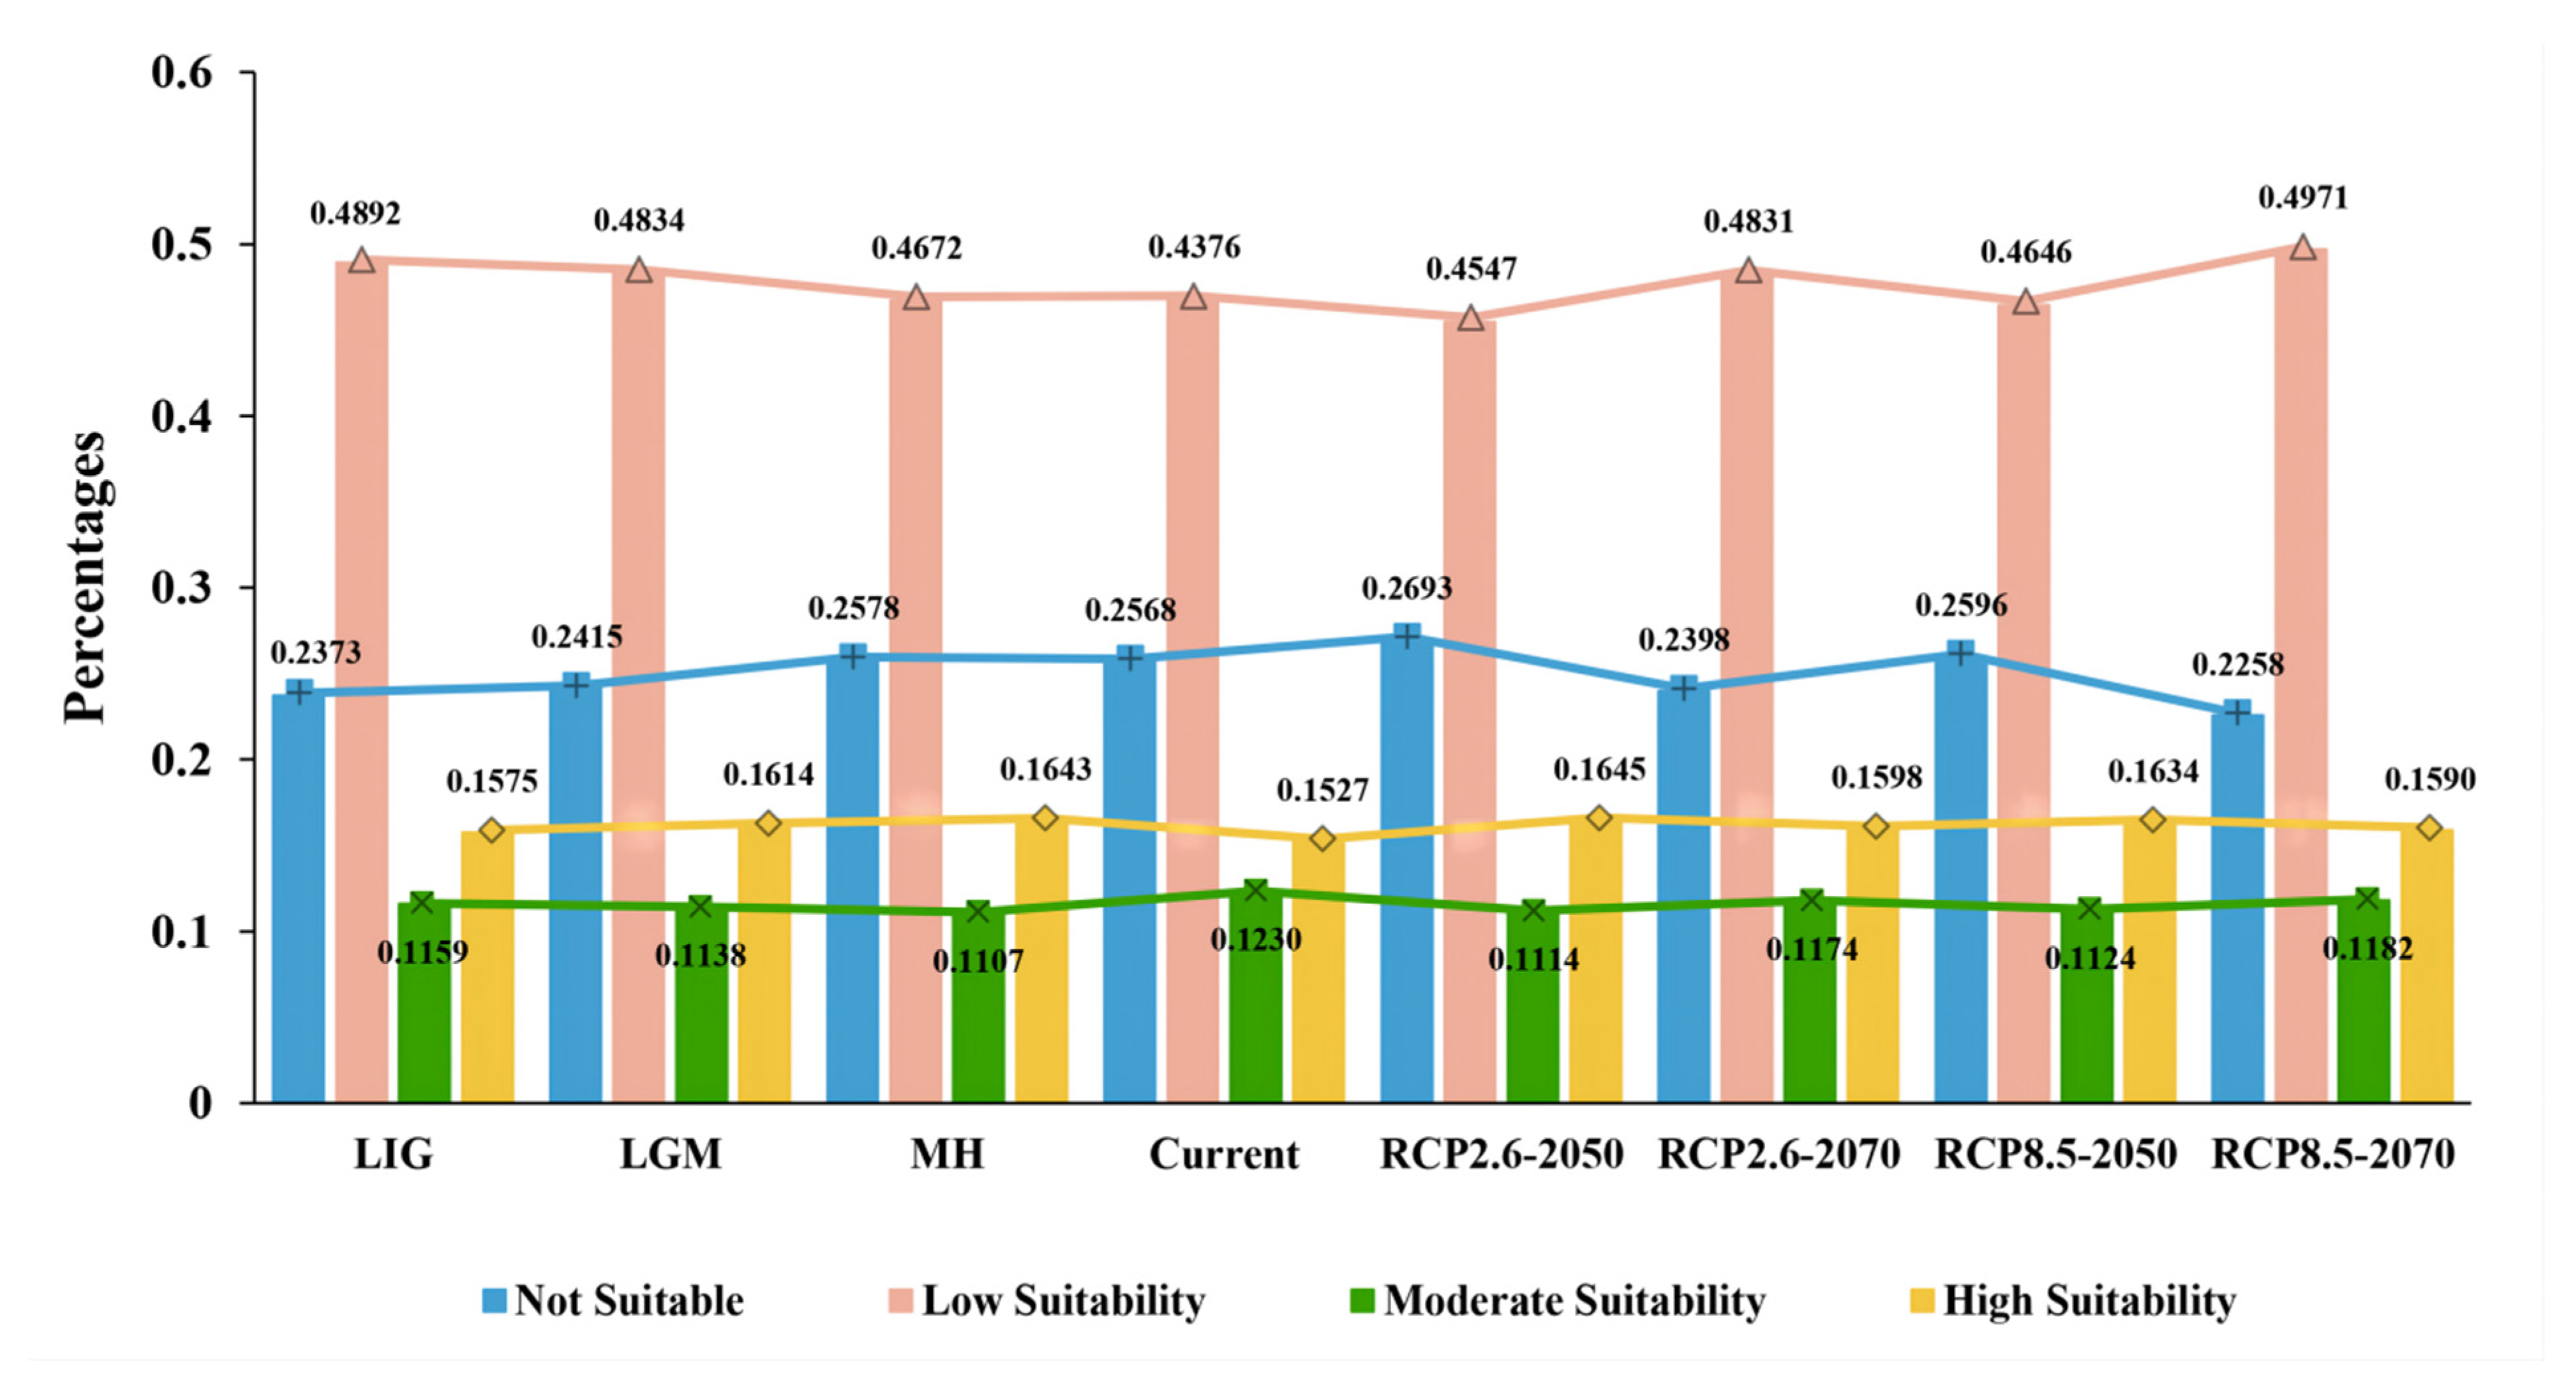
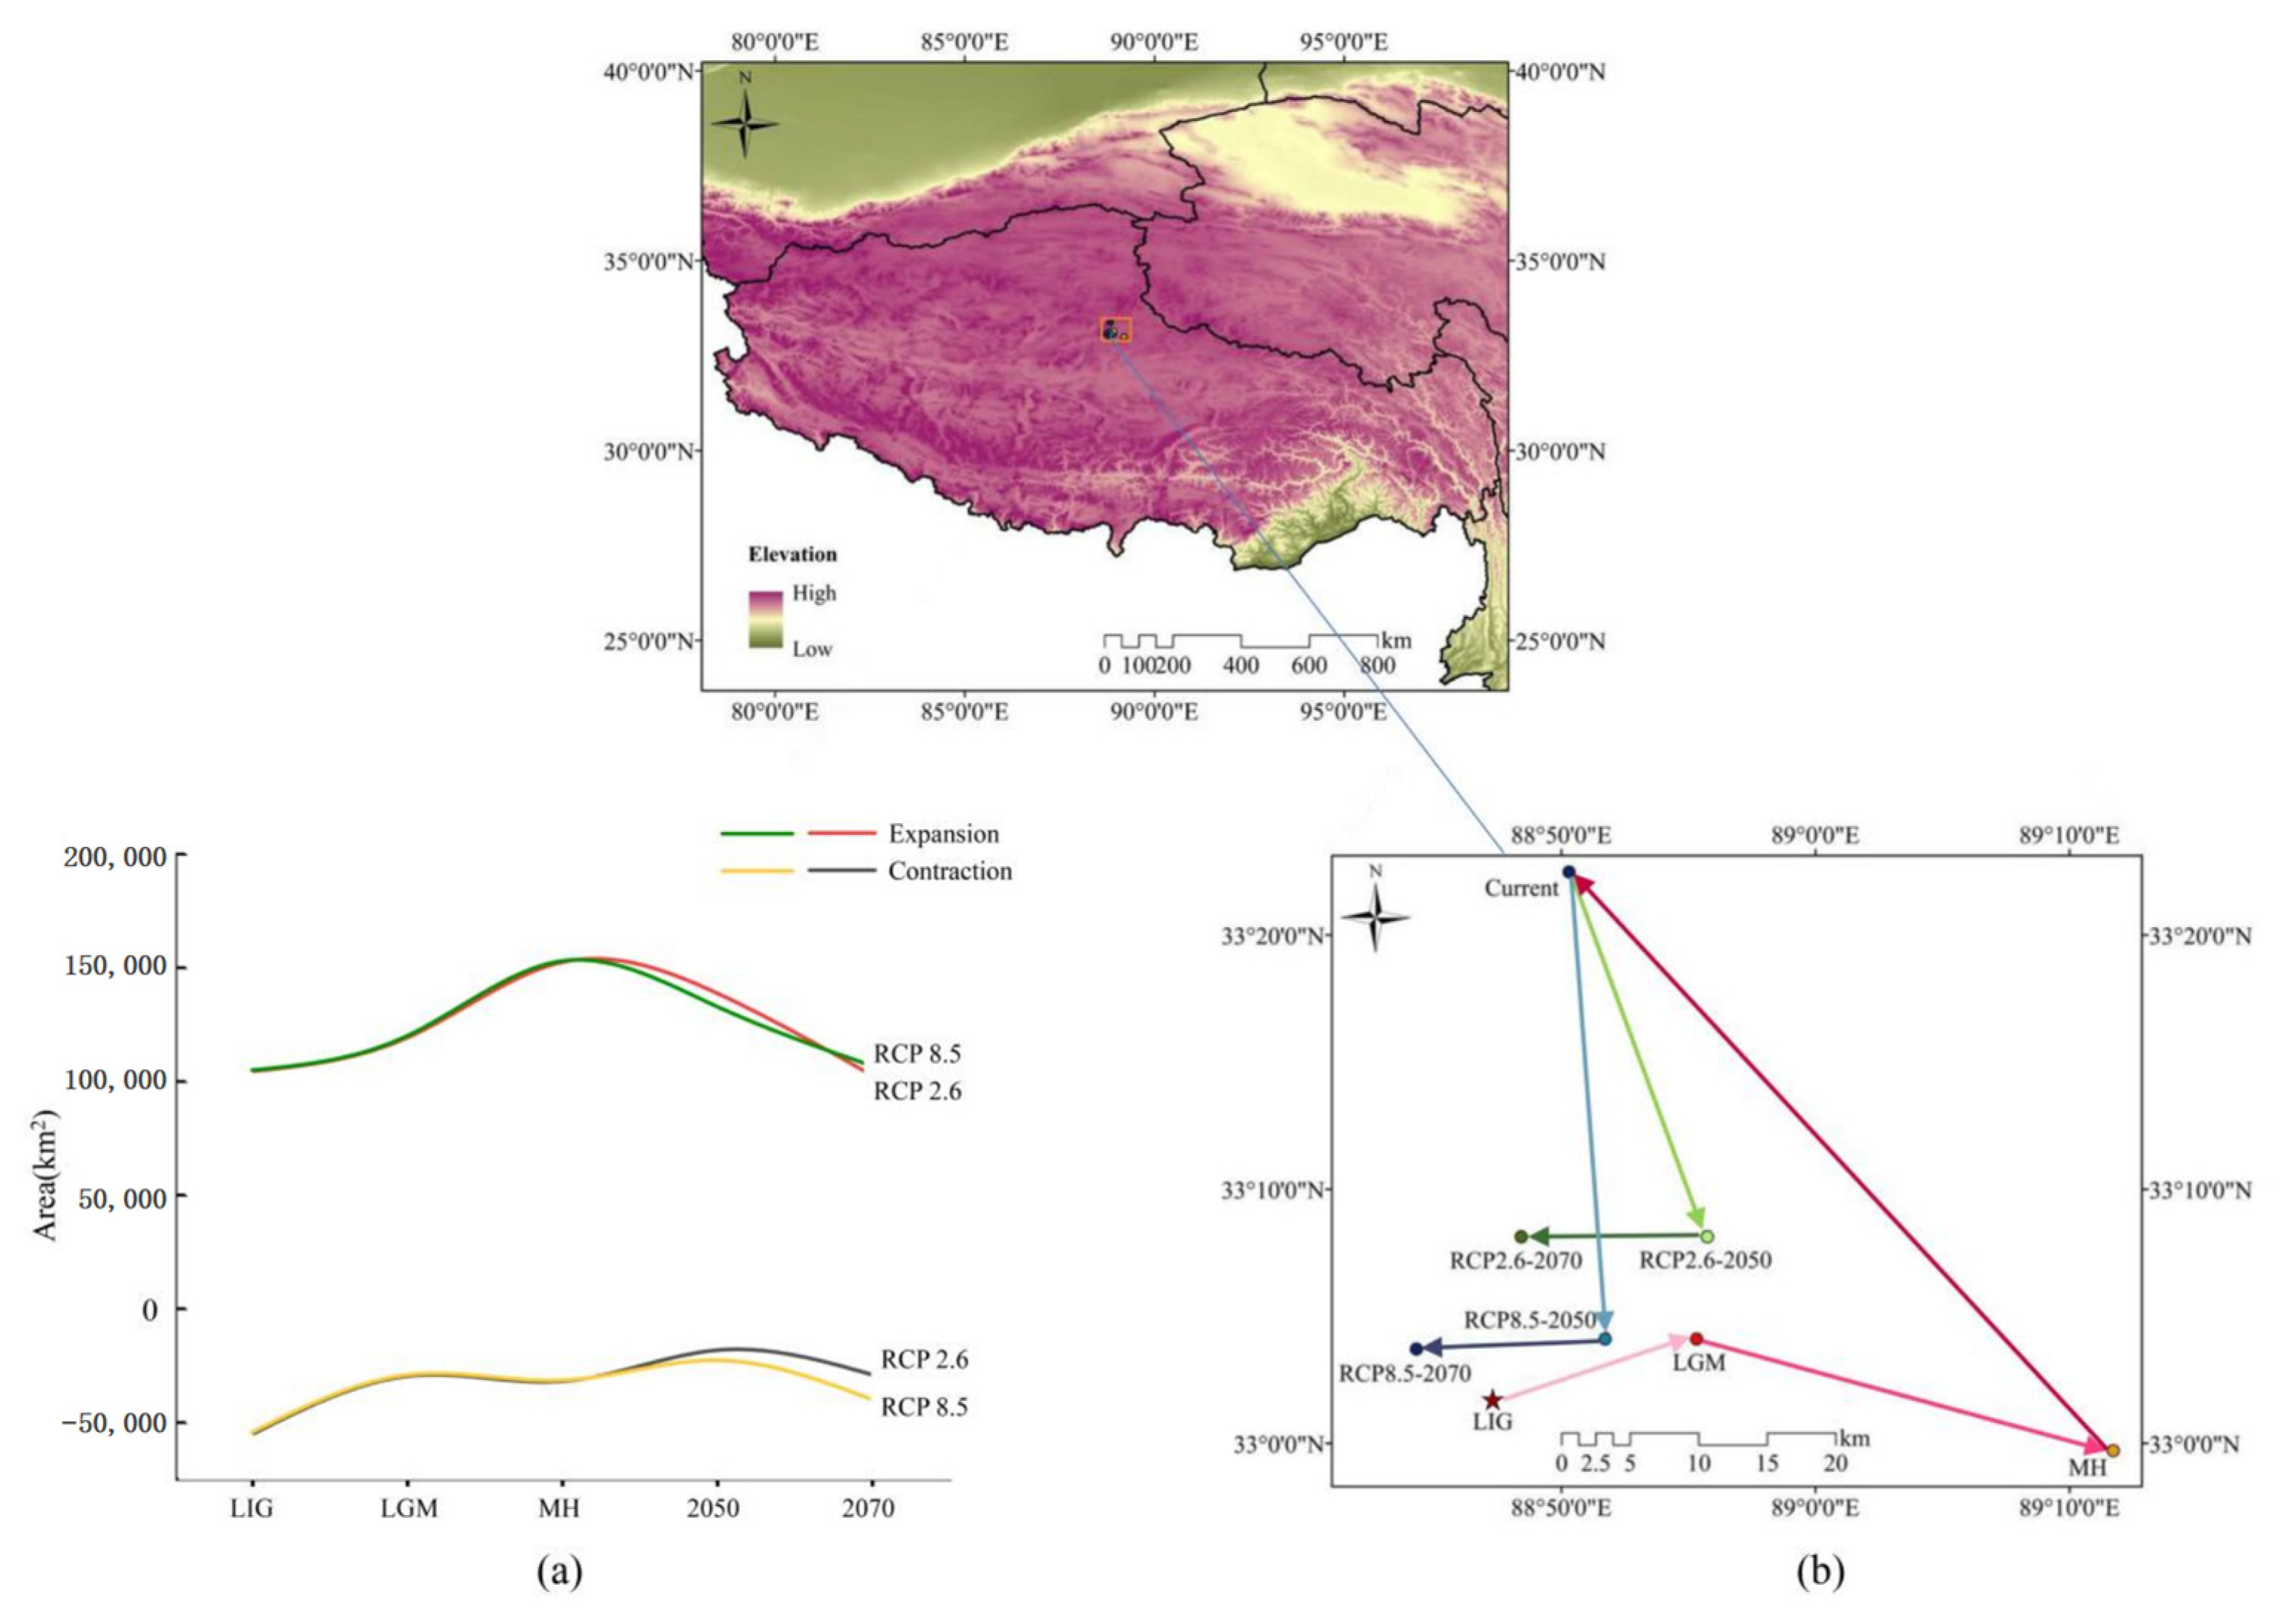
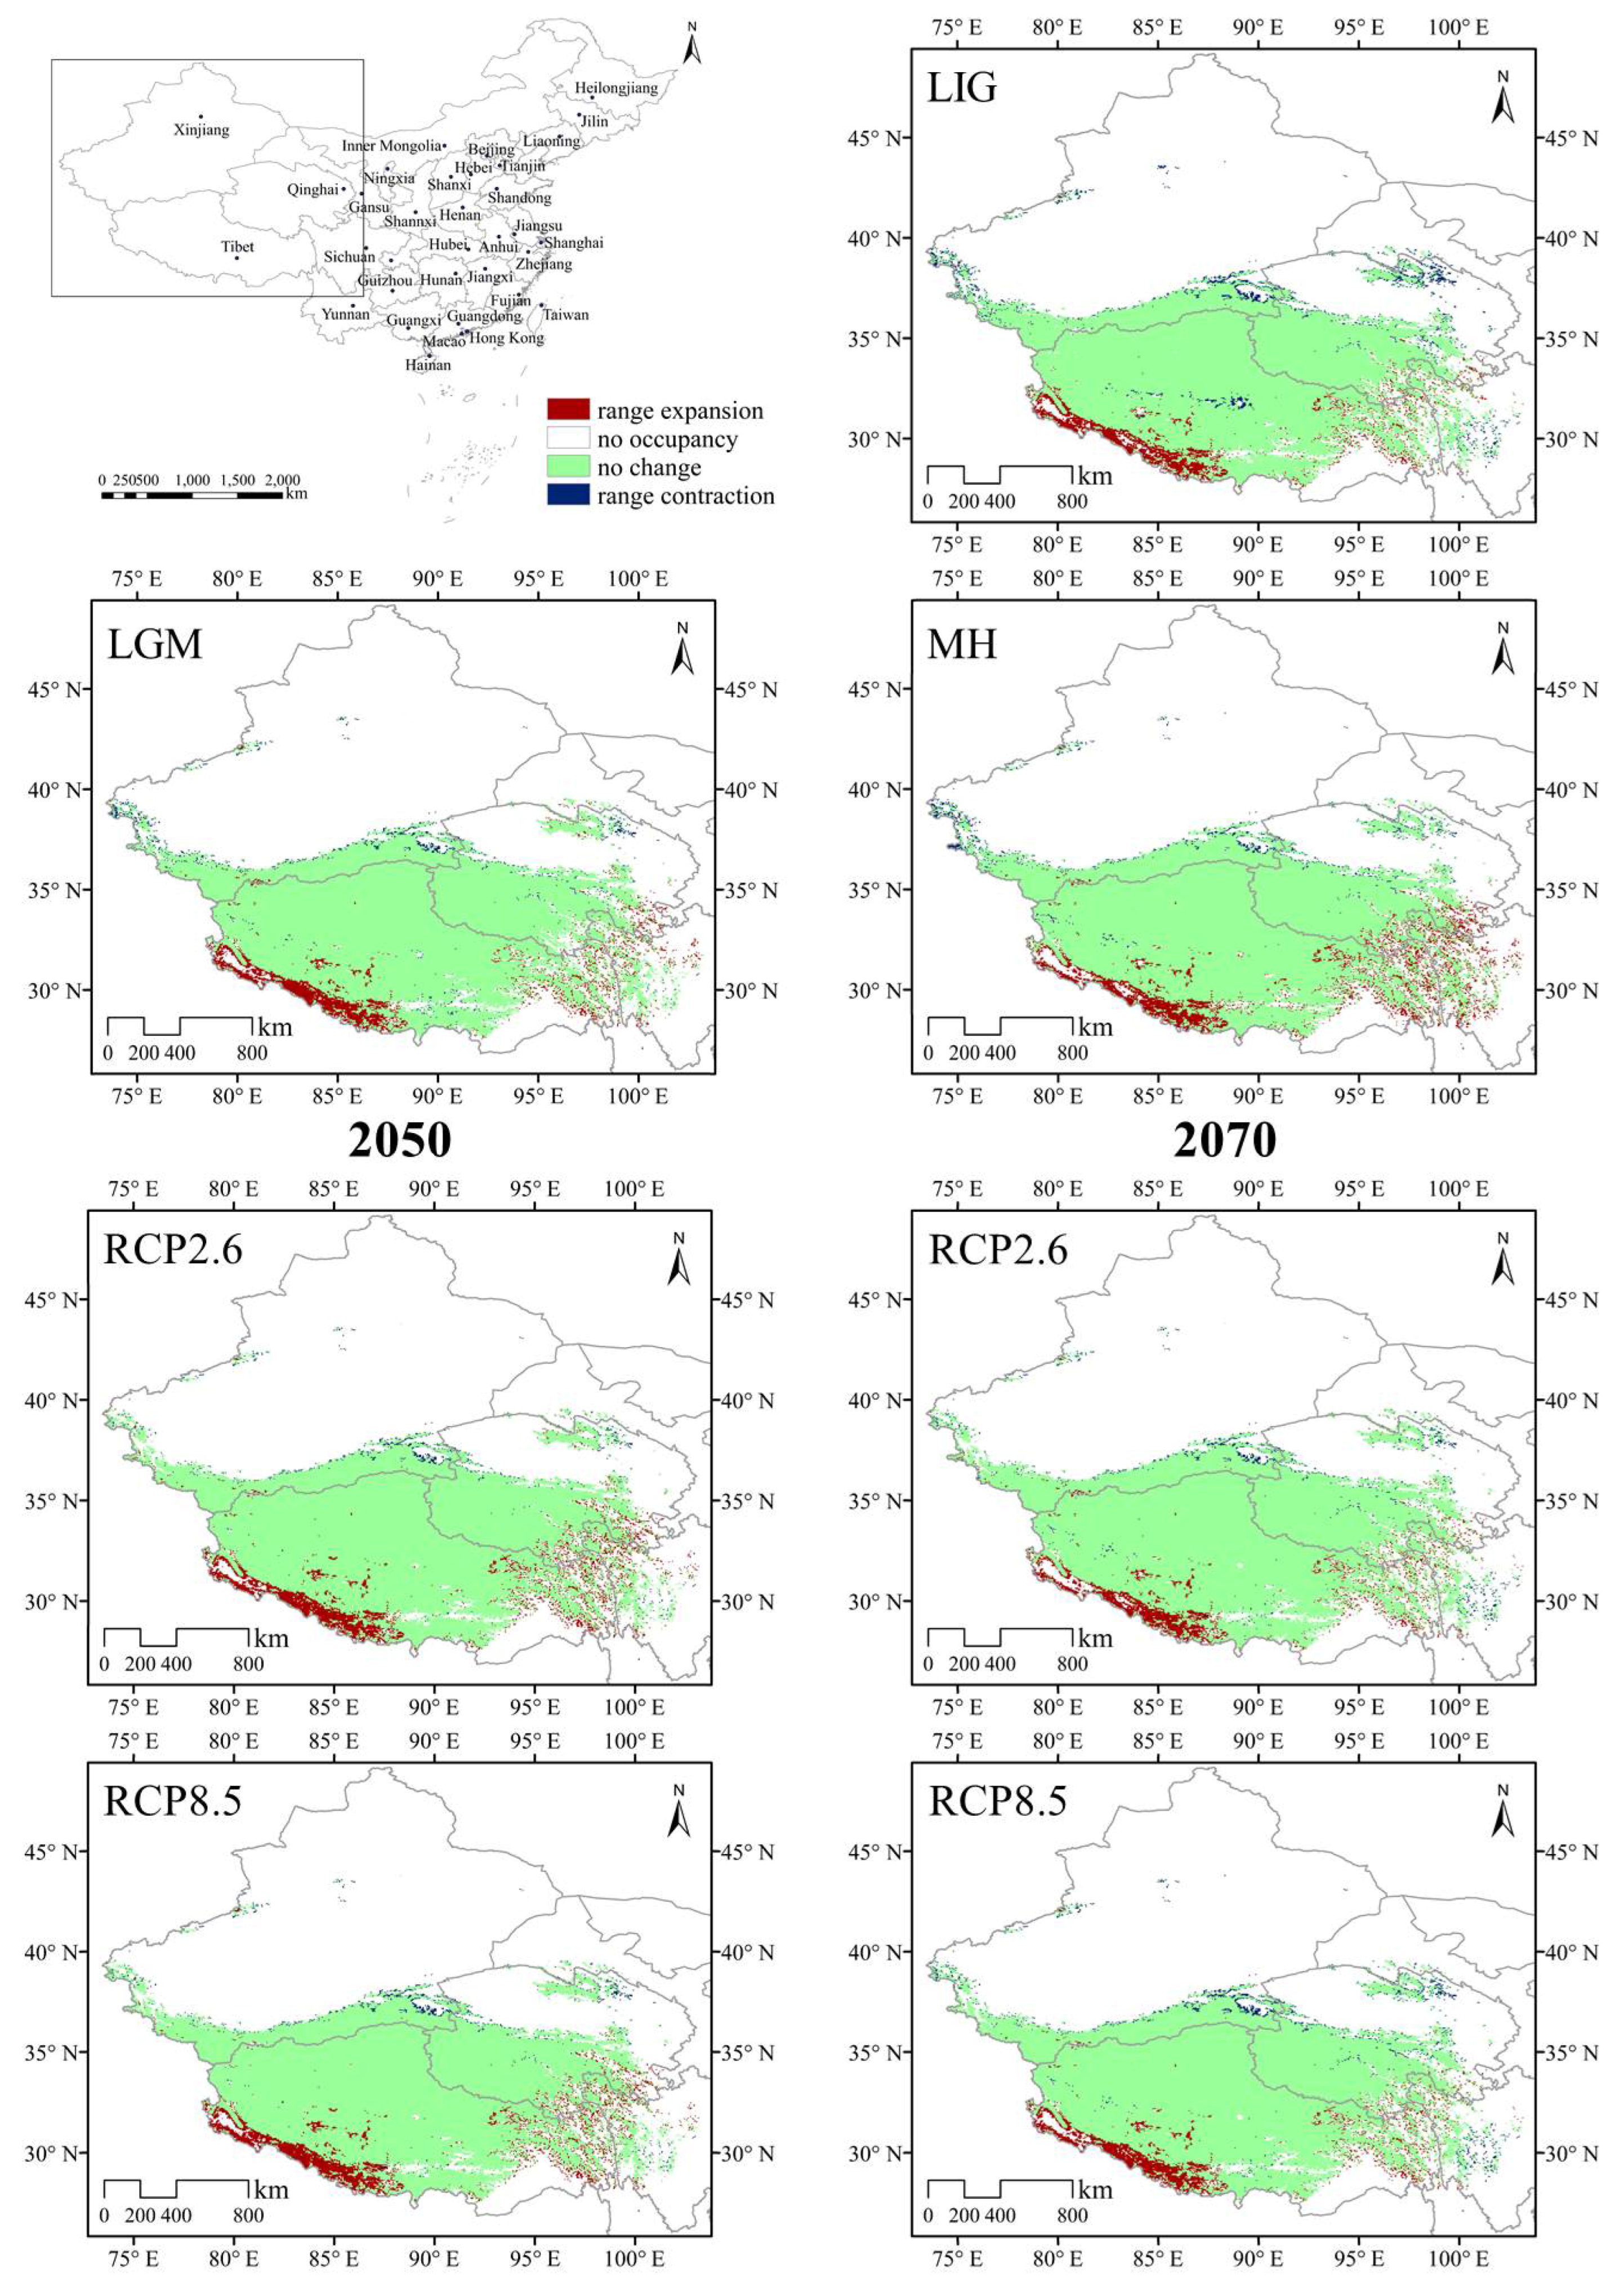
3.4. Species Distribution Shifts under Different Climatic Scenarios

In general, limited expansion and contraction in the extent of highly suitable habitats were predicted across the suitable habitat area with climate change. The results are shown in Figure 7 and Figure 8. MaxEnt projected that the area of suitable habitat losses would be mainly concentrated in the northern and eastern areas of the current habitat. Under the same climate scenarios, the range of appropriate habitats could increase in both the southern and eastern margins of the current suitable habitat, which is mainly in the Gangdise and Hengduan Mountains of China.
The SDMs of the LIG estimated that southern and eastern Tibet, western Sichuan, and southern Qinghai had more suitable habitats than the current distribution (Figure 7). However, the suitable habitats in central Tibet, southern and central Xinjiang, central and northern Qinghai, and western Sichuan in China contracted slightly. The MH model was similar to that of the LGM, with the estimated suitable habitat increasing mainly in the southern and eastern parts of the current habitat, the Gangdise and Hengduan Mountains of China (Figure 7). In future scenarios, MaxEnt estimated that the suitable habitat would increase mainly in the southern edge of the current habitat but decrease in the western parts (Figure 7). The suitable habitat area of D. validus in 2050 would be slightly larger than that in 2070 due to its higher expansion and lower contraction (Figure 8a).
The current distribution center for D. validus was predicted to be in northeastern Tibet (Figure 8b). However, during the LIG period, the habitat centroid was southwestern of the current centroid of suitable habitats. This centroid shifted to the northeastern region during the LGM. In the MH, the centroid was distant from its current location. Looking to a possible future under RCP2.6, the centroid would have shifted southeast by 2050 and then moved westward by 2070. The centroid was predicted to shift southward by 2050 and then westward by 2070, applying RCP8.5. In brief, the distribution core zone of suitable habitat would shift to the southwest in future climate scenarios.

4. Discussion

Previously, D. validus was classified as an infraspecific taxon within Didymodon rigidulus Hedw due to their shared characteristics, such as leaf shape, curvature of the leaf margins, leaf areolation, and color of the laminal cells in reaction with KOH [32]. Our findings corroborate the observations made by Jiménez (2006) and Shuayib et al. (2017), indicating that the leaf cells of D. validus lacking papillae exhibit distinct characteristics compared to the middle and upper leaf cells of D. rigidulus with papillae (Figure 2). The structures of papillae are associated with water sparing and the avoidance of light radiation. The absence of warts on the surface of the leaf cells of this species, which occur in forest ecosystems, may be due to long-term adaptive evolution, exemplifying the integrity of plant morphology and function. The smooth nature of D. validus leaf cells facilitates water penetration by reducing surface tension, thereby enhancing water absorption. Moreover, this characteristic also promotes gas exchange, diffusion, and nutrient uptake, ultimately improving their adaptability in the forest edge ecosystem.
In addition, Kürschner and Neef (2012) highlighted that D. validus exhibits a pronounced capacity for asexual reproduction, as evidenced by its ability to generate numerous gemmae in leaf axils, thereby ensuring successful colonization and long-term habitat maintenance. However, the presence of gemmae as propagules in mosses is not always consistent despite their frequent consideration as a characteristic of species classification. Gemmae were present in D. validus from Europe and parts of Asia [19,53], while they were absent in China, according to Shuayib et al. (2017) and our own observations. This could mean that the structure of the gemmae will be affected more by long-term geographical isolation than by habitat conditions. However, we found that D. validus in dry lands had more branches and pseudoroots, dense mat-like clusters, and thicker cell walls than the wartless pair of mosses distributed in forest ecosystems. Persistent pressure from environmental stress may have facilitated plant adaptation under adverse conditions and the evolution of many survival mechanisms [54,55].
Although it is impossible to simulate the potential distribution of species with few sites, the prediction of the distribution pattern of D. validus is helpful for the discovery and conservation of narrow-range species in their corresponding habitats. Multi-model intercomparison studies have reported that the MaxEnt model, which is based on the maximum entropy principle, typically outperforms other SDMs in terms of high tolerance and high predictive accuracy, particularly for small sample sizes [56,57,58]. In this study, less distribution point information was used to predict the MaxEnt model, and the results showed that the cross-validation AUC of the D. validus model was 0.751 and the TSS value was 0.526, further supporting the suitability of our ArcGIS-based MaxEnt model. The simulation results are still reliable under the condition that the species distribution points are few, but uniform collection is guaranteed. In addition, the site information used in this study, the secondary data, and the obtained results showed that the distribution range of D. validus was narrow rather than unevenly investigated.
The MaxEnt model is frequently used by conservationists and managers to model endangered and invasive species in order to rehabilitate species while at the same time preserving their habitats [59,60]. It can utilize both continuous and categorical data and can incorporate interactions between different variables [61]. Moreover, the output of MaxEnt is continuous, allowing fine distinctions to be made between the modeled suitability of different areas, and these fine distinctions in predicted relative environmental suitability can be valuable to reserve planning algorithms [42]. However, because the dependence of the MaxEnt probability distribution on the distribution of occurrence locations is explicit, a difference between available occurrence records and background sampling may lead to inaccurate models that, in turn, may lead to inappropriate management decisions [62].
Jiménez (2006) documented D. validus growing in dense turf that was olive-green or brown-green. Its habitat is dominated by flaky soil, calcareous rocks, and dry talus at elevations from 200 to 1615 m. However, D. validus found in China was mainly distributed on soil over rocks and soil at the edge of the coniferous forest belt above an altitude of 2000 m, and the species showed a more suitable area and higher suitability with the increase in altitude. Our results highlighted a significantly larger suitable distribution range for D. validus than the current known distribution of the species in China (Figure 3). The potential range of D. validus is not limited to alpine forest ecosystems but may cover a wide range of humid regions and dry lands of the QTP. Shuayib (2018) pointed out that there are some morphological and structural differences in the growth performance of D. validus in different geographic regions that help it adapt to both arid and humid environments. Furthermore, by comparing the potential distribution patterns of D. validus under historical, current, and future climate scenarios, we observed that the highly suitable range of D. validus in China remains relatively stable under different climate conditions (Figure 4). We suspect that the high mountains of western China may provide a refuge for D. validus to cope with climate change. Many previous studies have shown that the QTP provides a refuge for many alpine plants to cope with vegetation migration events in different historical periods to reduce the influence of climatic events on their growth [21]. Refugia with complex topography may buffer against the impacts of climate change [63,64] and allow for the local persistence of species through successive periods of climate change [65]. This implies that the QTP provides a suitable habitat for D. validus even under changing climatic conditions.
In addition, our results showed that elevation and mean temperature in the wettest quarter were the predominant variables driving the potential distribution of D. validus (Figure 5). Previous studies have shown that altitude is usually a key eco-factor for the distribution of alpine species [66]. In mountainous areas, the elevational gradient causes changes in moisture, temperature, precipitation, and solar radiation [67]. Furthermore, the contribution of the mean temperature in the wettest quarter was significant. Temperature has been shown to affect the growth of bryophytes by determining their respiration rates [1]. Mild temperatures and relatively high water availability favor the continuous production of sex organs [68]. In addition, fertilization time is dependent on the wettest period [69]. Most mosses also depend on moisture for growth and reproduction [70]. Therefore, we speculate that this is why D. validus is found in forest ecosystems. Didymodon validus may prefer a warm and humid season during the same period of rain and heat for development or reproduction. Precipitation in the coldest quarter was a constraint on the distribution of D. validus in our study. Ma and Sun (2018) suggested that precipitation will increase habitat suitability for bryophytes in the coldest season. In alpine regions, the coldest season is usually accompanied by low temperatures. Soil freezing may make water less readily available, while precipitation can provide plants with the needed moisture.
In our study, the response curves to the key climatic variables showed that D. validus exhibited a wider range of climatic adaptations during the LIG period relative to the other periods (Figure 6). The LIG period was characterized by a warm and humid climate and is considered one of the warmest periods globally for nearly 150 ka. This warm period may have led to the melting of snow and ice on the Tibetan Plateau and the expansion of lakes, providing favorable conditions for the growth and reproduction of D. validus. In addition, the habitat suitability of D. validus gradually stabilized after MH. During the LGM, mountain ranges were uplifted, and the climate became colder and drier, adversely affecting the survival of D. validus. Until the MH after the LGM, the climate warmed up, and the glaciers shrank in a large area [71]. These factors indicate that the adaptability of D. validus to climate in different periods is affected by climate change and that the warm and humid climate conditions during the LIG period provide opportunities for reproduction and survival.
The impact of climate change on the geographical distribution of plants is mainly reflected in changes in distribution range and area [72]. QTP is the highest alpine ecosystem in the world and one of the most sensitive to climate change [21]. Numerous species are confronted with the shrinking of their spatial distribution in the case of continuous warming on the plateau or even the possibility of extinction. However, under such a long time and spatial variation in this study, D. validus has managed to settle successfully and steadily in a high-altitude environment. This not only demonstrates the ecological adaptability of this species, which is capable of withstanding adverse conditions on the plateau, but also indicates that, despite its limited distribution in China, D. validus does not retreat from its original habitat with the changing climate. Compared with other narrow-ranged species, there is no need for excessive habitat protection or concern for this species.
According to previous studies, the differentiation of D. validus was completed in the Miocene [34]. Our MaxEnt model reconstructed that the simulated distribution range of D. validus was stable and did not shrink during the LIG, LGM, and MH and that the area of expansion had been increasing (Figure 7). Quaternary glaciation has always been regarded as an important event in the study of phylogeography, and drastic fluctuation in the climate is generated by the recurrence of glaciation [73]. Many studies have shown that the QTP never formed a uniform ice sheet during the glacial period, but its complex topography made it possible to have relatively warm and moist places for organisms to survive, even in harsh climatic conditions [74]. From the LIG to the LGM, concomitant with climate cooling, the habitat suitable for D. validus is still expanding along the southern and eastern margins of the QTP, albeit at a slower rate. In the LGM of the Quaternary, the temperature of the Asian continent was approximately 5–11 °C lower than it is currently, and the climate warmed after the LGM [75]. At the MH, the expansion area of potential habitats for D. validus was substantially increased compared to the other periods, but these were mostly included within the current potential range. Many alpine plants adapt to warming by moving upward or northward in altitude, and the ultimate consequence can be extinction, a phenomenon often described as “nowhere to go” [21]. Furthermore, narrow-range species usually live under very specific environmental conditions and are the most vulnerable to climate change [76]. Some studies have shown that not only are they more likely to face distribution changes and range shrinkage, but they might also disappear due to the strong alteration of their climatic envelope throughout their entire region [77]. Despite the predicted low suitability of climate conditions, it is possible that species persist under changing conditions through adaptation or plasticity [78,79]. Our findings suggest that the distribution change in D. validus fits with the latter. In addition, through the observation of the species under long-term climate and spatial changes, it was found that although the center of the suitable habitat of D.validus showed a trend of migrating to the southwest in the future, there was no significant change in longitude and latitude, and the migration distance was relatively short (Figure 8). This may be due to the limitations of geographical isolation. And this short-distance migration may be caused by climate fluctuations in a certain period of time. We underestimated the adaptability of the moss.

5. Conclusions

The present study employed the MaxEnt model to reveal that the suitable habitat of D. validus as a narrow-range moss species is not limited to alpine forest ecosystems. In fact, D. validus exhibits cold and drought resistance on the QTP of China. The distribution pattern of D. validus is mainly defined by key environmental variables, including altitude and mean temperature, in the wettest quarter. In general, despite dramatic climatic and spatial changes over a long period of time, the range of D. validus has not been radically altered, nor has it shown a significant tendency to shrink. However, due to the complex terrain of the QTP, it provides refuge and mitigates the adverse effects of climate change. Meanwhile, D. validus showed unique adaptability in China, enabling it to cope with the challenges of adverse climatic conditions. In the context of future climate warming, the suitable habitat center of D. validus may move southwestward, but it will not completely withdraw from the distribution range of China, and its potential distribution range will remain relatively stable. This study provides an important reference for addressing the impact of climate change on alpine narrow-range moss species and provides strong support for future distribution and conservation strategies.

Author Contributions

Conceptualization, J.K. and B.Z.; methodology, T.W.; software, T.W.; validation, C.P., T.B. and Q.W.; formal analysis, T.W., C.P. and J.K.; investigation, J.K.; resources, J.K. and B.Z.; writing—original draft preparation, T.W., C.P. and J.K.; writing—review and editing, J.K. and B.Z.; visualization, T.W., T.B. and Q.W.; supervision, J.K. and B.Z. All authors have read and agreed to the published version of the manuscript.

Funding

This work was supported by the National Natural Science Foundation of China (grant No. 42001045, 32060051) and Shenzhen Key Laboratory of Southern Subtropical Plant Diversity (grant No. 99203030).

Data Availability Statement

The data that support the findings of this study are available from the corresponding author upon reasonable request. Restrictions apply to the availability of these data, which were used under license for this study.

Acknowledgments

The authors are grateful to the regional editors and anonymous reviewers whose invaluable insights have played a pivotal role in enhancing the quality of this manuscript.

Conflicts of Interest

The authors declare no conflict of interest.

References

  1. He, X.; He, K.S.; Hyvönen, J. Will bryophytes survive in a warming world? Perspect. Plant Ecol. Evol. Syst. 2016, 19, 49–60. [Google Scholar] [CrossRef]
  2. Boch, S.; Muller, J.; Prati, D.; Fischer, M. Low-intensity management promotes bryophyte diversity in grasslands. Tuexenia 2018, 38, 311–328. [Google Scholar] [CrossRef]
  3. Bansal, S.; Nilsson, M.C.; Wardle, D.A. Response of photosynthetic carbon gain to ecosystem retrogression of vascular plants and mosses in the boreal forest. Oecologia 2012, 169, 661–672. [Google Scholar] [CrossRef] [PubMed]
  4. Turetsky, M.R.; Bond-Lamberty, B.; Euskirchen, E.; Talbot, J.; Frolking, S.; McGuire, A.D.; Tuittila, E.S. The resilience and functional role of moss in boreal and arctic ecosystems. New Phytol. 2012, 196, 49–67. [Google Scholar] [CrossRef]
  5. Wang, S.Q.; Zhang, Z.H.; Wang, Z.H. Bryophyte communities as biomonitors of environmental factors in the Goujiang karst bauxite, southwestern China. Sci. Total Environ. 2015, 538, 270–278. [Google Scholar] [CrossRef] [PubMed]
  6. Greenwood, J.L.; Stark, L.R.; Chiquoine, L.P. Effects of Rate of Drying, Life History Phase, and Ecotype on the Ability of the Moss Bryum Argenteum to Survive Desiccation Events and the Influence on Conservation and Selection of Material for Restoration. Front. Ecol. Evol. 2019, 7, 388. [Google Scholar] [CrossRef]
  7. Ren, J.; Liu, F.; Luo, Y.; Zhu, J.; Luo, X.Q.; Liu, R. The Pioneering Role of Bryophytes in Ecological Restoration of Manganese Waste Residue Areas, Southwestern China. J. Chem. 2021, 2021, 9969253. [Google Scholar] [CrossRef]
  8. Di Nuzzo, L.; Vallese, C.; Benesperi, R.; Giordani, P.; Chiarucci, A.; Di Cecco, V.; Di Martino, L.; Di Musciano, M.; Gheza, G.; Lelli, C.; et al. Contrasting multitaxon responses to climate change in Mediterranean mountains. Sci. Rep. 2021, 11, 4438. [Google Scholar] [CrossRef]
  9. Frahm, J.P.; Newton, A.E. A new contribution to the moss flora of Dominican amber. Bryologist 2005, 108, 526–536. [Google Scholar] [CrossRef]
  10. Berdugo, M.B.; Quant, J.M.; Wason, J.W.; Dovciak, M. Latitudinal patterns and environmental drivers of moss layer cover in extratropical forests. Glob. Ecol. Biogeogr. 2018, 27, 1213–1224. [Google Scholar] [CrossRef]
  11. Kropik, M.; Zechmeister, H.G.; Moser, D.; Bernhardt, K.G.; Dullinger, S. Deadwood volumes matter in epixylic bryophyte conservation, but precipitation limits the establishment of substrate-specific communities. For. Ecol. Manag. 2021, 493, 119285. [Google Scholar] [CrossRef]
  12. Zander, R. Genera of the Pottiaceae: Mosses of Harsh Environments; Buffalo Society of Natural Sciences Press: New York, NY, USA, 1993; Volume 32. [Google Scholar]
  13. Song, S.S.; Liu, X.H.; Bai, X.L.; Jiang, Y.B.; Zhang, X.Z.; Yu, C.Q.; Shao, X.M. Impacts of Environmental Heterogeneity on Moss Diversity and Distribution of Didymodon (Pottiaceae) in Tibet, China. PLoS ONE 2015, 10, e0132346. [Google Scholar] [CrossRef] [PubMed]
  14. Kou, J.; Feng, C.; Jiang, Y.-B.; Shao, X.-M. Didymodon alpinus (Pottiaceae), a new species from Tibet, China. J. Bryol. 2017, 39, 308–312. [Google Scholar] [CrossRef]
  15. Kou, J.; Feng, C.; Shao, X.-M. Didymodon obtusus (Bryophyta, Pottiaceae), a new species from Tibet, China. Phytotaxa 2018, 372, 97–103. [Google Scholar] [CrossRef]
  16. Kou, J.; Wang, T.; Yu, F.; Sun, Y.; Feng, C.; Shao, X. The moss genus Didymodon as an indicator of climate change on the Tibetan Plateau. Ecol. Indic. 2020, 113, 106204. [Google Scholar] [CrossRef]
  17. Jia, S.-H.; Zhang, Z.-H. Diversity of the Bryophytes and Their Roles in Soil and Water Conservation in Karst City Rocky Desertification. Res. Soil Water Conserv. 2014, 21, 100–105. [Google Scholar] [CrossRef]
  18. Tian, G.Q.; Zhao, D.P. Species composition of bryophyte crusts and microhabitat formation under artificial vegetations in Huangfuchuan watershed, Inner Mongolia, China. Chin. J. Ecol. 2015, 34, 2448–2456. [Google Scholar]
  19. Kürschner, H.; Neef, R. A collection of bryophytes from the Tigray province, N Ethiopia and first evidence for a Syntrichion laevipilae Ochsner 1928 community in xerotropical Africa. Nova Hedwig. 2012, 95, 403–422. [Google Scholar] [CrossRef]
  20. Kürschner, H.; Shumilovskikh, L.; Djamali, M.; de Beaulieu, J.L. A late Holocene subfossil record of Sphagnum squarrosum Crome (Sphagnopsida, Bryophyta) from NW Iran. Nova Hedwig. 2015, 100, 373–381. [Google Scholar] [CrossRef]
  21. You, J.L.; Qin, X.P.; Ranjitkar, S.; Lougheed, S.C.; Wang, M.C.; Zhou, W.; Ouyang, D.X.; Zhou, Y.; Xu, J.C.; Zhang, W.J.; et al. Response to climate change of montane herbaceous plants in the genus Rhodiola predicted by ecological niche modelling. Sci. Rep. 2018, 8, 5879. [Google Scholar] [CrossRef]
  22. Yu, H.; Cooper, A.R.; Infante, D.M. Improving species distribution model predictive accuracy using species abundance: Application with boosted regression trees. Ecol. Model. 2020, 432, 109202. [Google Scholar] [CrossRef]
  23. Yi, Y.-j.; Cheng, X.; Yang, Z.-F.; Zhang, S.-H. Maxent modeling for predicting the potential distribution of endangered medicinal plant (H. riparia Lour) in Yunnan, China. Ecol. Eng. 2016, 92, 260–269. [Google Scholar] [CrossRef]
  24. Tarnian, F.; Kumar, S.; Azarnivand, H.; Chahouki, M.A.Z.; Mossivand, A.M. Assessing the effects of climate change on the distribution of Daphne mucronata in Iran. Environ. Monit. Assess. 2021, 193, 562. [Google Scholar] [CrossRef] [PubMed]
  25. Sérgio, C.; Figueira, R.; Draper, D.; Menezes, R.; Sousa, A.J. Modelling bryophyte distribution based on ecological information for extent of occurrence assessment. Biol. Conserv. 2007, 135, 341–351. [Google Scholar] [CrossRef]
  26. Kong, F.; Tang, L.; He, H.; Yang, F.X.; Tao, J.; Wang, W.C. Assessing the impact of climate change on the distribution of Osmanthus fragrans using Maxent. Environ. Sci. Pollut. Res. 2021, 28, 34655–34663. [Google Scholar] [CrossRef] [PubMed]
  27. Liu, S.; Liang, X.-Z.; Gao, W.; Stohlgren, T.J. Regional climate model downscaling may improve the prediction of alien plant species distributions. Front. Earth Sci. 2014, 8, 457–471. [Google Scholar] [CrossRef]
  28. Abdelaal, M.; Fois, M.; Fenu, G.; Bacchetta, G. Using MaxEnt modeling to predict the potential distribution of the endemic plant Rosa arabica Crep. in Egypt. Ecol. Inform. 2019, 50, 68–75. [Google Scholar] [CrossRef]
  29. Gonzalez, I.; Hebel, I.; Jaña, R. Distribución potencial de Sanionia spp. en dos momentos del Holoceno en península Fildes isla Rey Jorge Antártica. Anales del Instituto de la Patagonia 2019, 47, 7–17. [Google Scholar] [CrossRef]
  30. Nzei, J.M.; Ngarega, B.K.; Mwanzia, V.M.; Musili, P.M.; Wang, Q.-F.; Chen, J.-M. The past, current, and future distribution modeling of four water lilies (Nymphaea) in Africa indicates varying suitable habitats and distribution in climate change. Aquat. Bot. 2021, 173, 103416. [Google Scholar] [CrossRef]
  31. Yusup, S.; Sulayman, M.; Ilghar, W.; Zhang, Z.X. Prediction of potential distribution of Didymodon ( Bryophyta, Pottiaceae) in Xinjiang based on the MaxEnt model. Plant Sci. J. 2018, 36, 541–553. [Google Scholar]
  32. Ochyra, R.; Bednarek-Ochyra, H. The Correct Name for Didymodon Validus (Bryophyta, Pottiaceae) at Variety Rank. Pol. Bot. J. 2017, 62, 183–186. [Google Scholar] [CrossRef]
  33. Kou, J.; Feng, C.; Bai, X.L.; Chen, H. Morphology and taxonomy of leaf papillae and mammillae in Pottiaceae of China. J. Syst. Evol. 2014, 52, 521–532. [Google Scholar] [CrossRef]
  34. Zhang, G.-L.; Feng, C.; Kou, J.; Han, Y.; Zhang, Y.; Xiao, H.-X. Phylogeny and divergence time estimation of the genus Didymodon (Pottiaceae) based on nuclear and chloroplast markers. J. Syst. Evol. 2023, 61, 115–126. [Google Scholar] [CrossRef]
  35. Ren, D.M. Studies on Taxonomy and Flora of Pottiaceae in China. Doctoral Thesis, Inner Mongol University, Hohhot, China, 2012. [Google Scholar]
  36. Jia, Y.; He, S. Species Catalogue of China. Volume 1, Plants, Bryophytes; Science Press: Beijing, China, 2013. [Google Scholar]
  37. Yusup, S.; Sulayman, M.; Zhao, D.P. Didymodon validus Limpr., New to the moss flora of China. Acta Bot. Boreali Occident. Sin. 2017, 37, 1038–1041. [Google Scholar]
  38. Zhang, Z.Y.; Zhang, L.; Li, Y.H.; He, X.L. Study on the diversity of soil macrofauna in different habitats in Shilin karsts of Yunnan Province, China. For. Res. 2005, 18, 701–705. [Google Scholar]
  39. Yehya, M.; Aziz, R.; Sulayman, M. Taxonomy and distribution of Aloina Kindb. in Xinjiang, China. Plant Sci. 2020, 38, 448–457. [Google Scholar]
  40. Hijmans, R.; Cameron, S.; Parra, J.; Jones, P.; Jarvis, A. Very high resolution interpolated climate surfaces of global land areas. Int. J. Climatol. 2005, 25, 1965–1978. [Google Scholar] [CrossRef]
  41. IPCC. Summer for Policymakers, Climate Change 2014: Impacts, Adaptation, and Vulnerability; Cambridge University Press: Cambridge, UK, 2014. [Google Scholar]
  42. Phillips, S.J.; Anderson, R.P.; Schapire, R.E. Maximum entropy modeling of species geographic distributions. Ecol. Model. 2006, 190, 231–259. [Google Scholar] [CrossRef]
  43. Hoveka, L.N.; Bezeng, B.S.; Yessoufou, K.; Boatwright, J.S.; Van der Bank, M. Effects of climate change on the future distributions of the top five freshwater invasive plants in South Africa. S. Afr. J. Bot. 2016, 102, 33–38. [Google Scholar] [CrossRef]
  44. Phillips, S.J.; Dudík, M.; Elith, J.; Graham, C.H.; Lehmann, A.; Leathwick, J.; Ferrier, S. Sample selection bias and presence-only distribution models: Implications for background and pseudo-absence data. Ecol. Appl. 2009, 19, 181–197. [Google Scholar] [CrossRef]
  45. Zhang, K.; Zhang, Y.; Tao, J. Predicting the Potential Distribution of Paeonia veitchii (Paeoniaceae) in China by Incorporating Climate Change into a Maxent Model. Forests 2019, 10, 190. [Google Scholar] [CrossRef]
  46. Thuiller, W. Patterns and uncertainties of species’ range shifts under climate change. Glob. Change Biol. 2004, 10, 2020–2027. [Google Scholar] [CrossRef]
  47. Brown, J.L. SDMtoolbox: A python-based GIS toolkit for landscape genetic, biogeographic and species distribution model analyses. Methods Ecol. Evol. 2014, 5, 694–700. [Google Scholar] [CrossRef]
  48. Allouche, O.; Tsoar, A.; Kadmon, R. Assessing the accuracy of species distribution models: Prevalence, kappa and the true skill statistic (TSS). J. Appl. Ecol. 2006, 43, 1223–1232. [Google Scholar] [CrossRef]
  49. Pepe, G.; Giusti, B.; Yacoub, M. An expanding role of biomarkers in acute aortic syndromes. Clin. Cardiol. 2006, 29, 432–433. [Google Scholar] [CrossRef]
  50. Pearce, J.; Ferrier, S. Evaluating the predictive performance of habitat models developed using logistic regression. Ecol. Model. 2000, 133, 225–245. [Google Scholar] [CrossRef]
  51. del Hoyo, L.V.; Martin Isabel, M.P.; Martinez Vega, F.J. Logistic regression models for human-caused wildfire risk estimation: Analysing the effect of the spatial accuracy in fire occurrence data. Eur. J. For. Res. 2011, 130, 983–996. [Google Scholar] [CrossRef]
  52. Thuiller, W.; Lafourcade, B.; Engler, R.; Araújo, M.B. BIOMOD—A platform for ensemble forecasting of species distributions. Ecography 2009, 32, 369–373. [Google Scholar] [CrossRef]
  53. Jiménez, J.A. Taxonomic revision of the genus Didymodon Hedw. (Pottiaceae, Bryophyta) in Europe, North Africa and Southwest and Central Asia. J. Hattori Bot. Lab. 2006, 100, 211–292. [Google Scholar]
  54. Ma, B.; Sun, J. Predicting the distribution of Stipa purpurea across the Tibetan Plateau via the MaxEnt model. BMC Ecol. 2018, 18, 10. [Google Scholar] [CrossRef]
  55. Baye, T.M.; Abebe, T.; Wilke, R.A. Genotype-environment interactions and their translational implications. Pers. Med. 2011, 8, 59–70. [Google Scholar] [CrossRef] [PubMed]
  56. Hernandez, P.A.; Graham, C.H.; Master, L.L.; Albert, D.L. The effect of sample size and species characteristics on performance of different species distribution modeling methods. Ecography 2006, 29, 773–785. [Google Scholar] [CrossRef]
  57. Merow, C.; Smith, M.J.; Silander, J.A., Jr. A practical guide to MaxEnt for modeling species’ distributions: What it does, and why inputs and settings matter. Ecography 2013, 36, 1058–1069. [Google Scholar] [CrossRef]
  58. Li, Y.; Cao, W.; He, X.Y.; Chen, W.; Xu, S. Prediction of Suitable Habitat for Lycophytes and Ferns in Northeast China: A Case Study on Athyrium brevifrons. Chin. Geogr. Sci. 2019, 29, 1011–1023. [Google Scholar] [CrossRef]
  59. Wan, J.Z.; Wang, C.J.; Han, S.J.; Yu, J.H. Planning the priority protected areas of endangered orchid species in northeastern China. Biodivers. Conserv. 2014, 23, 1395–1409. [Google Scholar] [CrossRef]
  60. Ficetola, G.F.; Thuiller, W.; Miaud, C. Prediction and validation of the potential global distribution of a problematic alien invasive species—The American bullfrog. Divers. Distrib. 2007, 13, 476–485. [Google Scholar] [CrossRef]
  61. Kumar, P. Assessment of impact of climate change on Rhododendrons in Sikkim Himalayas using Maxent modelling: Limitations and challenges. Biodivers. Conserv. 2012, 21, 1251–1266. [Google Scholar] [CrossRef]
  62. Kramer-Schadt, S.; Niedballa, J.; Pilgrim, J.D.; Schröder, B.; Lindenborn, J.; Reinfelder, V.; Stillfried, M.; Heckmann, I.; Scharf, A.K.; Augeri, D.M.; et al. The importance of correcting for sampling bias in MaxEnt species distribution models. Divers. Distrib. 2013, 19, 1366–1379. [Google Scholar] [CrossRef]
  63. Bátori, Z.; Vojtkó, A.; Farkas, T.; Szabó, A.; Havadtői, K.; Vojtkó, A.E.; Tölgyesi, C.; Cseh, V.; Erdős, L.; Maák, I.E.; et al. Large- and small-scale environmental factors drive distributions of cool-adapted plants in karstic microrefugia. Ann. Bot. 2017, 119, 301–309. [Google Scholar] [CrossRef]
  64. Scherrer, D.; Körner, C. Topographically controlled thermal-habitat differentiation buffers alpine plant diversity against climate warming. J. Biogeogr. 2011, 38, 406–416. [Google Scholar] [CrossRef]
  65. Ronikier, M.; Schneeweiss, G.M.; Schönswetter, P. The extreme disjunction between Beringia and Europe in Ranunculus glacialis s. l. (Ranunculaceae) does not coincide with the deepest genetic split—A story of the importance of temperate mountain ranges in arctic-alpine phylogeography. Mol. Ecol. 2021, 21, 5561–5578. [Google Scholar] [CrossRef] [PubMed]
  66. Adhikari, D.; Barik, S.K.; Upadhaya, K. Habitat distribution modelling for reintroduction of Ilex khasiana Purk., a critically endangered tree species of northeastern India. Ecol. Eng. 2012, 40, 37–43. [Google Scholar] [CrossRef]
  67. Spitale, D. The interaction between elevational gradient and substratum reveals how bryophytes respond to the climate. J. Veg. Sci. 2016, 27, 844–853. [Google Scholar] [CrossRef]
  68. Maciel-Silva, A.S.; Válio, I.F.M. Reproductive phenology of bryophytes in tropical rain forests: The sexes never sleep. Bryologist 2011, 114, 708–719. [Google Scholar] [CrossRef]
  69. Cleavitt, N. Comparative ecology of a lowland and a subalpine species of Mnium in the northern Rocky Mountains. Plant Ecol. 2004, 174, 205–216. [Google Scholar] [CrossRef]
  70. Alatalo, J.M.; Jägerbrand, A.K.; Molau, U. Climate change and climatic events: Community-, functional- and species-level responses of bryophytes and lichens to constant, stepwise, and pulse experimental warming in an alpine tundra. Alp. Bot. 2014, 124, 81–91. [Google Scholar] [CrossRef]
  71. Zheng, B.X.; Xu, Q.Q.; Shen, Y.P. The relationship between climate change and Quaternary glacial cycles on the Qinghai-Tibetan Plateau: Review and speculation. Quat. Int. 2002, 97–98, 93–101. [Google Scholar] [CrossRef]
  72. Bellard, C.; Bertelsmeier, C.; Leadley, P.; Thuiller, W.; Courchamp, F. Impacts of climate change on the future of biodiversity. Ecol. Lett. 2012, 15, 365–377. [Google Scholar] [CrossRef]
  73. Zhao, H.X.; Zhang, H.; Xu, C.G. Study on Taiwania cryptomerioides under climate change: MaxEnt modeling for predicting the potential geographical distribution. Glob. Ecol. Conserv. 2020, 24, e01313. [Google Scholar] [CrossRef]
  74. Zheng, H.-Y.; Guo, X.-L.; Price, M.; He, X.-J.; Zhou, S.-D. Effects of Mountain Uplift and Climatic Oscillations on Phylogeography and Species Divergence of Chamaesium (Apiaceae). Front. Plant Sci. 2021, 12, 673200. [Google Scholar] [CrossRef]
  75. Lister, A.M. The impact of Quaternary Ice Ages on mammalian evolution. Philos. Trans. R. Soc. B Biol. Sci. 2004, 359, 221–241. [Google Scholar] [CrossRef] [PubMed]
  76. Botts, E.A.; Erasmus, B.F.N.; Alexander, G.J. Small range size and narrow niche breadth predict range contractions in South African frogs. Glob. Ecol. Biogeogr. 2013, 22, 567–576. [Google Scholar] [CrossRef]
  77. Dubos, N.; Frederique, M.; Grinand, C.; Nourtier, M.; Deso, G.; Jean-Michel, P.; Razafimanahaka, J.; Andriantsimanarilafy, R.; Rakotondrasoa, E.; Razafindraibe, P.; et al. Are narrow-ranging species doomed to extinction? Projected dramatic decline in future climate suitability of two highly threatened species. Perspect. Ecol. Conserv. 2021, 20, 18–28. [Google Scholar] [CrossRef]
  78. Chevin, L.-M.; Lande, R.; Mace, G.M. Adaptation, Plasticity, and Extinction in a Changing Environment: Towards a Predictive Theory. PLoS Biol. 2010, 8, e1000357. [Google Scholar] [CrossRef] [PubMed]
  79. Hoffmann, A.A.; Sgrò, C.M. Climate change and evolutionary adaptation. Nature 2011, 470, 479–485. [Google Scholar] [CrossRef]
Figure 1. Distribution occurrence of D. validus in China.
Forests 14 02227 g001
Figure 2. Didymodon validus. (A) Plants when dry (scale in mm). (B) Plants when moist (scale in mm). (C) Leaves. (D) Leaf apex (dorsal). (E) Upper laminal cells. (FJ) Transverse section of leaf, sequentially from apex to base. Scale bar on (J): (C)—1 mm; (D,FJ)—100 μm; (E)—40 μm.
Forests 14 02227 g002
Figure 3. Potential suitable distribution areas for D. validus in China based on the MaxEnt model under different climatic conditions.
Forests 14 02227 g003
Figure 4. Proportions of areas within the four suitability classes of potential distributions of D. validus in China.
Forests 14 02227 g004
Figure 5. Jackknife test for evaluating the relative importance of environmental variables for distribution of D. validus in China.
Forests 14 02227 g005
Figure 6. Response curves of records of nine environmental predictors used in the ecological niche model for D. validus.
Forests 14 02227 g006
Figure 7. Species distribution models (SDMs) of D. validus. Models reflect habitat differences compared with the current model.
Forests 14 02227 g007
Figure 8. The distribution shifts of D. validus under different climate scenarios. (a) Dynamic changes in the distribution area of D. validus under four future and three past climate scenarios compared to the current suitable habitat area. (b) Core distribution shifts of D. validus under the four future and three past climate scenarios.
Forests 14 02227 g008
Disclaimer/Publisher’s Note: The statements, opinions and data contained in all publications are solely those of the individual author(s) and contributor(s) and not of MDPI and/or the editor(s). MDPI and/or the editor(s) disclaim responsibility for any injury to people or property resulting from any ideas, methods, instructions or products referred to in the content.

