Article

Changes in Soil Fungal Diversity and Composition along a Rural–Urban Gradient

Department of Environmental Sciences, University of Basel, Bernoullistrasse 30, 4056 Basel, Switzerland
*
Author to whom correspondence should be addressed.
Forests 2023, 14(11), 2226; https://doi.org/10.3390/f14112226
Submission received: 14 September 2023 / Revised: 5 November 2023 / Accepted: 6 November 2023 / Published: 11 November 2023
(This article belongs to the Section Forest Biodiversity)

Abstract

:
The functioning of forest ecosystems depends on the taxonomic and ecological diversity of soil fungi. Urbanization is increasing worldwide and is regarded as a key driver of environmental change altering local species assemblages in urban forest. We investigated whether the degree of urbanization and local forest characteristics affect the soil fungal community in 20 beech forests located along a rural–urban gradient in the city of Basel and its suburbs (Switzerland). We analyzed their soil fungal communities by DNA metabarcoding of the rDNA ITS2 region and related these data to local forest vegetation characteristics and soil properties. The number of fungal OTUs in the 20 forests examined ranged from 170 to 303. Richness, diversity and evenness of fungal communities were all significantly affected by the degree of urbanization, but in different ways. Soil fungal richness was highest in forests in areas with a low degree of urbanization and lowest in forests in rural areas. In contrast, the fungal community diversity increased with the increasing degree of urbanization. Different fungal phyla and fungal guilds showed distinct patterns in their relative abundance along the rural–urban gradient. The degree of urbanization reduced the relative abundance of symbiotrophic fungi, but increased that of saprotrophic and pathotrophic fungi. Our results show that urbanization changes soil fungal community, which in turn can lead to alterations in forest ecosystems.

1. Introduction

Urbanization is increasing worldwide and is considered a key driver of environmental change [1]. Forests represent one of the most frequent types of green space in urban landscapes [2]. Forests provide a wide range of ecosystem functions, from air filtering, temperature regulation, nutrient recycling and storage and recreation for residents to habitats for native plants and animals [3]. However, urban forests are influenced by the environmental conditions of the built-up areas in the surroundings. Several studies have reported changes in abiotic conditions in forest areas, such as an increase in temperature and nitrogen deposition and a decrease in precipitation, along a rural–urban gradient [4]. These changes affect habitat quality and thus species richness, species composition and the functional diversity of plants and animals in urban forests [5,6,7], which in turn influence the functioning of ecosystems [8].
Soil microbial organisms, especially soil fungi, are an important component of forest ecosystems [9]. In particular, the high taxonomic and ecological diversity as well as the high biomass of soil fungi are important for the proper functioning of forest ecosystems [10]. Among other things, fungi mediate important ecosystem processes such as carbon and nutrient cycling [11,12]. In forests, three major functional guilds of soil fungi can be distinguished based on their ecological lifestyle: saprotrophic, symbiotrophic and plant pathotrophic fungi [13]. Saprotrophic fungi are decomposers that gain carbon and nutrients by breaking down dead organic matter. Symbiotrophic fungi form close mutualistic associations with plant roots, facilitating nutrient uptake by their host plant in exchange for photosynthetic carbon products. Mycorrhizal fungi, an essential part of the symbiotrophic fungi, have a key function for the establishment and growth of many plants and thus for the natural regeneration and structure of forests [14]. Plant pathotrophic fungi comprise a heterogeneous group of soil fungi that infect the roots of various herbaceous plant and tree species and are mostly non-host-specific necrotrophs [15]. Thus, plant pathotrophic fungi have the potential to change the composition of herbaceous plant and tree species [16]. As a consequence, the altered forest structure can lead to shifts in the composition of soil fungi and thus influence nutrient cycling [17].
Most studies examining the effects of urbanization on the soil microbial community have focused on soil bacteria, while less attention has been directed to soil fungi. The few studies on soil fungal communities in urban habitats have shown contrasting results. Urbanization reduced the abundance and diversity of soil fungi in some studies [18,19]. However, other studies reported an increase in fungal species richness from rural areas to the inner city [20,21]. Still other studies found only a weak or no effect of urbanization on soil fungal diversity [22,23].
In our study, we used a standardized sampling procedure to investigate whether the degree of urbanization, local forest characteristics or soil properties influence the soil fungal community. We selected 20 beech forests along a rural–urban gradient in the city of Basel and its suburbs (Switzerland). We recorded the abundance and species composition of herbaceous plants, shrubs and trees in each forest and collected soil samples for analysis of soil fungi and assessment of various chemical soil properties. The soil fungal community was analyzed by DNA metabarcoding of the rDNA ITS2 region.
We tested the following hypotheses:
(1)
Spores are the main dispersal mode of fungi [24]. Forest patches in urban environments receive reduced numbers of migrating fungal spores, which could result in decreased fungal diversity and altered composition of the soil fungal community [18]. We therefore hypothesize that the species richness of fungi in the soil decreases with the increasing degree of urbanization and that increasing urbanization leads to shifts in the composition of fungi.
(2)
The different fungal phyla differ in their susceptibility to changes in biotic and abiotic characteristics of temperate forests [25]. Urbanization can change vegetation characteristics and soil properties [26]. We therefore hypothesize that urbanization-induced changes in forest characteristics will affect the different fungal phyla in different ways.
(3)
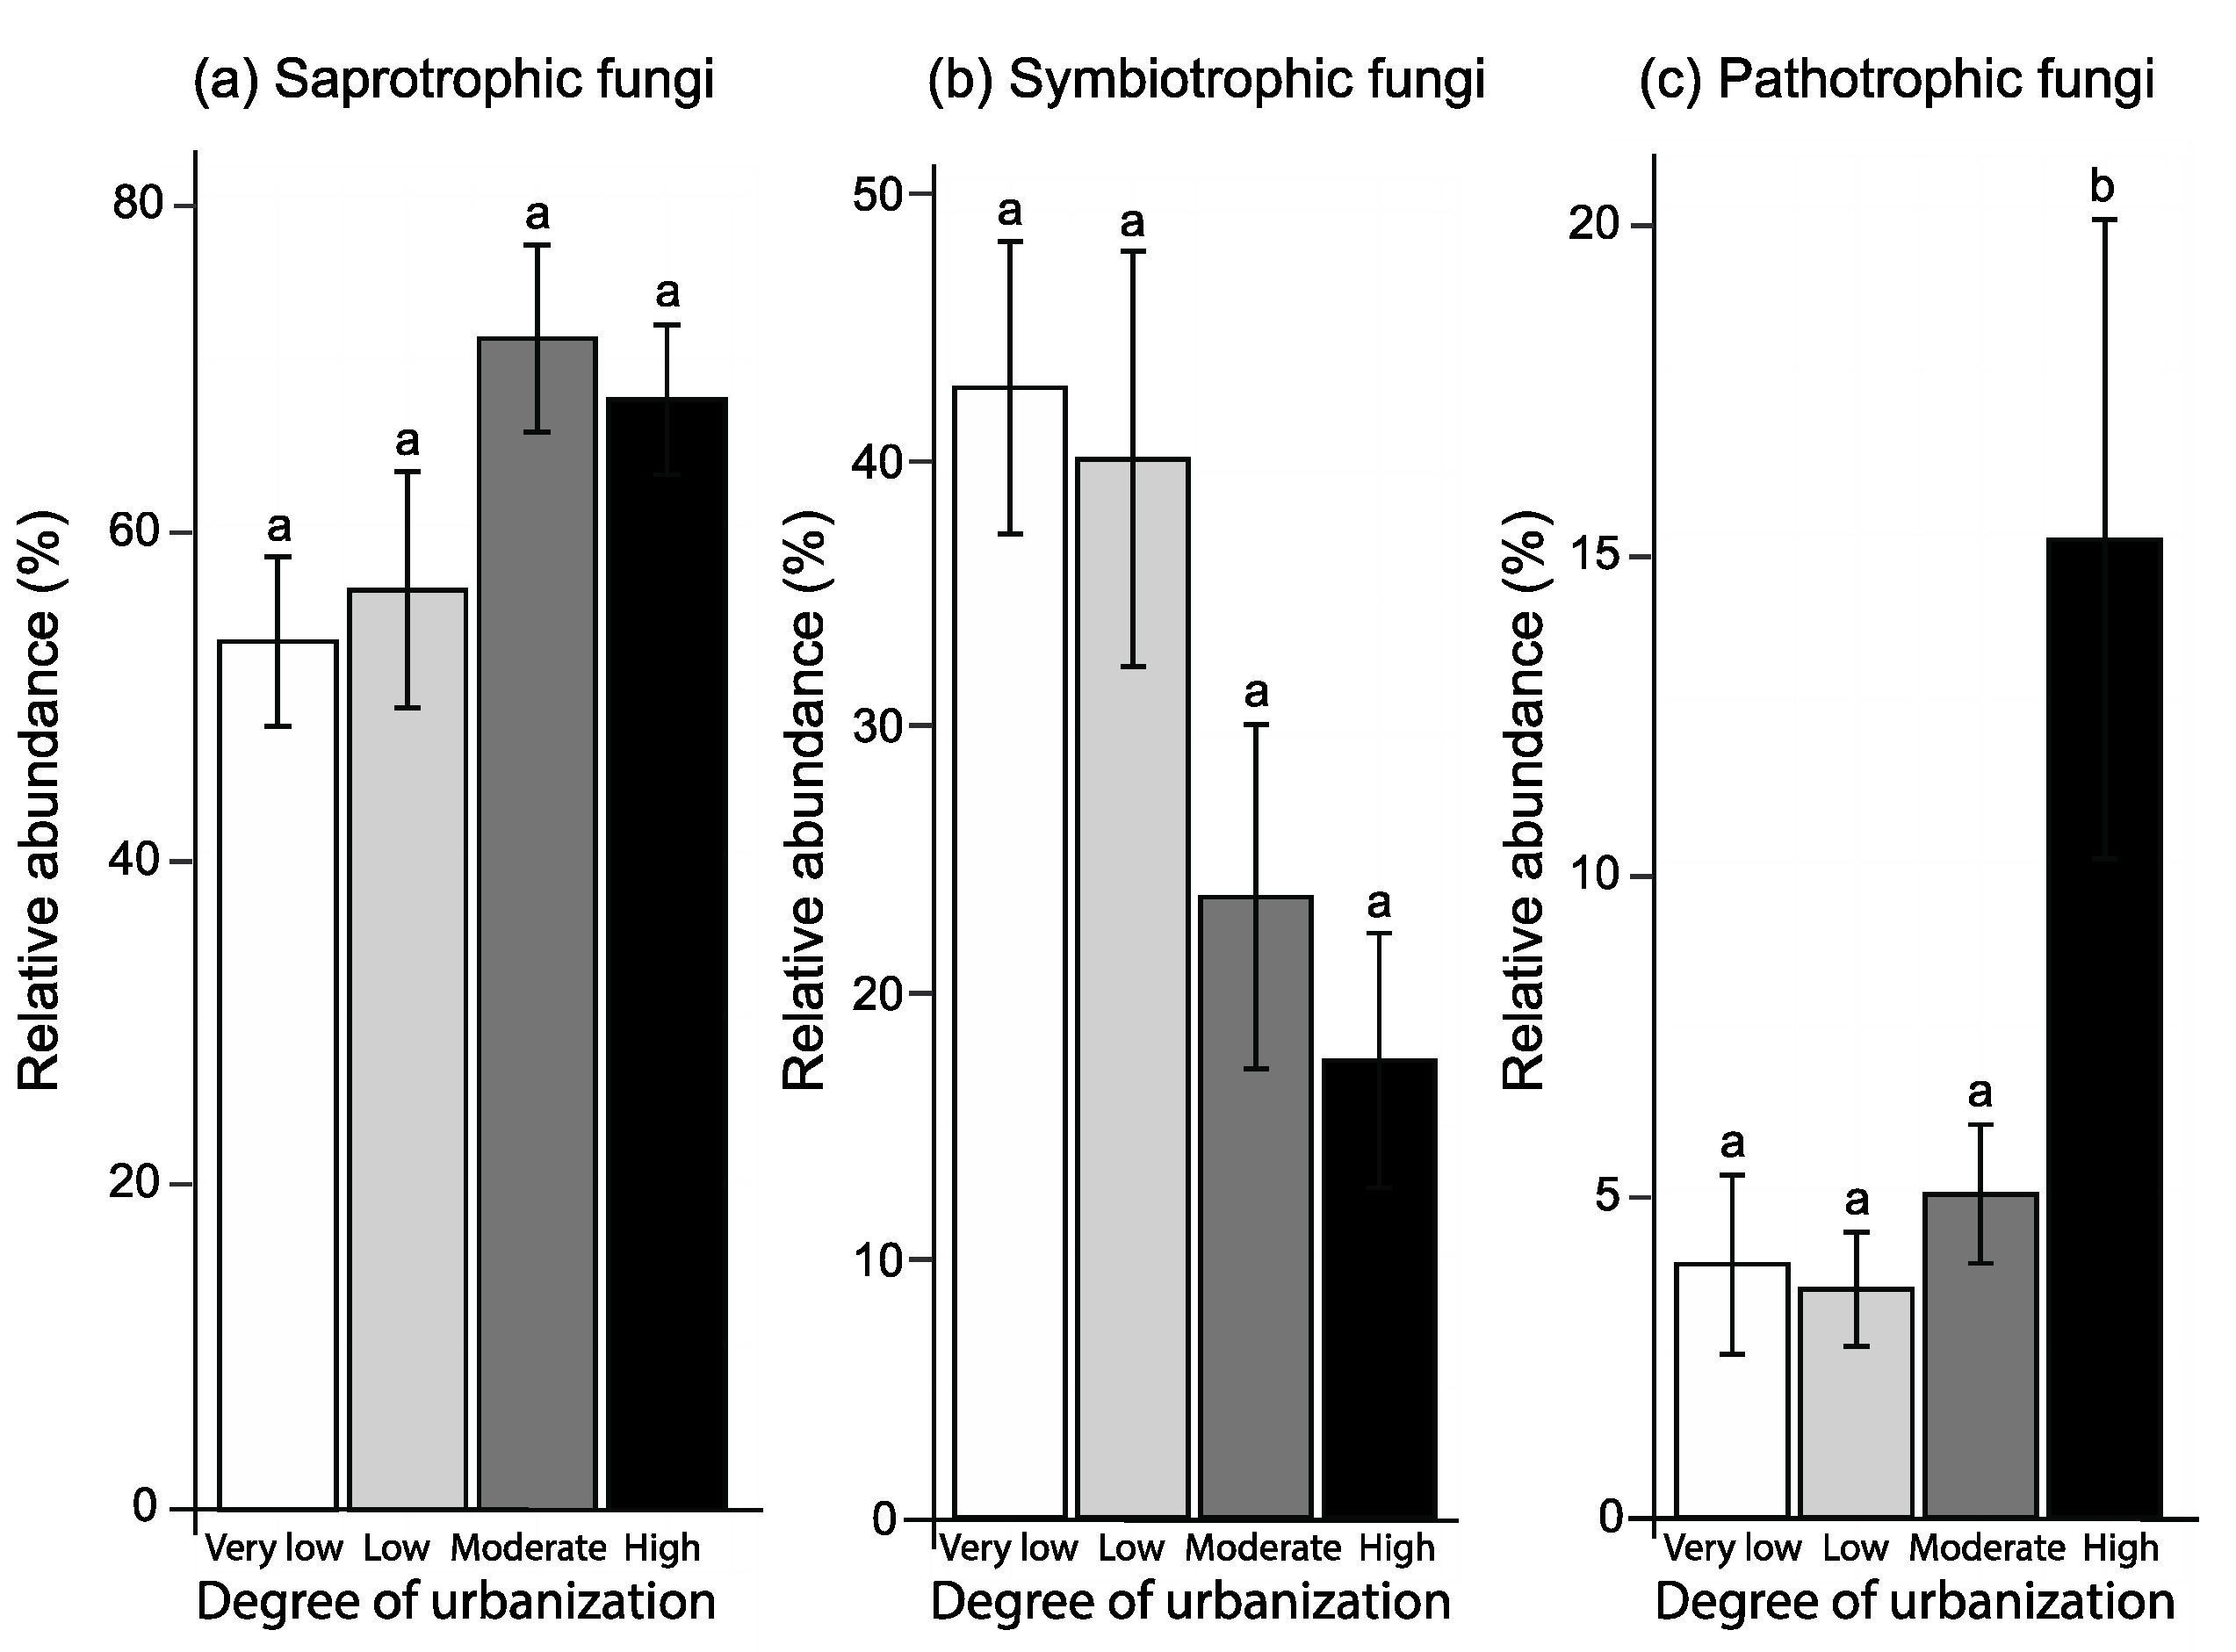
Symbiotrophic fungi are sensitive to disturbances [27]. This may result in a lower abundance and/or species richness of symbiotrophic soil fungi in urban than in rural habitats [28,29]. Based on these findings, we hypothesize that the abundance of symbiotrophic fungi decreases with the increasing degree of urbanization.

2. Materials and Methods
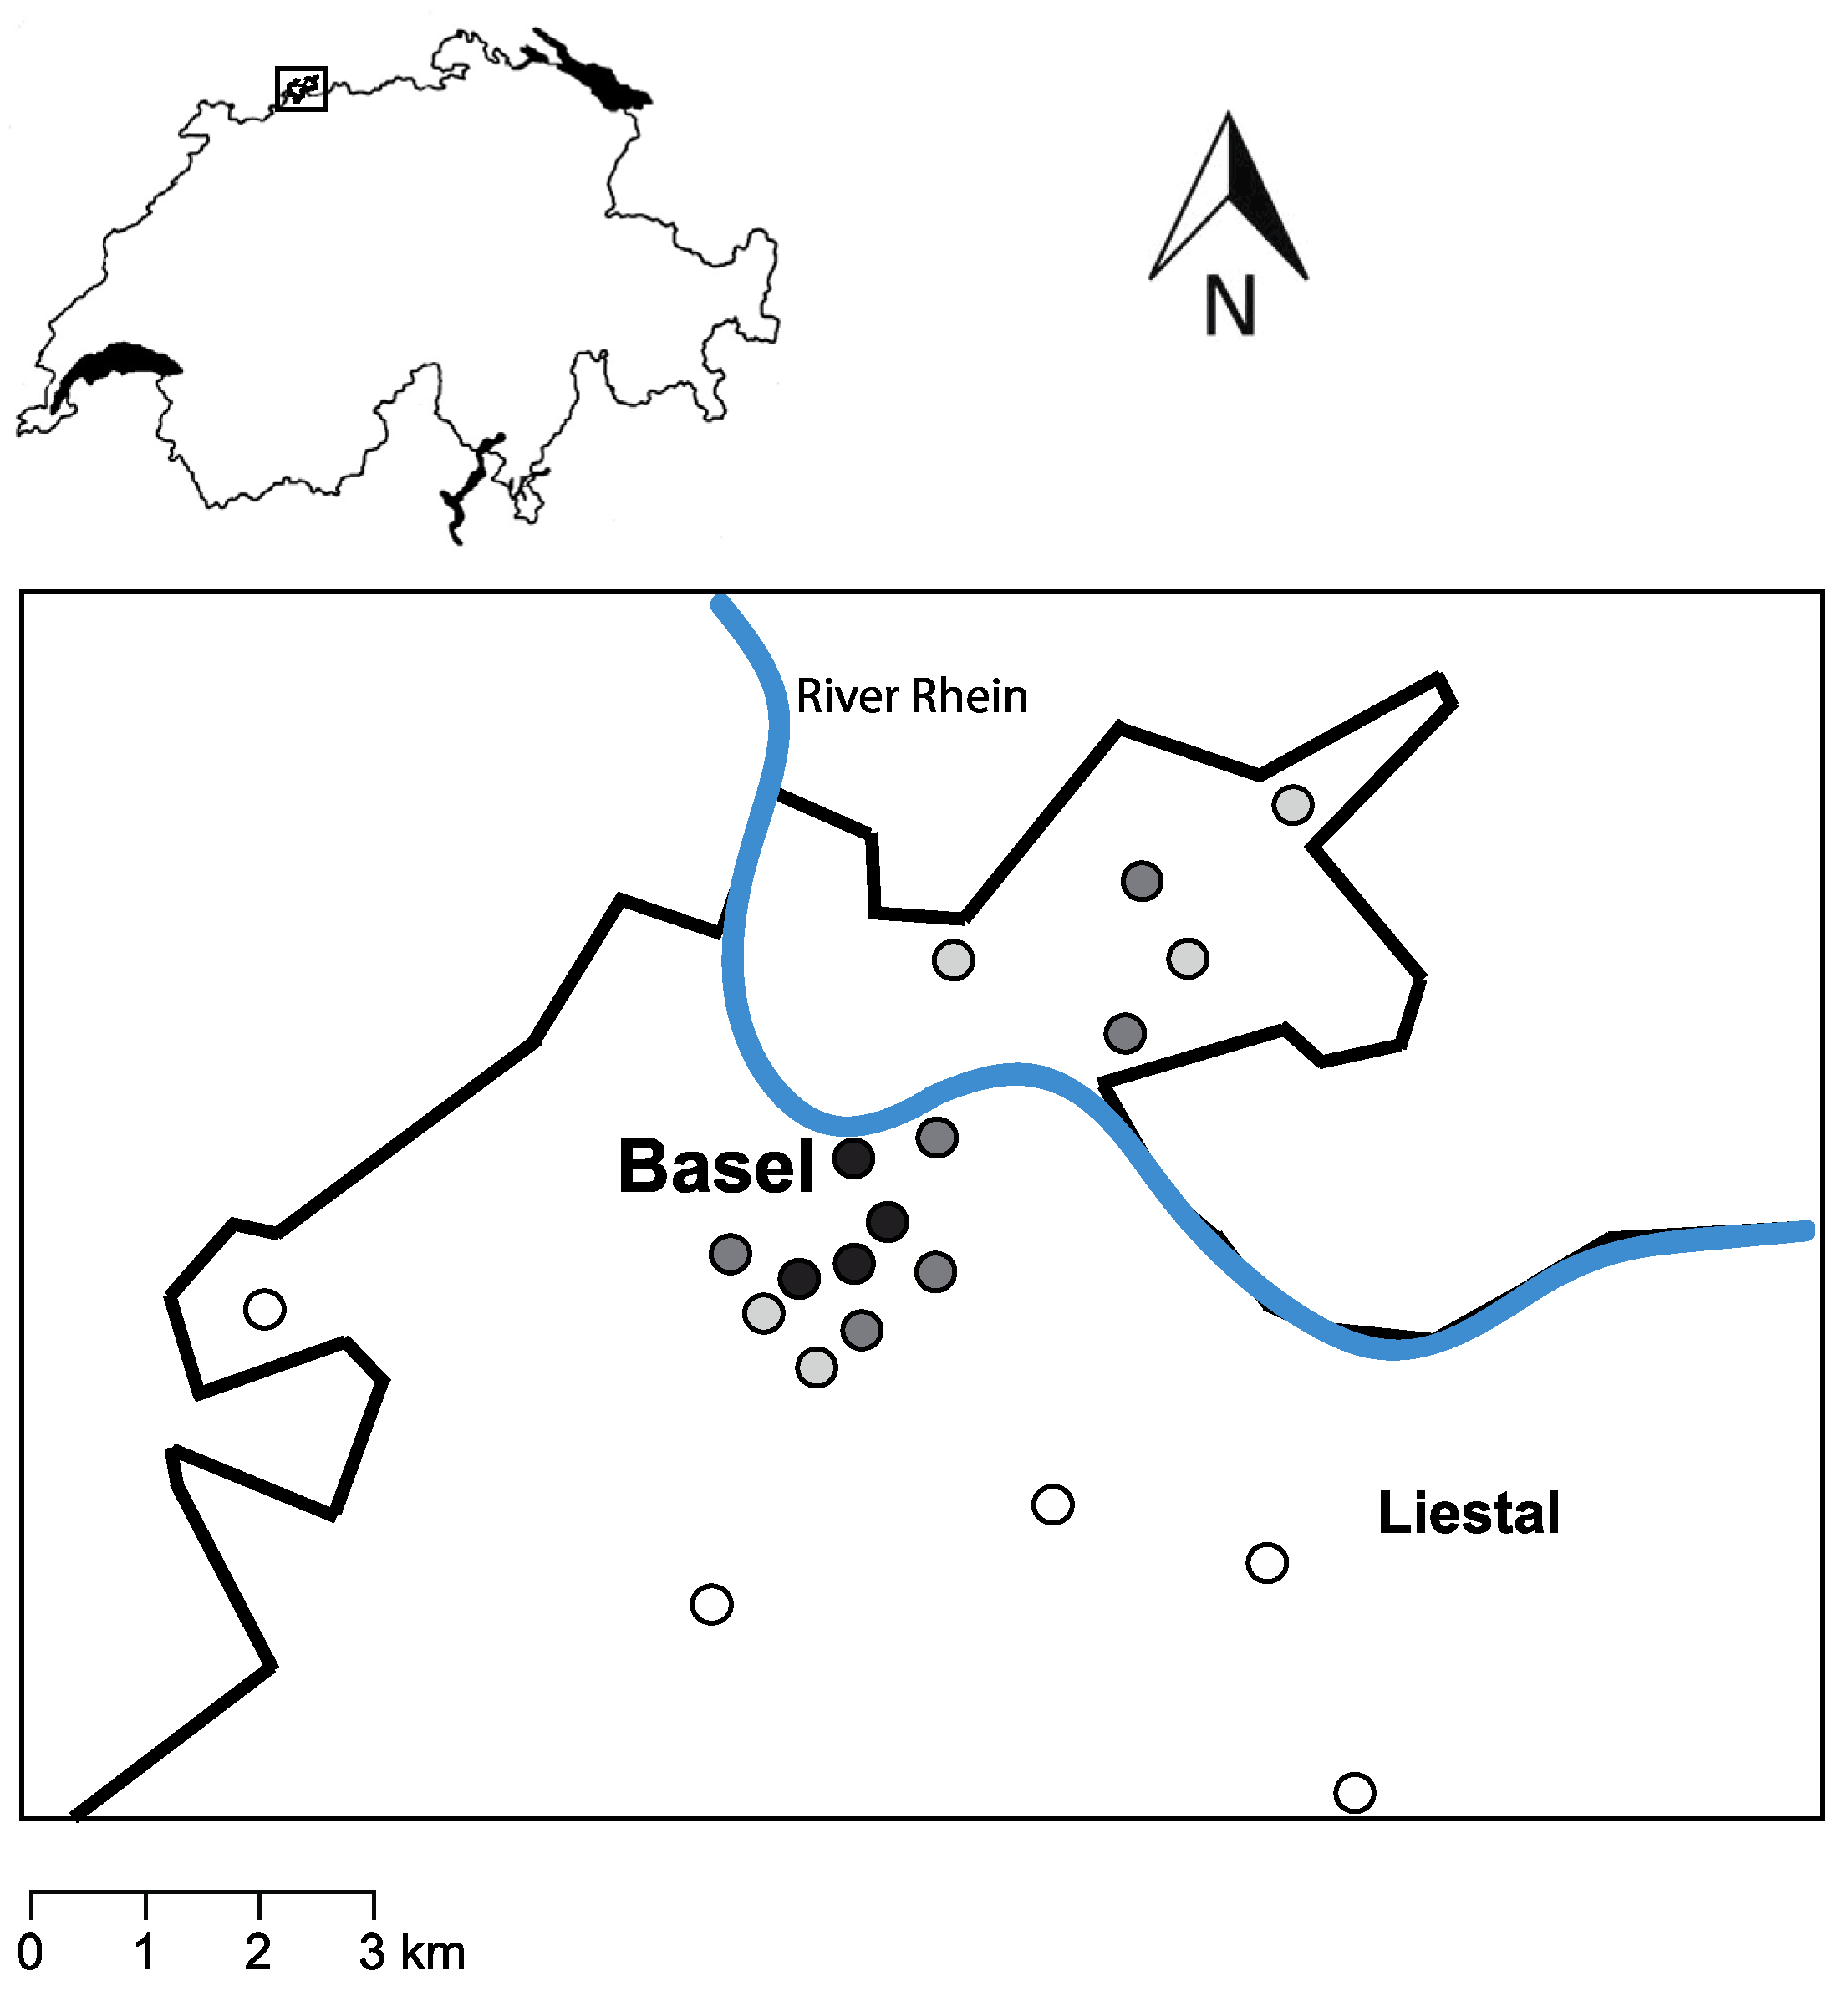
2.1. Study Area

The study was carried out in and around the city of Basel in northwestern Switzerland (47°34′ N, 7°36′ E, elevation: 245–565 m a.s.l.). The study area covers 88.3 km2 and consists of 43.6 km2 (49.4%) residential area, 16.1 km2 (18.3%) agricultural land, 25.5 km2 (28.8%) forest, 2.2 km2 (2.5%) water bodies and 0.9 km2 (1.0%) other areas [30]. Approximately 315,000 people live in Basel and its suburbs with a population density of about 2000 inhabitants per km2 [30]. The total annual precipitation averages 842–1005 mm and the annual mean temperature is 10.2–10.9 °C (average of the records from 1981 to 2010) in the study area.

2.2. Design of the Field Survey

To assess the potential impact of urbanization on the soil fungal community in urban forests, we selected 20 deciduous forests belonging to the Fagetum association [31] along an urbanization gradient (Figure 1). The forests studied ranged in size from 0.23 ha to 337.0 ha and differed in their historical development (Table 1). Fifteen of them are surrounded by settlements and agricultural land and most of them are no longer connected to large continuous forests. Six of these forests were planted after 1884 and six are remnants (fragments) of former large continuous forests, while three forests are part of large continuous forests (>40 ha; Table 1). The remaining five forests are situated in the rural surroundings and are part of large, continuous forests (>76.2 ha; Table 1).
The most abundant tree species in these forests are European beech (Fagus sylvatica), sycamore (Acer pseudoplatanus) and European oak (Quercus robur). The ground vegetation in the forests shows a high richness of vernal geophytes, including Anemone nemorosa, Ranunculus ficaria, Polygonatum multiflorum and Arum maculatum [31]. The soil in the study area is a Haplic Luvisol with a characterized thick humic Ah horizon (0–10 cm) containing fragments of limestone and carbonate concretions, a B horizon 60–80 cm thick with a moderate clay content, limestone fragments and carbonate concretions, a C horizon of various thickness with abundant limestone fragments and limestone as the parent rock [32]. Most forests were state-owned and accessible to the public. Some forests are privately owned but managed by the forestry authorities.
In each forest, we chose an area dominated by European beech (80%–90% of all tree individuals) and set up a study plot measuring 10 m × 10 m in its center. The study plots had a minimum distance of 5 m to the nearest forest edge or to permanent paths to minimize possible edge effects. The forest management in the study plots (management intensity and time since last thinning) was similar among the forests investigated.
As a measure of the degree of urbanization, we assessed the percentage of sealed areas within a radius of 500 m from the center of each study plot using satellite images from Google Earth and the pixel count function of Adobe Photoshop (version 10.0.1). Using the same method, we determined the percentage of forest cover within a radius of 500 m from the center of each study plot. The percentage of sealed areas around the study plots ranged from 1 to 69% in the forest examined, and the percentage of forest cover was between 1 and 92% (Table 1).

2.3. Forest Vegetation Survey

In order to investigate the species richness and species composition of the forest vegetation, we set up four sampling plots measuring 4 m × 4 m in each corner of the study plots. Plant species richness and the abundance of individual species in the ground vegetation (≤40 cm) were determined in a randomly chosen 2 m × 2 m subplot in each of the four sampling plots per forest. Plant species cover was estimated using the Domin scale [33]. To complete the list of plant species in a sampling plot, we recorded any additional species found in the other three subplots. In addition, the number of shrub species (0.4–3 m high) and tree species (diameter at breast height, DBH > 10 cm) was recorded in each study plot. The vegetation surveys were carried out in autumn 2020 and spring 2021.

2.4. Soil Sampling and Soil Properties

In spring 2021, we collected five soil samples (one in each corner and one in the center) in each sampling plot. We removed the litter layer and used a metal cylinder (diameter: 5.05 cm; soil volume: 100 cm3) to sample the soil to a depth of 5 cm. We pooled the five soil samples from a sampling plot and transported them on ice to the laboratory where they were sieved (mesh size: 2 mm). This resulted in a total of 80 soil samples (4 sampling plots × 20 forests). One part of each soil sample was stored at −80 °C until DNA extraction, while the remaining part was stored at −20 °C for determination of physiochemical soil properties.
Soil moisture content (%) was determined using the fresh to dry weight ratio. We assessed soil pH in distilled water (1:2.5 soil/water). We determined the total soil organic matter content (SOM, %) as loss-on-ignition of oven-dried soil at 750 °C for 16 h [34]. We assessed total soil nitrogen content (%) using the standard method of Kjeldahl [34]. We also determined the plant-available phosphorus content of soil (μg PO43−/g) using the molybdenum blue method according to Sparks et al. [34].

2.5. Soil Fungal Community

We extracted total soil genomic DNA from 0.5 to 0.6 g soil in triplicate using NucleoSpin Soil kit (Macherey-Nagel, Oensingen, Switzerland) according to the manufacturer’s instructions. The triplicate DNA extracts were combined into one sample and purified using NucleoSpin gDNA Clean-up kit (Macherey-Nagel, Oensingen, Switzerland). We quantified the concentration and purity of DNA using NanoDrop (NanoDrop Technologies Inc., Wilmington, NC, USA), adjusted the sample to 5 ng/µL and stored it at −20 °C.
We analyzed the fungal communities by amplification and sequencing of the internal transcribed spacer 2 region (ITS2) using the primer pair ITS3/ITS4 [35] added with the Illumina adapters. PCR reactions (25 μL) consisted of 5 μL template DNA, 12.5 μL Master Mix (HotStar Taq Master Mix kit; Qiagen, Switzerland), 2.5 μL Primer ITS3 (10 μM), 2.5 μL Primer ITS4 (10 μM) and 2.5 µL sterile water. We achieved the amplification in an Eppendorf Mastercycler Pro (Vaudaux-Eppendorf AG, Schönenbuch, Switzerland) under the following conditions: initial 15 min heat activation step at 94 °C, followed by 35 amplification cycles of denaturation at 94 °C for 40 s, annealing at 55 °C for 40 s and extension at 72 °C for 60 s, with a final extension step at 72 °C for 10 min. PCR reactions were conducted in triplicate.
We sent PCR products to Microsynth AG (Belgach, Switzerland) for sequencing and analysis. Briefly, PCR products were purified, quantified and pooled at equimolar concentrations for sequencing on an Illumina Miseq using the 2 × 250 bp paired-end approach. Paired fungal sequences from Row Illumina Miseq were demultiplexed and merged using the USEARCH pipeline. The merged sequences were then quality-filtered and clustered into operational taxonomical units (OTUs) using the USEARCH pipeline and UPARSE. Singletons were removed prior to out determination at 97% sequence identity and chimeric representative sequences were removed with UCHIME. Finally, we mapped the original sequences to OTUs at a 97% identity threshold to obtain an out OTU table. The taxonomy of each sequence was determined using the Ribosomal Database Project Classifier [36] against the UNITE fungal database [37] and the NCBI/GenBank. OTUs were assigned to functional groups using FUNGuild [13].

2.6. Data Analyses

All statistical analyses were performed in R [38]. To avoid spatial pseudo-replication, we analyzed the data at the forest site level (n = 20) using the combined data collected in the four sampling plots in each forest.
We used generalized linear mixed models (GLM) with Poisson-distributed errors to analyze the effects of the degree of urbanization and forest size (log-transformed) on the number of herbaceous plant, shrub and tree species. We applied analyses of covariance (ANCOVA) to assess the effects of the degree of urbanization and forest size (log-transformed) as cofactor on ground vegetation cover (arcsine square root-transformed) and on soil moisture (%; arcsine square root-transformed), soil pH, SOM (%; Tukey-transformed), total soil nitrogen (%; Tukey-transformed) and plant-available phosphorus (square root-transformed).
To avoid bias due to differences in sequencing numbers among the soil samples, we rarefied the number of sequences of each sample to the lowest value for normalization using the procedure rarefy in the vegan package [39]. All further analyses were conducted with rarefied OTU data. Richness, Shannon-diversity index and Pielou’s evenness of fungal communities were calculated using the vegan package [39]. Preliminary analyses revealed inter-correlations between several soil properties (soil pH vs. SOM: rs = 0.72, n = 20, p < 0.001; soil pH vs. total soil nitrogen content: rs = 0.51, n = 20, p = 0.022, and soil pH vs. plant-available phosphorus: rs = 0.66, n = 20, p = 0.002). We therefore considered soil pH, soil moisture and the recorded forest vegetation characteristics as cofactors in the subsequent statistical analyses.
We applied generalized linear mixed models (GLM) with Poisson-distributed errors to analyze the effects of the degree of urbanization, forest size, percentage of forest cover within a radius of 500 m from the center of each study plot, vegetation characteristics, and soil properties on fungal OTU richness. The degree of urbanization was included as a fixed factor, as were forest size (log-transformed), percentage of forest cover within a radius of 500 m from the center of each study plot (log-transformed), ground vegetation cover (Tukey-transformed) and herbaceous plant, shrub and tree species richness (all log-transformed), as well as soil moisture and soil pH as cofactors in the GLM models. We used the same GLM models, but with gamma-distributed errors, to assess the effects of the degree of urbanization, forest size, percentage of forest cover within a radius of 500 m from the center of each study plot, vegetation characteristics, and soil properties on both the Shannon diversity index and evenness of fungal communities.
To visualize differences in fungal communities, we used non-metric multidimensional scaling analysis (NMDS) and plotted the first two dimensions based on Bray–Curtis dissimilarities matrices using metaMDS in the vegan package [39]. Permutational multivariate analysis of variance (PERMANOVA) was used to test whether the degree of urbanization affects the composition of fungal OTUs. The same cofactors as in the GLM models were included in the model. All PERMANOVA tests were based on 9999 permutations of the untransformed raw data, using the adonis function in the vegan package [39]. Finally, individual OTU affinity with a given degree of urbanization was determined using indicator species analysis by the multipatt function in the indicspecies R package [40], which tests the significance of the indicator species index through a permutations test with 9999 permutations.
We applied the same GLM models with gamma-distributed errors to assess the impact of the degree of urbanization on the relative abundance of Basiodomycota, Chytridiomycota, Ascomycota and Morteriellomycota (all Tukey-transformed). PERMANOVA analyses, as described above, were conducted to test whether the degree of urbanization affects the composition and the relative abundance of fungal phyla. In addition, we used analysis of similarity (ANOSIM) in the vegan package [39] to examine differences in the composition of fungal phyla among the different degrees of urbanization. ANOSIM is a nonparametric permutation method that allows comparison of dissimilarities between groups and within groups. The procedure calculates R statistics ranging from −1 to 1. R = 0 indicates completely random grouping, while R = 1 means that all replicates within groups are more similar than all replicates between groups.
We also used GLM models with gamma-distributed errors as described above to analyze the impact of the degree of urbanization on the relative abundance of saphotrophic (sqrt-transformed), symbiotrophic (Tukey-transformed) and pathotrophic (sqrt-transformed) fungi.

3. Results

3.1. Vegetation Characteristics and Soil Properties

The degree of urbanization affected the species richness of plants and shrubs in different ways (Table 2). The herbaceous plant species richness of ground vegetation decreased with the increasing degree of urbanization and was higher in forests in both rural and low-urbanization areas than in forests in moderate- and high-urbanization areas (Table 2). Shrubs showed the opposite pattern; species richness increased with the increasing degree of urbanization (Table 2).
Soil pH was higher in forests in moderately and highly urbanized areas than in forests in low-urbanized and rural areas (Table 2). Plant-available phosphorus tended to be higher in forests in moderately and highly urbanized areas than in low-urbanized and rural areas (Table 1). Interestingly, forest size had no influence on the vegetation characteristics and soil properties examined (all p > 0.15).

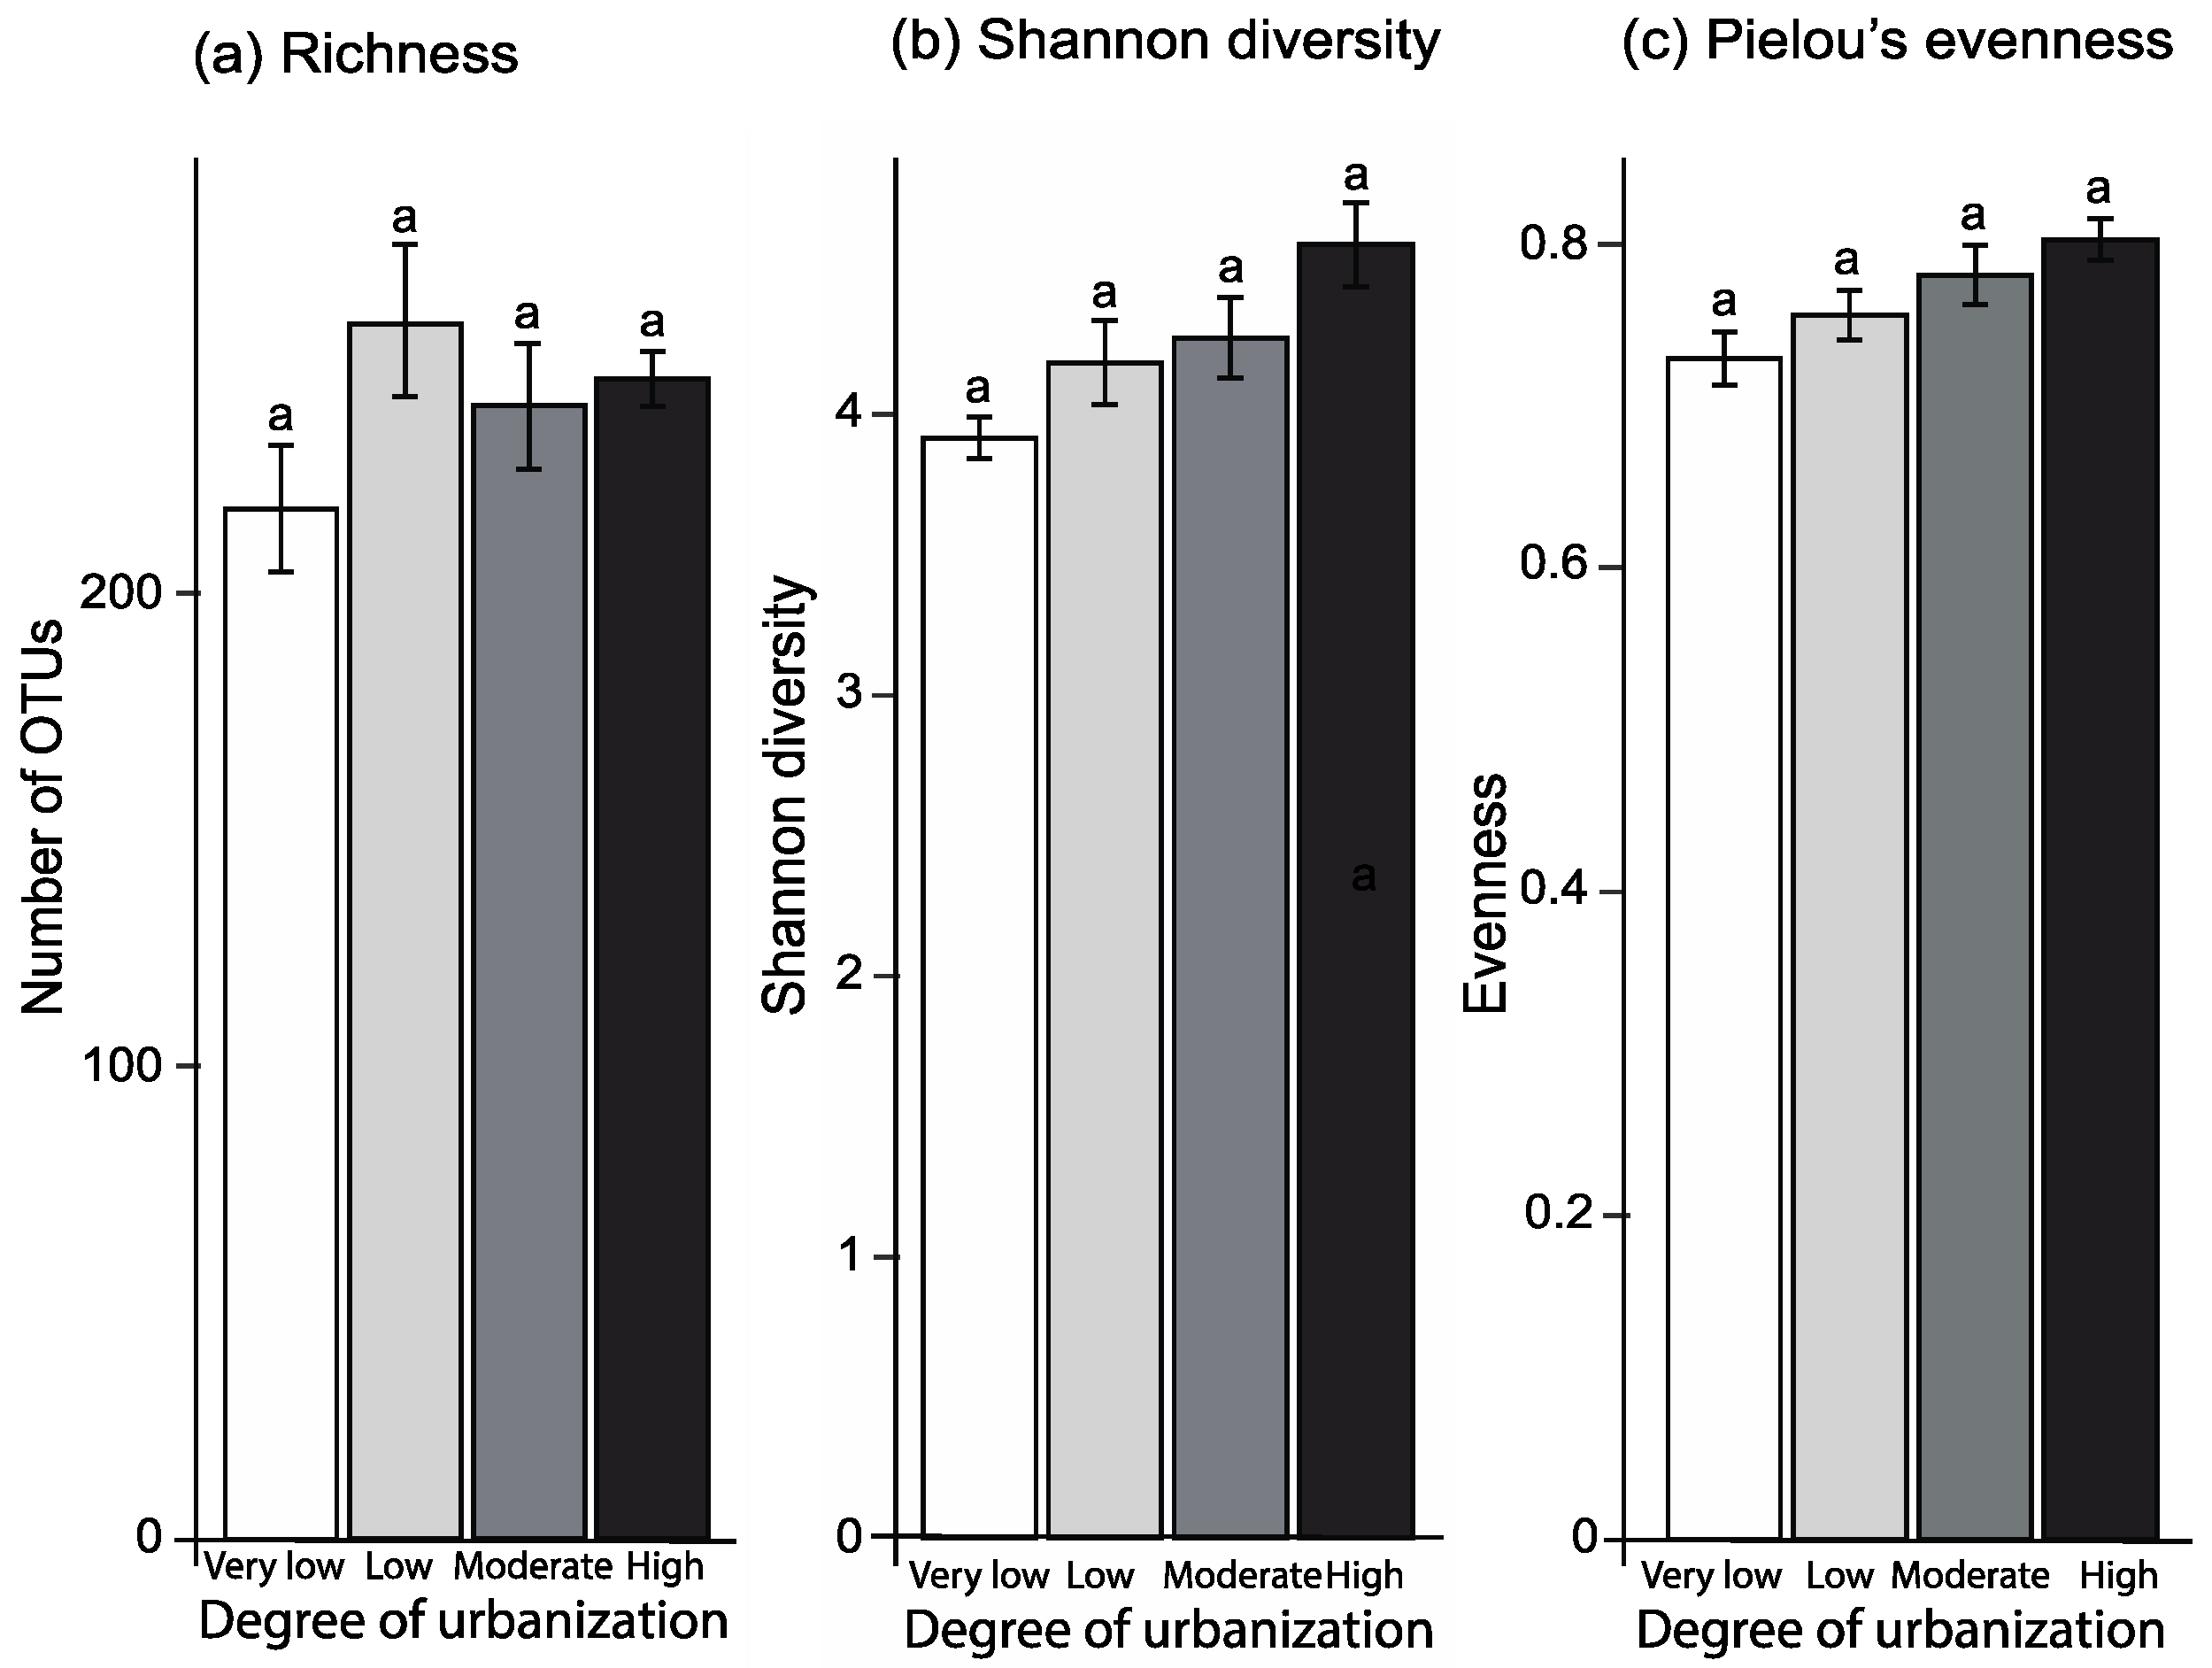
3.2. Diversity and Composition of Fungal Communities

After quality filtering, a total of 1,704,819 sequences were recovered from the soil samples, with an average of 21,100 sequences per sample (range 3813–44,593). To correct for differences in the number of reads, all samples were subsampled to the lowest number of reads, yielding a total of 680 OTUs with 97% sequence identity (Table S1). The number of fungal OTUs in the 20 forests examined ranged from 170 to 303 (mean ± s.e: 239.6 ± 8.5).
Richness, diversity and evenness of fungal communities were all significantly influenced by the degree of urbanization (Figure 2; Table 3). OTU richness was highest in forests in areas with a low degree of urbanization and lowest in forests in rural areas (Figure 2a). In contrast, the diversity and evenness of fungal communities increased with the increasing degree of urbanization (Figure 2b,c). The percentage of area covered with forests in the surroundings of the study plots significantly influenced fungal richness (Table 3). In addition, soil moisture affected both the richness and evenness of fungal communities (Table 3).
The PERMANOVA analysis showed that the degree of urbanization caused shifts in the composition of fungal communities (F3,9 = 1.92, p = 0.004; Figure 3, Table S2). This was because the fungal community composition of forests in areas with a high and moderate degree of urbanization differed from the composition in forests in rural areas (ANOSIM: R = 0.274, p = 0.009; Figure 3). PERMANOVA analyses also revealed that the extent of ground vegetation cover influenced the composition of fungal communities (F1,9 = 1.89, p = 0.020; Table S2). In addition, the indicator analysis showed that out of a total of 680 OTUs, 46 OTUs were significantly associated with a particular degree of urbanization (Indval > 0.7; p < 0.05; Table S3). OTUs were identified as indicators for forests in rural areas: one OTU for forests in low-urbanization areas, two OTUs for forests in moderate-urbanization areas and 28 OTUs for forests in high-urbanization areas (Table S3).

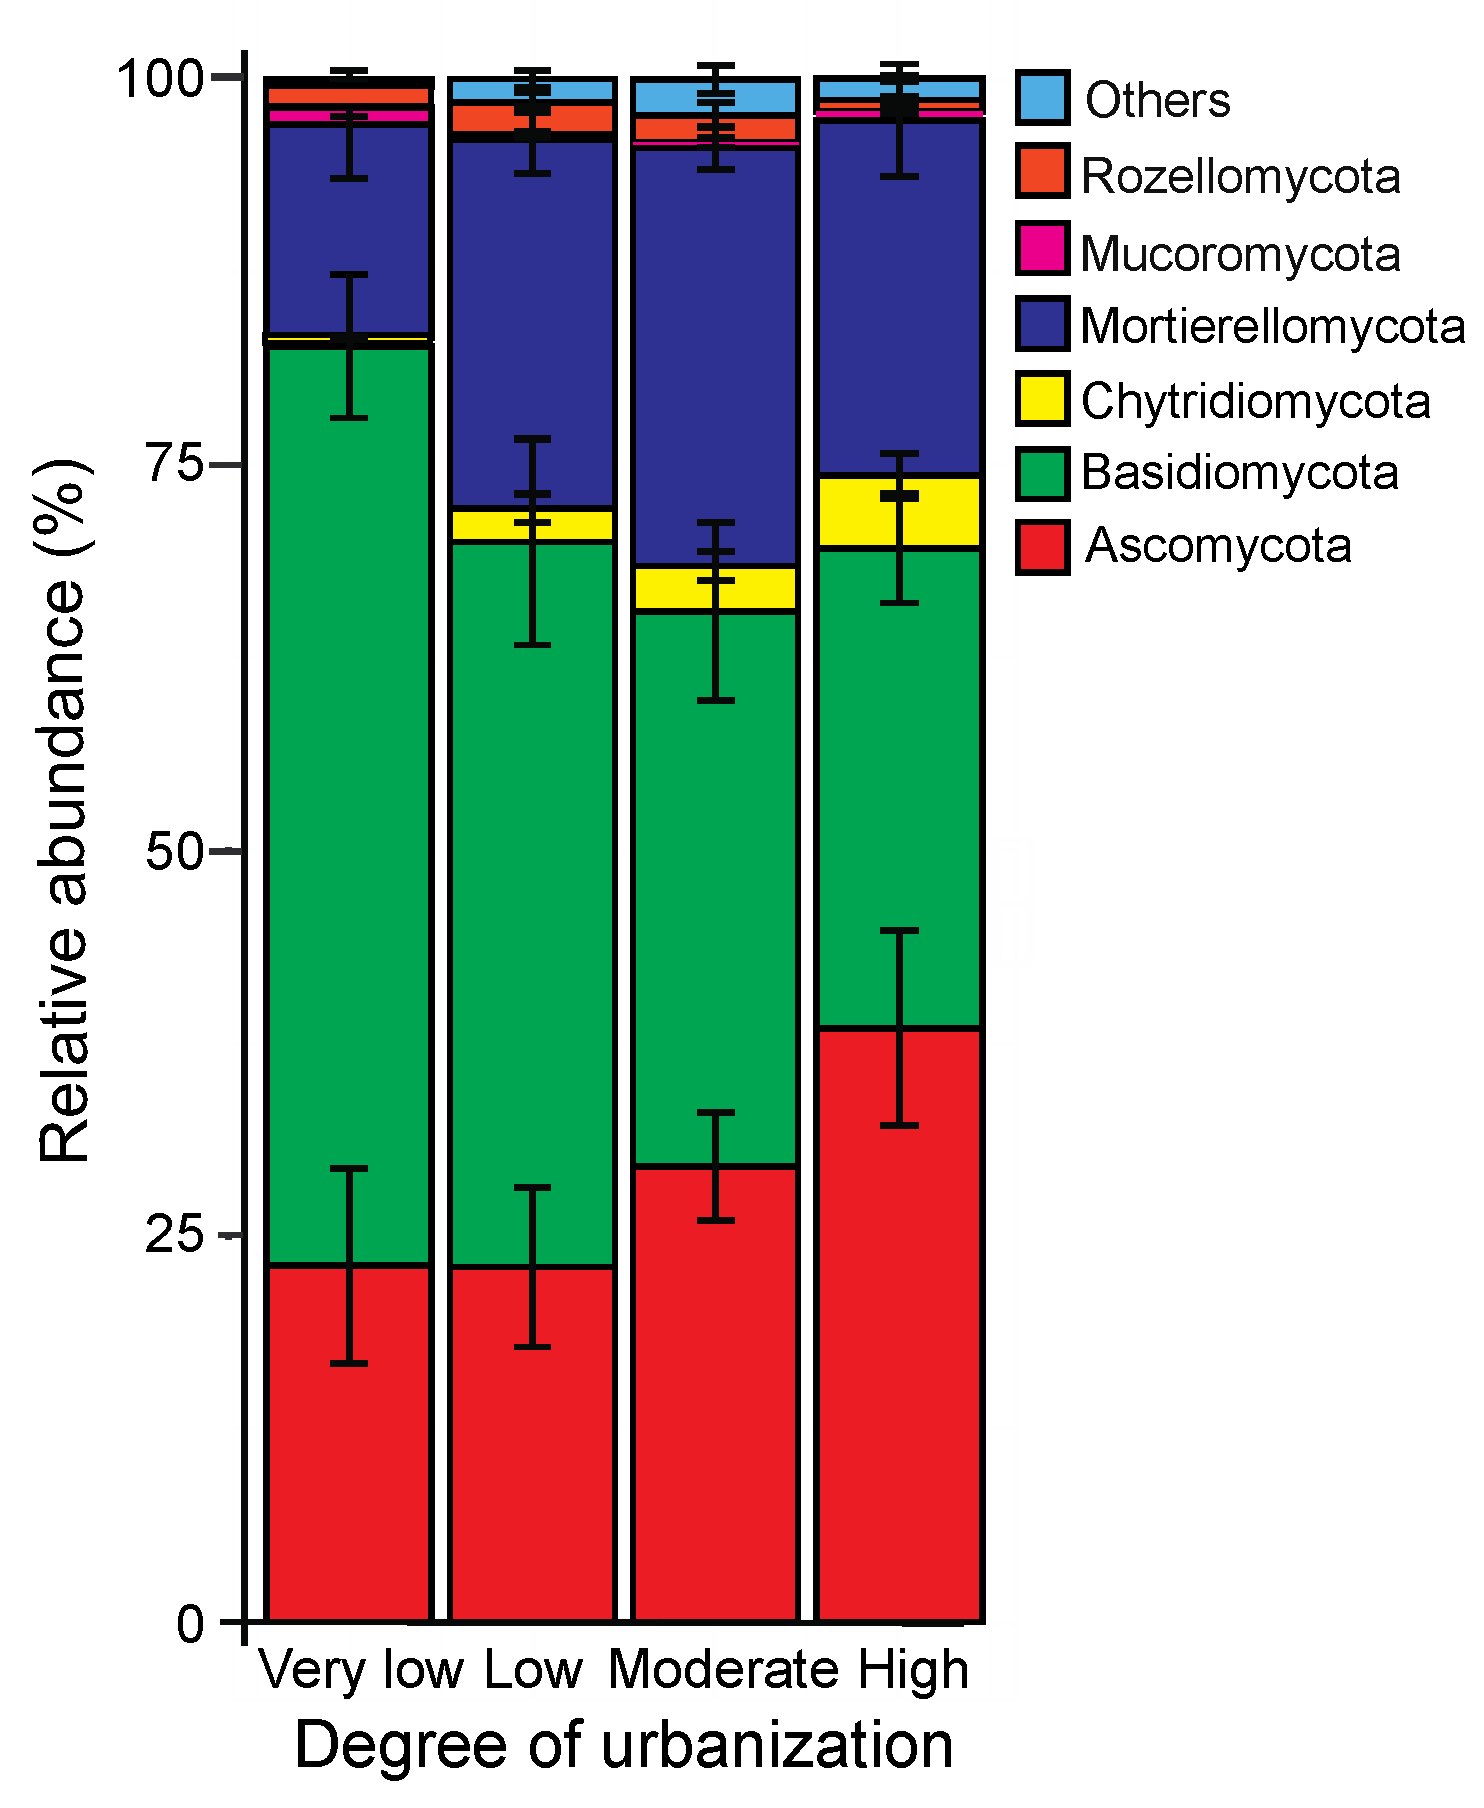
3.3. Taxonomic Composition of Soil Fungal Community

Of the total number of 680 fungal OTUs recorded, 670 OTUs could be assigned to 11 phyla (98.5%) (Table S1). Likewise, 648 fungal OTUs could be assigned to 31 classes (95.3%), 630 to 58 orders (92.6%), 554 to 111 families (81.4%) and 528 to 157 genera (77.6%). Considering the frequency of occurrence, Basidiomycota was the predominant phylum with 48.1% of the OTUs, followed by Ascomycota (32.4%), Morteriellomycota (10.1%) and Chytridiomycota (5.0%). The corresponding figures for the relative abundances were 44.4%, 28.5%, 22.6% and 2.6%. The other phyla included Rozellomycota, Mucoromycota, Olpidiomycota, Cryptomycota and Glomeromycota, which together accounted 2.0% of the relative abundance (Table S1).
Different fungal phyla showed distinct patterns in their relative abundance along the rural–urban gradient (Figure 4). The relative abundance of Basidiomycota decreased with increasing degree of urbanization (F3,11 = 5.67, p = 0.009; Figure 4; Table S4). The opposite pattern was found for the relative abundance of Chytridiomycota, which increased with the increasing degree of urbanization (F3,14 = 8.63, p < 0.001; Figure 4; Table S4). Similarly, the relative abundance of Ascomycota tended to increase with the increasing degree of urbanization (F3,13 = 2.94, p = 0.08; Figure 4; Table S4). The relative abundance of Morteriellomycota was lowest in forests in rural areas (F3,14 = 4.58, p = 0.020; Figure 4; Table S4). In addition, relative abundance of Chytridiomycota was influenced by soil moisture (F1,14 = 6.20, p = 0.0026; Table S4).
The PERMANOVA analysis revealed that the degree of urbanization caused a shift in the composition of fungal phyla (F3,12 = 4.57, p = 0.001; Table S2). Similar to fungal OTUs, the composition of fungal phyla differed between forests in rural areas and forests in areas with moderate or high degrees of urbanization (ANOSIM: R = 0.220, p = 0.043).

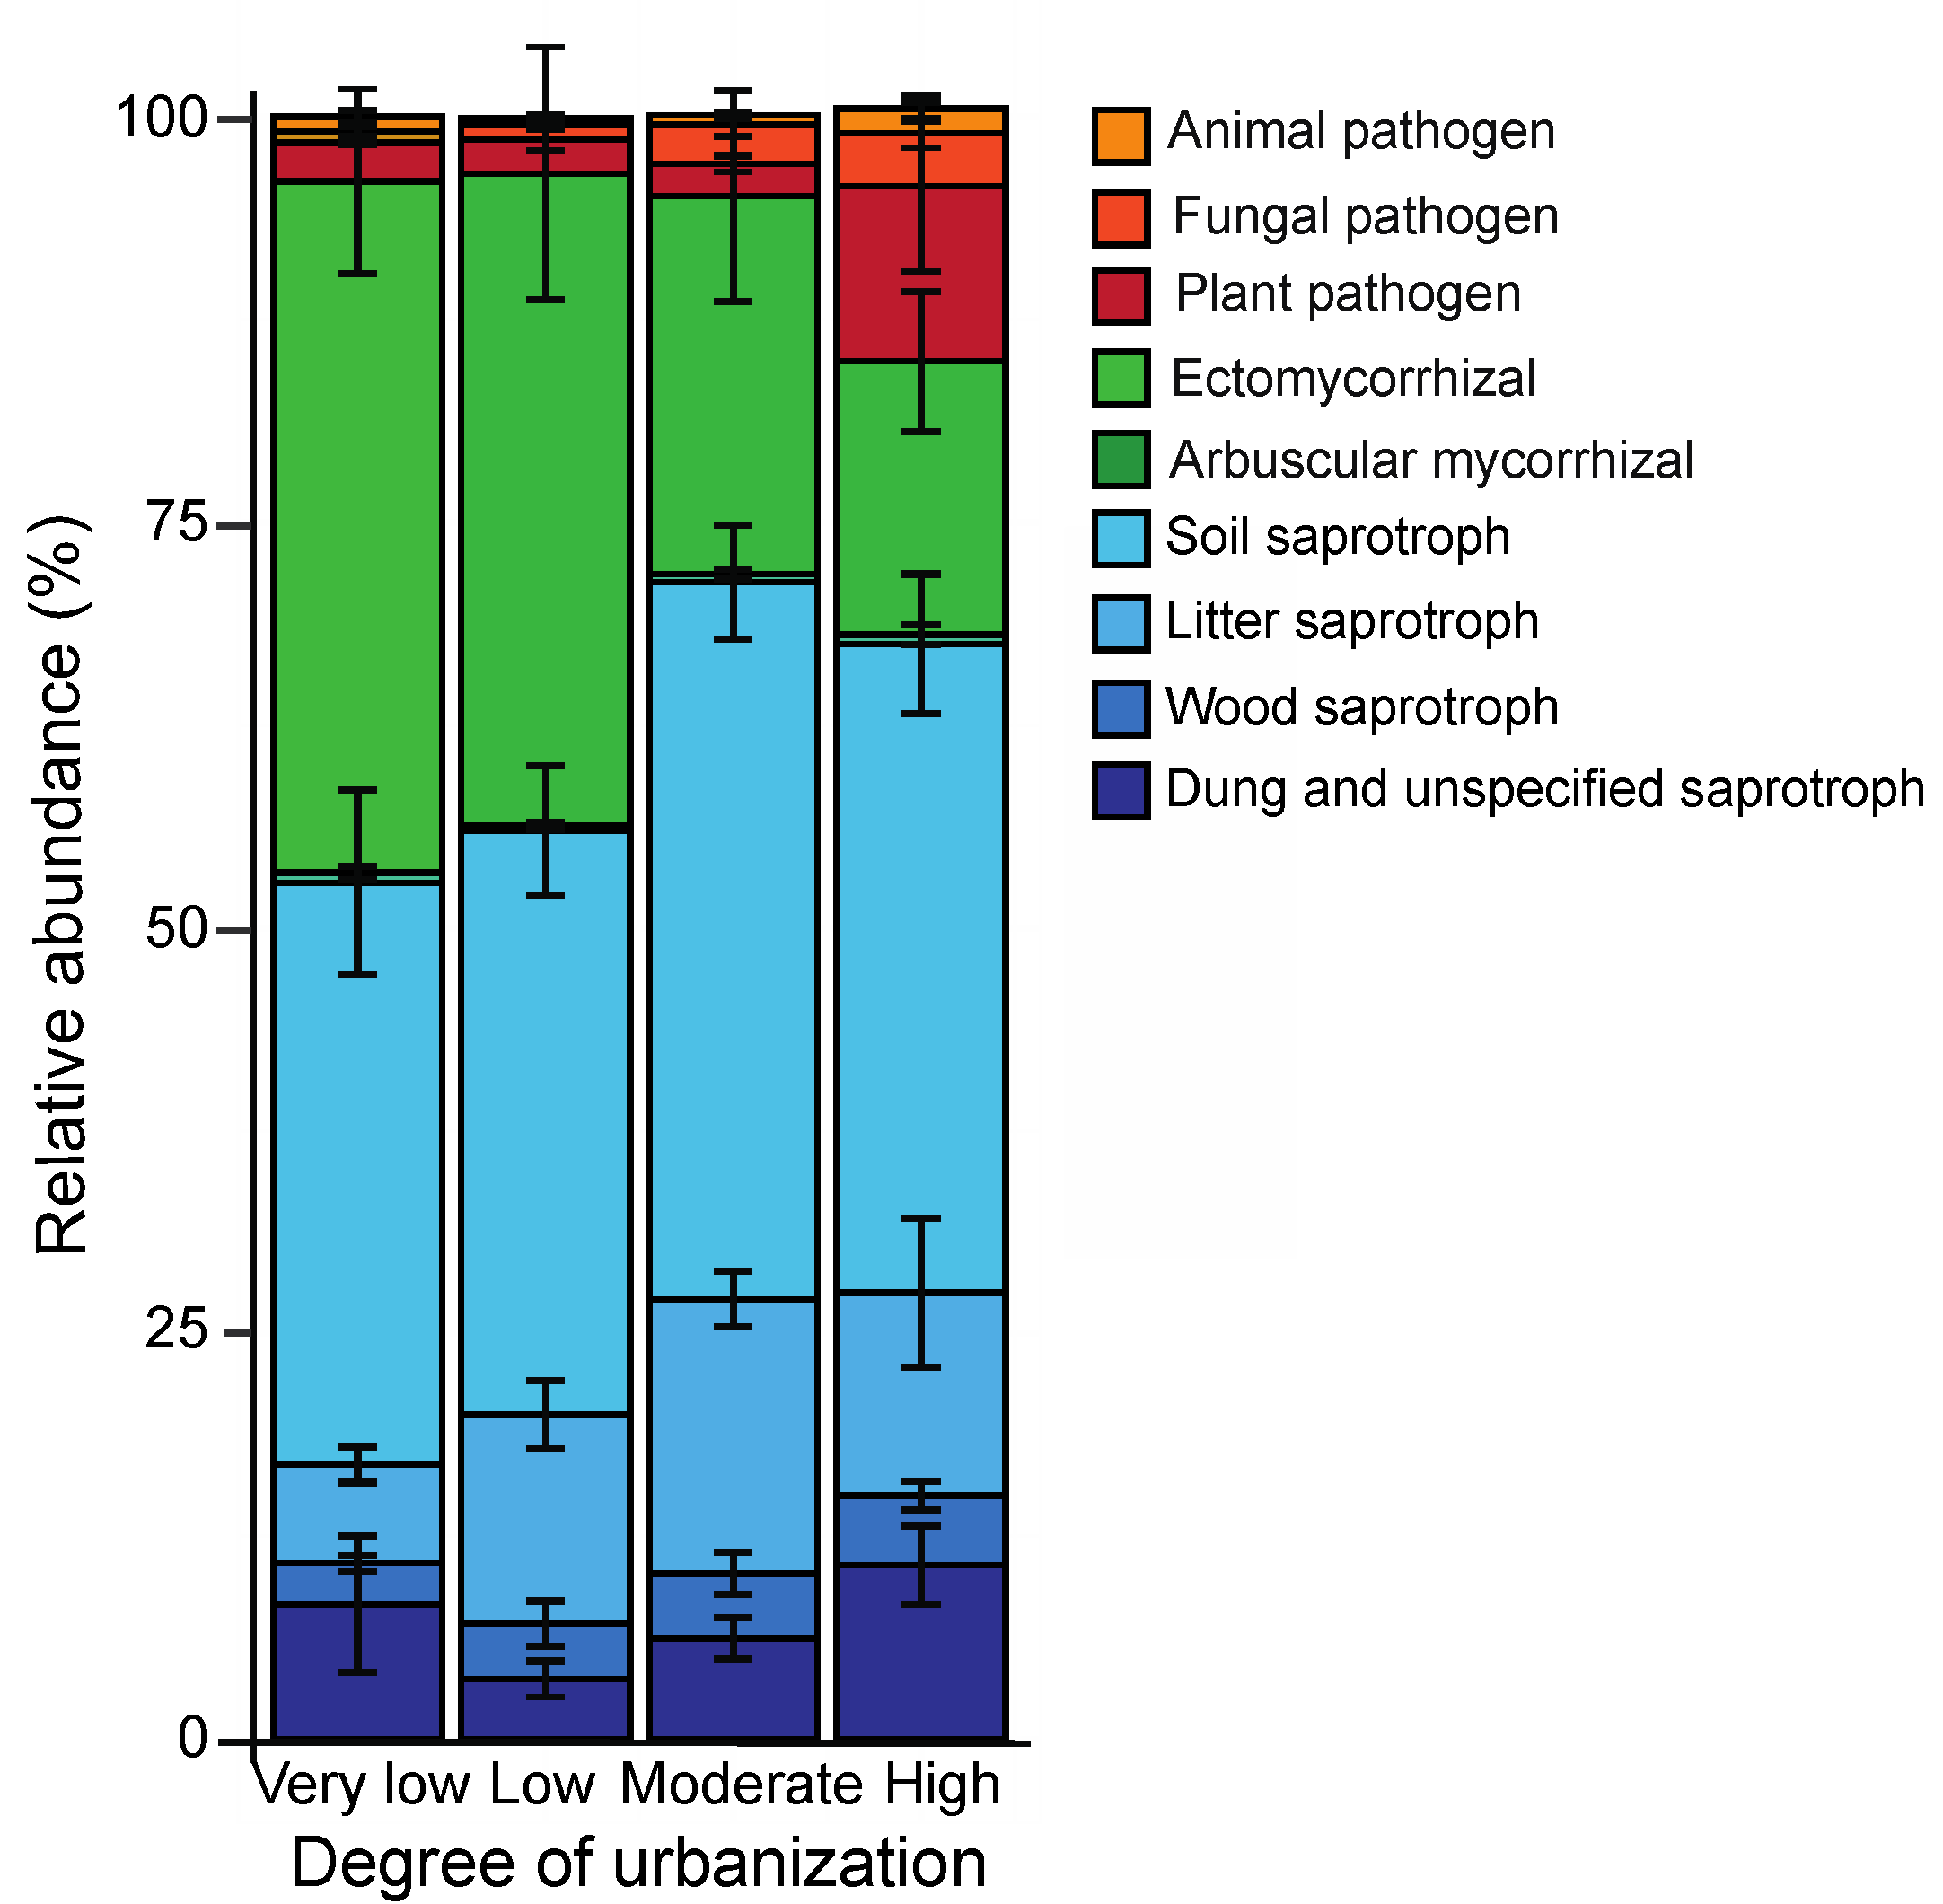
3.4. Soil Fungal Functional Composition

The majority of fungal OTUs (76.5%) could be assigned to a specific functional guild (Figure 5 and Figure 6): 255 were saprotrophic fungi (frequency of 48.9%), accounting for 61.4% of the relative abundance. The corresponding figures for symbiotrophic fungi were 221 (frequency of 32.4%) and 44 for pathotrophic fungi (frequency of 6.2%; Table S1). The degree of urbanization influenced the relative abundance of fungal guilds in different ways (Table 4; Figure 5a–c and Figure 6). The relative abundance of symbiotrophic fungi significantly decreased with the increasing degree of urbanization (Table 4; Figure 5b), while the relative abundance of saprotrophic fungi tended to increase with the increasing degree of urbanization (Table 4; Figure 5a). For pathotrophic fungi (Table 4; Figure 5c), the relative abundance in forests in areas of very low (rural), low and moderate urbanization was similar, but was significantly higher in forests in highly urbanized areas (Figure 5c).

4. Discussion

4.1. Diversity and Composition of Fungal Communities

We found an average OTU richness of 240 in the 20 forests examined, which is in the range of other studies conducted in different beech forest stands (104 to 1262 OTUs, mean per study site [41,42,43,44]). This large variation in soil fungal richness can be explained by the different barcoding regions used for fungal community profiling (e.g., ITS1 versus ITS2) and/or by different soil sampling procedures (e.g., different soil depth and sampling effort).
Our finding that soil fungal richness is negatively affected by the degree of urbanization (Figure 2a) supports the first hypothesis and is in line with the results of some studies reporting negative effects of urbanization on total soil fungal richness [18,19]. However, other studies either showed a positive effect [20,21,45] or found no effect [22,46] of urbanization on soil fungal richness in forests. Furthermore, we showed that both the diversity and evenness of soil fungal communities were positively related to the degree of urbanization. Similar results have been obtained in other studies assessing the impact of urbanization on soil fungal communities [20,21,45]. The observed differential influence of the degree of urbanization on richness, Shannon diversity and evenness of soil fungi could be caused by the so-called biotic homogenization effect [47]. Biotic homogenization led to an increase in species composition similarity with the increasing degree of urbanization and, in parallel, to an increase in diversity and evenness of fungal communities recorded in our study.
Urbanization can change forest stand characteristics including plant and tree species richness and soil properties [5,26]. Along with the composition of the surrounding landscape, altered forest characteristics have the potential to influence soil fungal communities [48]. Numerous studies have shown that the richness of tree and plant species has a positive effect on soil fungi richness in forests [49]. However, in our study, species richness of soil fungi was not related to tree and herbaceous plant species richness, ruling out this possibility; although plant species richness decreased along the urbanization gradient, tree species richness did not (Table 2). Tedersoo et al. [46] reported that soil pH is the most important soil property determining soil fungal species richness and found that this relationship was unimodal, peaking around pH 6.6. Based on this finding, the recorded increase in soil pH along the urbanization gradient should lead to an increase in soil fungal species richness. However, no relationship was found between soil fungal richness and soil pH in our study. The decline in fungal richness along the urbanization gradient in our study could therefore be due to opposing effects of changes in plant species richness and soil pH on soil fungi. Furthermore, our findings that rural forests and forests in highly urbanized areas have a particular fungal community composition and specific indicator species were consistent with several studies that suggest urbanization changes the composition of soil fungi [18,19,22]. However, a comparison of our results with the results of other studies is difficult for several reasons. Other studies that quantified the impact of urbanization on soil fungal community either did not describe the particular land use or examined different habitat types. For example, private gardens or parks in urban areas and forests in the rural areas were sampled [18,20,22].

4.2. Composition of the Soil Fungal Communities at the Phylum Level

The composition of soil fungal community found in our study, with Basiodiomycota as the dominant fungal phyla, followed by Ascomycota and Morteriellomycota, is characteristic for the soil fungal community in beech forests [43,49,50]. Consistent with our second hypothesis, we showed that the different fungal phyla were differently affected by the degree of urbanization. The recorded decline in the Basidiomycota abundance along the urbanization gradient is in line with the results of some of the few studies assessing the impact of urbanization on fungal taxonomic identity (e.g., phylum or class). These studies also reported lower abundances of Basiodiomycota in urban areas than in rural areas [18]. However, other studies found either a higher abundance of Basidiomycota in urban than in rural habitats [21] or that urbanization had no effect on Basidiomycota abundance [22]. In our study, the selected forest areas were predominantly Fagus sylvatica (80%–90% of all stems), followed by Quercus robur and Quercus petraea (5%–10%), as well as Carpinus betulus and Pices abies, all of which are hosts for ectomycorrhizae. The number of stems of these tree species was not affected by the degree of urbanization. Only single stems of Acer pseudoplatanus and Fraxinus excelsior, hosts for arbuscular mycorrhizae, occurred in the forest areas. Therefore, we can exclude that urbanization-induced changes in the number of EM hosts may be responsible for the observed decline in the relative abundance of Basiodiomycota. Furthermore, in our study, the abundance of Chytridiomycota increased while that of Morteriellomycota decreased along the rural–urban gradient. Most Chytridiomycota and Ascomycota are saprotrophic fungi living on decaying plant material [51]. The higher abundance of Chytridiomycota in urban forests than in rural forests may therefore be due to the higher amount of soil organic matter recorded in urban forests than in rural forests (Table 2; +21%). In our study, we found no linear relationship between soil moisture and the relative abundance of Chytridiomycota, although the reproductive stages of chytridiomycetous fungi depend on high soil moisture content [52]. Furthermore, the decreasing abundance of Morteriellomycota along the urbanization gradient may be caused by changes in both soil properties and vegetation composition. Our finding that the degree of urbanization changed the composition of fungal phyla and classes is consistent with the results of other studies reporting that urbanization alters the composition of fungal phyla or classes [18,44].

4.3. Soil Fungal Functional Composition

In forest soil, fungi represent a key component of soil microbial community, not only in terms of species richness and diversity, but also in terms of their functionalities [53]. In our study, the soil fungal community is dominated by saprotrophic fungi with a relative abundance of 62%, followed by symbiotrophic (32%) and pathotrophic (6%) fungi. A similar soil fungal community composition was also found in different types of temperate beech forests [43,49]. Fungal guilds differ in their ecological requirements and can therefore be differently affected by urbanization-related changes in biotic and abiotic environmental factors. In our study, the degree of urbanization reduced the relative abundance of symbiotrophic fungi. The vast majority of the symbiotrophs recorded are ectomycorrhizal fungi (EM fungi; 220 out of a total of 221) (Table S1). Other studies also reported that urbanization negatively affected richness and abundance of EM fungi in different temperate forests [28,54], subtropical and tropical forests [22], and in desert vegetation [19]. However, Liu et al. [20] found no urbanization effect on EM fungi and Tan et al. [22] even reported a higher abundance of ectomycorrhizal fungi in urban than in non-urban habitats.
The magnitude of the abundance reduction in EM fungi recorded in our study (40%) was similar to other studies 28%–42% [19,28,45]. However, we showed that the abundance of saprotrophic fungi is positively related to the degree of urbanization. This is consistent with the result of Scholier et al. [45]. In contrast, other studies reported higher abundances of saprotrophic fungi in suburban than in urban areas [19,22], or no effect of urbanization on this fungal guild [54]. Overall, ectomycorrhizal and saprotrophic fungi use the same organic matter and therefore compete for a resource, which can result in inhibition of both fungal groups [55]. Saprotrophic fungi have a higher competitive ability for nutrient uptake than EM fungi when carbon resources are not limited [56]. Indeed, the higher soil organic matter content (+20%) in forests in highly urbanized areas than in forests in rural areas could be responsible for the opposite changes in the abundance of EM and saprotrophic fungi. Our finding that the abundance of pathogenic fungi increases with increasing urbanization is supported by other studies [22,54]. Competitive interactions can lead to different responses of EM and pathotrophic fungi depending on the degree of urbanization, because EM fungi can act as antibiotic agents to protect plant roots from infection of soil-borne plant pathogens [57].

5. Conclusions

Urbanization is progressing worldwide, and in 2050, the number of people living in urban areas is expected to increase by 2.5 billion. Forests are the most frequent type of green space in urban landscapes [2], providing residents with a wide range of ecosystem services, from recreational areas, to recycling and nutrient storage, to air filtering and temperature regulation, as well as providing habitats for native species [3]. Our study showed that the taxonomic and functional richness and abundance of soil fungi along a rural–urban gradient are influenced by urbanization. This leads to changes in soil fungal community composition, which in turn can influence ecosystem functions such as nutrient cycling or carbon sequestration, all of which are important for maintaining healthy forests. Appropriate management strategies need to be developed and implemented to maintain high soil microbial community diversity in forests in urban landscapes.

Supplementary Materials

The following supporting information can be downloaded at: https://www.mdpi.com/article/10.3390/f14112226/s1, Table S1: Taxonomic status, ecological guilds and abundance data of all OTUs found in 20 forest sites situated in Basel and its surroundings (Switzerland), Table S2: Summary of PERMANOVA analyses examining the effects of degree of urbanization (four classes), forest size, percentage of area covered with forest within 500 m of the center of the study plots, forest vegetation characteristics and soil properties on the composition of fungal OTUs and the composition of fungal phyla, Table S3: List of indicator taxa for the different degrees of urbanization (four classes), together with values for positive predictive power (A), sensitivity (B), and the strength of association for each combination (Indval), Table S4: Summary of general linear models (GLM) testing the effects of degree of urbanization (four classes), forest vegetation characteristics and soil properties on the relative abundance of Basidiomycota, Chytridiomycota, Ascomycota and Morteriellomycota.

Author Contributions

Conceptualization, H.-P.R. and B.B.; methodology, H.-P.R.; software, H.-P.R.; validation H.-P.R. and B.B.; formal analysis, H.-P.R.; investigation, H.-P.R. and B.B.; resources, B.B.; data curation, H.-P.R. and B.B.; writing—original draft preparation, H.-P.R. and B.B.; writing—review and editing, H.-P.R. and B.B.; visualization, H.-P.R. All authors have read and agreed to the published version of the manuscript.

Funding

This research received no external funding.

Data Availability Statement

Data presented in this study are available in the article and its Supporting Information Files (Tables S1–S4).

Acknowledgments

We thank Georg Armbruster, Thomas Boller and two anonymous reviewers for comments on the manuscript. We also thank the foresters in charge for permission to carry out the vegetation survey and soil sampling in the forests.

Conflicts of Interest

The authors declare no conflict of interest.

References

  1. Grimm, N.B.; Faeth, S.H.; Golubiewski, N.E.; Redman, C.L.; Wu, J.G.; Bai, X.M.; Briggs, J.M. Global change and the ecology of cities. Science 2008, 319, 756–760. [Google Scholar] [CrossRef] [PubMed]
  2. Cvejić, R.; Eler, K.; Pintar, M.; Železnikar, Š.; Haase, D.; Kabisch, N.; Strohbach, M. A Typology of Urban Green Spaces, Ecosystem Services Provisioning Services and Demands; Report D3.1; European Union: Brüssel, Belgium, 2015. [Google Scholar]
  3. Grammatikopoulou, I.; Vackarova, D. The value of forest ecosystem services: A meta-analysis at the European scale and application to national ecosystem accounting. Ecosyst. Serv. 2021, 48, 101262. [Google Scholar] [CrossRef]
  4. Pickett, S.T.A.; Cadenasso, M.L.; Grove, J.M.; Boone, C.G.; Groffman, P.M.; Irwin, E.; Kaushal, S.S.; Marshall, V.; McGrath, B.P.; Nilon, C.H.; et al. Urban ecological systems: Scientific foundations and a decade of progress. J. Environ. Manag. 2011, 92, 331–362. [Google Scholar] [CrossRef] [PubMed]
  5. Melliger, R.L.; Braschler, B.; Rusterholz, H.P.; Baur, B. Diverse effects of degree of urbanisation and forest size on species richness and functional diversity of plants, and ground surface-active ants and spiders. PLoS ONE 2018, 13, e0199245. [Google Scholar] [CrossRef] [PubMed]
  6. Fenoglio, M.S.; Rossetti, M.R.; Videla, M. Negative effects of urbanization on terrestrial arthropod communities: A meta-analysis. Glob. Ecol. Biogeogr. 2020, 29, 1412–1429. [Google Scholar] [CrossRef]
  7. Meyer, S.; Rusterholz, H.P.; Baur, B. Saproxylic insects and fungi in deciduous forests along a rural–urban gradient. Ecol. Evol. 2021, 11, 1634–1652. [Google Scholar] [CrossRef] [PubMed]
  8. Chapin III, F.S.; Zavaleta, E.S.; Eviner, V.T.; Naylor, R.L.; Vitousek, P.M.; Reynolds, H.L.; Hooper, D.U.; Lavorel, S.; Sala, O.E.; Hobbie, S.E.; et al. Consequences of changing biodiversity. Nature 2000, 405, 234–242. [Google Scholar] [CrossRef] [PubMed]
  9. Decon, J.W. Fungal Biology, 4th ed.; John Willey & Sons: New York, NY, USA, 2005; p. 384. [Google Scholar]
  10. Bardgett, R.D.; van der Putten, W.H. Belowground biodiversity and ecosystem functioning. Nature 2014, 515, 505–511. [Google Scholar] [CrossRef]
  11. Treseder, K.K.; Lennon, J.T. Fungal traits that drive ecosystem dynamics on land. Microb. Molec. Biol. Rev. 2015, 79, 243–262. [Google Scholar] [CrossRef]
  12. Baldrian, P. Forest microbiome: Diversity, complexity and dynamics. FEMS Microbiol. Ecol. 2017, 41, 109–130. [Google Scholar] [CrossRef]
  13. Nguyen, N.H.; Song, Z.W.; Bates, S.T.; Branco, S.; Tedersoo, L.; Menke, J.; Schilling, J.S.; Kennedy, P.G. FUNGuild: An open annotation tool for parsing fungal community datasets by ecological guild. Fungal Ecol. 2016, 20, 241–248. [Google Scholar] [CrossRef]
  14. Kadowaki, K.; Yamamoto, S.; Sato, H.; Tanabe, A.S.; Hidaka, A.; Toju, H. Mycorrhizal fungi mediate the direction and strength of plant-soil feedbacks differently between arbuscular mycorrhizal and ectomycorrhizal communities. Community Biol. 2018, 1, 196. [Google Scholar] [CrossRef] [PubMed]
  15. Gomdola, D.; Bhunjun, C.S.; Hyde, K.D.; Jeewon, R.; Pem, D.; Jayawardena, R.S. Ten important forest fungal pathogens: A review on their emergence and biology. Mycosphere 2022, 13, 612–671. [Google Scholar] [CrossRef]
  16. Terhonen, E.; Kovalchuk, A.; Zarsav, A.; Asiegbu, F.O. Biocontrol potential of forest tree endophytes. In Endophytes of Forest Trees: Biology and Applications, 2nd ed.; Pirttilä, M.A., Frank, A.C., Eds.; Springer: Berlin/Heidelberg, Germany, 2018; pp. 283–318. [Google Scholar] [CrossRef]
  17. Dobson, A.; Crawley, W. Pathogens and the structure of plant-communities. Trends Ecol. Evol. 1994, 9, 393–398. [Google Scholar] [CrossRef] [PubMed]
  18. Abrego, N.; Crosier, B.; Somervuo, P.; Ivanova, N.; Abrahamyan, A.; Abdi, A.; Hamalainen, K.; Junninen, K.; Maunula, M.; Purhonen, J.; et al. Fungal communities decline with urbanization—More in air than in soil. ISME J. 2020, 14, 2806–2815. [Google Scholar] [CrossRef] [PubMed]
  19. Chen, Y.J.; Martinez, A.; Cleavenger, S.; Rudolph, J.; Barberan, A. Changes in soil microbial communities across an urbanization gradient: A local-scale temporal study in the arid Southwestern USA. Microorganisms 2021, 9, 1470. [Google Scholar] [CrossRef] [PubMed]
  20. Liu, L.; Barberan, A.; Gao, C.; Zhang, Z.C.; Wang, M.; Wurzburger, N.; Wang, X.; Zhang, R.; Li, J.X.; Zhang, J. Impact of urbanization on soil microbial diversity and composition in the megacity of Shanghai. Land Degrad. Dev. 2022, 33, 282–293. [Google Scholar] [CrossRef]
  21. Whitehead, J.; Roy, J.; Hempel, S.; Rillig, M.C. Soil microbial communities shift along an urban gradient in Berlin, Germany. Front. Microbiol. 2022, 13, 972052. [Google Scholar] [CrossRef]
  22. Tan, X.L.; Kan, L.; Su, Z.Y.; Liu, X.D.; Zhang, L. The composition and diversity of soil bacterial and fungal communities along an urban-to-rural gradient in South China. Forests 2019, 10, 797. [Google Scholar] [CrossRef]
  23. Wang, M.; Yu, S.Q.; Chen, X.H.; Liu, X.D.; Zeng, H.X.; Wu, W.K.; Liu, M.Y.; Su, C.H.; Xu, G.L. Soil microbial community changes in response to the environmental gradients of urbanization in Guangzhou City. Urban Ecosyst. 2022, 25, 1865–1874. [Google Scholar] [CrossRef]
  24. Chaudhary, V.B.; Aguilar-Trigueros, C.A.; Mansour, I.; Rillig, M.C. Fungal dispersal across spatial scales. Annu. Rev. Ecol. Evol. Syst. 2022, 53, 69–85. [Google Scholar] [CrossRef]
  25. Osburn, E.D.; McBride, S.G.; Aylward, F.O.; Badgley, B.D.; Strahm, B.D.; Knoepp, J.D.; Barrett, J.E. Soil bacterial and fungal communities exhibit distinct long-term responses to disturbance in temperate forests. Front. Microbiol. 2019, 10, 2872. [Google Scholar] [CrossRef] [PubMed]
  26. Enescu, R.E.; Dinca, L.; Zup, M.; Davidescu, S.; Vasile, D. Assessment of soil physical and chemical properties among urban and peri-urban forests: A case study from metropolitan area of Brasov. Forests 2022, 13, 1070. [Google Scholar] [CrossRef]
  27. Rodrigez-Ramos, J.C.; Cale, J.A.; Cahill, J.F., Jr.; Simard, S.W.; Karst, J.; Erbilgin, N. Changes in soil fungal community composition depend on functional group and forest disturbance type. New Phyt. 2021, 229, 105–1117. [Google Scholar] [CrossRef] [PubMed]
  28. Schmidt, D.J.E.; Pouyat, R.; Szlavecz, K.; Setälä, H.; Kotze, D.J.; Yesilonis, I.; Cilliers, S.; Hornung, E.; Dombos, M.; Yarwood, S.A. Urbanization erodes ectomycorrhizal fungal diversity and may cause microbial communities to converge. Nat. Ecol. Evol. 2017, 1, 0123. [Google Scholar] [CrossRef] [PubMed]
  29. Shen, H.Y.; Yang, B.S.; Wang, H.; Sun, W.; Jiao, K.Q.; Qin, G.H. Changes in soil ectomycorrhizal fungi community in oak forests along the urban-rural gradient. Forests 2022, 13, 675. [Google Scholar] [CrossRef]
  30. Statistischer Atlas der Schweiz 2021. Available online: https://www.bfs.admin.ch/bfs/de/home/statistiken/regionalstatistik/atlanten/statistischer-atlas-schweiz.html (accessed on 10 May 2023).
  31. Burnand, J.; Hasspacher, B. Waldstandorte beider Basel. In Quellen und Forschungen zur Geschichte und Landeskunde des Kanton Basel-Landschaft, 2nd ed.; Verlag des Kantons Basel-Landschaft: Liestal, Switzerland, 1999; p. 266. [Google Scholar]
  32. Walthert, L.; Zimmermann, S.; Blaser, P.; Luster, J.; Lüscher, P. Waldböden der Schweiz 1. Grundlagen und Region Jura; Ott Verlag: Thun, Switzerland, 2004; p. 768. [Google Scholar]
  33. Mueller-Dombois, D.; Ellenberg, H. Aims and Methods of Vegetation Ecology; Blackburn Press: Caldwell, NJ, USA, 2002; p. 547. [Google Scholar]
  34. Allen, S.E. Chemical Analysis of Ecological Materials, 2nd ed.; Blackwell Scientific: Oxford, UK, 1989; p. 368. [Google Scholar]
  35. White, T.J.; Bruns, T.; Lee, S.; Taylor, J.W. Amplification and direct sequencing of fungal ribosomal RNA genes for phylogenetics. In PCR Protocols: A Guide to Methods and Applications; Innis, M.A., Gelfan, D.H., Sninsky, J.J., White, T.J., Eds.; Academic Press Inc.: New York, NY, USA, 1990; pp. 315–322. [Google Scholar] [CrossRef]
  36. Wang, Q.; Garrity, G.M.; Tiedje, J.M.; Cole, J.R. Naive Bayesian classifier for rapid assignment of rRNA sequences into the new bacterial taxonomy. Appl. Environ. Microbiol. 2007, 7, 5261–5267. [Google Scholar] [CrossRef] [PubMed]
  37. Nilsson, R.H.; Larsson, K.H.; Taylor, A.F.S.; Bengtsson-Palme, J.; Jeppesen, T.S.; Schigel, D.; Kennedy, P.; Picard, K.; Glöckner, F.O.; Tedersoo, L.; et al. The UNITE database for molecular identification of fungi: Handling dark taxa and parallel taxonomic classifications. Nucleic Acids Res. 2018, 47, D259–D264. [Google Scholar] [CrossRef]
  38. R Core Team. R: A Language and Environment for Statistical Computing; R Foundation for Statistical Computing: Vienna, Austria, 2020; Version 3.6.3; Available online: https://www.R-project.org/ (accessed on 13 September 2023).
  39. Oksanen, J.; Blanchet, F.G.; Kindt, R.; Legendre, P.; Minchin, P.R.; O’Hara, R.B.; Simpson, G.L.; Solymos, R.; Stevens, M.H.H.; Wagner, H. Vegan Community Ecology Package. R Package Version 2.0–10. Available online: http://CRAN.R-project.org/package=vegan (accessed on 11 May 2022).
  40. De Cáceres, M.; Legendre, P. Associations between species and groups of sites: Indices and statistical inference. Ecology 2009, 90, 3566–3574. [Google Scholar] [CrossRef]
  41. Goldmann, K.; Schröter, K.; Pena, R.; Schöning, I.; Schrumpf, M.; Buscot, F.; Polle, A.; Wubet, T. Divergent habitat filtering of root and soil fungal communities in temperate beech forests. Sci. Rep. 2016, 6, 31439. [Google Scholar] [CrossRef]
  42. Bahnmann, B.; Masinova, T.; Halvorsen, R.; Davey, M.L.; Sedlak, P.; Tomsovsky, M.; Baldrian, P. Effects of oak, beech and spruce on the distribution and community structure of fungi in litter and soils across a temperate forest. Soil Biol. Biochem. 2018, 119, 162–173. [Google Scholar] [CrossRef]
  43. Clausing, S.; Likulunga, L.E.; Janz, D.; Feng, H.Y.; Schneider, D.; Daniel, R.; Kruger, J.; Lang, F.; Polle, A. Impact of nitrogen and phosphorus addition on resident soil and root mycobiomes in beech forests. Biol. Fertil. Soils 2021, 57, 1031–1052. [Google Scholar] [CrossRef]
  44. Gorfer, M.; Mayer, M.; Berger, H.; Rewald, B.; Tallian, C.; Matthews, B.; Sanden, H.; Katzensteiner, K.; Godbold, D.L. High fungal diversity but low seasonal dynamics and ectomycorrhizal abundance in a mountain beech forest. Microb. Ecol. 2021, 82, 243–256. [Google Scholar] [CrossRef] [PubMed]
  45. Scholier, T.; Lavrinienko, A.; Brila, I.; Tukalenko, E.; Hindstrom, R.; Vasylenko, A.; Cayol, C.; Ecke, F.; Singh, N.J.; Forsman, J.T.; et al. Urban forest soils harbour distinct and more diverse communities of bacteria and fungi compared to less disturbed forest soils. Mol. Ecol. 2023, 32, 504–517. [Google Scholar] [CrossRef] [PubMed]
  46. Tedersoo, L.; Anslan, S.; Bahram, M.; Drenkhan, R.; Pritsch, K.; Buegger, F.; Padari, A.; Hagh-Doust, N.; Mikryukov, V.; Gohar, D.; et al. Regional-scale in-depth analysis of soil fungal diversity reveals strong pH and plant species effects in Northern Europe. Front. Microbiol. 2020, 11, 1953. [Google Scholar] [CrossRef] [PubMed]
  47. MacKinney, M.L. Urbanization as a major cause of biotic homogenization. Biol. Conserv. 2006, 127, 247–260. [Google Scholar] [CrossRef]
  48. Christel, A.; Dequiedt, S.; Chemidlin-Prevost-Bouré, N.; Mercier, F.; Tripied, J.; Comment, G.; Djemiel, C.; Bargeot, L.; Matagne, E.; Fougeron, A.; et al. Urban land uses shape soil microbial abundance and diversity. Sci. Total Environ. 2023, 883, 163455. [Google Scholar] [CrossRef]
  49. Tedersoo, L.; Bahram, M.; Cajthaml, T.; Polme, S.; Hiiesalu, I.; Anslan, S.; Harend, H.; Buegger, F.; Pritsch, K.; Koricheva, J.; et al. Tree diversity and species identity effects on soil fungi, protists and animals are context dependent. ISME J. 2016, 10, 346–362. [Google Scholar] [CrossRef]
  50. Wubet, T.; Christ, S.; Schoning, I.; Boch, S.; Gawlich, M.; Schnabel, B.; Fischer, M.; Buscot, F. Differences in soil fungal communities between European Beech (Fagus sylvatica L.) dominated forests are related to soil and understory vegetation. PLoS ONE 2012, 7, e47500. [Google Scholar] [CrossRef]
  51. Kameshwar, A.K.S.; Qin, W.S. Systematic review of publicly available non-Dikarya fungal proteomes for understanding their plant biomass-degrading and bioremediation potentials. Bioresour. Bioprocess. 2019, 6, 30. [Google Scholar] [CrossRef]
  52. Hanrahan-Tan, D.G.; Lilje, O.; Henderson, L. Chytrids in soil environments: Unique adaptations and distributions. Encyclopedia 2023, 3, 642–664. [Google Scholar] [CrossRef]
  53. Blackwell, M. The Fungi: 1, 2, 3… 5.1 million species? Am. J. Bot. 2011, 98, 426–438. [Google Scholar] [CrossRef]
  54. Chen, Y.J.; Kuang, J.L.; Wang, P.D.; Shu, W.S.; Barberan, A. Associations between human impacts and forest soil microbial communities. Elementa 2020, 8, 005. [Google Scholar] [CrossRef]
  55. Leake, J.R.; Johnson, D.; Donnelly, D.P.; Muckle, G.E.; Boddy, L.; Read, D.J. Networks of power and influence: The role of mycorrhizal mycelium in controlling plant communities and agroecosystem functioning. Can. J. Bot. 2004, 82, 1016–1045. [Google Scholar] [CrossRef]
  56. Bödeker, I.T.M.; Lindahl, B.D.; Olson, Å.; Clemmensen, K.E. Mycorrhizal and saprotrophic fungal guilds compete for the same organic substrates but affect decomposition differently. Funct. Ecol. 2016, 30, 1967–1978. [Google Scholar] [CrossRef]
  57. Marx, D.H. Ectomycorrhizae as biological deterrents to pathogenic root infections. Annu. Rev. Phytopathol. 1972, 10, 429–441. [Google Scholar] [CrossRef] [PubMed]
Figure 1. Location of the study area in Basel and its surroundings in northwestern Switzerland (upper left corner), and spatial distribution of the forests examined. The line marks the border of Switzerland. Forests were grouped in four classes according to the degree of urbanization of their surroundings: very low-urbanized areas (rural, open dots), low-urbanized areas (light grey), moderately urbanized areas (dark grey) and highly urbanized areas (black dots).
Forests 14 02226 g001
Figure 2. Richness (a), Shannon diversity index (b) and Pielou’s evenness (c) of fungal OTUs in forests in areas of very low urbanization (rural areas; white bars) and in forests in low (light grey), moderately (dark grey) and highly urbanized areas (black). Bars show mean values ± s.e. Different letters indicate differences among the four urbanization classes based on Tukey HSD post hoc tests (p < 0.05).
Forests 14 02226 g002
Figure 3. Non-metric multidimensional scaling (NMDS) ordination plot based on the Bray–Curtis dissimilarities in the composition of fungal OTUs of forests in areas with extremely low urbanization (rural areas, white), and in forests in areas with low urbanization (light grey), forests in areas with moderate urbanization (dark grey) and forests in areas with high urbanization (black).
Forests 14 02226 g003
Figure 4. Relative abundance of fungal phyla in forests in areas with very low (rural areas), low, moderate and high urbanization. Bars show mean values ± s.e.
Forests 14 02226 g004
Figure 5. Relative abundance of saprotrophic (a), symbiotrophic (b), and pathotrophic fungi (c) in forests in extremely low (rural areas; white bars), low (light grey), moderately (dark grey) and highly urbanized areas (black). Bars show mean values ± s.e. Different letters indicate differences among the four urbanization classes based on Tukey HSD post hoc tests (p < 0.05).
Forests 14 02226 g005
Figure 6. Relative abundance of different fungal guilds for forests in very low (rural), low, moderately and highly urbanized areas. Bars show mean values ± s.e. of the various fungal guilds.
Forests 14 02226 g006
Table 1. Characteristics of the 20 forest sites examined in the city of Basel (Switzerland) and its surroundings.
ForestCoordinatesHistorical Development 1Forest Vegetation 2Elevation (m a.s.l.)Exposure 3% Cover of Sealed Area (r = 500 m)Degree of Urbanization 4Forest Area (ha)% Cover of Forest
(r = 500 m)
BS147°33′13″ N
7°36′17″ E
PlantedGalio-Fagetum Pulmonarietosum363WNW5940.332
BS247°33′14″ N
7°36′49″ E
FragmentGalio Odorati-Fagetum Cornetosum262NE3931.423
BS347°33′55″ N
7°38′41″ E
PlantedGalio Odorati-Fagetum Pulmonarietosum319NNW3030.4156
BS447°32′12″ N
7°36′6″ E
FragmentGalio Odorati-Fagetum Cornetosum321NE5441.1613
BS547°32′04.6″ N
7°31′16.2″ E
ForestGalio-Fagetum Pulmonarietosum3511176.245
BS647°34′53″ N
7°38′52″ E
PlantedGalio Odorati-Fagetum2833330.331
BS747°32′18″ N
7°35′39″ E
PlantedAro-Fagetum 325NE4330.236
BS847°31′49″ N
7°35′49″ E
FragmentGalio Odorati-Fagetum Typicum370E2322.7011
BS947°31′55″ N
7°36′6″ E
FragmentGalio Odorati-Fagetum Typicum338NW4432.1019
BS1047°34′20″ N
7°37′6″ E
ForestGalio-Carpinetum Corydalidetosum 2692522.5335
BS1147°29′11″ N
7°40′43″ E
ForestGalio-Fagetum Pulmonarietosum56531186.492
BS1247°34′29″ N
7°39′58″ E
ForestGalio Odorati-Fagetum Cornetosum450NW1025.1537
BS1347°35′18″ N
7°40′20″ E
ForestGalio Odorati-Fagetum Cornetosum473SW1323.4254
BS1447°32′31″ N
7°35′2″ E
FragmentGalio Odorati-Fagetum Cornetosum299NNE3531.956
BS1547°30′53″ N
7°38′11″ E
ForestGalio-Fagetum Pulmonarietosum4182179.043
BS1647°30′31″ N
7°40′04″ E
ForestAro-Fagetum45411337.066
BS1747°32′43″ N
7°36′27″ E
PlantedAro-Fagetum2766940.372
BS1847°30′18″ N
7°34′46″ E
ForestGalio Odorati-Fagetum Typicum38021237.759
BS1947°34′23″ N
7°39′16″ E
PlantedGalio Odorati-Fagetum Typicum380921.2838
BS2047°32′14″ N
7°35′26″ E
FragmentGalio Odorati-Fagetum Cornetosum326E5640.895
1 Forest = part of a large continuous forest; planted = trees planted after 1884; fragment = remnant of a former large continuous forest. 2 Plant association following Burnand and Hasspacher [31]. 3 Exposure was determined for forest sites situated on slopes. “–” indicates flat forest sites. 4 Four classes: 1 = very low (cover of sealed area < 5% within a radius of 500 m); 2 = low (5.1%–25%); 3 = moderate (25.1%–45%); 4 = high (>45%).
Table 2. Vegetation characteristics and soil properties of the 20 deciduous forests (mean ± s.e.) along an urbanization gradient.
Degree of Urbanization
Very Low (Rural)LowModerateHighp
(n = 5)(n = 5)(n = 6)(n = 4)
Forest vegetation characteristics
Ground vegetation cover (%)67.2 ± 9.556.2 ± 11.778.0 ± 18.173.9 ± 15.9N.S.
Herbaceous plant species richness 19.5 ± 1.4 a6.8 ± 0.6 a5.6 ± 0.4 b5.2 ± 0.2 b0.005
Shrub species richness 24.0 ± 0.7 a4.0 ± 0.9 a6.0 ± 0.8 b7.5 ± 0.3 b0.034
Tree species richness 23.8 ± 0.63.8 ± 0.53.8 ± 0.62.5 ± 0.8N.S.
Soil properties
Moisture (%)31.4 ± 2.329.0 ± 1.528.8 ± 1.625.7 ± 2.1N.S.
pH5.6 ± 0.4 a5.7 ± 0.4 a6.6 ± 0.2 b7.2 ± 0.1 b0.004
SOM (%)18.3 ± 6.912.7 ± 1.916.6 ± 2.222.2 ± 3.4N.S.
Total organic nitrogen (%)0.298 ± 0.0710.282 ± 0.0340.313 ± 0.0330.381 ± 0.047N.S.
Plant-available phosphorus (µg PO43−/g)26.9 ± 5.0 a19.4 ± 3.9 a35.8 ± 8.5 b46.4 ± 5.3 b0.07
1 Number of herbaceous plant species per 4 m2. 2 Number of shrub and tree species per 100 m2. n refers to the number of forests studied. Different letters indicate differences between the four urbanization classes based on Tukey HSD post hoc tests (p < 0.05). N.S., not significant. p-values resulted from ANCOVA or GLM analyses (see detailed description in Section 2.6).
Table 3. Summary of general linear models (GLM) analyzing the effects of degree of urbanization (four classes), forest size, percentage of area covered with forest within 500 m of the center of the study plots, forest vegetation characteristics and soil properties on richness, diversity and evenness of fungal communities.
RichnessShannon Diversity IndexPielou’s Evenness
Degree of urbanizationChi23,16 = 16.79, p < 0.001F3,14 = 4.22, p = 0.026F3,11 = 5.14, p = 0.018
Forest area (ha) 1Chi21,15 = 1.47, p = 0.226F1,11 = 3.51, p = 0.088
% forest within 500 m 1Chi21,14 = 5.90, p = 0.015F1,14 = 1.82, p = 0.197F1,11 = 1.08, p = 0.322
Plant species richness 1F1,11 = 2.82 p = 0.123
Tree species richness 1Chi21,13 = 1.82, p = 0.177
Soil moistureChi21,12 = 8.20, p = 0.004F1,14 = 1.68, p = 0.216F1,11 = 5.05, p = 0.046
Soil pHF1,11 = 1.23, p = 0.290
1 log-transformed. Significant p-values (<0.05) are indicated in bold. “–” Removed from the model by the stepwise reduction procedure.
Table 4. Summary of general linear models (GLM) analyzing the effects of degree of urbanization (four classes), forest vegetation characteristics and soil properties on the relative abundance of saprotrophic, symbiotrophic and pathotrophic fungi.
Relative Abundance of
Saprotrophic FungiSymbiotrophic FungiPathotrophic Fungi
Degree of urbanizationF3,13 = 3.16, p = 0.061F3,12 = 4.37, p = 0.026F3,13 = 5.24, p = 0.014
Ground vegetation cover (%)F1,13 = 1.47, p = 0.247F1,12 = 2.08, p = 0.175F1,13 = 1.25, p = 0.284
Plant species richness 1F1,13 = 2.55, p = 0.141F1,12 = 1.22, p = 0.290
Tree species richness 1F1,12 = 1.85, p = 0.198
Soil moisture (%)F1,13 = 4.10, p = 0.046F1,13 = 3.46, p = 0.084
Soil pHF1,12 = 3.17, p = 0.100F1,13 = 2.20, p = 0.162
1 log-transformed. Significant p-values (<0.05) are indicated in bold. “–” Removed from the model by the stepwise reduction procedure.
Disclaimer/Publisher’s Note: The statements, opinions and data contained in all publications are solely those of the individual author(s) and contributor(s) and not of MDPI and/or the editor(s). MDPI and/or the editor(s) disclaim responsibility for any injury to people or property resulting from any ideas, methods, instructions or products referred to in the content.

