Article

Root Traits and Soil Bacterial Composition Explain the Rhizosphere Effects along a Chronosequence of Rubber Plantations

Key Laboratory of Genetics and Germplasm Innovation of Tropical Special Forest Trees and Ornamental Plants, Ministry of Education, School of Tropical Agriculture and Forestry, Hainan University, No. 58, Peoples Avenue, Haikou 570228, China
*
Author to whom correspondence should be addressed.
Forests 2023, 14(11), 2209; https://doi.org/10.3390/f14112209
Submission received: 18 September 2023 / Revised: 25 October 2023 / Accepted: 4 November 2023 / Published: 8 November 2023
(This article belongs to the Section Forest Soil)

Abstract

:
Rubber tree plantations (Hevea brasiliensis) are expanding into the tropical regions of southwest China to ensure production to meet the growing demand for latex. The effects of long-term plantations on soil carbon processes are still unclear. Also, the effects of the plant’s rhizosphere on the decomposition of soil organic matter (SOM) play a crucial role in predicting soil carbon dynamics. The rhizosphere and soils corresponding to a chronosequence of ages (4, 15 and 30 years) of rubber plantations were collected and incubated to determine the effect of the rhizosphere (RE) on SOM decomposition. We also examined the soil physicochemical properties; bacterial community structure; and root morphological, chemical, and physiological traits to further explore the underlying mechanisms of the RE on SOM decomposition. The REs on SOM decomposition varied significantly in the different age classes of the rubber plantations, and the higher the REs on SOM decomposition in an older plantation might limit the accumulation of organic carbon in the soil. Root traits, including the specific root length, root nitrogen content, and root carbon/nitrogen ratio, varied significantly in response to the plantation age and explained more of the variance in the RE on SOM decomposition than the soil and microbial properties. Due to the changing root morphological and chemical traits along the age chronosequence, the rhizosphere bacterial community composition tended to shift the carbon utilisation strategy and the bulk soil nitrogen content decreased. These variations also affected the RE on SOM decomposition. Our results indicate that the development of rubber plantations would prevent soil carbon accumulation, especially in the rhizosphere, by increasing the RE on SOM decomposition, which would be predicated by root morphological and chemical traits.

1. Introduction

Agricultural expansion is most prevalent in the tropical regions, where tropical agricultural land increased by 100 million hectares in the period 1980–2000, primarily at the cost of natural tropical forests [1,2]. Rubber (Hevea brasiliensis) plays an important role in this expansion because of its important economic value, and plantations reached 15.7 million ha worldwide in 2017 [3]. At present, rubber plantations account for nearly 25% of the total vegetated area in the tropical regions of Southwest China, particularly in the Hainan Province [4]. This massive rubber expansion has serious implications for biodiversity conservation and threatens forest carbon (C) stocks [5,6]. Previous studies have indicated that converting tropical forests to rubber monoculture plantations has reduced the C stock in the topsoil layers significantly [7,8,9]; however, temporal changes in soil C storage and stability, and their underlying mechanisms in rubber monoculture plantations have not been adequately studied.
The effects of an increasing rubber plantation age on the soil organic C (SOC) content are controversial. For instance, SOC stocks have been conversely reported to increase with the development of rubber plantations [10,11], to remain constant [8,12], or to even decrease [13,14]. These controversies may be ascribed to the soil layer, site management, pre-planting disturbance, and successive rotation situations. More fundamentally, the existing studies have not focused on the mechanisms of SOC change as the rubber plantations age. It has been increasingly recognised that living plant roots can regulate the SOC turnover in the rhizosphere through plant and soil interactions [15,16]. As the result of rhizosphere processes, the rhizosphere and the corresponding bulk soils have different physicochemical and biological properties, known as the rhizosphere effect (RE) [17]. The RE represents variations in soil biogeochemical processes (e.g., decomposition of soil organic matter (SOM)) around living plant roots; however, whether the RE affects the variation in SOC concentration with an increase in the rubber plantation age and the regulation mechanisms of the RE on SOM decomposition, remain poorly understood.
The trait-based approach is increasingly being recognised as a useful tool for improving our comprehension of root effects on the soil C dynamics [18,19]. Root functional traits are closely related to vegetation resource acquisition and processing strategies and, thus, determine the C cycling processes [20,21,22]. For instance, roots that have a high specific root length (SRL) are ephemeral and decompose easily, which may increase the root C inputs [23]. Root length density (RLD) is closely related to soil aggregate development and influences the C decomposition rate [24]. Root nitrogen concentration can regulate active C released from the roots to rhizosphere soils [25]. Together, the root morphological and chemical traits could determine the contribution of root turnover and rhizodeposits to SOC sequestration; however, some recent studies have illustrated that root physiology, such as the root exudation, can influence the soil C dynamics [26,27]. It is commonly believed that root exudates can generate REs to stimulate or suppress SOC decomposition in the rhizosphere [28]. It remains an open question whether root morphological, chemical, and physiological traits will change along the age chronosequence of rubber plantations. Furthermore, understanding the correlation between the root functional traits and RE on SOC decomposition is crucial for predicting soil C sequestration with an increasing rubber plantation age.
Soil microbes are one of the most vital factors for SOM decomposition and nutrient cycling [29]. Microbes shift their community structures according to the substrate quality and quantity to regulate the SOM decomposition rate [30]. The presence of plant roots induces differences in microbial species and functions between the rhizosphere and the bulk soil by providing litter and exudation, resulting in disparate soil biogeochemical processes [31,32]. Therefore, increasing attention has been focused on the importance of root chemical and morphological traits for predicting soil microbial composition and functional groups [33,34]. For instance, plant species with a high SRL and thin root diameter can promote bacterial growth, thus reducing the ratio of fungi to bacteria [35]. Root chemical traits (such as the N content and C:N ratio) are negatively related to Gram-positive (G+):Gram-negative (G) bacterial ratios but are positively related to fungal:bacterial ratios [33]. Despite the direct effect of the root chemical and morphological traits on microbial species, how these associations could regulate the RE on SOM decomposition in rubber plantations of different ages remains a knowledge gap.
In this study, three distinct age classes of 4-, 15-, and 30-year-old rubber plantations were selected from Danzhou, Hainan Province. We estimated the RE on SOM decomposition in plantations of different ages and focused on the plant root traits (including morphological, chemical, and physiological traits) and the microbial community structure to explore the underlying mechanisms of the RE on SOM decomposition. We hypothesised that (1) the RE on SOM decomposition would be different along the age chronosequence of rubber plantations, which could affect SOC sequestration, and (2) the root functional traits would play an important role in this change, given that they can directly determine the soil microbial composition and function. The results will be useful in predicting soil C dynamics based on root traits to select effective management strategies to promote soil C sequestration and the sustainable development of agriculture as the age of rubber plantations increase.

2. Materials and Methods

2.1. Study Site Information

The study was conducted at the experimental farm of the Chinese Academy of Tropical Agricultural Sciences (19°28′ N, 109°29′ E) located in Danzhou, Hainan Province, China. This site was established after clearing natural tropical forest. Understory vegetation in rubber plantations is dominated by Asystasia gangetica, Cyclosorus parasiticus, Indocalamus latifolius, and Litsea monopetala. The research region belongs to a tropical monsoon climate, with a rainy season from May to October and a dry season from November to April. The average annual precipitation is 1815 mm, 80% of which happens in the rainy season, while the average annual temperature ranges from 21.5 to 28.5 °C. The soil is laterite (Oxisols), developed from granite and sandstones.

2.2. Soil and Root Samples Collection

Using the space-for-time substitution approach, we sampled stands that had grown over time since reforestation. In October 2021, three distinct age classes of rubber plantations, including a 4-year-old rubber plantation (young rubber plantation, YR), a 15-year-old rubber plantation (middle-aged rubber plantation, MR), and a 30-year-old rubber plantation (old rubber plantation, OR), were selected for this study. Five replicate 30 m × 30 m plots were randomly established for each age class. The distances between the selected 15 plots ranged from 100 m to 2000 m apart from each other. In each plot, six rubber trees were selected as the sampling target tree, comprising 30 individuals. The mean plant heights (±standard deviation) were 10.32 ± 1.00 m, 20.82 ± 2.70 m, and 15.52 ± 3.94 m and the mean diameter at breast heights were 10.82 ± 0.82 cm, 20.13 ± 2.97 cm, and 27.13 ± 1.46 cm for the YR, MR, and OR plantation plots, respectively.
Rhizosphere and bulk soil samples were taken from each randomly selected tree. Briefly, thick roots attached to the trunk were found, and the soil, along with the roots, was removed to a depth of 15 cm. Then, fine roots (diameter ≤2 mm) were selected, and the soil attaching to the fine roots was shaken off and collected. The collected soil samples were rhizosphere soil. Meanwhile, bulk soil that was approximately a 20 cm distance from the roots was collected using a sterilized shovel. After collecting the soil samples, the fine roots were clipped using a sterilized scissor and stored in sterile polyethylene Ziplock bags as root samples. The soil and root samples were placed in a cryogenic storage box and transported to the laboratory immediately. In the laboratory, the bulk soil samples or rhizosphere soil samples in the same plot were mixed. Then, a total of 30 composite soil samples were collected (three age classes × two position × five replicates). Each composite soil sample was sieved through a 2 mm mesh to remove stones and the remaining fine roots. Root samples obtained from each plot were mixed to create one composite. Each soil sample was divided into two parts: one portion was air-dried for physicochemical analysis, and the second was stored at −80 °C for incubation and microbiological sequencing. The root samples were stored at 4 °C and were determined within 48 h.

2.3. Soil Physicochemical Properties and SOM Decomposition

Soil organic carbon (SOC) and soil total nitrogen (STN) contents were determined using K2Cr2O7–H2SO4 oxidation and the micro-Kjeldahl method, respectively [36,37]. The soil total phosphorus (STP) content was measured using an ultraviolet spectrophotometer [38]. The soil pH was determined using a soil/water (1:2.5) suspension [38].
The potential SOM decomposition rate was measured using a laboratory incubation experiment according to the method described by Zheng et al. [39]. For each fresh soil sample, 50 g (dry weight) was placed in a 500 mL plastic jar. The soil water content in each jar was adjusted to 60% of the water-holding capacity using deionised water. A 25 mL beaker containing 5 mL of a 0.5 M NaOH solution was put inside each plastic jar. Five additional plastic jars with beakers containing NaOH solution were used as the controls. Subsequently, all the plastic jars were sealed and incubated at 25 °C conditions. After 30 days incubation, the evolved CO2 from the incubation period was trapped in the NaOH solution, and excess CO2 was titrated with 1 M HCl. Then, the CO2 − C was calculated according to the consumed HCl as follows:
CO 2 C = C NaOH   ×   V NaOH C HCl   ×   V HCl 2   ×   M soil   ×   44
where C is the concentration of the NaOH and HCl, V is the volume of the NaOH and HCl, and Msoil is the dry weight of the soil. The rate of SOM decomposition was calculated by dividing the cumulative CO2 − C during 30 days by the incubation days.

2.4. Soil DNA Extraction, Sequencing, and Bioinformatics Analysis

Microbial DNA was extracted from 0.2 g soil using a Power Soil DNA Isolation Kit (Mo Bio Laboratories, Carlsbad, CA, USA). The bacterial V4 region was amplified using the primers 515F (GTGCCAGCMGCCGCGGTAA) and 806R (GGACTACHVGGGTWTCTAAT). The PCR and tag-encoded high-throughput sequencing of the 16S were executed by Magigene Laboratory (Guangdong, China) using the Illumina HiSeq 2500 platform (Illumina, San Diego, CA, USA). The sequences were submitted to the National Center for Biotechnology Information (NCBI) Sequence Read Archive database under accession number SRP420119.
Paired-end reads from the original amplicon were demultiplexed and quality-processed using the Quantitative Insights into Microbial Ecology (QIIME-1.9.1) pipeline [40]. After optimising the data, UPARSE (http://drive5.com/uparse/) (accessed on 20 December 2021) was used to cluster the operational taxonomic units (OTUs) with a 97% similarity cut-off [41]. The taxonomic assignment for each OTU was found using the Ribosomal Database Project (RDP) classifier (v.2.2) [42].

2.5. Root Morphological, Chemical, and Physiological Traits

Fine root samples were used to measure the morphological and chemical traits. Before measuring the morphological traits, the impurities on the root surface were cleaned with deionised water. The root samples were then scanned by a digital scanner (Microtek I800 plus, Microtek, Shanghai, China) and analysed by the software named WinRHIZO Pro. 2011B (Regent Instruments Inc., Quebec City, QC, Canada). After that, we obtained the information of the total root length, surface area, volume, and mean diameter. Subsequently, the root samples were dried in an oven at 65 °C and weighed. The SRL was obtained by dividing the root length by the dry weight. The root tissue density (RTD) was obtained by dividing the root dry weight by the root volume. The specific root area (SRA) was calculated by dividing the root area by the root dry weight. The root C (RC) and N (RN) contents were determined using the same method used to determine the SOC and STN. Root C:N was calculated by dividing the RC content by the RN content.
Fine root exudation was used to characterise physiological traits. Root exudates were harvested in situ using the soil-hydroponic hybrid method [43]. One intact root of each target tree was carefully excavated to ensure the root remained connected to the mother tree and was gently washed with deionised water. After that, fine roots were chosen and put in a syringe filled with a 30 mL nutrient solution containing 0.3 mM CaCl2, 0.1 mM KH2PO4, 0.2 mM MgSO4, and 0.2 mM K2SO4. Afterwards, to protect the exposed portion of the root from drying out, a moist paper was placed around the upper root segment and secured with aluminium foil. The nutrient solution in the syringe was collected after 24 h and filtered by 0.22 μm filters immediately. The total C content of the solution was analysed using a total organic C (TOC) analyser (Shimadzu, Kyoto, Japan). The flux rate of the root exudation was calculated by dividing the incubation time and root mass.

2.6. Data Analysis

The magnitude of the RE was determined by the rate of the SOM decomposition (SOM-dec) in the rhizosphere and in bulk soil [17,44]. The calculation is as follows:
Rhizosphere   effect = SOM dec   in   rhizosphere   soil SOM dec   in   bulk   soil
Before statistical analyses, all data were tested for normality and homoscedasticity and then log-transformed if necessary. The effects of the rubber plantation age on the soil properties, microbial diversity, and SOM decomposition rates in the bulk soil or rhizosphere were analysed using ANOVA with a Tukey’s honest significant difference test. The differences of these indices between the bulk soil and rhizosphere were analysed using a t-test.
The dissimilarity in the bacterial communities among the three plantation stages and two sampling positions were separately determined using nonmetric multidimensional scaling (NMDS) with the metaMDS function of the ‘vegan’ package (R v.4.0.3) [45]. The effects of the plantation age class and sampling position on bacterial communities were tested using a permutational multivariate analysis of variance (PERMANOVA) using the adonis function of the ‘vegan’ package. Additionally, differences in the bacterial abundances at the phylum level among the rubber plantation age classes were analysed using STAMP v.2.1.3.
The direct and indirect relationships between the root, microbial, and soil properties and the RE on SOM decomposition were evaluated using structural equation modelling (SEM). A random forest analysis was performed before the SEM analysis to quantify the relative importance of the measured variables on the RE using the “randomForest” package. An increase in the mean square error (MSE) was used to represent the importance for a measured variable. Finally, the variables which would be used in the SEM analysis were confirmed by a 10-fold cross-validation with the “rfcv” function of the R package “randomForest”. Owing to the close correlations among the factors within the root, we conducted a principal component analysis (PCA) and used the first component (PC1) to show the combined group properties. The SEM models were fitted with a chi-square (χ2) test (p >0.05) and a root mean squared error of approximation (RMSEA < 0.1). The SEM was conducted using the ‘lavaan’ package. A linear regression analysis was performed to evaluate the relationships between the REs and selected variables. A Pearson correlation analysis was conducted among the soil C fractions, SOM decomposition rates, and REs. All these analyses were conducted in R v.4.0.3 [45].

3. Results

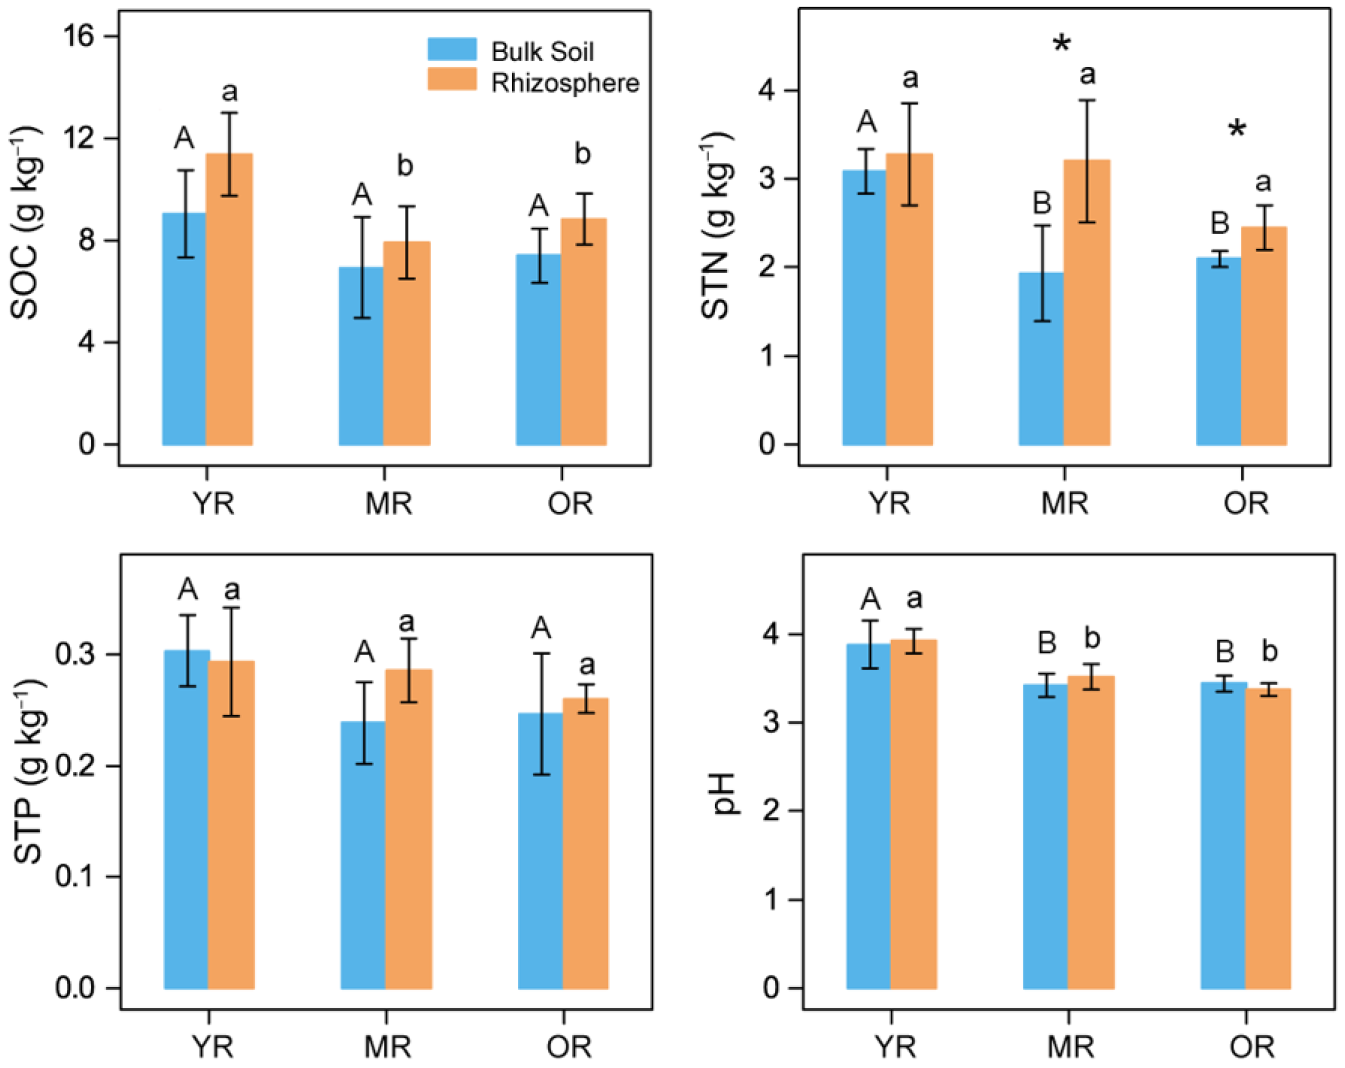
3.1. Soil Physicochemical Properties and Root Functional Traits

The SOC and STN contents in the rhizosphere or bulk soils decreased significantly from the YR to MR plantations (Figure 1; p < 0.05). The soil pH decreased significantly in the bulk soil and rhizosphere from the YR to MR plantations (Figure 1; p < 0.05). The STN content was significantly higher in the rhizosphere soil than bulk soil in the MR and OR plantations (p < 0.01). Root functional traits corresponding to the morphology, chemistry, and physiology differed prominently among the three age groups (Table 1; p < 0.05). The root SRA and root C:N decreased from the YR to OR plantations; however, the SRL, RTD, RN content, and root exudation exhibited opposite trends.

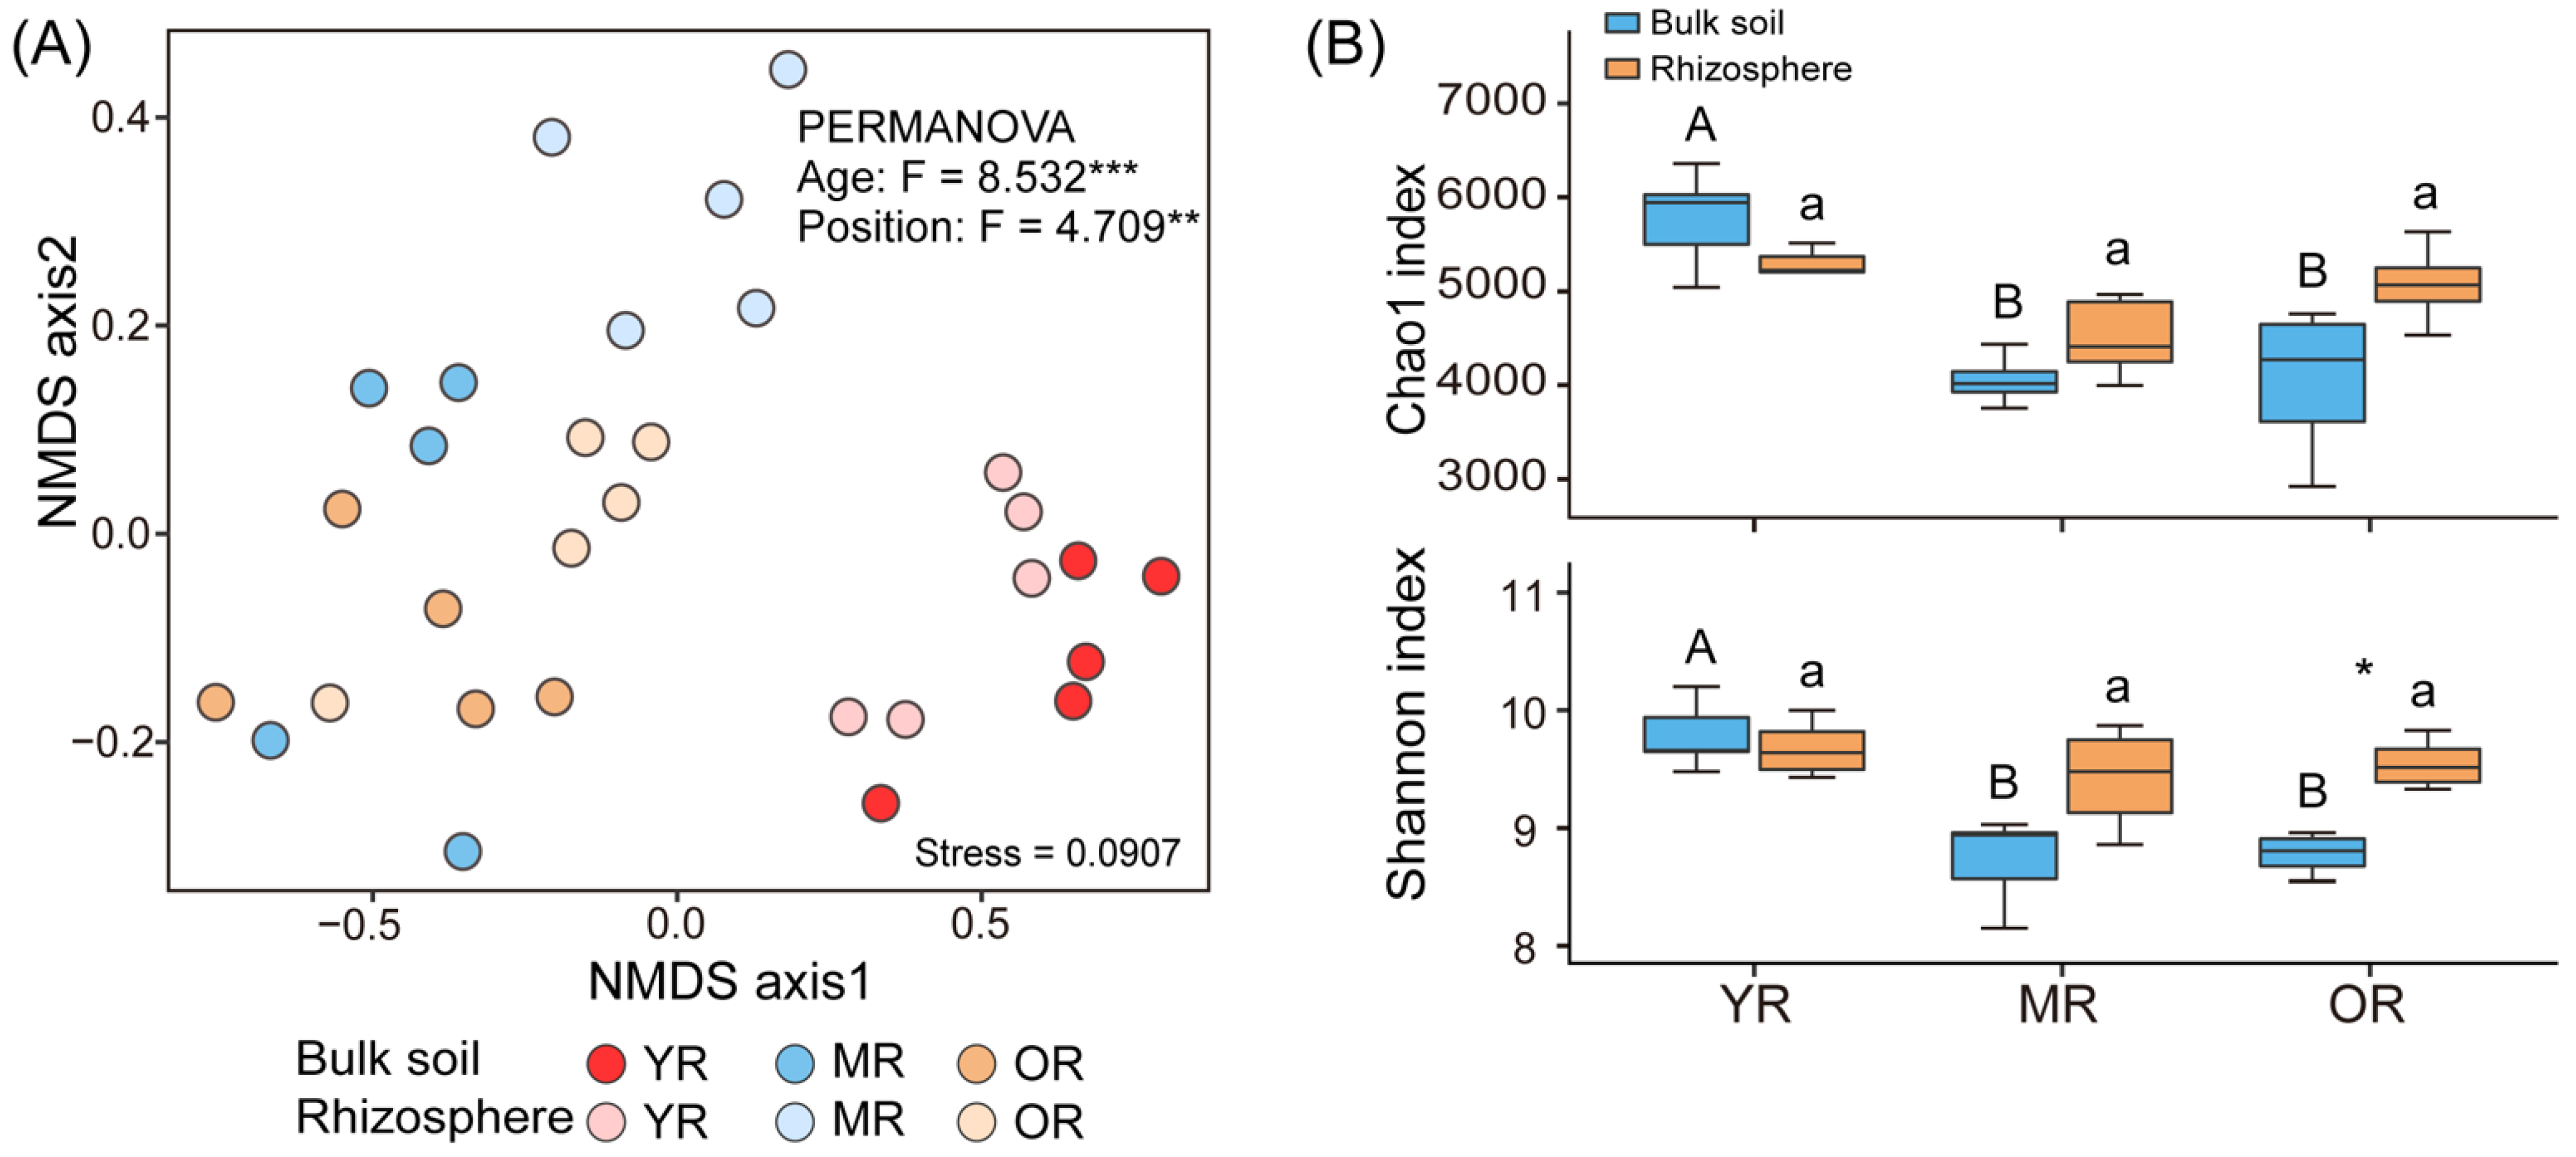
3.2. Soil Microbial Composition and Diversity

A total of 21,402 bacterial OTUs were identified in all the soil samples. The NMDS ordination revealed that the bacterial communities varied among the rubber plantation ages and sampling positions (Figure 2A; PERMANOVA, p < 0.01). For soil bacterial diversity, only the Chao1 and Shannon indices of the bulk soil decreased from the YR to MR plantations rubber plantations (Figure 2B; p < 0.05). The Shannon index exhibited as significantly different between the bulk soil and rhizosphere in the OR plantation (p < 0.05).
Across all samples, the bacterial community was primarily composed of Acidobacteria (32%), Proteobacteria (27%), Verrucomicrobia (9%), Chloroflexi (8%), and Bacteroidetes (7%) (Figure S1). Except for these more abundant phyla, Planctomycetes (3%), Actinobacteria (2%), Chlamydiae (1%), Gemmatimonadetes (1%), and Firmicutes (1%) were also detected (Figure S1). The relative abundance of bacteria at the phylum level differed significantly among the three age classes (Figure S2). In the bulk soil, the relative abundance of Acidobacteria and Chloroflexi and the relative abundance of Proteobacteria, Verrucomicrobia, Bacteroidetes, and Planctomycetes increased and decreased, respectively, with the age chronosequence (p < 0.05; Figure S2A). Moreover, the relative abundance of Actinobacteria in the rhizosphere increased with the age chronosequence, while that of Verrucomicrobia and Planctomycetes showed the opposite trends (p < 0.05; Figure S2B). The relative abundance of Chlamydiae, Gemmatimonadetes, and Firmicutes in the bulk soil or rhizosphere had no significant difference among the three age classes (p > 0.05). The G+ (Actinobacteria, Firmicutes, and Chloroflexi) to G bacteria (Acidobacteria, Proteobacteria, Bacteroidetes, Planctomycetes, Verrucomicrobia, and Gemmatimonadetes) ratio was significantly increased from the YR to OR plantations in both the bulk soil and rhizosphere (Figure S4), which indicated that the bacterial community shifted from r-strategists to k-strategists.

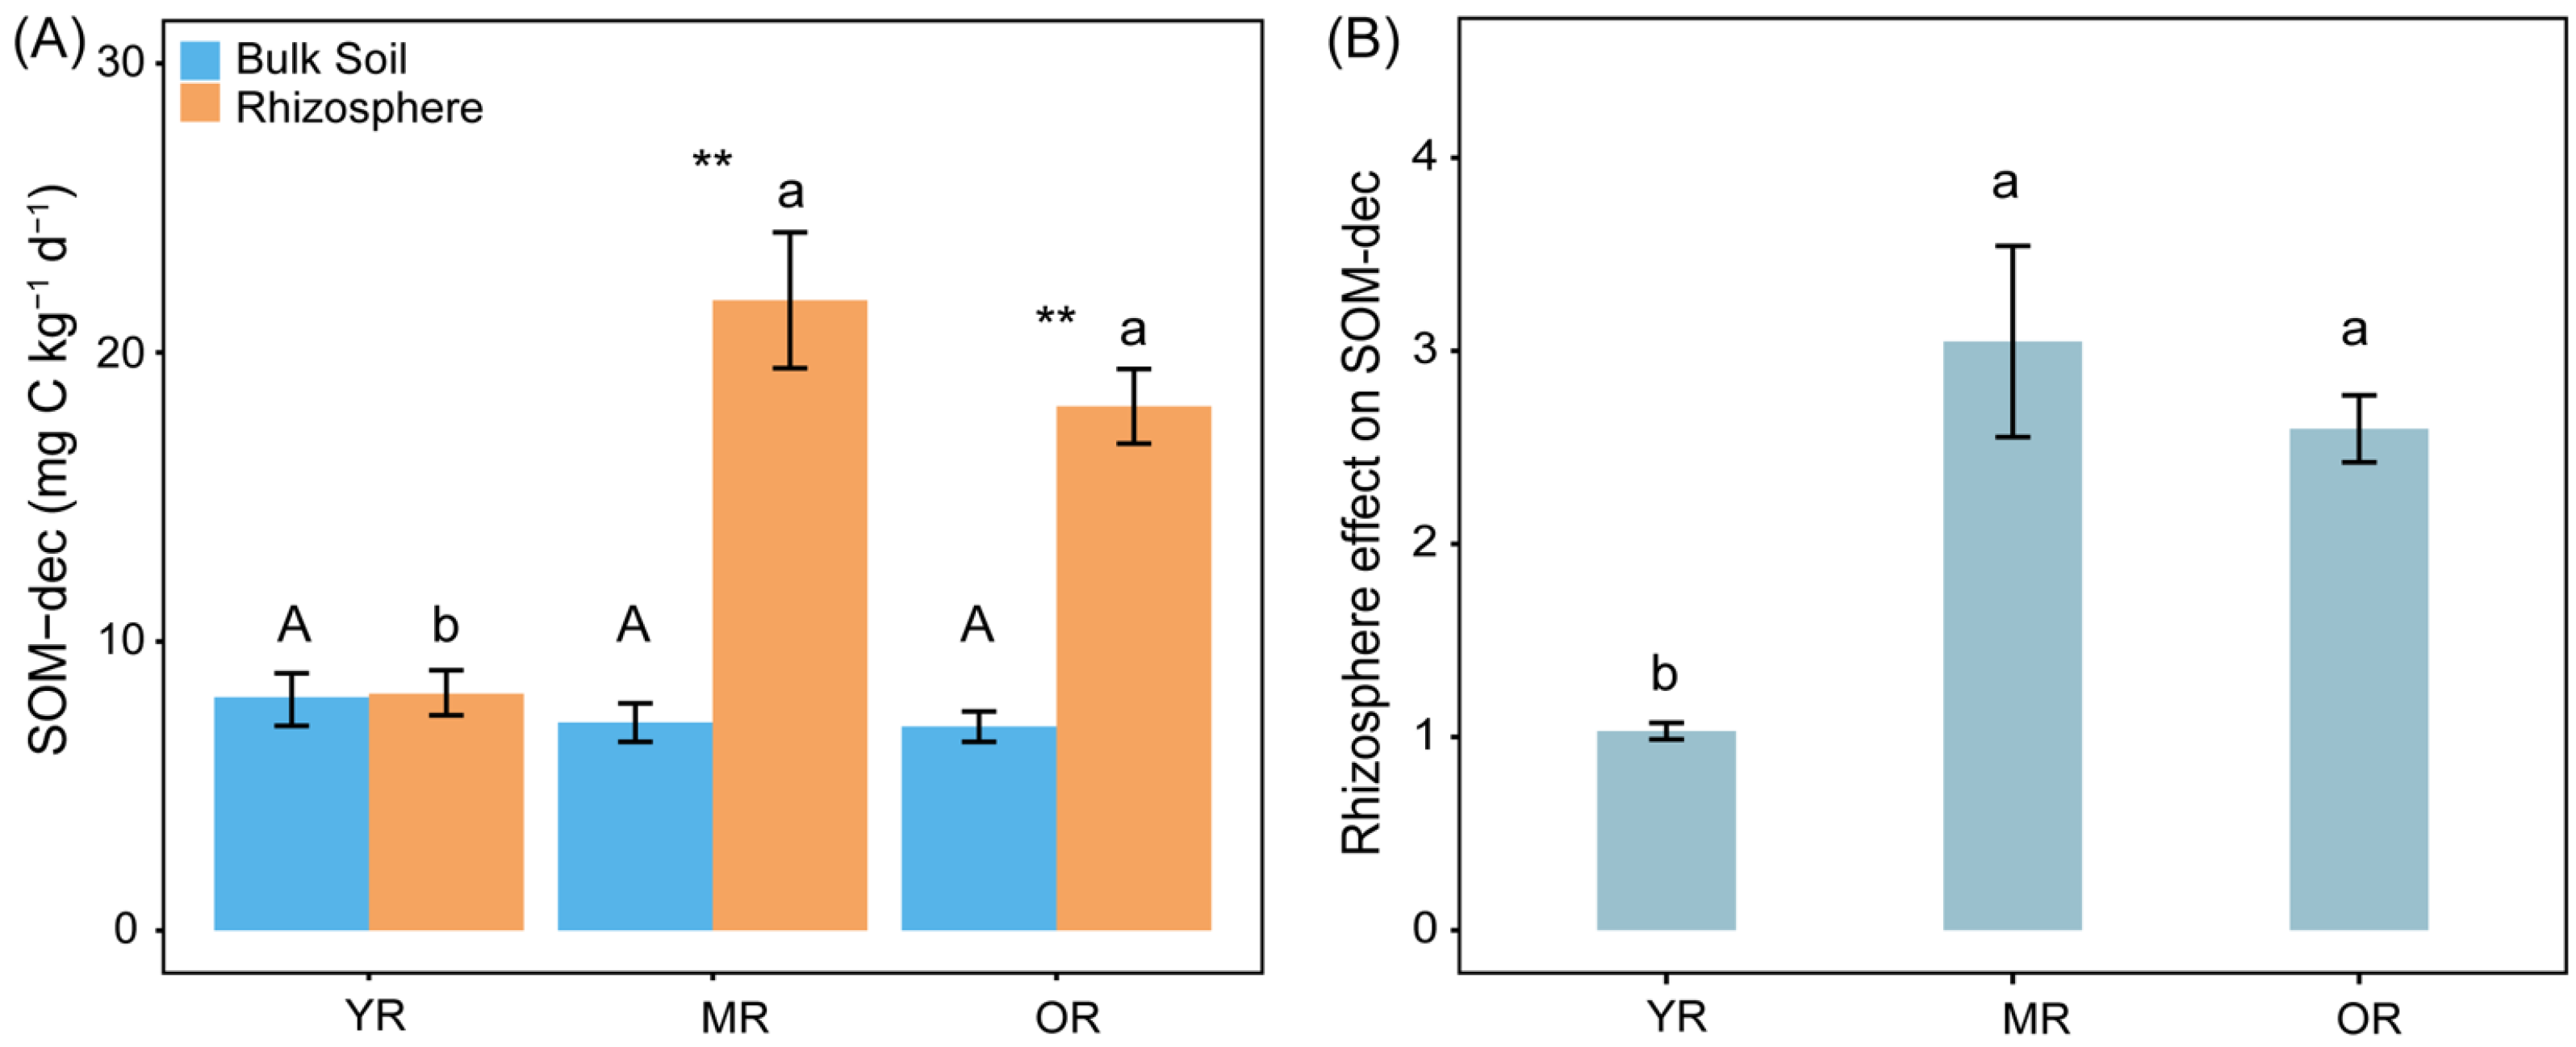
3.3. SOM Decomposition and RE on SOM Decomposition

The SOM decomposition rate ranged from 7.05 to 23.52 mg C kg−1 d−1 (Figure 3A). In the three rubber plantations, the SOM decomposition rates were higher in the rhizosphere soils of the MR and OR plantations (p < 0.05). The sampling position had no effect on the rate of SOM decomposition in the YR plantation; however, the rhizosphere of the MR and OR plantations showed a significantly higher SOM decomposition rate than that of the bulk soil (p < 0.05). Therefore, the RE was greater in the MR and OR plantations than in the YR plantation (Figure 3B; p < 0.05).

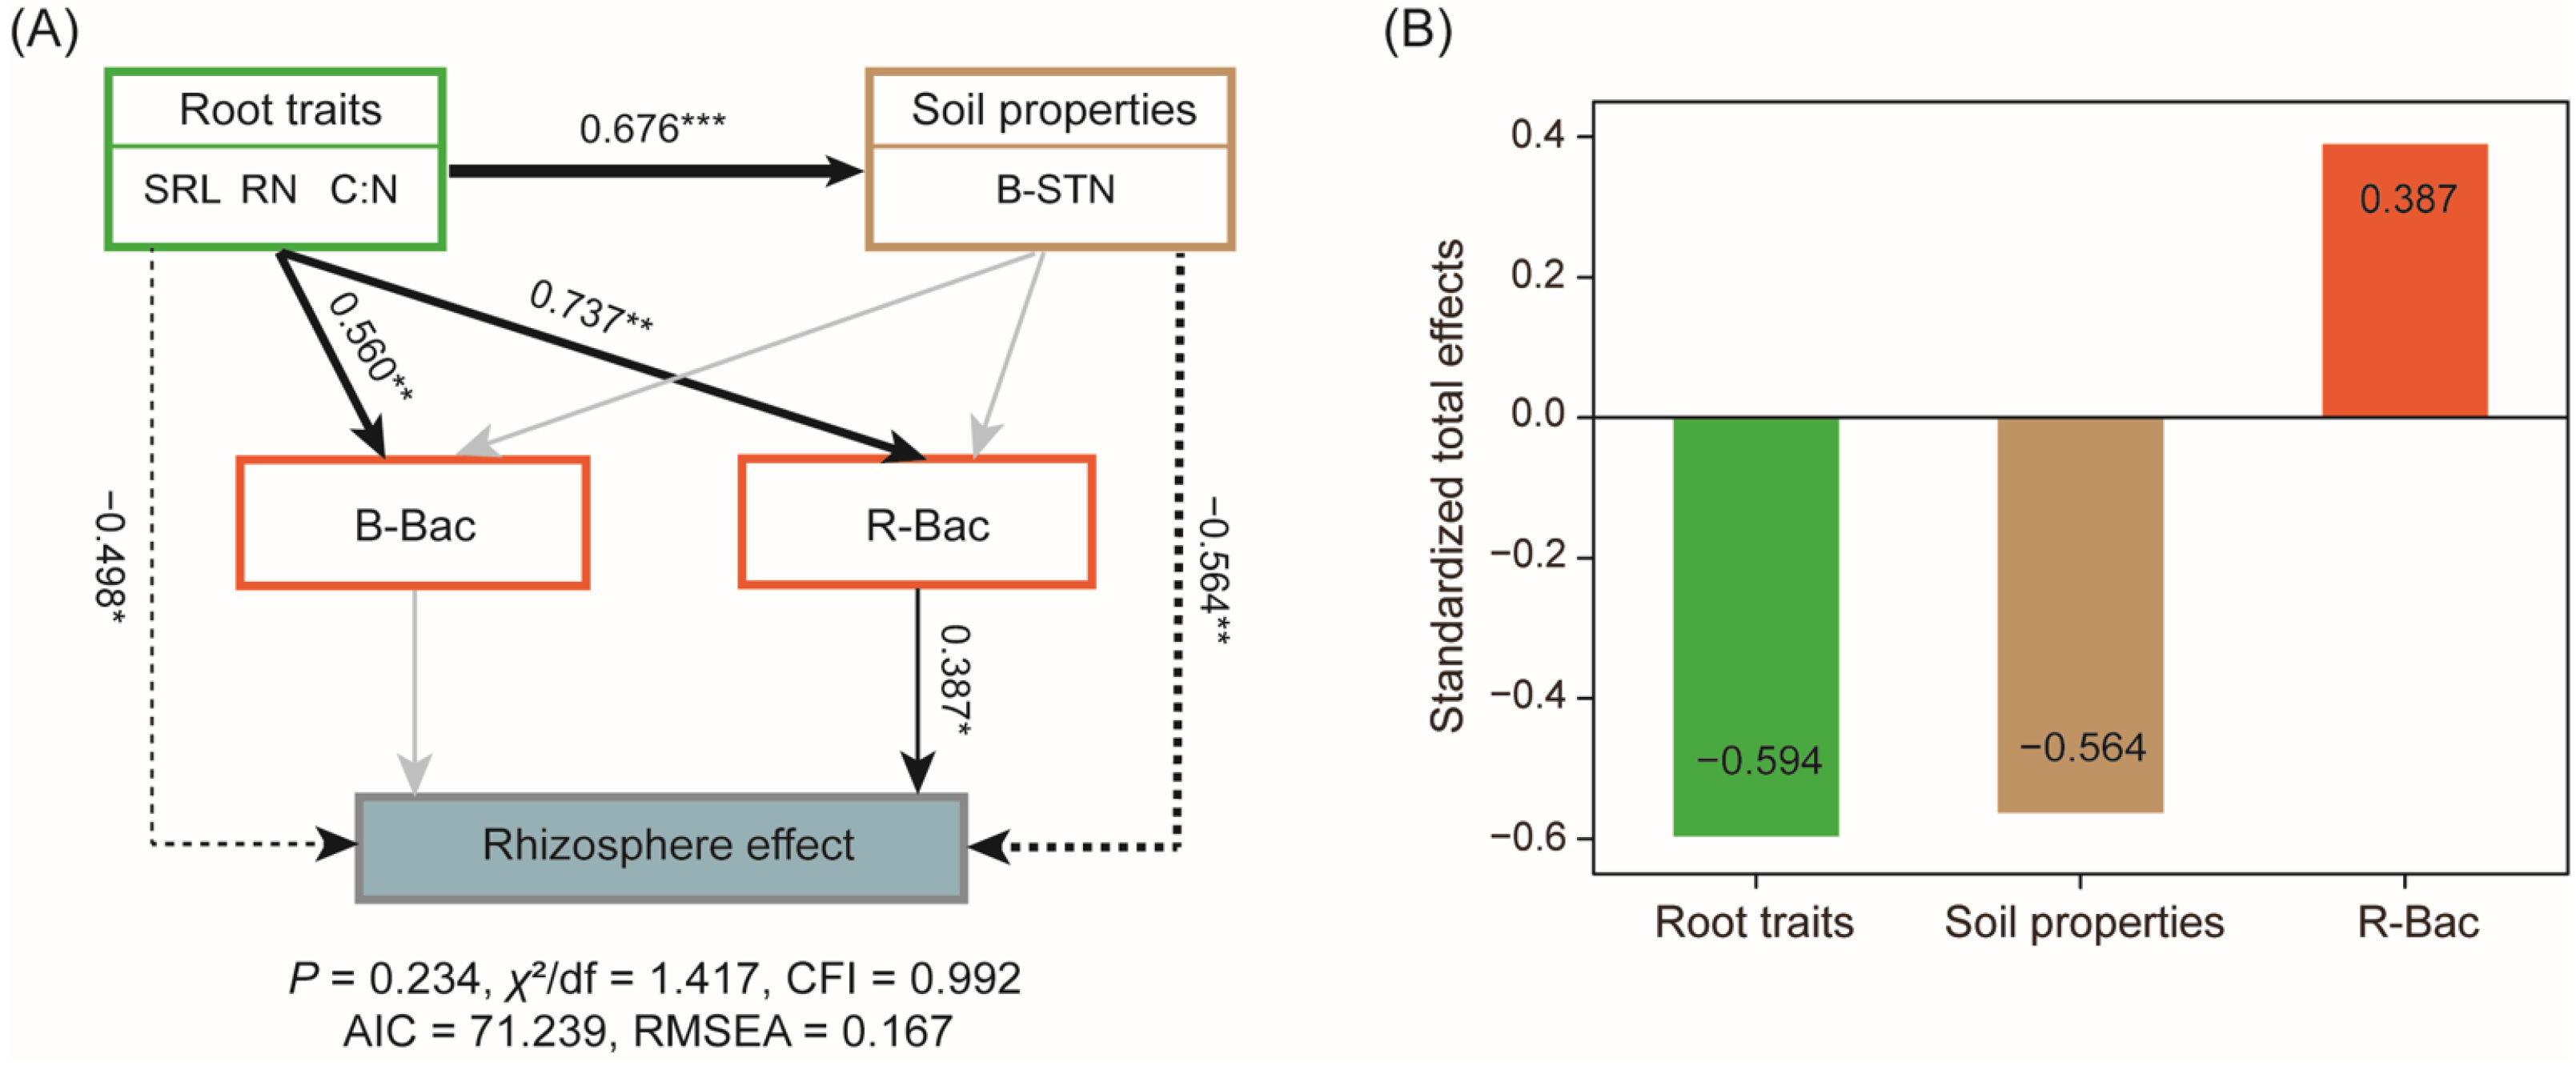
3.4. Dominant Determinants of RE on SOM Decomposition

According to the random forest analysis, the RN content (5.69% increase in MSE), bulk STN content (5.60% increase in MSE), root C:N (5.58% increase in MSE), SRL (5.07% increase in MSE), bulk soil bacterial composition (4.96% increase in MSE), and rhizosphere bacterial composition (4.44% increase in MSE) were the important variables identified by cross-validation for the RE on SOM decomposition along the age chronosequence of the rubber plantations (Figure S3). The SEM analysis further illustrated that among the examined variables, the RE was directly and indirectly related to root functional traits (e.g., SRL, RN, and root C:N) and directly associated with the bulk STN content and rhizosphere bacterial community composition (Figure 4A). The root traits had the largest standardised total effect (0.594) (Figure 4B). Among the root traits, the RE increased significantly with the root SRL and RN (p < 0.05, Figure 5A,B) but decreased with the root C:N (p = 0.009, Figure 5C).

4. Discussion

4.1. The RE on SOM Decomposition Increased with an Age Chronosequence of Rubber Plantations

The results demonstrated that the RE on SOM decomposition increased along a chronosequence of rubber plantations (Figure 3B), and this variation tendency was mainly attributed to the higher rhizosphere SOM decomposition rate in the older plantations (Figure 3A). These findings were consistent with a previous study which indicated that the rate of soil C decomposition is positively facilitated by REs [15]. The balances between the SOM decomposition and formation rates determine the SOC accumulation [46]. Generally, SOC storage is primarily regulated by plant detritus input, and roots may contribute more to the SOC dynamic compared to the aboveground part litter [47,48]. Root C inputs from plants to soil are comprised of root turnover, root-associated fungal turnover, and rhizodeposition (i.e., sloughed root cells and exudation) [49]. More active components in root-derived C can increase the SOM turnover via priming effects, and can promote slow-cycling C formation given their effects on microbial efficiency [50]. It has been proven that root biomass and rhizodeposition input have higher SOC fractions formation efficiency than the aboveground inputs [51]. In the present study, a higher root exudation rate in the MR and OR plantations (Table 1) might have been conducive to the higher RE on the SOM decomposition by increasing the activity of microbes, thereby resulting in a decreased rhizosphere SOC content (Figure 1).
In the present study, the root C:N showed a decreasing trend and the root exudates showed an increasing trend along the chronosequence of the rubber plantations (Table 1). One possible explanation may be that the old rubber was using less of the C that was used for growth and metabolic activity for development of the plant as whole, which resulted in the accumulation of C in the root exudates. A lower root C:N represents high-quality litter, which is decomposed fast by soil microbes [52]. Root exudates are important sources of soil’s dissolved organic C, which can be easily utilised by soil microbes and is a key precursor of SOC [53]. Roots release more labile C substrates into the rhizosphere, which stimulates the growth of rhizosphere-associated microbes, the production of enzymes, and the rate of SOM decomposition [54,55]. Soil microorganisms are the important decomposers, and their community composition regulate the decomposition rate of labile and recalcitrant SOM [56]. According to the results, the soil bacterial compositions were significantly different among the three age classes (Figure 2A). On the one hand, Proteobacteria, which can efficiently utilize the labile C secreted by the plant’s fine roots, decreased along the age chronosequence of plantations (Figure S2). On the other hand, Actinobacteria and Chloroflexi, which use more recalcitrant SOM-derived C [57], increased along with the age chronosequence of the plantations (Figure S2); therefore, the root traits and soil bacterial composition in the rhizosphere of older plantations might accelerate SOM decomposition, thereby reducing SOC accumulation.

4.2. Root Functional Traits Mediate RE on SOM Decomposition along a Chronosequence of Rubber Plantations

As hypothesised, the differences in the REs on SOM decomposition among the three age classes were determined by the root traits. According to the random forest and SEM analyses, the RN content and root C:N, as well as the root SRL were dominant in mediating the RE on the SOM decomposition (Figure 4 and Figure S3). The results are consistent with the previous studies, which showed that the RN content and root C:N for wood and herbaceous plants were positively and negatively associated with the RE, respectively [27,58]. Despite the slower decomposition of root tissues associated with plant litter than aboveground litter, the lower quality of the tissues induces greater priming [59]. The input of lower C:N root litter in older rubber plantations might aggravate the mineralisation of SOM in the rhizosphere, thereby promoting a greater RE on the SOM decomposition. These results support the previous hypothesis that root chemical traits (e.g., C and N contents) control the priming processes [60]. In addition, there was an increasing trend in the RE of the SRL on the SOM decomposition (Figure 5A), which was inconsistent with the study which showed that there was no significant linear correlation between the SRL and RE on the SOM decomposition [27]. It has been indicated that the root SRL is negatively correlated with soil aggregate stability [61]; therefore, a high SRL is more likely to disrupt the soil matrix-protected organic C in aggregates to accelerate SOM decomposition. Moreover, species with a high SRL can provide high-quality root litter and have a fast turnover rate [23,62], which could accelerate the SOM decomposition, especially in rhizosphere soil. However, some studies have suggested that root morphological traits (such as the diameter and SRL) are not clearly related to SOM stabilisation mechanisms, and their relationship remains to be investigated [60,63,64].
Additionally, root traits could indirectly regulate the RE on SOM decomposition by changing the soil bacterial community composition in the rhizosphere (Figure 4). Plant roots connect tightly with soil microorganisms in the rhizosphere; thus, root traits are important for predicting soil microbial groups and functional guilds [33]. In the present study, the root functional traits (e.g., RN content, root C:N, and SRL) affected the rhizosphere soil bacterial community composition. It has been proven that the root C:N is negatively correlated with the ratio of G+ to G bacteria [33]. A root input with a low C:N can provide sufficient nutrients for G+ bacteria to decompose higher levels of recalcitrant SOM [65]. Additionally, the variation in the G+ to G bacteria ratio can reflect the microbial carbon utilisation strategy (such as k-strategists and r-strategists) [66]. For example, r-strategists are copiotrophic and have high N demands, and they prefer to utilize easily available substrates, while k-strategists are oligotrophic and prefer to use recalcitrant C substrates and have lower N demands [67]. Cui et al. found that bacterial groups with different carbon utilisation strategies were significantly correlated with rhizosphere priming effects in paddy soils [67]. Similarly, our results showed that the ratio of G+ bacteria to G bacteria in the rhizosphere increased along the age chronosequence of plantations (Figure S4), indicating that the bacterial community shifted its carbon utilisation strategy from r-strategists to k-strategists. The observed increase in the ratio of G+:G bacteria in the older plantations was due to a larger increase in G+ bacteria (mainly Actinobacteria; Figure S4). Hence, the lower root C:N and higher G+:G bacteria in older rubber plantations would accelerate SOM decomposition in the rhizosphere, thereby changing the RE; however, the STN content, and not the bacterial community, was an important factor that directly regulated the RE on SOM decomposition in the bulk soil with the plantation age (Figure 4A). Along the age chronosequence of the rubber plantations, the STN content in bulk soil decreased significantly (Figure 1), which might be attributed to the higher root N uptake from the soil with variation in the root traits [58] or symbiotic relationships with N-fixing bacteria [68]. Although the carbon utilisation strategy of the bacterial community in the bulk soil was similar to that in the rhizosphere (Figure S4), the decomposition capacity of bacteria in the bulk soil was perhaps constrained by low N availability [17]. The changes in the SOM decomposition rate in the rhizosphere soil and bulk soil led to a higher RE in the older plantations. These results combined indicate that the STN content decreases along with an increased root N uptake capacity, resulting in a higher RE on the SOM decomposition and a lower SOC content in older rubber plantations. In terms of the RE on SOM decomposition, nitrogen fertiliser should be applied correctly in the process of managing rubber plantations, such as increasing nitrogen fertilizer application in old rubber plantations, that can be achieved through a combination of chemical nitrogen fertilizer and manure, which could facilitate SOM stability by mediating soil C mineralization.

4.3. Study Limitations

This study has a few limitations. First, generally, isotope methods, which can distinguish native SOC- and root-derived CO2 in intact plant-soil systems, are used to determine the rhizosphere priming effect on SOM decomposition accurately [69]. Given that isotope labelling in situ is difficult for woody species, we chose to determine the RE by incubating the rhizosphere and bulk soil in the present study. Although this method can calculate the RE on SOM decomposition and has been used in many studies [27,70,71], the isotope method should be widely applied to in situ research of forest ecosystems in the future. Second, we just studied the quantity of root exudates and found that it had no significant correlation with the RE on SOM decomposition. It has been proved that various root exuded chemicals exhibit complex effects on microbes [72,73]; therefore, the quality of root exudates should be quantified. Third, more attention should be paid to the effects of understory vegetation in rubber plantations on microbial communities in future studies.

5. Conclusions

We investigated the variations in REs on SOM decomposition along an age chronosequence (4, 15, and 30 years) of rubber plantations and explored the underlying mechanisms. The SOC content was lower in MR and OR plantations. This may be attributed to the greater RE on SOM decomposition in older rubber plantations. The root traits (e.g., SRL, RN, and root C:N) were directly linked to changes in the RE on SOM decomposition and could also regulate the RE indirectly by changing the rhizosphere bacterial carbon utilisation strategy (from r-strategists to k-strategists) and reducing the bulk soil N content from YR to OR plantations. Overall, the present study provides new insights into the view that root functional traits, especially morphological (SRL) and chemical traits (RN and root C:N), are important regulators of RE on SOM decomposition during the development of rubber plantations. A better understanding of the ecological processes that are influenced by root functional traits in rubber plantations may be vital for choosing effective management strategies to improve soil C conditions.

Supplementary Materials

The following supporting information can be downloaded at: https://www.mdpi.com/article/10.3390/f14112209/s1, Figure S1: Relative abundance of major phyla within the bacterial community in different age classes of rubber plantation; Figure S2: Results of phyla show significant changes in the bacterial community in bulk soil (A) and rhizosphere soil (B) among three age classes of rubber plantation. The 95% confidence intervals represent the different proportion of two age classes; Figure S3: Relative importance of independent variables for the rhizosphere effect on soil organic matter decomposition; Figure S4: Effects of age classes on the gram-positive (G+) bacteria, gram-negative (G) bacteria, and the ratios of G+ to G bacteria (G+:G) in the bulk soil (A) and rhizosphere soil (B).

Author Contributions

Methodology, data curation, and writing—original draft, G.L.; methodology, investigation, and validation, D.D. and M.Y.; resources, and funding acquisition, Y.S.; writing—review and editing, Y.S. All authors have read and agreed to the published version of the manuscript.

Funding

This research was supported by the National Natural Science Foundation of China (No. 32201629), the Hainan Provincial Natural Science Foundation of China (No. 421QN193), and the National Key Research and Development Program of China (No. 2021YFD2200403-04).

Data Availability Statement

The data presented in this study are available on request from the corresponding author. The data are not publicly available due to privacy restrictions.

Conflicts of Interest

The authors declare that they have no known competing financial interest or personal relationship that could have appeared to influence the work reported in this paper.

References

  1. Baudron, F.; Giller, K.E. Agriculture and nature: Trouble and strife? Biol. Conserv. 2014, 170, 232–245. [Google Scholar] [CrossRef]
  2. Gibbs, H.K.; Ruesch, A.S.; Achard, F.; Clayton, M.K.; Holmgren, P.; Ramankutty, N.; Foley, J.A. Tropical forests were the primary sources of new agricultural land in the 1980s and 1990s. Proc. Natl. Acad. Sci. USA 2010, 107, 16732–16737. [Google Scholar] [CrossRef] [PubMed]
  3. FAOSTAT. Production/Crops: Oil, Palm Fruit. 2018. Available online: http://faostat.fao.org (accessed on 10 December 2021).
  4. Lan, G.Y.; Wu, Z.X.; Yang, C.; Sun, R.; Chen, B.Q.; Zhang, X. Tropical rainforest conversion into rubber plantations results in changes in soil fungal composition, but underling mechanisms of community assembly remain unchanged. Geoderma 2020, 375, 114505. [Google Scholar] [CrossRef]
  5. Warren-Thomas, E.; Dolman, P.M.; Edwards, D.P. Increasing demand for natural rubber necessitates a robust sustainability initiative to mitigate impacts on tropical biodiversity. Conserv. Lett. 2015, 8, 230–241. [Google Scholar] [CrossRef]
  6. Guillaume, T.; Kotowska, M.M.; Hertel, D.; Knohl, A.; Krashevska, V.; Murtilaksono, K.; Scheu, S.; Kuzyakov, Y. Carbon costs and benefits of Indonesian rainforest conversion to plantations. Nat. Commun. 2018, 9, 2388. [Google Scholar] [CrossRef]
  7. Don, A.; Schumacher, J.; Freibauer, A. Impact of tropical land-use change on soil organic carbon stocks-a meta-analysis. Glob. Chang. Biol. 2011, 17, 1658–1670. [Google Scholar] [CrossRef]
  8. de Blécourt, M.; Hänsel, V.M.; Brumme, R.; Corre, M.D.; Veldkamp, E. Soil redistribution by terracing alleviates soil organic carbon losses caused by forest conversion to rubber plantation. For. Ecol. Manag. 2014, 313, 26–33. [Google Scholar] [CrossRef]
  9. Chen, C.F.; Liu, W.J.; Wu, J.N.; Jiang, X.J.; Zhu, X.A. Can intercropping with the cash crop help improve the soil physico-chemical properties of rubber plantations? Geoderma 2019, 335, 149–160. [Google Scholar] [CrossRef]
  10. Wauters, J.B.; Coudert, S.; Grallien, E.; Jonard, M.; Ponette, Q. Carbon stock in rubber tree plantations in Western Ghana and MatoGrosso (Brazil). For. Ecol. Manag. 2008, 255, 2347–2361. [Google Scholar] [CrossRef]
  11. Kurmi, B.; Nath, A.J.; Lal, R.; Das, A.K. Water stable aggregates and the associated active and recalcitrant carbon in soil under rubber plantation. Sci. Total Environ. 2020, 703, 135498. [Google Scholar] [CrossRef]
  12. Liu, C.G.; Jin, Y.Q.; Liu, C.A.; Tang, J.W.; Wang, Q.W.; Xu, M.X. Phosphorous fractions in soils of rubber-based agroforestry systems: Influence of season, management and stand age. Sci. Total Environ. 2018, 616–617, 1576–1588. [Google Scholar] [CrossRef] [PubMed]
  13. Sun, Y.C.; Ma, Y.X.; Cao, K.F.; Li, H.M.; Shen, J.X.; Liu, W.J.; Di, L.; Mei, C.C. Temporal changes of ecosystem carbon stocks in rubber plantations in Xishuangbanna, Southwest China. Pedosphere 2017, 27, 737–746. [Google Scholar] [CrossRef]
  14. Panklang, P.; Thoumazeau, A.; Chiarawipa, R.; Sdoodee, S.; Sebag, D.; Gay, F.; Thaler, P.; Brauman, A. Rubber, rubber and rubber: How 75 years of successive rubber plantations rotations affect topsoil quality. Land Degrad. Dev. 2022, 33, 1159–1169. [Google Scholar] [CrossRef]
  15. Finzi, A.C.; Abramoff, R.Z.; Spiller, K.S.; Brzostek, E.R.; Darby, B.A.; Kramer, M.A.; Phillips, R.P. Rhizosphere processes are quantitatively important components of terrestrial carbon and nutrient cycles. Glob. Chang. Biol. 2015, 21, 2082–2094. [Google Scholar] [CrossRef]
  16. Jiang, Z.H.; Liu, Y.Z.; Yang, J.P.; Brookes, P.C.; Gunina, A. Rhizosphere priming regulates soil organic carbon and nitrogen mineralization: The significance of abiotic mechanisms. Geoderma 2021, 385, 114877. [Google Scholar] [CrossRef]
  17. Chen, X.; Ding, Z.J.; Tang, M.; Zhu, B. Greater variations of rhizosphere effects within mycorrhizal group than between mycorrhizal group in a temperate forest. Soil Biol. Biochem. 2018, 126, 237–246. [Google Scholar] [CrossRef]
  18. Bardgett, R.D.; Mommer, L.; De Vries, F.T. Going underground: Root traits as drivers of ecosystem processes. Trends Ecol. Evol. 2014, 29, 692–699. [Google Scholar] [CrossRef]
  19. Carrillo, Y.; Bell, C.; Koyama, A.; Canarini, A.; Boot, C.M.; Wallenstein, M.; Pendall, E. Plant traits, stoichiometry and microbes as drivers of decomposition in the rhizosphere in a temperate grassland. J. Ecol. 2017, 105, 1750–1765. [Google Scholar] [CrossRef]
  20. Orwin, K.H.; Buckland, S.M.; Johnson, D.; Turner, B.L.; Smart, S.; Oakley, S.; Bardgett, R.D. Linkages of plant traits to soil properties and the functioning of temperate grassland. J. Ecol. 2010, 98, 1074–1083. [Google Scholar] [CrossRef]
  21. Reich, P.B. The world-wide ‘fast–slow’ plant economics spectrum: A traits manifesto. J. Ecol. 2014, 102, 275–301. [Google Scholar] [CrossRef]
  22. Sun, L.J.; Ataka, M.; Kominami, Y.; Yoshimura, K. Relationship between fine-root exudation and respiration of two Quercus species in a Japanese temperate forest. Tree Physiol. 2017, 37, 1011–1020. [Google Scholar] [CrossRef] [PubMed]
  23. de Graaff, M.A.; Six, J.; Jastrow, J.D.; Schadt, C.W.; Wullschleger, S.D. Variation in root architecture among switchgrass cultivars impacts root decomposition rates. Soil Biol. Biochem. 2013, 58, 198–206. [Google Scholar] [CrossRef]
  24. Ontl, T.A.; Cambardella, C.A.; Schulte, L.A.; Kolka, R.K. Factors influencing soil aggregation and particulate organic matter responses to bioenergy crops across a topographic gradient. Geoderma 2015, 255, 1–11. [Google Scholar] [CrossRef]
  25. Sun, L.J.; Ataka, M.; Han, M.G.; Han, Y.F.; Gan, D.Y.; Xu, T.L.; Guo, Y.P.; Zhu, B. Root exudation as a major competitive fine-root functional trait of 18 coexisting species in a subtropical forest. New Phytol. 2021, 229, 259–271. [Google Scholar] [CrossRef] [PubMed]
  26. Shahzad, T.; Chenu, C.; Genet, P.; Barot, S.; Perveen, N.; Mougin, C.; Fontaine, S. Contribution of exudates, arbuscular mycorrhizal fungi and litter depositions to the rhizosphere priming effect induced by grassland species. Soil Biol. Biochem. 2015, 80, 146–155. [Google Scholar] [CrossRef]
  27. Han, M.G.; Sun, L.J.; Gan, D.Y.; Fu, L.C.; Zhu, B. Root functional traits are key determinants of the rhizosphere effect on soil organic matter decomposition across 14 temperate hardwood species. Soil Biol. Biochem. 2020, 151, 108019. [Google Scholar] [CrossRef]
  28. Cheng, W.; Kuzyakov, Y. Root effects on soil organic matter decomposition. In Roots and Soil Management: Interactions between Roots and the Soil; Agronomy Monograph No. 48; Zobel, R.W., Wright, S.F., Eds.; American Society of Agronomy, Crop Science Society of America, Soil Science Society of America: Madison, WI, USA, 2005; pp. 119–143. [Google Scholar]
  29. Baldrian, P.; Kolařík, M.; Štursová, M.; Kopecký, J.; Valášková, V.; Větrovský, T.; Žifčáková, L.; Šnajdr, J.; Rídl, J.; Vlček, Č.; et al. Active and total microbial communities in forest soil are largely different and highly stratified during decomposition. ISME J. 2012, 6, 248–258. [Google Scholar] [CrossRef]
  30. Chen, R.R.; Senbayram, M.; Blagodatsky, S.; Myachina, O.; Dittert, K.; Lin, X.G.; Blagodatskaya, E.; Kuzyakov, Y. Soil C and N availability determine the priming effect: Microbial N mining and stoichiometric decomposition theories. Glob. Chang. Biol. 2014, 20, 2356–2367. [Google Scholar] [CrossRef]
  31. Kuzyakov, Y.; Hill, P.W.; Jones, D.L. Root exudate components change litter decomposition in a simulated rhizosphere depending on temperature. Plant Soil 2007, 290, 293–305. [Google Scholar] [CrossRef]
  32. Ai, C.; Liang, G.Q.; Sun, J.W.; Wang, X.B.; Zhou, W. Responses of extracellular enzyme activities and microbial community in both the rhizosphere and bulk soil to long-term fertilization practices in a fluvo-aquic soil. Geoderma 2012, 173, 330–338. [Google Scholar] [CrossRef]
  33. Spitzer, C.M.; Lindahl, B.; Wardle, D.A.; Sundqvist, M.K.; Gundale, M.J.; Fanin, N.; Kardol, P. Root trait–microbial relationships across tundra plant species. New Phytol. 2021, 229, 1508–1520. [Google Scholar] [CrossRef] [PubMed]
  34. Liu, B.T.; Han, F.; Ning, P.; Li, H.B.; Rengel, Z. Root traits and soil nutrient and carbon availability drive soil microbial diversity and composition in a northern temperate forest. Plant Soil 2022, 479, 281–299. [Google Scholar] [CrossRef]
  35. Meier, I.C.; Tückmantel, T.; Heitkötter, J.; Müller, K.; Preusser, S.; Wrobel, T.J.; Kandeler, E.; Marschner, B.; Leuschner, C. Root exudation of mature beech forests across a nutrient availability gradient: The role of root morphology and fungal activity. New Phytol. 2020, 226, 583–594. [Google Scholar] [CrossRef]
  36. Walkley, A.; Black, I.A. An examination of the Degtjareff method for determining soil organic matter, and a proposed modification of the chromic acid titration method. Soil Sci. 1934, 37, 29–38. [Google Scholar] [CrossRef]
  37. Guebel, D.V.; Nudel, B.C.; Giulietti, A.M. A simple and rapid micro-Kjeldahl method for total nitrogen analysis. Biotechnol. Tech. 1991, 5, 427–430. [Google Scholar] [CrossRef]
  38. Bao, S. Soil and Agricultural Chemistry Analysis; Agriculture Publication: Beijing, China, 2000; pp. 25–103. [Google Scholar]
  39. Zheng, J.F.; Zhang, X.H.; Li, L.Q.; Zhang, P.J.; Pan, G.X. Effect of long-term fertilization on C mineralization and production of CH4 and CO2 under anaerobic incubation from bulk samples and particle size fractions of a typical paddy soil. Agric. Ecosyst. Environ. 2007, 120, 129–138. [Google Scholar] [CrossRef]
  40. Caporaso, J.G.; Kuczynski, J.; Stombaugh, J.; Bittinger, K.; Bushman, F.D.; Costello, E.K.; Fierer, N.; Gonzalez Peña, A.; Goodrich, J.K.; Gordon, J.I.; et al. QIIME allows analysis of high-throughput community sequencing data. Nat. Methods 2010, 7, 335–336. [Google Scholar] [CrossRef]
  41. Edgar, R.C.; Haas, B.J.; Clemente, J.C.; Quince, C.; Knight, R. UCHIME improves sensitivity and speed of chimera detection. Bioinformatics 2011, 27, 2194–2200. [Google Scholar] [CrossRef]
  42. Cole, J.R.; Wang, Q.; Cardenas, E.; Fish, J.; Chai, B.; Farris, R.J.; Kulam-SyedMohideen, A.S.; McGarrell, D.M.; Marsh, T.; Garrity, G.M.; et al. The Ribosomal Database Project: Improved alignments and new tools for rRNA analysis. Nucleic Acids Res. 2009, 37, 141–145. [Google Scholar] [CrossRef]
  43. Phillips, R.P.; Erlitz, Y.; Bier, R.; Bernhardt, E.S. New approach for capturing soluble root exudates in forest soils. Funct. Ecol. 2008, 22, 990–999. [Google Scholar] [CrossRef]
  44. Meyer, N.; Welp, G.; Rodionov, A.; Borchard, N.; Martius, C.; Amelung, W. Nitrogen and phosphorus supply controls soil organic carbon mineralization in tropical topsoil and subsoil. Soil Biol. Biochem. 2018, 119, 152–161. [Google Scholar] [CrossRef]
  45. R Core Team. R: A Language and Environment for Statistical Computing; R Foundation for Statistical Computing: Vienna, Austria, 2020. [Google Scholar]
  46. Sahrawat, K.L. Organic matter accumulation in submerged soils. Adv. Agron. 2004, 81, 169–201. [Google Scholar]
  47. De Deyn, G.B.; Cornelissen, J.H.C.; Bardgett, R.D. Plant functional traits and soil carbon sequestration in contrasting biomes. Ecol. Lett. 2008, 11, 516–531. [Google Scholar] [CrossRef] [PubMed]
  48. Ghafoor, A.; Poeplau, C.; Kätterer, T. Fate of straw-and root-derived carbon in a Swedish agricultural soil. Biol. Fertil. Soils 2017, 53, 257–267. [Google Scholar] [CrossRef]
  49. Keller, A.B.; Brzostek, E.R.; Craig, M.E.; Fisher, J.B.; Phillips, R.P. Root-derived inputs are major contributors to soil carbon in temperate forests, but vary by mycorrhizal type. Ecol. lett. 2021, 24, 626–635. [Google Scholar] [CrossRef]
  50. Sokol, N.W.; Bradford, M.A. Microbial formation of stable soil carbon is more efficient from belowground than aboveground input. Nat. Geosci. 2019, 12, 46–53. [Google Scholar] [CrossRef]
  51. Villarino, S.H.; Pinto, P.; Jackson, R.B.; Piñeiro, G. Plant rhizodeposition: A key factor for soil organic matter formation in stable fractions. Sci. Adv. 2021, 7, eabd3176. [Google Scholar] [CrossRef] [PubMed]
  52. Cotrufo, M.F.; Wallenstein, M.D.; Boot, C.M.; Denef, K.; Paul, E.B. The Microbial Efficiency-Matrix Stabilization (MEMS) framework integrates plant litter decomposition with soil organic matter stabilization: Do labile plant inputs form stable soil organic matter? Glob. Chang. Biol. 2013, 19, 988–995. [Google Scholar] [CrossRef]
  53. Pausch, J.; Kuzyakov, Y. Carbon input by roots into the soil: Quantification of rhizodeposition from root to ecosystem scale. Glob. Chang. Biol. 2018, 24, 1–12. [Google Scholar] [CrossRef]
  54. Hobbie, S.E. Contrasting effects of substrate and fertilizer nitrogen on the early stages of litter decomposition. Ecosystems 2005, 8, 644–656. [Google Scholar] [CrossRef]
  55. Manzoni, S.; Jackson, R.B.; Trofymow, J.A.; Porporato, A. The global stoichiometry of litter nitrogen mineralization. Science 2008, 321, 684–686. [Google Scholar] [CrossRef] [PubMed]
  56. Bardgett, R.D.; Freeman, C.; Ostle, N.J. Microbial contributions to climate change through carbon cycle feedbacks. ISME J. 2008, 2, 805–814. [Google Scholar] [CrossRef] [PubMed]
  57. Kramer, C.; Gleixner, G. Soil organic matter in soil depth profiles: Distinct carbon preferences of microbial groups during carbon transformation. Soil Biol. Biochem. 2008, 40, 425–433. [Google Scholar] [CrossRef]
  58. Henneron, L.; Cros, C.; Picon-Cochard, C.; Rahimian, V.; Fontaine, S. Plant economic strategies of grassland species control soil carbon dynamics through rhizodeposition. J. Ecol. 2020, 108, 528–545. [Google Scholar] [CrossRef]
  59. Shahbaz, M.; Kuzyakov, Y.; Sanaullah, M.; Heitkamp, F.; Zelenev, V.; Kumar, A.; Blagodatskaya, E. Microbial decomposition of soil organic matter is mediated by quality and quantity of crop residues: Mechanisms and thresholds. Biol. Fertil. Soils 2017, 53, 287–301. [Google Scholar] [CrossRef]
  60. Poirier, V.; Roumet, C.; Munson, A.D. The root of the matter: Linking root traits and soil organic matter stabilization processes. Soil Biol. Biochem. 2018, 120, 246–259. [Google Scholar] [CrossRef]
  61. Garcia, L.; Damour, G.; Gary, C.; Follain, S.; Le Bissonnais, Y.; Metay, A. Trait-based approach for agroecology: Contribution of service crop root traits to explain soil aggregate stability in vineyards. Plant Soil 2019, 435, 1–14. [Google Scholar] [CrossRef]
  62. de Vries, F.T.; Manning, P.; Tallowin, J.R.B.; Mortimer, S.R.; Pilgrim, E.S.; Harrison, K.A.; Hobbs, P.J.; Quirk, H.; Shipley, B.; Cornelissen, J.H.C.; et al. Abiotic drivers and plant traits explain landscape-scale patterns in soil microbial communities. Ecol. Lett. 2012, 15, 1230–1239. [Google Scholar] [CrossRef]
  63. Chao, L.; Liu, Y.; Zhang, W.; Wang, Q.K.; Guan, X.; Yang, Q.P.; Chen, L.C.; Zhang, J.B.; Hu, B.Q.; Liu, Z.F.; et al. Root functional traits determine the magnitude of the rhizosphere priming effect among eight tree species. Oikos 2023, 2023, e09638. [Google Scholar] [CrossRef]
  64. Yin, L.M.; Xiao, W.; Dijkstra, F.A.; Zhu, B.; Wang, P.; Cheng, W.X. Linking absorptive roots and their functional traits with rhizosphere priming of tree species. Soil Biol. Biochem. 2020, 150, 107997. [Google Scholar] [CrossRef]
  65. Fanin, N.; Kardol, P.; Farrell, M.; Nilsson, M.; Gundale, M.J.; Wardle, D.A. The ratio of Gram-positive to Gram-negative bacterial PLFA markers as an indicator of carbon availability in organic soils. Soil Biol. Biochem. 2019, 128, 111–114. [Google Scholar] [CrossRef]
  66. Zhou, G.X.; Qiu, X.W.; Chen, L.; Zhang, C.Z.; Ma, D.H.; Zhang, J.B. Succession of organics metabolic function of bacterial community in response to addition of earthworm casts and zeolite in maize straw composting. Bioresour. Technol. 2019, 280, 229–238. [Google Scholar] [CrossRef] [PubMed]
  67. Cui, H.; Chen, P.F.; He, C.; Jiang, Z.H.; Lan, R.; Yang, J.P. Soil microbial community structure dynamics shape the rhizosphere priming effect patterns in the paddy soil. Sci. Total Environ. 2023, 857, 159459. [Google Scholar] [CrossRef]
  68. Monteiro, P.H.R.; Kaschuk, G.; Winagraski, E.; Auer, C.G.; Higa, A.R. Rhizobial inoculation in black wattle plantation (Acacia mearnsii De Wild.) in production systems of southern Brazil. Braz. J. Microbiol. 2019, 50, 989–998. [Google Scholar] [CrossRef] [PubMed]
  69. Kuzyakov, Y. Sources of CO2 efflux from soil and review of partitioning methods. Soil Biol. Biochem. 2006, 38, 425–448. [Google Scholar] [CrossRef]
  70. Phillips, R.P.; Fahey, T.J. Tree species and mycorrhizal associations influence the magnitude of rhizosphere effects. Ecology 2006, 87, 1302–1313. [Google Scholar] [CrossRef]
  71. Gan, D.Y.; Zeng, H.; Zhu, B. The rhizosphere effect on soil gross nitrogen mineralization: A meta-analysis. Soil Ecol. Lett. 2022, 4, 144–154. [Google Scholar] [CrossRef]
  72. Kong, C.H.; Zhang, S.Z.; Li, Y.H.; Xia, Z.C.; Yang, X.F.; Meiners, S.J.; Wang, P. Plant neighbor detection and allelochemical response are driven by root-secreted signaling chemicals. Nat. Commun. 2018, 9, 3867. [Google Scholar] [CrossRef]
  73. Zhalnina, K.; Louie, K.B.; Hao, Z.; Mansoori, N.; da Rocha, U.N.; Shi, S.; Cho, H.; Karaoz, U.; Loqu’e, D.; Bowen, B.P.; et al. Dynamic root exudate chemistry and microbial substrate preferences drive patterns in rhizosphere microbial community assembly. Nat. Microbiol. 2018, 3, 470–480. [Google Scholar] [CrossRef]
Figure 1. Soil physicochemical properties in bulk and rhizosphere soils along age chronosequence of rubber plantations. YR: young rubber plantation; MR: middle-aged rubber plantation; OR: old rubber plantation; SOC: soil organic carbon; STN: soil total nitrogen; STP: soil total phosphorus. The different capital letters indicate soil properties in bulk soil with significant differences among the three age classes. The different lowercase letters indicate soil properties in rhizosphere soil with significant differences among the three age classes (p < 0.05). An asterisk indicates significant differences between the bulk soil and rhizosphere. * p < 0.05. The error bar represents the standard deviation (n = 5).
Forests 14 02209 g001
Figure 2. Nonmetric multidimensional scaling (NMDS) ordination of bacterial communities (A). The PERMANOVA analysis with Bray-Curtis distance was performed to test differences among the three age classes of rubber plantations and sampling positions (bulk and rhizosphere soils). Boxplot shows soil bacterial Chao1 and Shannon indexes (B) among the three age classes of rubber plantations and sampling positions. The different capital letters indicate the SOM-dec rate in bulk soil with significant differences among the three age classes. The different lowercase letters indicate the SOM-dec rate in rhizosphere soil with significant differences among the three age classes (p < 0.05). An asterisk indicates significant differences between the bulk soil and rhizosphere. * p < 0.05, ** p < 0.01, *** p < 0.001. The error bar represents the standard deviation (n = 5).
Forests 14 02209 g002
Figure 3. Soil organic matter decomposition (SOM-dec) rate in bulk and rhizosphere soils (A) and rhizosphere effect on SOM-dec (B) along age chronosequence of rubber plantations. The different capital letters indicate SOM-dec rate in bulk soil with significant differences among the three age classes. The different lowercase letters indicate SOM-dec rate in rhizosphere soil with significant differences among the three age classes (p < 0.05). An asterisk indicates significant differences between the bulk soil and rhizosphere. ** p < 0.01. The error bar represents the standard deviation (n = 5).
Forests 14 02209 g003
Figure 4. Structural equation models (SEM) showing the direct and indirect effects of root traits, and soil and microbial properties on rhizosphere effect on soil organic matter decomposition (A). Standardised total effects of each variable derived from the SEM (B). Black solid and dotted arrows indicate positive and negative relationships, respectively. Grey arrows indicate insignificant relationships. The arrow width is proportional to the strength of the relationship. Numbers adjoining the arrows indicate significant standardised path coefficients. Multiple-layer rectangles represent the first component from the PCA conducted for the root traits, soil and microbial properties. SRL: specific root length; RN: root nitrogen; C:N: root C:N; B-STN: bulk soil total nitrogen; B-Bac: bulk soil bacterial composition; R-Bac: rhizosphere soil bacterial composition. * p < 0.05; ** p < 0.01; *** p < 0.001.
Forests 14 02209 g004
Figure 5. The relationships between the rhizosphere effect and specific root length (SRL) (A), root N content (RN) (B), and root C:N (C) along age chronosequence of rubber plantations.
Forests 14 02209 g005
Table 1. Root traits across the different age classes of rubber plantations.
TraitsYRMROR
Morphology traitsRoot diameter (mm)0.816 ± 0.054 a0.782 ± 0.020 a0.743 ± 0.057 a
SRL (m g−1)4.058 ± 1.104 c9.389 ± 1.576 b12.395 ± 2.119 a
RTD (g cm−3)0.225 ± 0.022 b0.313 ± 0.038 a0.356 ±0.017 a
SRA (cm2 g−1)219.792 ± 10.994 a166.525 ± 25.506 b152.858 ± 15.754 b
Chemical traitsRC (g kg−1)489.865 ± 33.713 a427.421 ± 45.974 a427.133 ± 57.750 a
RN (g kg−1)14.248 ± 1.582 b20.036 ± 2.743 a24.352 ± 2.394 a
Root C:N34.638 ± 3.044 a21.653 ± 3.373 b17.528 ± 1.404 b
Physiological traitsRoot exudation (mg C g−1 h−1)0.043 ± 0.008 c0.087 ± 0.012 b0.122 ± 0.029 a
Data represent mean ± standard deviation. Different letters show significant differences among different age rubber plantations (p < 0.05). YR: young rubber plantation; MR: middle-aged rubber plantation; OR: old rubber plantation; SRL: specific root length; RTD: root tissue density; SRA: specific root area; RC: root C; RN: root N.
Disclaimer/Publisher’s Note: The statements, opinions and data contained in all publications are solely those of the individual author(s) and contributor(s) and not of MDPI and/or the editor(s). MDPI and/or the editor(s) disclaim responsibility for any injury to people or property resulting from any ideas, methods, instructions or products referred to in the content.

