Article

How Are Urban Birds Affected by Surrounding Forests and Agricultural Landscapes?

by
Loreta Bisikirskienė
*,
Gediminas Brazaitis
,
Kastytis Šimkevičius
and
Gailenė Brazaitytė
Department of Forest Sciences, Faculty of Forest Sciences and Ecology, Vytautas Magnus University Agriculture Academy, Studentų Str. 11, LT-53361 Akademija, Lithuania
*
Author to whom correspondence should be addressed.
Forests 2023, 14(11), 2119; https://doi.org/10.3390/f14112119
Submission received: 1 September 2023 / Revised: 16 October 2023 / Accepted: 19 October 2023 / Published: 24 October 2023
(This article belongs to the Section Forest Biodiversity)

Abstract

:
The main objective of this study was to assess the influence of surrounding forest and agricultural landscapes on the bird communities within cities. Using the point count method, we collected data and analyzed the species richness and relative abundance of breeding birds. We found differences in the species richness and relative abundance of breeding birds between urbanized areas surrounded by forests and agricultural landscapes. However, both types of landscapes significantly differed in terms of bird community structure. The highest relative abundances of bird species were observed in city forest parks and cities surrounded by forest landscapes, while the lowest abundances were detected in highly urbanized areas. Cities surrounded by forests exhibited an additional nine species compared to other areas. The ecological grouping of species revealed that cities surrounded by forests had higher relative abundances of typical forest species, such as the Great Tit (Parus major), Eurasian Blue Tit (Cyanistes caeruleus), Common Chaffinch (Fringilla coelebs), and European Pied Flycatcher (Ficedula hypoleuca), whereas cities surrounded by agricultural landscapes were characterized by bird communities adapted to open or semi-open landscapes with specific feeding and nesting behaviors. The presence of specialist forest species in the composition of urban bird communities enhances biological diversity, which is crucial for the stability of both urban ecosystems and bird communities.

1. Introduction

Habitat loss and fragmentation are the main drivers of biodiversity loss [1,2,3,4,5]. The primary drivers of habitat loss are the intensified development of urban infrastructure, advancements in agricultural technologies, the disappearance or transformation of traditional agricultural practices, and intensified forest management [6,7,8,9,10,11,12].
In Europe, there is currently a focus on establishing policies for the development of green infrastructure (GI) in urbanized areas. These policies play a significant role in the conservation of biodiversity, the mitigation of climate change, and adaptation efforts. The European Commission adopted the EU Green Infrastructure Strategy, which aims to promote the widespread implementation of GI in territorial planning. The EU Biodiversity Strategy for 2030 also prioritizes the development of GI to address key factors contributing to the loss of biodiversity. Furthermore, various legislations such as the Natura 2000 conservation network and The New Urban Agenda underscore the importance of GI [13,14]. The effective planning and establishment of green infrastructure in urbanized areas require a long-term strategy that includes proper maintenance and regular evaluations [15,16,17].
Synanthropic and generalist bird species are attracted to urban areas [18,19,20,21,22,23]. According to Møller and Díaz (2018) [24], the appeal of urbanized areas to generalist bird species has been increasing in recent years. It is important to recognize that cities represent the coexistence of humans and nature. They are unique ecosystems that fulfil human needs, provide ecosystem services, and offer space for biodiversity [25,26,27].
Previous research indicates that certain bird species, characterized by their high levels of tolerance for diverse environmental conditions, ability to nest within building cavities, and broad feeding ranges, have advantages with respect to colonizing and thriving in urban areas [28,29]. However, the urbanized landscape is not conducive to the survival of specialist bird species due to the lack of suitable food sources, nesting sites, and diverse landscape structural elements [30].
Studies on adaptive evolution highlight that urban ecosystems serve as strong driving forces for evolutionary changes in bird species [31]. However, it is widely acknowledged that urbanization leads to the homogenization of bird communities and the creation of ecosystems with reduced ecological value [32,33,34]. Enhancing the urbanized landscape with the presence of trees, shrubs, hedges, and grass cover provides the necessary structure and resources to support the species diversity and abundance of bird species [35,36]. Numerous studies propose strategies for planning, managing, and improving green infrastructure to enhance biodiversity and promote the sustainability of urban ecosystems [37,38].
Among other biodiversity groups, birds are often noted as excellent indicators for evaluating environmental conditions due to their widespread distribution, inhabitation of both natural and urban landscapes, and sensitivity to habitat changes [39,40,41,42]. Analyzing bird community structures—species diversity and composition, abundance, diversity, and the way in which they are partitioned into ecological groups—is an effective resource for assessing forest, open landscape, agricultural, and urbanized ecosystems. Bird communities are closely related to the abundance of many other organisms, and declines in bird species or populations are often associated with an overall decline in biodiversity [41]. Moreover, birds are economically viable bioindicators as they can be measured and observed in a straightforward and inexpensive manner.
Most previous research on urban landscapes focused on analyzing the influence of the size of green infrastructure, fragmentation, road networks, and building density on bird communities [43,44,45,46,47,48]. However, there is a lack of research examining the influence of surrounding landscapes on the diversity and abundance of urban bird species. The influence of surrounding landscapes on ecosystems and their biodiversity was studied by Forman and Godron (1986) [49] and Mills et al. (1989) [50]. According to Asoskova et al. (2012) [51], the bird fauna in a city is highly dependent on geographical location and the surrounding landscape. On the contrary, Clergeau et al. (2001) [52] suggested that city bird communities are not influenced by the bird diversity of the surrounding landscape, implying that the characteristics of the urban area are the most principal factors. A genetic analysis of urban birds conducted by Björklund et al. (2010) [53] demonstrated that surrounding landscapes provide genetic diversity for many species. Evidently, the previous research lacks a consensus on how different landscapes affect urban bird communities.
In this study, we put forth the following hypotheses: (I) the landscape influence hypothesis, in which we hypothesize that bird communities in urbanized areas will exhibit a positive relation with the presence of surrounding forested landscapes as opposed to agrarian landscapes; and (II) the hemiboreal zone structures hypothesis, in which we posit that urban areas characterized by structures typical of the hemiboreal zone, such as forests and parks with trees, will demonstrate a higher degree of naturalness. We anticipate that these structural elements will positively impact the community compositions, diversity, and the relative abundance of birds within urban landscapes. Our overarching objective is to comprehensively examine the impact of these factors on bird community structure, focusing on aspects including species diversity, composition, relative abundance, and the distribution of ecological groups and the classification of bird species depending on their distribution characteristics.

2. Materials and Methods
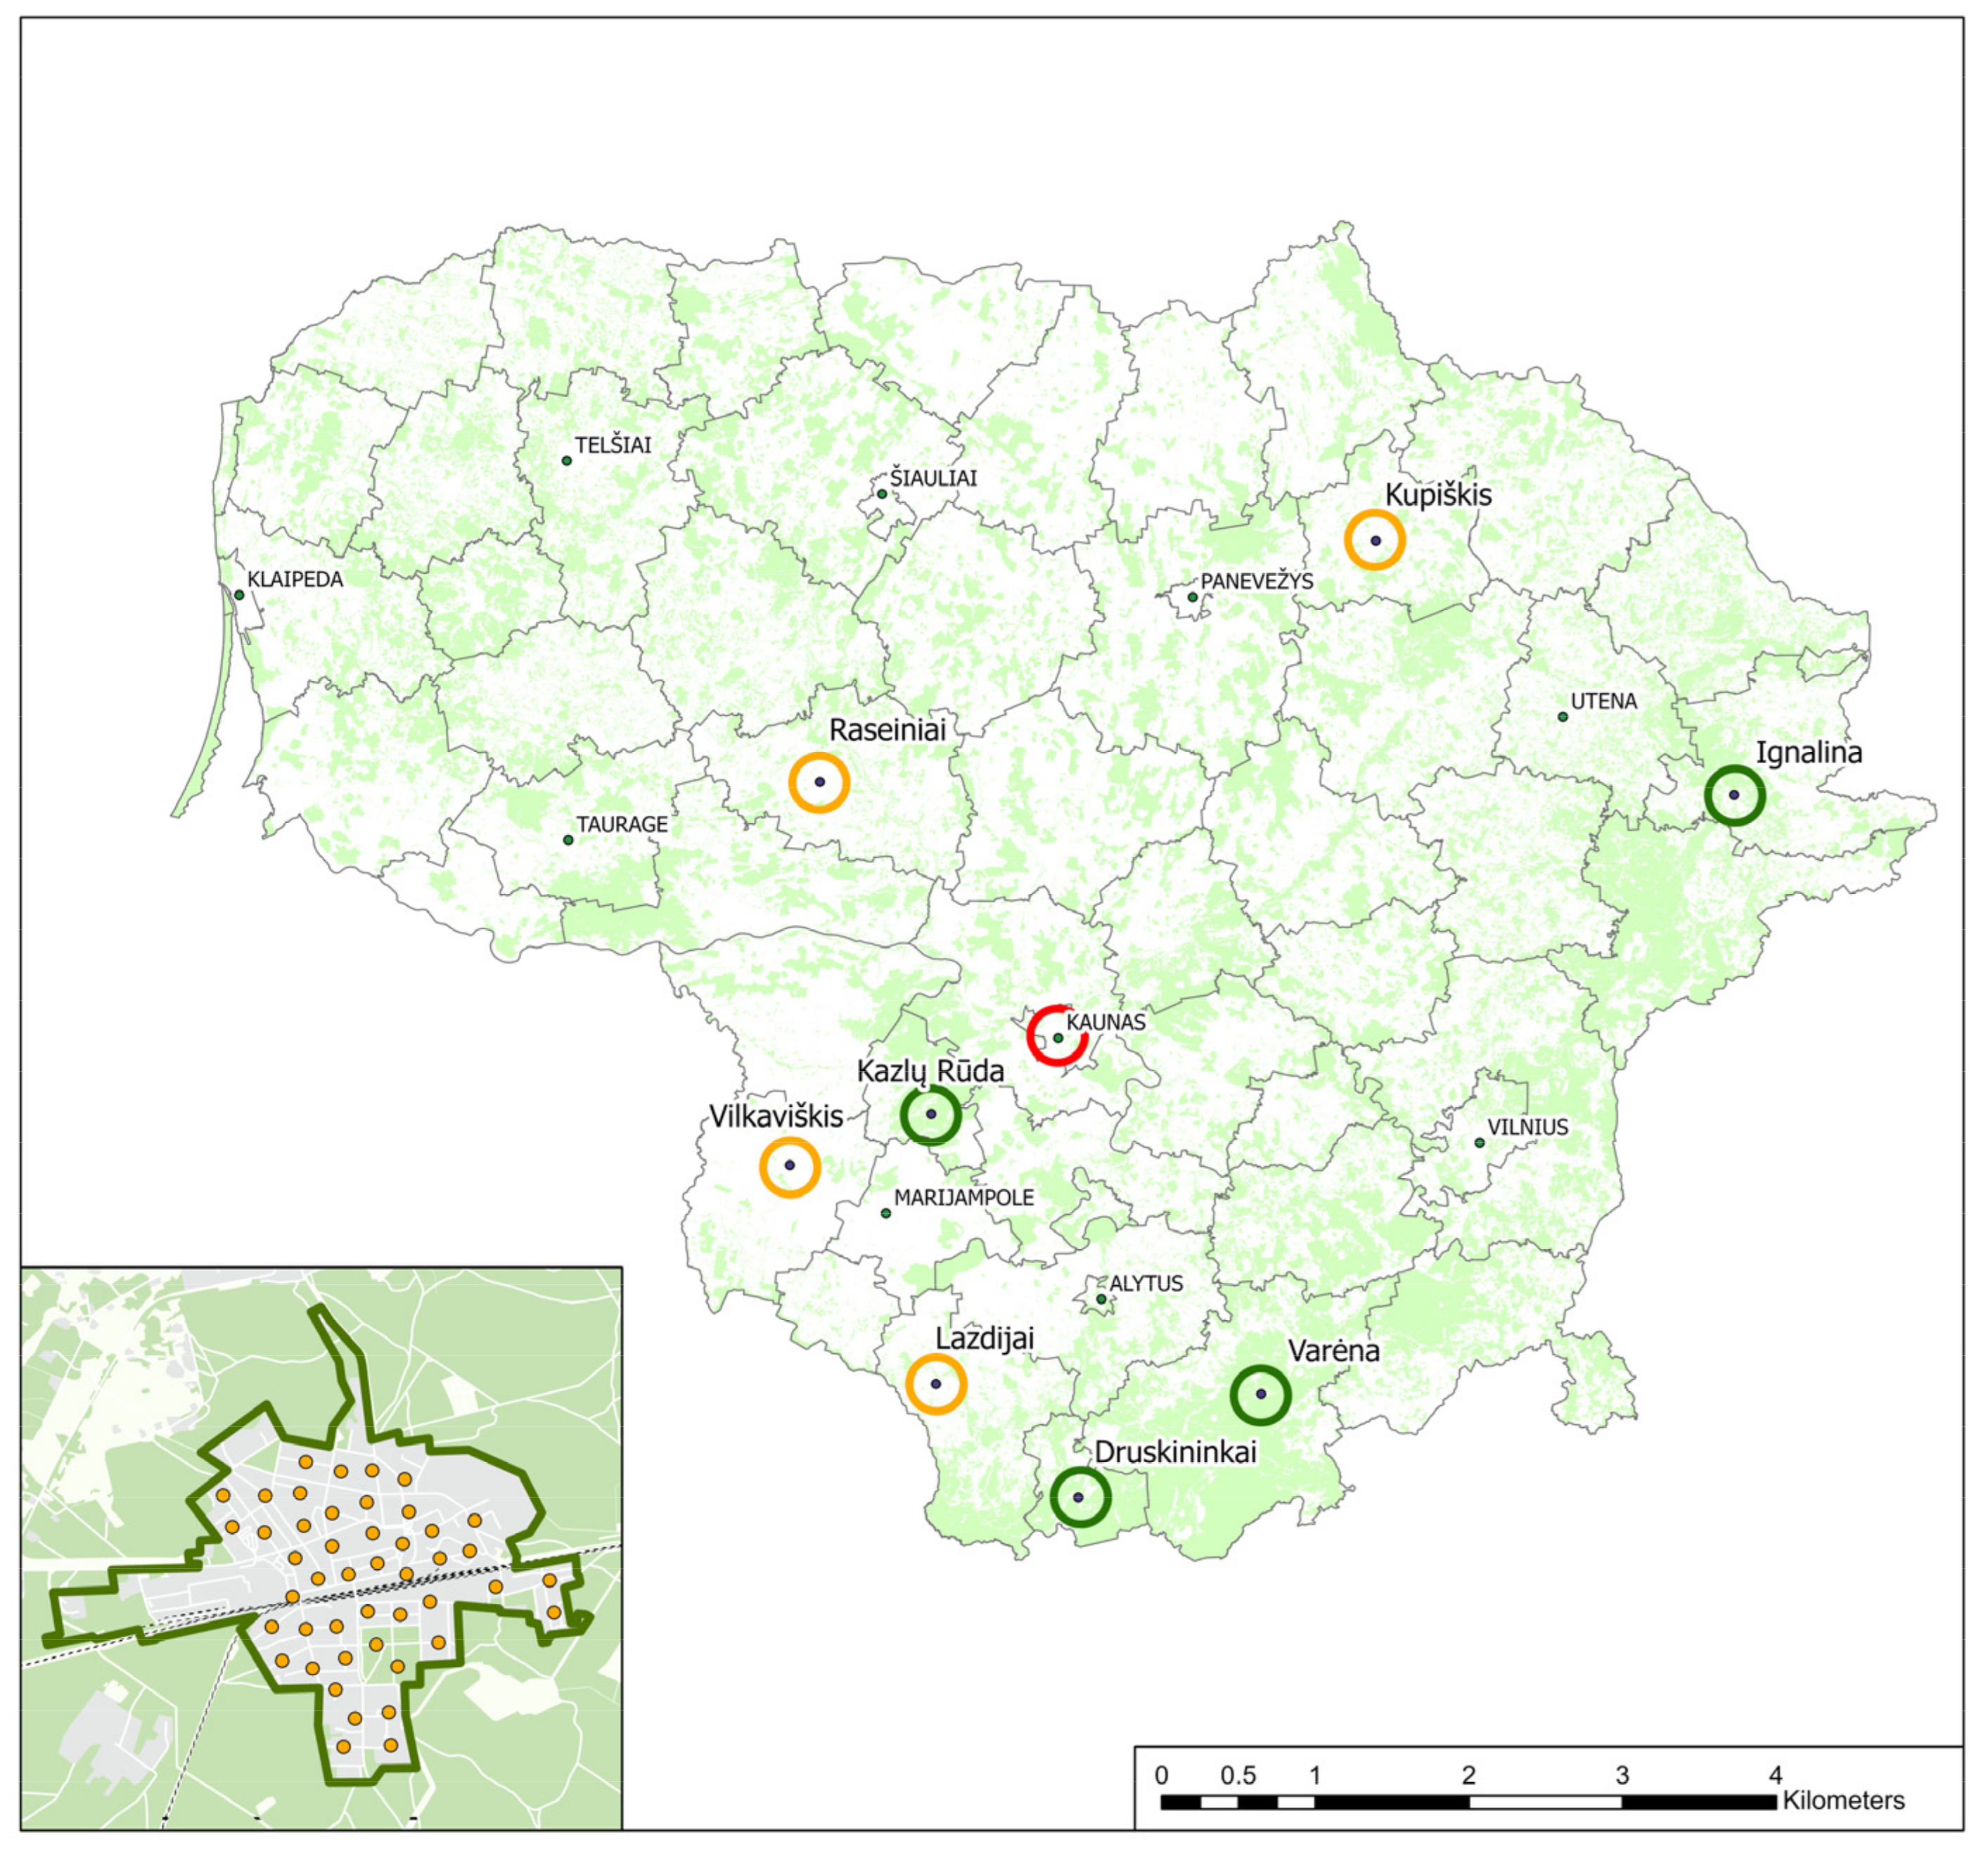
2.1. Study Area

This study encompassed various locations across Lithuania which were meticulously selected based on specific landscape criteria (see Figure 1). In total, we identified nine distinct urban areas which we classified into three primary types: (a) urban areas surrounded by forest (For), including Kazlų Rūda, Varėna, Druskininkai, and Ignalina, all of which were characterized by their proximity to forested landscapes, represented by 174 study points; (b) urban areas surrounded by agricultural landscapes (Agr), which consisted of Raseiniai, Vilkaviškis, Kupiškis, and Lazdijai, all situated within agricultural surroundings, represented by 183 study points; and (c) extensive urbanized areas with varying degrees of naturalness (Urb F, Urb P, and Urb U) for which Kaunas, one of Lithuania’s largest cities, was chosen to represent a diverse urban landscape, reflecting a range of naturalness levels. This urban area included forested city parks (Urb F), parks and squares (Urb P), and highly developed urban territories (Urb U), with bird communities accessed at 268 study points. These selections allowed us to explore the impacts of different landscape types on bird community dynamics within urbanized settings.
The cities selected for this study were central district municipalities consisting of privately owned residential apartments. These urban areas had limited natural elements such as bushes, trees, and grass interspersed between them. Both the forest (For) and agricultural (Agr) areas examined had comparable sizes and resident populations. On average, the urban areas encompassed 9.30 km2 and housed approximately 7800 residents. The study sites were evenly distributed throughout the territory of Lithuania except for the western region, where urbanized areas did not exist as isolated fragments surrounded entirely by forest or agricultural landscapes.
The third category of urban area surveyed in this study was represented by Kaunas, one of the largest cities in Lithuania, which exemplifies a highly urbanized and expansive landscape. With an area of 157 km2, Kaunas is home to nearly 300 thou. residents. The urbanized areas within Kaunas display varying levels of urbanization and encompass several city forests and parks. The urban landscape in this large city was classified based on a representative gradient of naturalness, which included the forest city parks (Urb F), parks and squares (Urb P), and highly developed territories (Urb U).
The forest city parks (Urb F) within Kaunas were characterized by a predominantly natural forest structure and were the least affected by urbanization. Three Urb F areas, namely Kleboniškis, Panemunė, and Romainiai, were selected as research sites. These areas are classified as protected recreational forests (belonging to the IIB forest group), and each covers an area of more than 130 ha. The study areas are primarily dominated by coniferous tree species, with Scots pine (Pinus sylvestris) being the most abundant. Other common tree species included Norway spruce (Picea abies) and various deciduous species such as birch (Betula sp.), black alder (Alnus glutinosa), grey alder (Alnus incana), European aspen (Populus tremula), and pedunculate oak (Quercus robur). The majority of the forests were either mature or nearing maturity, while some were over-mature or in a middle-aged stage, characterized by dense shrub vegetation. Among the typical shrub species found in these forests were hazelnut (Corylus avellana), rowan (Sorbus aucuparia), alder buckthorn (Frangula alnus), and fly honeysuckle (Lonicera xylosteum).
Urban areas designated as parks and squares with trees (Urb P) are deliberately created green spaces within a city, designed for recreational activities. These parks have smaller areas ranging from 13.5 to 25.0 ha and exhibit varying degrees of openness. The vegetation structure in these areas consists of clusters of trees, shrubs, and lawns. The majority of tree species found in these parks are native, including small-leaved linden (Tilia cordata), Norway maple (Acer platanoides), pedunculate oak, and Scots pine. However, a few non-native species are also present, such as ginkgo (Ginkgo biloba), European larch (Larix europea), European beech (Fagus sylvatica), black pine (Pinus nigra), and horse chestnut (Aesculus hippocastanum).
Highly urbanized territories (Urb U) exhibit a diverse range of urban areas with different purposes and building heights. These areas encompass a mix of low-rise and high-rise residential apartment complexes, as well as single-family houses, interspersed with fragmented natural elements such as trees, shrubs, lawns, and abandoned areas.
We categorized urban areas in this study as ‘For’ or ‘Agr’ urban habitats if, within a 3 km buffer zone starting from the external border of the urban area, more than 80% of the territory represented a forest or agricultural landscape. The determination of the proportions of ‘For’ and ‘Agr’ and the analysis of the types of urban habitats (Urb F, Urb P, and Urb U) in the Kaunas district were conducted using a digital map analysis via an ArcGIS pro 3.0.0, utilizing the Georeferenced Cadaster Base (GRPK) spatial dataset at a 1:10,000 scale (GDR10LT). This dataset included information about built areas, hard surfaces (such as roads and pavements), forested areas, tree lines, pastures, arable land, meadows, and more. Additionally, in the selection of the study areas, we applied the naturalness coefficient developed in [54].

2.2. Bird Census

The bird surveys were conducted using the standardized point count method [55,56]. Points were systematically allocated within each study area to create a grid of sampling points. The placement of points was adjusted locally to ensure a consistent environment and accessibility during the early-morning survey periods. The planned single-morning survey routes consisted of up to 20 points spaced at least 200 m apart from the nearest neighboring points.
The length of the survey routes varied between 4 and 6 km as the urban areas had limited accessibility due to property fencing. To prevent any influence from neighboring ecosystems, all points were positioned at least 100 m away from city borders. Certain areas, such as allotment garden communities, were excluded from the assessments as they represented non-typical urban structures. Additionally, neighborhoods with high-traffic roads or high-rise building complexes were avoided as they hindered the detection of birds and their vocalizations. Similarly, areas along rivers or creeks with dense vegetation were not evaluated to avoid the potential distortion of data.
The fieldwork season followed standardized methodology and covered the mass breeding period in Lithuania. The bird surveys took place from 15 April to 15 June, the points were visited twice, and the surveys were spaced at least three weeks apart. During the second visit, we began the point count in reverse order so that the last visited point during the first count was visited the earliest during the second survey. The collection of data began in the early mornings, shortly after sunrise. During unfavorable meteorological conditions such as strong winds or rain, fieldwork was cancelled. When weather conditions were suitable, bird registration at each point lasted five minutes. Birds observed and recorded within two belts from the observer, between 0–25 m and 26–100 m.
The census unit used for the analysis was the breeding pair. To minimize potential biases associated with different observer skills, all fieldwork was conducted by a single ornithologist. Data from colonial nesting birds, aquatic species, those associated with water ecosystems, and nocturnal birds were excluded to ensure the credibility of the analysis and its focus on territorial bird species. The point count method is not adequate for conducting a census of colonial nesting species, aquatic species, those associated with water ecosystems, and nocturnal birds.
A total of 625 points were used to assess bird communities, with 60 points in Urb F areas, 33 points in the Urb P area, 175 points in the Urb U areas, 183 points in Agr areas, and 174 points in For areas. These assessments were conducted from 2018 to 2021, during the breeding season.

2.3. Bird Community Indices

Species richness is the number of bird species observed within a given study point or landscape type. It represents the total count of distinct bird species observed within the defined spatial unit.
The relative abundance per study point represents the total number of breeding bird pairs of all species observed at a specific point. We also calculated the average number of nesting pairs per one point count by dividing the total number of bird pairs of the same species observed in a particular landscape type by the number of point counts conducted in that landscape type, as described in Appendix A.
Similarly, the bird relative abundance of ecological groups, as detailed in Appendix B, is determined by dividing the total number of bird pairs within the same ecological group observed in a specific type of landscape by the number of point counts conducted in that type of landscape.
The Shannon–Wiener Diversity Index was used to quantify the diversity of the species within the urbanized landscape types. This index considers both the number of species present and their relative abundance. A higher value indicates greater diversity and evenness, meaning that there are many species present and no single species dominates the community.

2.4. The Ecological Grouping of Bird Species

Based on the prevailing nutritional and nesting behaviors observed during the breeding season, birds were classified into ecological groups. The prevalence of each classified group was calculated for each bird community. Based on feeding areas, bird species were segregated into those feeding outside the urban territory (O) and those searching for food near their nests (N). The birds were further divided by main food type into herbivorous (V) species, species feeding on invertebrates (I), and species feeding on vertebrates, predators (P). Additionally, I birds were classified based on their foraging substrate, distinguishing species specialized in foraging on the ground or in the herb layer (IG), species collecting food from leaves, twigs, and the air (IL) and species foraging on tree bark (IB). Furthermore, birds were sorted into different nest-allocation categories, including ground-nesting species with open or domed nests on the ground and in vegetation measuring up to 1.5 m (G), crown-nesting species with nests in trees and in bushes above 1.5 m (C), and hole-nesting species (H). For the characterization of the bird species, we relied on the work of Kurlavičius (1995) [57]. To provide a more precise characterization of the bird guild in urbanized landscapes, we used the proportional coefficients for bird species given by Kurlavičius (1995). These coefficients are particularly relevant for species exhibiting flexibility in their feeding behavior, with a focus on their preferences. For instance, if a bird species typically consumes various resource categories, such as in the case of Turdus merula, which obtains 90% of its food via IG and 10% via IL, we considered these coefficients.

2.5. Statistical Analysis

The highest species-specific count of registered birds/pairs with territorial behavior was used as the number of breeding pairs at an observation point. We calculated mean and standard error of the mean (±SE) values for the relative abundance of the observed bird species in each type of urban landscape, as well statistics for bird feeding and breeding ecological groups (see Appendix B).
As species richness is related to sample size, we applied the rarefaction statistical technique to compare the species richness between urbanized landscapes while accounting for differences in the sample size [58]. By ranking the observation points from the lowest to the highest number of observed bird species within each urban landscape type, we examined cumulative species curves, presenting how the total number of species increased with the point rank (see Figure 2). We used Past 4.03 software for the rarefaction calculations [59].
We utilized a Generalized Linear Mixed Model (GLMM) to predict species richness, relative abundance, and the Shannon–Weaver diversity indexes at each study point, considering the fixed effect of the type of urbanized landscape. Given that the data displayed greater variability compared to the mean in terms of bird species and relative abundance, we identified overdispersion and consequently applied a Negative Binomial model with a Log-link function. The Shannon–Weaver diversity index values were analyzed using a normal distribution with an identity link function (Section 3.1). Subsequently, we predicted the relative bird abundance per study point of bird species classified into ecological groups (refer to the summary statistics in Appendix B), taking into account the fixed effect of the type of urbanized landscape. To model this, we applied a statistical approach using the Gamma distribution with a log-link function, as described in Section 3.2.
We assessed and selected the sets of random factors based on the Akaike Information Criterion (AIC) for each candidate model. Our analysis indicated that while the random effect of the study area significantly improved the developed models, the urbanized fragment size and the year of the survey did not have significant impacts and were not used as random effects. We employed SPSS 29.0 for the utilization of the GLMM.
To compare the relative abundances of birds, we employed a non-parametric Mann–Whitney U test, aiming to assess whether there were statistically significant differences between groups when the data did not follow a normal distribution or when the assumption of homoscedasticity was violated. For classifying bird species based on their habitat preferences in urbanized environments, hierarchical clustering using complete linkage and the city-block distance measurement was employed. We employed Statistica 8.0 for conducting non-parametric testing and clustering.

3. Results

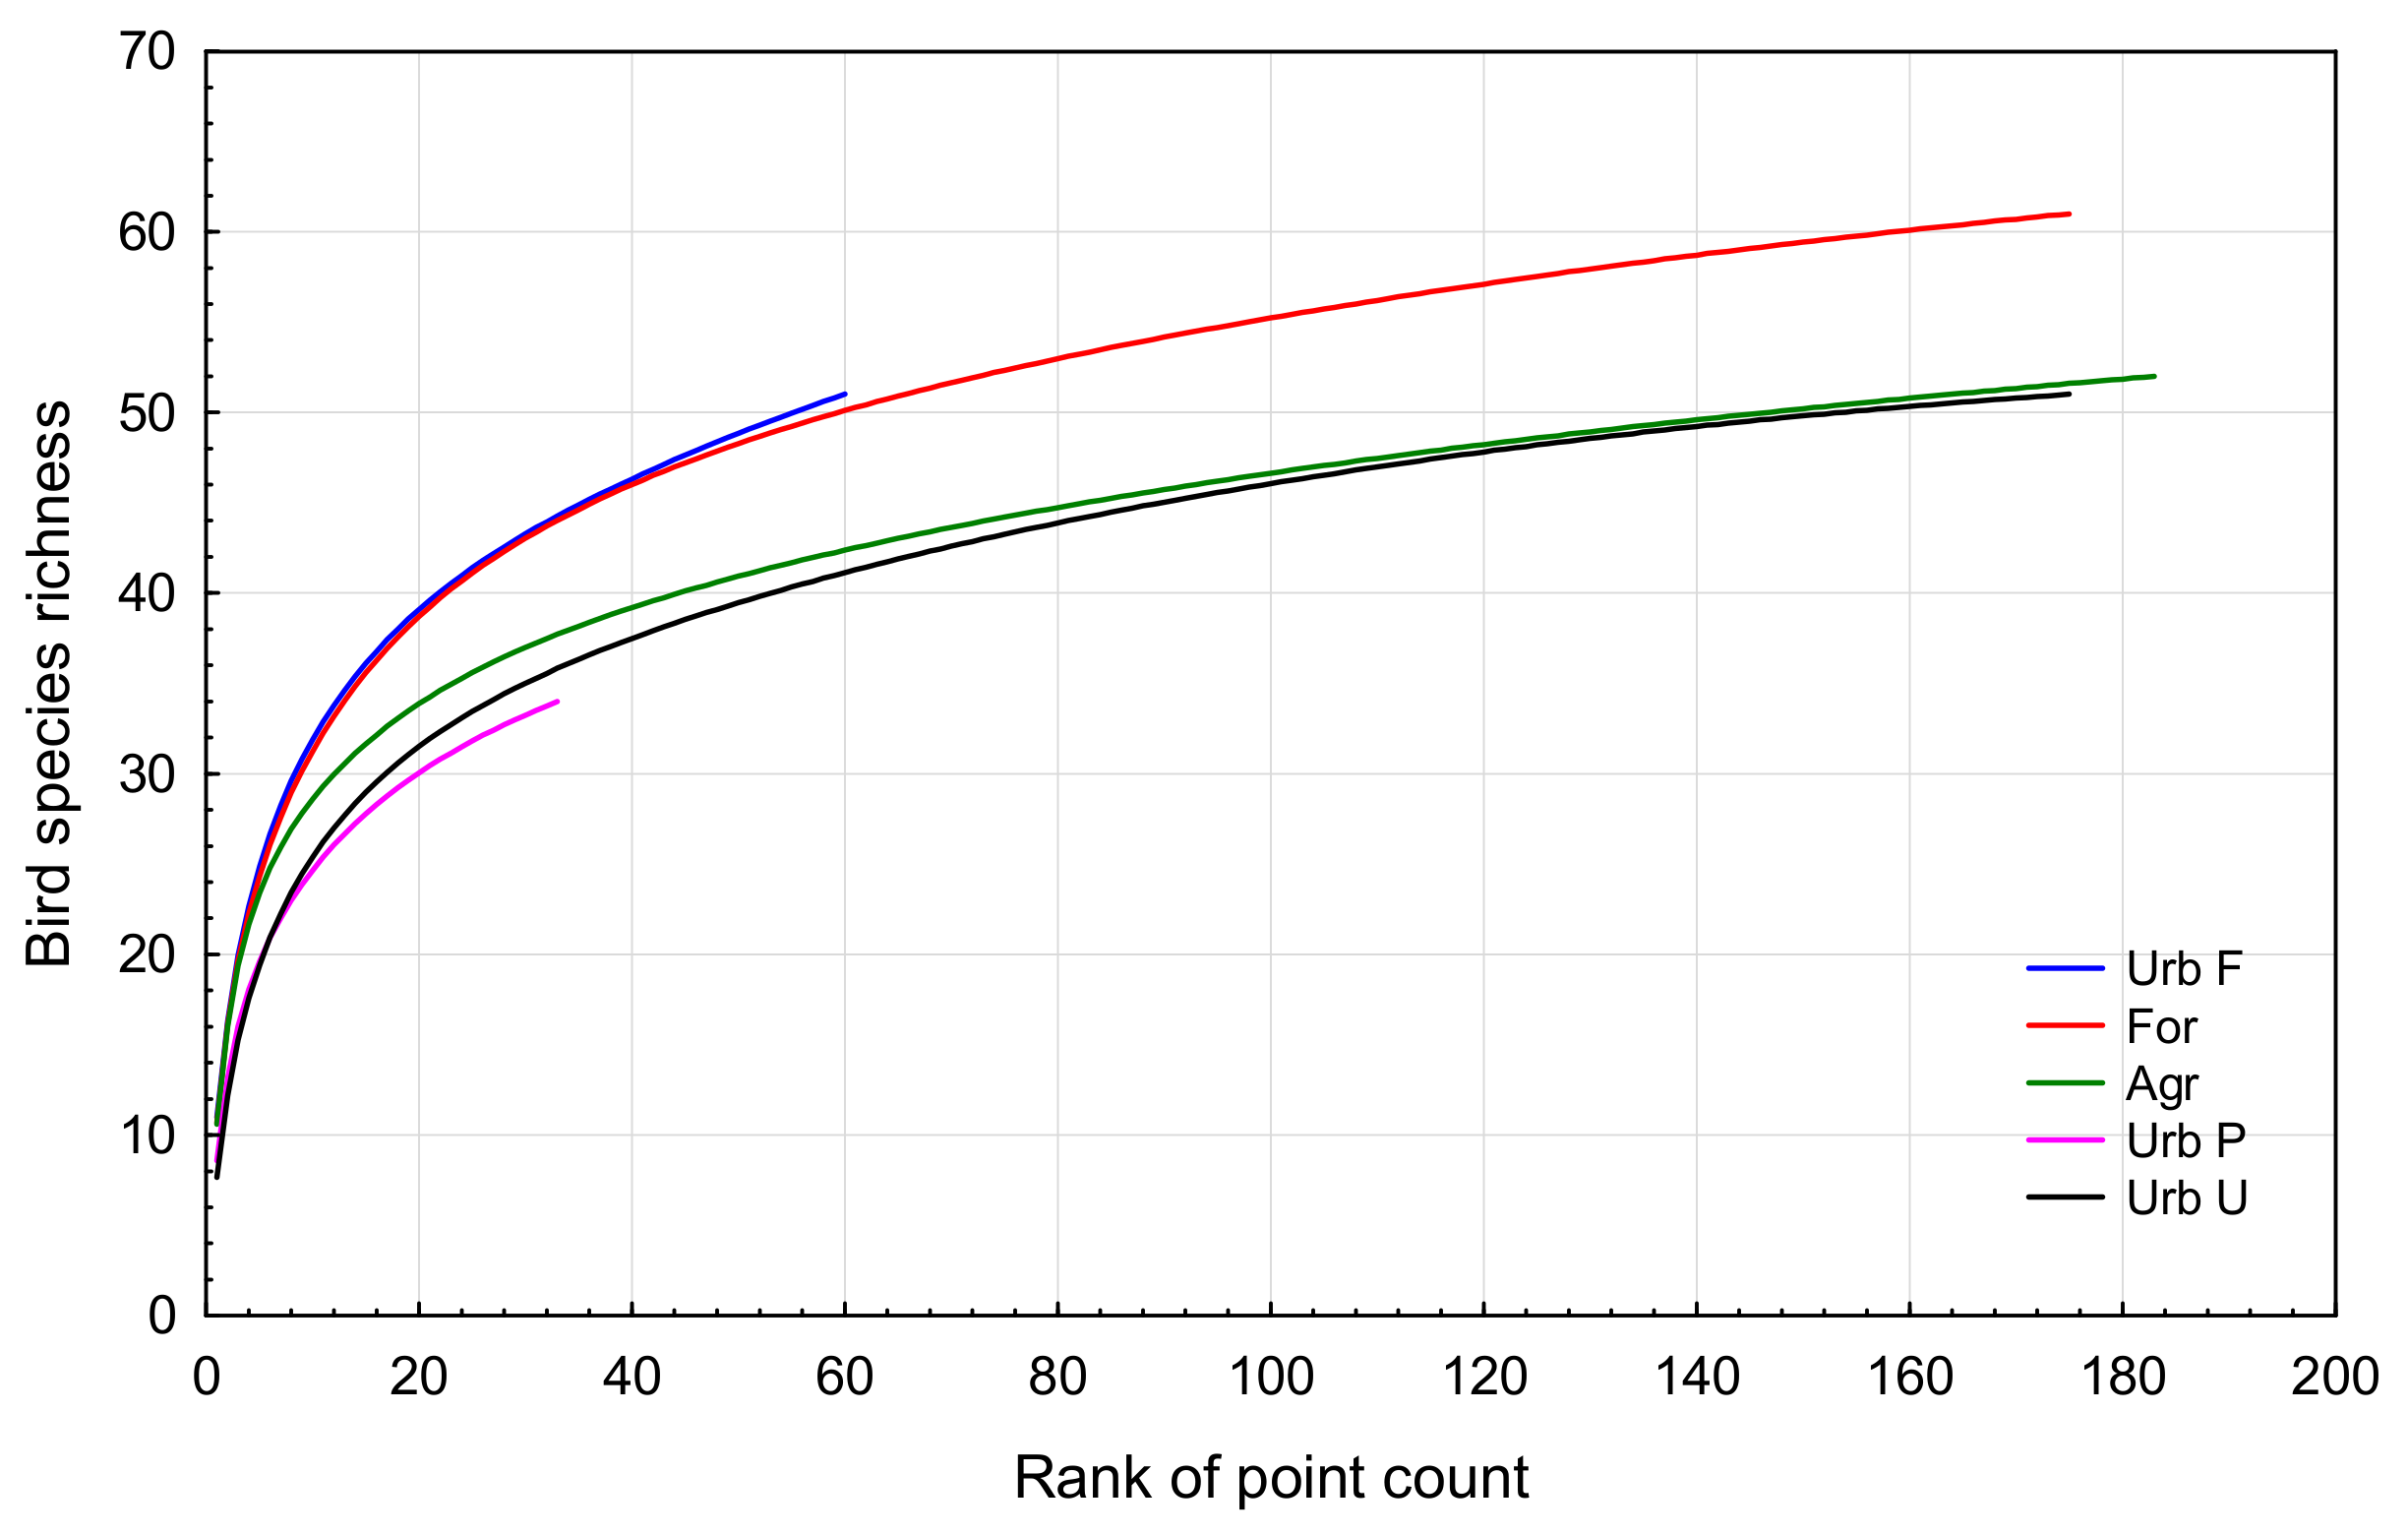
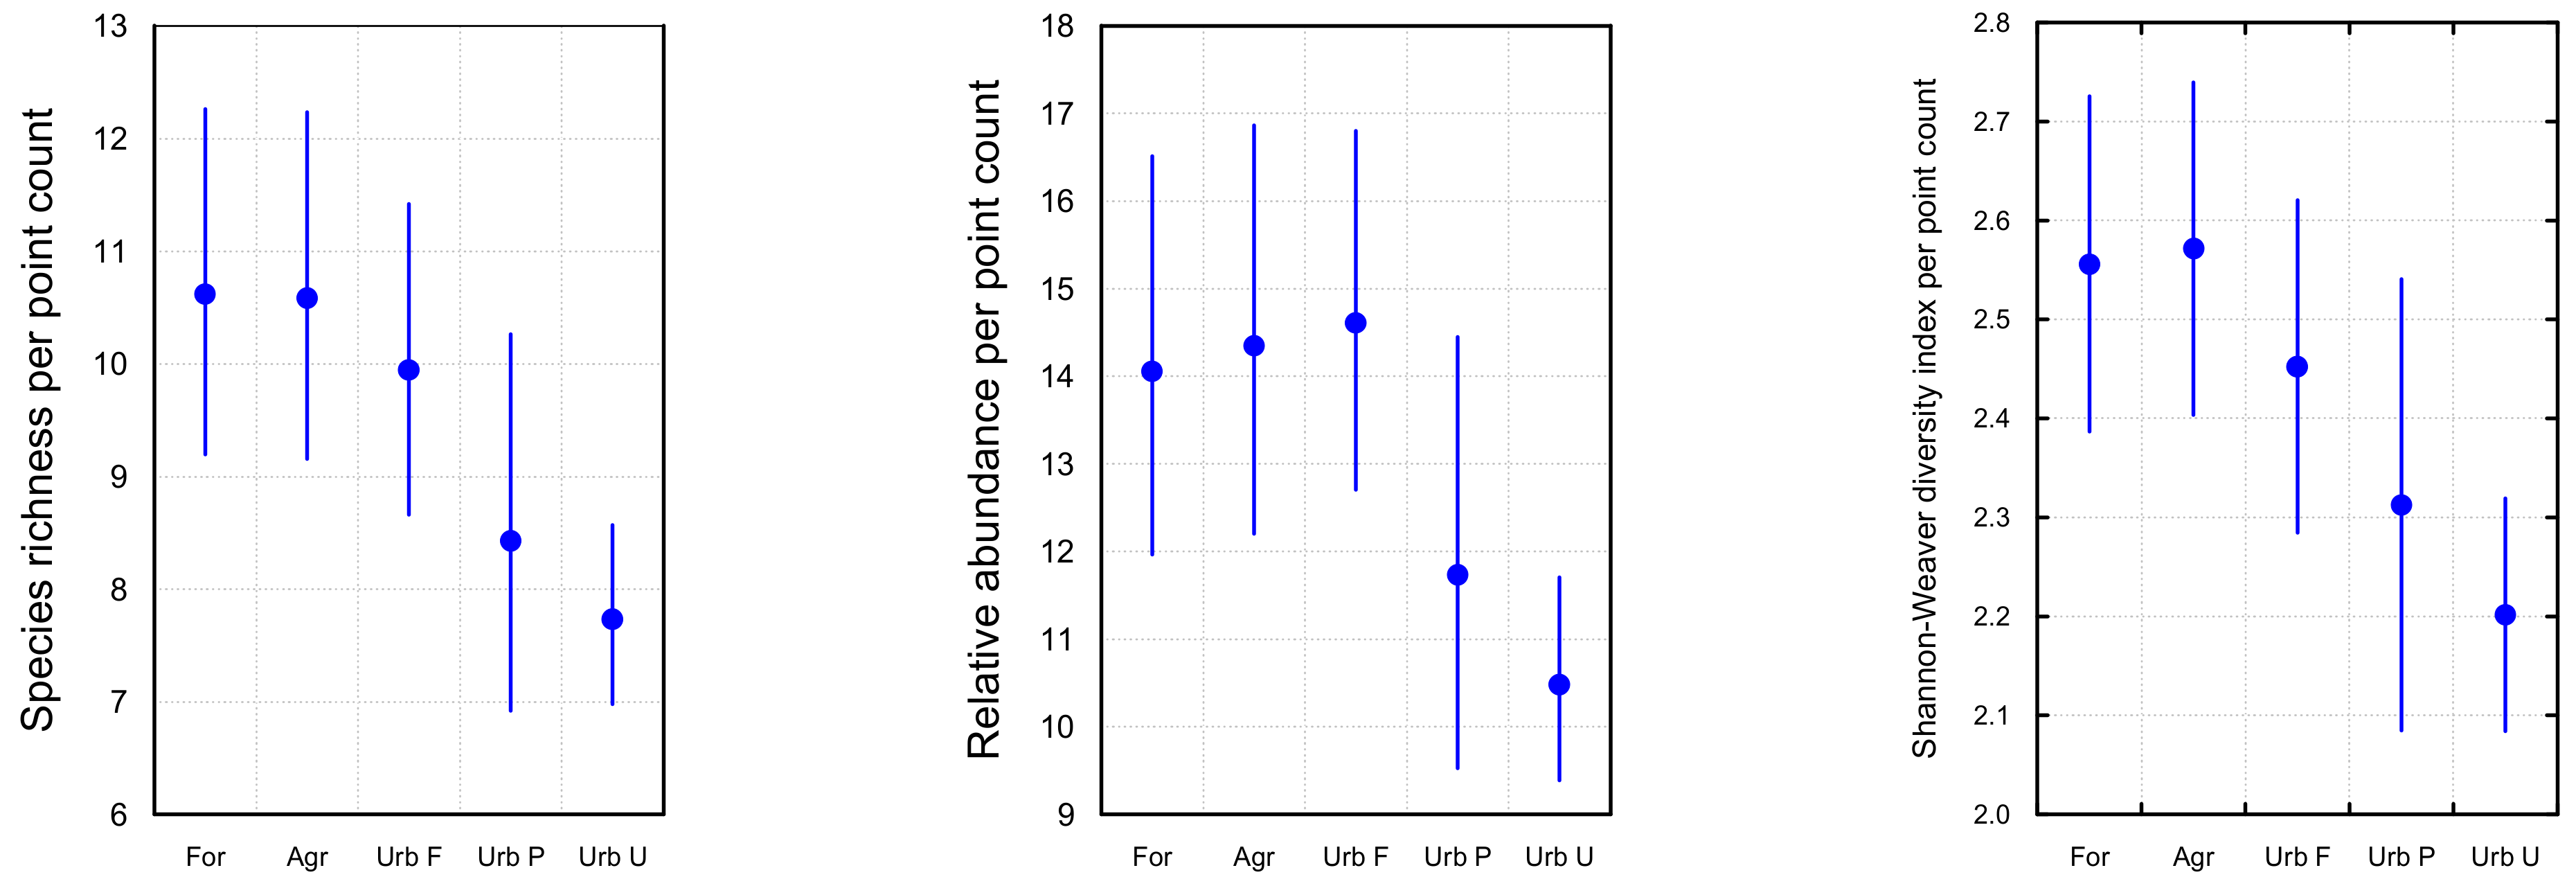
3.1. Bird Community Richness and Relative Abundance

During the collection of data in urbanized areas, a total of 625 points were observed, and a total of 8443 breeding pairs were assessed, 83 of which were nesting pairs. The highest number of species (65 species) was detected in areas surrounded by forest, followed closely by the agricultural landscape, with 56 species. Both forest city parks and highly urbanized landscapes had 52 observed species. The lowest number (32 species) was assessed in parks.
Due to the unequal number of observed points, direct comparisons between the species richness and different urbanized landscape types could not be determined. Species richness across urbanized landscape types was compared using cumulative species curves calculated during the rarefaction analysis. The highest species richness was identified in Urb F and For landscapes (Figure 2). Comparatively, the species richness values of both For and Agr landscapes increased similarly up to 24 bird species. The mean standard errors for the rarefaction curves varied between ±2.01 (Urb U) and ±2.99 (Urb F). Generally, in the Agr, Urb P, and Urb U landscapes, species richness was lower than in the For landscapes. As the number of observed points increased, the For landscape displayed a gradual and equal increase in species, whereas in the Agr landscape, the number of species stabilized and aligned with the species richness potential of the Urb U landscapes.
The GLMM predicted that the species richness (F = 7.1; p < 0.001), and the relative abundance (F = 9.9; p < 0.001) and Shannon–Weaver diversity index (F = 6.2; p < 0.001) values varied statistically significantly among the different urbanized landscape types (Figure 3, Table 1). The highest number of species and relative abundances per study point were observed in For, Agr, and Urb F landscape types; however, the highest Shannon–Weaver indexes were calculated for For and Agr areas. On average, in each counting point, 14.1–14.6 breeding pairs were observed, representing 9.9–10.6 bird species. Heavily urbanized areas (Urb P, Urb U) were more constrained, with 1.2–1.4 times fewer bird species and 1.7–1.8 times lower abundance values (Figure 3).
The comparison between the urban landscape types using the Mann–Whitney U test revealed similarities between Urb and Agr landscape types and significant differences only in relative abundance (A) values between the aforementioned habitat types and Urb F areas (Table 2). The most distinctive urban habitats were Urb U and Urb P, showing significant differences in all three analyzed bird community parameters compared to all urbanized environments.

3.2. The Affiliation of Bird Ecological Groups to Urbanized Landscapes

3.2.1. Feeding Areas

The differences in relative bird abundance per point, categorized via species’ behaviors with respect to feeding near their nest (N) or outside the urban territory (O), were predicted significantly via the GLMM among the urbanized landscapes (F = 25.5; p < 0.001) (see Appendix B for summarized details). Species exhibiting N feeding behavior were most abundant in Urb F areas (13.47 ± 0.39 SE) and the least in Urb U (5.03 ± 0.22 SE) landscapes. On the other hand, species preferring O feeding areas were most common in Agr (8.21 ± 0.22 SE) landscapes and the least common in Urb F (2.38 ± 0.38 SE) landscapes.
Both the For and Agr landscapes showed significant differences in the relative abundances of birds feeding in O (Mann–Whitney test Z = −2.85; p < 0.005) and N (Z = 2.4; p < 0.02) habitats. The proportions of O and N feeding areas were nearly equal in the For landscapes, while in the Agr landscapes, O feeding areas (56%) were more prevalent. On average, the density of O-type birds in the For landscapes was lower, with 7.14 ± 0.25 SE breeding pairs, compared to the Agr landscape with 8.21 ± 0.25 SE breeding pairs (see Appendix B for details).

3.2.2. Main Food Type

The GLMM predicted that the relative abundance of birds per study point varied significantly between the herbivorous bird species (V) and the bird species feeding on invertebrates (I) (F = 14.4; p < 0.001, F = 19.2; p < 0.001). In the Urb F landscapes, the abundance of bird species with I feeding behavior predominated, with an average of 13.35 ± 0.42 SE species per plot, while a V diet was less common, with an average of 2.20 ± 23 SE species per plot. V bird species showed a preference for For and Agr landscapes, whereas a greater abundance of birds observed in Urb habitats during the breeding season on invertebrates.
In terms of the average number of breeding pairs of birds feeding on invertebrates (I), there was no significant difference between For and Agr landscapes (9.6–9.2 pairs per plot) (Z = 1.2; p < 0.22). However, bird species with V feeding behavior were more abundant in Agr landscapes abundant (Z = 4.6; p < 0.001), reaching an average of 5.18 ± 0.15SE breeding pairs. Finally, the For landscapes, birds feeding on vertebrates (P) were more abundant (Z = 5.1; p < 0.001), with an average of 0.44 ± 0.03 SE breeding pairs per plot. In comparison, in Agr landscapes, only 0.16 ± 0.03 SE breeding pairs per plot fed on vertebrates.

3.2.3. Feeding Behavior

The bird species that search for food in leaves, twigs, and the air (IL) were predicted to be most abundant in the Urb F landscape (10.28 ± 0.35 SE). They were slightly less abundant in For (7.98 ± 0.20 SE) and Agr (7.02 ± 0.20 SE) landscapes and the least common in the Urb P (5.51 ± 0.47 SE) and Urb U (5.42 ± 0.20 SE) landscapes (F = 16.3; p < 0.001). Urban areas surrounded by agricultural landscapes had the highest relative abundance of bird species feeding on the ground or in the herb layer (IG), while the lowest number was observed in the forest city parks.
Regarding feeding behavior, the Agr landscapes showed a 1.2 times higher relative abundance of IG bird pairs (Z = −4.7; p < 0.001). However, the For landscapes had a 1.14 times higher relative abundance of IL birds (Z = 3.4; p < 0.001) and 5.5 times more breeding pairs foraging on tree bark (IB) (Z = 3.2; p < 0.002) (refer to Appendix B for detailed information).

3.2.4. Nest Allocation

The GLMM analysis significantly predicted that the bird species with hole nesting behaviors were most abundant in the For (8.42 ± 0.20 SE pairs per plot) and Agr (7.65 ± 0.19 SE) landscapes (F = 14.0; p < 0.001). The ground nesting (G) bird species were most abundant in the Urb F landscape, with an average of 4.59 ± 0.17 SE breeding pairs per plot (F = 23.5; p < 0.001). However, not all urbanized landscapes were suitable for G guild bird species. In highly urbanized landscapes and parks (Urb U and Urb P), on average, only about one bird pair was detected per observation point.
Both For and Agr landscapes had similar distributions of different nest allocations. More than half of the birds preferred H nesting, with over a third selected C nesting and only a small amount preferring a G nesting behavior. However, the Agr landscapes had 1.37 times more G guild birds compared to the For landscapes (Z = −3.8; p < 0.001).

3.3. Grouping Bird Species Based on Habitat Distribution

By applying cluster analysis, we grouped the bird species according to the distribution of their relative abundance in the studied habitat types (Figure 4). The cluster of the Urb F specialist species was clearly distinguished, including typical forest species such as the Great Spotted Woodpecker (Dendrocopos major), Eurasian Wren (Troglodytes troglodytes), European Robin (Erithacus rubecula), Song Thrush (Turdus philomelos), Wood Warbler (Phylloscopus sibilatrix), Common Chiffchaff (Phylloscopus collybita), Coal Tit (Periparus ater), Marsh Tit (Poecile palustris), Goldcrest (Regulus regulus), Eurasian Nuthatch (Sitta europaea), Eurasian Treecreeper (Certhia familiaris), Eurasian Siskin (Spinus spinus), and Eurasian Bullfinch (Pyrrhula pyrrhula). These species represented 8.8% of the total bird community. When comparing different urbanized landscapes, the Urb F landscape had the highest average relative abundance of forest species at 80.8% (59.6%–98.3%). Among the other surveyed landscapes, forest bird species were also present in For (8.2%) landscapes, and their relative abundance values ranged from 3% to 4.5% in the remaining landscapes.
The generalist species formed a distinct cluster and in total comprised 24.9% of the observed birds. Across each urban landscape type, the distribution of these species was consistent, ranging from 15.4% to 33.4%. The Eurasian Blue Tit (Cyanistes caeruleus), Willow Warbler (Phylloscopus trochilus), and Common Wood Pigeon (Columba palumbus) exhibited the most uniform distribution, while the Great Tit (Parus major), Common Chaffinch (Fringilla coelebs), Common Blackbird (Turdus merula), and Hawfinch (Coccothraustes coccothraustes) showed a slight preference for the Urb F landscape.
The cluster analysis revealed a distinct subgroup consisting of three species: the Spotted Flycatcher (Muscicapa striata), Yellowhammer (Emberiza citrinella), and European Pied Flycatcher (Ficedula hypoleuca). These species were observed in 1.6% of the total observations. However, in the For, Agr and Urb F landscapes, these three species were widely distributed, accounting for 91.6% of the observations. In contrast, they were rarely observed in the Urb P and Urb U landscapes, representing only 8.4% of the total observations.
The bird species characteristic of the For and Agr landscapes were grouped together, including the Common Starling (Sturnus vulgaris), European Greenfinch (Chloris chloris), House Sparrow (Passer domesticus), Barn Swallow (Hirundo rustica), Black Redstart (Phoenicurus ochruros), and European Serin (Serinus serinus). These species accounted for 39.5% of the total relative abundance across the observed landscapes. In the For and Agr landscapes, the abundance of these species was nearly equal, with 40.7% and 31.1%, respectively, totaling 71.9% of the total species abundance. However, these species were rare in the Urb P and Urb U landscapes (respectively 11.8% and 15.8%) and very rare in the Urb F (0.5%) landscape.
The small urban territories surrounded by an agricultural landscape were typically inhabited by the Common Linnet (Linaria cannabina), White Stork (Ciconia ciconia), and Eurasian Collared Dove (Streptopelia decaocto). Overall, this cluster covered 3.7% of all observations. The relative abundance of these species in the agricultural landscape reached 64.7%, while it was significantly lower in the forest landscape (22.7%). These species tend to avoid larger cities and, in the Urb F, Urb P, and Urb U landscapes, accounted for an average of 37.6% of the relative abundance.
Finally, the cluster analysis identified a group consisting of the Eurasian Tree Sparrow (Passer montanus), Eurasian Magpie (Pica pica), Common Whitethroat (Sylvia communis), Fieldfare (Turdus pilaris), Western Jackdaw (Coloeus monedula), and Icterine Warbler (Hippolais icterina). The cluster was most prevalent in the Urb P (43.3%) area, while it was rarely observed in Urb F (2.0%) areas. In the other landscapes, the distribution of these species was similar, ranging from 15.8% to 20.8%. Overall, the birds in this group represent 19.3% of all observations.

4. Discussion

The initial sightings of common forest species, including Eurasian Sparrowhawk (Accipiter nisus), Eurasian Eagle-Owl (Bubo bubo), Great Spotted Woodpecker, European Robin, and Eurasian Siskin, within urban areas raised a hypothesis that urbanized areas surrounded by forests have higher nesting species richness and relative abundance values compared to urbanized areas surrounded by agricultural landscapes. This led to the question of which species could successfully adapt to and inhabit cities.
During the selection of potential research areas in Lithuania, we discovered that most cities are surrounded by cultivated agricultural fields, while only a few are surrounded by forested landscapes. Throughout our research, we observed that these selected cities varied in their characteristics. Urban areas surrounded by forest landscapes were more prevalent in districts with less productive soil. These areas were often dominated by coniferous forests, particularly Scotch pine, which are suitable for recreational activities. As a result, several cities surrounded by forest landscapes are resorts and recreational areas, boasting extensive green spaces and abundant numbers of mature trees. These factors make them highly suitable for forest specialist bird species. However, when comparing bird communities in deciduous and pine forests, we found that the latter had lower bird abundances, as reported by previous studies [60,61,62,63]. Flade (1994) [61] specifically noted that pine forests have the lowest bird density (6.9–10.9 pairs/10 ha) compared to other forest types. On the other hand, mixed forests provide a greater variety of habitats and a more balanced and abundant food supply compared to monoculture forests [64,65,66].
Resorts and recreational areas provide amenities that cater to both wellness and leisure activities. Consequently, the lifestyle of the residents in these areas is influenced, leading to the development of smaller property plots predominantly occupied by rental housing. These properties typically feature hard-surfaced yards. On the other hand, towns surrounded by agricultural landscapes have more fertile soil and larger residential properties, often with productive vegetable gardens and small fruit-bearing-tree and shrub gardens. As a result, the bird communities in these areas experience a positive impact, particularly for species associated with agricultural landscapes [67,68,69,70].
The initial analysis of the total number of species yielded unexpected results as the highest relative abundance was found in the forest landscapes. However, a further analysis considering an equal number of counting points revealed that the highest species richness and relative abundance values occurred in urban areas surrounded by forest landscapes (Urb F).
Regarding the richness and relative abundance of nesting bird species, equivalent results were observed in urbanized areas surrounded by both forests and agricultural landscapes. Urban areas surrounded by forests had an average of 10.69 species and 14.22 breeding pairs per counting point. Similarly, areas surrounded by agricultural landscapes had an average of 10.60 species and 14.56 breeding pairs per counting point. This relationship was also noted by other authors. For instance, Clergeau et al. (1998) [36] compared the avifauna structure between cities predominantly surrounded by forested landscapes in Quebec, Canada, and those predominantly surrounded by agricultural areas in Rennes, France. Their findings indicated similar population relative abundance values of House Sparrows and Common Starlings during the breeding season in both cities.
Our findings suggest that urban landscapes represent distinct ecosystems with unique limits to bird species richness and relative abundance. Interestingly, smaller cities were found to be more suitable for supporting bird populations. Observations in villages and towns exhibited similarities to the data collected in urban areas surrounded by forests (Urb F). Therefore, it is crucial to determine the optimal size of urban landscapes for supporting diverse bird communities.
A high level of urbanization was found to have a negative impact on various indicators of bird communities. However, the specific data varied depending on characteristics such as the size and location (district or micro-district) of the urbanized area, its date of establishment, the type of residential housing, the presence of green infrastructure, and other spatial elements [71,72,73,74]. During the breeding season, species diversity and relative abundance were positively influenced by the presence of forests (Urb F), while highly urbanized areas (Urb U) had a negative influence on bird communities. Urban areas surrounded by agricultural landscapes exhibited a 12% higher number of nesting birds that flew outside the urban territory to feed, an 8% higher number of herbivorous birds that feed on the ground or in the herb layer, and a higher number of ground-nesting birds. Generally, agricultural landscapes had a greater proportion of typical agricultural species in the bird community [4,35]. In contrast, urban areas surrounded by forests exhibited a greater relative abundance of species that typically inhabit forested environments. Forest specialist species found in cities tend to exhibit specific nesting and feeding habits, such as feeding on invertebrates collected from leaves, twigs, and the air near their nesting areas.
The cluster analysis confirmed that bird communities in cities are influenced by the surrounding landscape. The dendrogram revealed that specialized forest species, in addition to those in Urb F areas, were mostly concentrated in forested landscapes (For). Specialist agricultural species, which tend to avoid larger cities including Urb F, Urb P, and Urb U areas, were grouped together. These results provide interesting insights into the variation in the abundance of specialist species between forested and agricultural landscapes while also highlighting the presence of generalist species with more even distribution across all areas.
Bird communities in urban areas are predominantly composed of highly adaptable synanthropic and generalist species, as noted in [75]. Specialist species, on the other hand, are less common in urban environments but may occasionally inhabit them, based on the characteristics of the surrounding landscape [33,76,77]. The ratio between generalist and specialist species is a principal factor for the stability of both bird communities and city ecosystems [78,79,80]. Asoskova et al. (2012) [51] emphasized that the avifauna in cities is influenced by both geographical location and the surrounding landscape. The authors described bird communities in several cities, evaluating factors such as terrain, hydrography, climate, soil, vegetation, and urbanization intensity, as well as elements of the surrounding landscape. In contrast, Clergeau et al. (1998; 2001) [36,52] suggested that the surrounding landscape has no influence on the diversity of bird communities in cities. They concluded that city characteristics are the primary factors regulating bird communities. However, genetic studies on the Great Tit population by Björklund et al. (2010) [53] provided a more nuanced perspective. Gene flow between urban park and forest populations was evident, although Great Tits tend to migrate predominantly from larger city park populations to forests.
When analyzing forest bird species such as European Pied Flycatcher, Eurasian Blue Tit, Great Tit, and Common Chaffinch, it is important to highlight that their average relative abundance values are significantly higher in forested landscapes (For) compared to agricultural landscapes (Agr). Typical forest species such as Great Spotted Woodpecker, Eurasian Jay (Garrulus glandarius), Eurasian Siskin, and Eurasian Bullfinch were frequently observed in forested landscapes (For). Conversely, these species were either not observed or only a few individuals were recorded in agricultural landscapes (Agr).
During the breeding season, European Pied Flycatcher tends to inhabit forested areas in cities surrounded by forests. Singing individuals were often observed in For landscapes near kindergartens, schools, and other public spaces with abundant hanging nesting boxes and larger green spaces, as mandated by legislation. The species was also frequently observed in low-rise residential areas (Urb U) characterized by mature trees which provide suitable microhabitats for nesting, such as cavities and holes.
The presence of the Common Redstart (Phoenicurus phoenicurus) and Black Redstart in urbanized areas has become more common. However, 30 years ago, the Common Redstart was considered a rare species primarily found in pine forests [81]. Similarly, the European Serin, which was first observed in 1951 [81], has now become a common species in urban environments.
Although the European Robin is typically associated with forested habitats, a few individuals have been observed singing and nesting in urban areas. In certain parts of Europe, the European Robin is commonly observed in anthropogenic landscapes and is considered an urban species [82]. Recent studies have analyzed the species’ adaptation and behavioral changes in urbanized areas [80,81,82,83,84,85]. In Lithuania, the European Robin is a migratory species that rarely or occasionally winters. However, it is not surprising that the species has been observed more frequently in the past few winters due to climate change and its high adaptability. It is plausible that there will be an increase in the number of individuals inhabiting cities and towns in the future.
The Common Wood Pigeon, once a typical forest species, is rapidly adapting to urban habitats. According to Logminas et al. (1990) [86], this species, which was previously common in forests, has become more abundant in suburban and urban areas over the past twenty years. Subsequently, studies have confirmed that the species is in the early stages of adapting to urbanized habitats, although its abundance is still higher in forests [87,88]. Our research on the Common Wood Pigeon revealed that the highest abundance was observed in agricultural areas and cities surrounded by agricultural fields. Tomiałojć (2021) [89] observed a similar relationship in which the increase in the urban population of this species depends on the availability of nearby agricultural fields for feeding flights.
The Great Spotted Woodpecker was observed feeding nestlings in the green spaces of urban areas (Urb U) where mature trees are present. This suggests that the species is capable of utilizing urbanized landscapes with an abundance of mature trees.
The Eurasian Siskin and Eurasian Bullfinch were predominantly detected in forested landscapes (For), indicating that urbanized areas are not a common choice for nesting for these species.
The relative abundance of Hawfinches was unexpected, as many individuals were observed singing and nesting in the canopies of mature trees. However, evidence suggests that only a few of the recorded individuals were actually nesting. Some observations from the initial count were excluded due to a significantly lower number of individuals detected, possibly because the species is known to be particularly quiet during the breeding season.
The For landscapes stand out due to the abundant population of Hooded Crows. Urban areas surrounded by pine forests are highly suitable for the habitation and nesting of this species. The widespread presence of predator species is suspected to have a negative impact on the populations of Rock Doves and various sparrow species, affecting their breeding success and clutch sizes. Previous studies highlighted the increase in the Hooded Crow population in the eastern Baltic Sea region and its spread in various European cities [87,89,90]. It is believed that the further expansion of their distribution is limited by the population of Common Wood Pigeons [87,90].
There were no significant differences in the populations of White Wagtails, European Greenfinches, Common Redstarts, Lesser Whitethroats, and Spotted Flycatchers between the surrounding forest and agricultural landscapes. The numbers of individuals in both types of landscapes were similar. However, the abundances of certain species in either landscape were difficult to explain, such as the abundance of Northern Wheatears in the forest landscape.
A key question that needs to be addressed is whether bird species can adapt, spread, and inhabit urbanized areas that were initially considered unsuitable for them. It is important to identify which bird species have the potential for adaptation. Our analysis suggests that bird communities in urbanized areas are significantly influenced by the surrounding landscapes, with most species being characteristic of either forest or agricultural landscapes.
In bird survey schemes, the probability of the uneven detection of individuals can significantly influence the outcomes of ornithological studies [91,92,93]. This bias may arise from variations in the detectability of bird species, which can depend on factors such as bird song frequencies, the distance to the observer, habitat characteristics, activity patterns, weather conditions, sex, age, the time of day, and methodological considerations, including the skills of the observers and others [93,94,95].
While we acknowledge the potential limitations in interpreting abundance dat, stemming from differences in the detectability of various species, we made diligent efforts and rigorously applied the standardized point count methodology to mitigate errors related to detectability patterns. Our approach aimed to minimize these potential biases and ensure that the variation in detection probability was less than the variation in population size.
Due to variations in detection probability, the interpretative value of community bird abundance is subject to uncertainty. Nevertheless, numerous studies still employ it as a valuable metric [96,97,98]. A notable example of the potential for exploring community bird abundance indexes is the Pan-European Common Bird Monitoring Scheme (PECBMS) [99]. The PEC-BMS employs multi-species indicators which involve scaling species-specific abundances to a reference baseline. This standardization ensures that the response variable maintains a consistent order of magnitude, making inter-specific differences across species comparable.
In our study, due to the absence of a standardization procedure, abundance data may be influenced by inter-specific differences, potentially introducing biases into the modeled response. To address this issue, we utilized the relative abundance simultaneously with species richness and the Shannon–Weaver diversity index when evaluating bird communities (as shown in Table 2). This comprehensive approach allowed us to assess bird communities from various angles and avoid relying solely on a single indicator, thereby strengthening the robustness of our study.
While this research provides valuable insights into the dynamics of species composition in bird communities within urbanized areas based on the surrounding landscapes, there are still many unanswered questions that future studies could explore. One possible direction is to investigate the relationship between bird community indexes and the urbanization gradient. It is plausible that species abundance could be the lowest in the city center and gradually increases moving away from it [100,101,102]. Additionally, the green spaces within urbanized areas should be evaluated based on their infrastructure.

5. Conclusions

Our analysis leads to several conclusions. Firstly, urbanized areas surrounded by forests exhibit higher relative abundances of birds that typically belong to specialist forest species. Conversely, urban areas surrounded by agricultural landscapes have greater abundances of species adapted to open or semi-open landscapes with specific feeding and nesting behaviors. The urban forest parks show the highest diversity and relative abundance values of nesting bird species among the urbanized areas, while highly urbanized areas exhibit the lowest. The diversity and relative abundance of nesting species are similar in both forest-surrounded and agricultural landscapes, although the bird community structures differ significantly.
In both types of studied urban areas, the dominant bird species are the Common Starling, House Sparrow, and Eurasian Tree Sparrow. Cities surrounded by forests have a higher relative abundance of typical forest species such as the Great Tit, Common Chaffinch, Eurasian Blue Tit, and European Pied Flycatcher. Observations of nesting Black Redstart and European Serin pairs were twice as high, while only a few Eurasian Wryneck, European Robin, and Eurasian Nuthatch pairs were detected. During the breeding season, Great Spotted Woodpeckers, Eurasian Jays, Eurasian Hoopoes, and Eurasian Treecreepers were only observed in urban areas surrounded by forests.
Urban areas surrounded by agricultural landscapes had abundant House Sparrow populations and higher relative abundances of typical agricultural landscape species such as the White Stork, Common Linnet, and European Goldfinch. Observations of local populations of Thrushes (Turdidae family), including Fieldfares and Common Blackbirds, were abundant. Similarly, the Columbiformes order had high local population relative abundances of Common Wood Pigeons and Eurasian Collared Doves.
The surrounding landscapes had no influence on the populations of White Wagtails, European Greenfinches, Common Redstarts, Lesser Whitethroats, and Spotted Flycatchers.
We consider urbanized areas available ecological niches for generalized bird species. In the hemiboreal and boreal forest zones, the biological diversity in urbanized areas can be increased and preserved not only by developing green infrastructure within cities but also by forming forested surrounding landscapes.

Author Contributions

Conceptualization, L.B. and G.B. (Gediminas Brazaitis); methodology, L.B. and G.B. (Gediminas Brazaitis); software, K.Š, G.B. (Gediminas Brazaitis); formal analysis, G.B. (Gediminas Brazaitis), K.Š. and L.B.; investigation, L.B.; resources, L.B.; data curation, L.B. and G.B. (Gediminas Brazaitis); writing—original draft preparation, L.B.; writing—review and editing, G.B. (Gediminas Brazaitis) and G.B. (Gailenė Brazaitytė); visualization, K.Š.; supervision, G.B.; All authors have read and agreed to the published version of the manuscript.

Funding

This research received no external funding.

Data Availability Statement

The data presented in this study are available on request from the corresponding author. The data are not publicly available due to institutional policy.

Conflicts of Interest

The authors declare no conflict of interest.

Appendix A

List of bird species recorded during point count surveys in Lithuania, 2019–2021.
Table A1. Average number of nesting pairs per one point count in different urban landscape types.
SpeciesTotal Observed IndividualsForAgrUrbFUrbPUrbU
Mean±SEMean±SEMean±SEMean±SEMean±SE
Ciconia ciconia160.0290.0130.0600.018000000
Columba palumbus2230.2910.0360.5680.0430.3330.070.3640.0850.2060.032
Streptopelia decaocto1130.1370.030.3880.0390.0170.0170.0910.0510.080.021
Cuculus canorus7000.0050.0050.0830.036000.0060.006
Upupa epops40.0230.01100000000
Jynx torquilla190.0630.0180.0330.01300000.0110.008
Dryocopus martius500000.0830.0360000
Dendrocopos major440.0510.017000.50.073000.0290.013
Hirundo rustica640.1770.0360.1530.03100000.0290.013
Motacilla alba3560.6290.0480.7870.053000.6670.1420.4570.043
Troglodytes troglodytes410.0060.0060.0050.0050.650.1060000
Erithacus rubecula750.0690.0190.0220.0110.8170.1020.0610.0420.0460.016
Luscinia luscinia50.0110.0080.0110.0080.0170.0170000
Phoenicurus ochruros2490.8910.0480.3770.03800000.1370.028
Phoenicurus phoenicurus2880.5310.0430.5410.0430.0830.0360.030.030.5140.044
Oenanthe isabellina140.0510.0190.0110.008000.030.030.0110.008
Turdus merula3320.20.0310.4150.0391.40.0990.4850.0880.6910.053
Turdus pilaris2950.3260.0410.820.0550.1330.051.3640.1780.20.038
Turdus philomelos510.0110.0080.0820.020.50.081000.0230.011
Turdus viscivorus500000.0830.0360000
Hippolais icterina750.0740.020.1530.031000.5760.1230.0860.024
Acrocephalus palustris80.0060.0060.0220.011000.030.030.0110.008
Sylvia curruca1940.360.040.3830.044000.1820.0810.3140.039
Sylvia communis640.1260.0250.0820.02000.2730.10.1030.024
Sylvia borin340.0230.0110.0270.0120.1330.050.1210.0720.0740.02
Sylvia atricapilla540.0740.020.0870.0210.350.0850.0610.0420.0110.008
Phylloscopus sibilatrix880.0110.008001.3830.152000.0170.01
Phylloscopus collybita1150.1030.0240.0770.021.0170.1050.1210.0580.1030.023
Phylloscopus trochilus330.0630.0180.0490.0160.0830.0430.030.030.040.017
Regulus regulus640.0110.008000.950.174000.0290.019
Muscicapa striata620.1490.0290.1480.0270.1330.056000.0060.006
Ficedula hypoleuca610.1770.030.0220.0110.1330.044000.1030.024
Cyanistes caeruleus2490.5490.050.3660.0420.3170.0770.4240.1070.3030.041
Parus major6680.9660.0560.7810.0552.20.1810.7270.1461.1430.068
Periparus ater310.0230.011000.4330.084000.0060.006
Lophophanes cristatus50.0060.006000.0670.0520000
Poecile palustris130.0110.0080.0050.0050.1170.0540.030.030.0110.008
Poecile montanus700000.1170.0420000
Sitta europaea400.0460.0180.0160.0090.4330.087000.0170.01
Certhia familiaris240.0060.006000.350.085000.0110.011
Oriolus oriolus80.0170.010.0110.0080.0330.023000.0060.006
Lanius collurio40.0060.0060.0050.00500000.0110.008
Garrulus glandarius490.0510.019000.350.0710.0610.0420.0970.022
Pica pica740.0970.0220.1150.024000.1210.0580.1830.029
Coloeus monedula400.0460.020.1260.027000.2120.0720.0110.011
Corvus cornix2270.4060.0380.0550.0170.2330.0840.7880.1210.6060.044
Corvus corax500000.0830.0360000
Sturnus vulgaris9502.0110.0971.9180.0890.0670.0471.4240.2041.120.08
Passer domesticus7511.5090.0982.0330.11000.1210.0950.6340.074
Passer montanus6761.1140.0690.9180.062001.2730.281.5490.097
Fringilla coelebs4660.840.0590.5740.0521.7830.1261.0610.1570.4110.05
Serinus serinus2120.5890.0460.4100.042000.3030.1020.1370.03
Chloris chloris2810.6170.0560.5740.059000.2120.0950.3490.046
Carduelis carduelis1550.1710.030.4260.052000.6360.1290.1490.033
Spinus spinus190.0400.015000.1670.059000.0110.008
Linaria cannabina1760.160.0290.7050.05700000.1090.029
Carpodacus erythrinus50.0110.0080.0110.0080.0170.0170000
Pyrrhula pyrrhula240.0740.0270.0050.0050.1330.05000.0110.008
Coccothraustes coccothraustes780.0970.0220.1150.0240.350.0850.1210.0720.0860.025
Emberiza citrinella130.0400.0150.0270.0120.0170.0170000

Appendix B

Table A2. Average number of nesting pairs per one point count in different landscapes based on feeding and nesting characteristics during the breeding season.
Bird Ecological GroupForAgrUrb FUrb PUrb U
Mean±SEMean±SEMean±SEMean±SEMean±SE
Feeding outside the urban territory (O)7.1370.2348.2080.2602.3830.2095.4550.4505.2740.198
Feeding near the nest (N)7.1090.2326.3930.21213.4670.5016.5450.5355.0340.204
Herbivorous (V)4.1630.1305.1840.1622.2000.1353.1330.3022.8980.112
Feeding on invertebrates (I)9.6450.2549.2600.24313.3530.4738.1000.5596.8060.221
Feeding on vertebrates (predators) (P)0.4380.0370.1570.0260.2970.0860.7670.1130.6050.041
Foraging on the ground or in the herb layer (IG)6.1540.1737.5760.2154.2730.2016.4940.4564.8310.170
Collecting food from leaves. twigs and the air (IL)7.9830.2147.0200.19110.2770.4605.5060.4715.4210.173
Foraging on tree—barks (IB)0.1090.0290.0160.0091.3000.1690.0000.0000.0570.023
Ground nesting (G)1.4660.0882.0230.1054.5850.2621.3210.1761.1890.071
Crown nesting (C)4.1540.1814.7550.2286.1830.3145.8330.4763.1970.164
Hole nesting (H)8.4220.2137.6520.2054.9950.3274.8330.4135.8920.175

References

  1. Czech, B.; Krausman, P.R.; Devers, P.K. Economic associations among causes of species endangerment in the United States: Associations among causes of species endangerment in the United States reflect the integration of economic sectors, supporting the theory and evidence that economic growth proceeds at the competitive exclusion of nonhuman species in the aggregate. BioScience 2000, 50, 593–601. [Google Scholar]
  2. Elmqvist, T.; Zipperer, W.C.; Güneralp, B. Urbanization, habitat loss and biodiversity decline: Solution pathways to break the cycle. In The Routledge Handbook of Urbanization and Global Environmental Change; Routledge: London, UK, 2015; pp. 163–175. [Google Scholar]
  3. Young, H.S.; McCauley, D.J.; Galetti, M.; Dirzo, R. Patterns, causes, and consequences of anthropocene defaunation. Annu. Rev. Ecol. Evol. Syst. 2016, 47, 333–358. [Google Scholar] [CrossRef]
  4. Lepczyk, C.A.; La Sorte, F.A.; Aronson, M.F.; Goddard, M.A.; MacGregor-Fors, I.; Nilon, C.H.; Warren, P.S. Global patterns and drivers of urban bird diversity. In Ecology and Conservation of Birds in Urban Environments; Springer: Cham, 2017; pp. 13–33. [Google Scholar]
  5. Rosenberg, K.V.; Dokter, A.M.; Blancher, P.J.; Sauer, J.R.; Smith, A.C.; Smith, P.A.; Stanton, J.C.; Panjabi, A.; Helft, L.; Parr, M.; et al. Decline of the North American avifauna. Science 2019, 366, 120–124. [Google Scholar] [CrossRef]
  6. Beissinger, S.R.; Osborne, D.R. Effects of urbanization on avian community organization. Condor 1982, 84, 75–83. [Google Scholar] [CrossRef]
  7. Bezzel, E. Birdlife in intensively used rural and urban environments. Ornis Fenn. 1985, 62, 90–95. [Google Scholar]
  8. Jonathan, A.F.; Ruth, D.; Gregory, P.A.; Carol, B.; Gordon, B.; Stephen, R.C. Global consequences of land use. Science 2005, 309, 570–574. [Google Scholar]
  9. Dearborn, D.C.; Kark, S. Motivations for conserving urban biodiversity. Conserv. Biol. 2010, 24, 432–440. [Google Scholar] [CrossRef]
  10. Lawler, J.J.; Lewis, D.J.; Nelson, E.; Plantinga, A.J.; Polasky, S.; Withey, J.C.; Helmers, D.P.; Martinuzzi, S.; Pennington, D.; Radeloff, V.C. Projected land-use change impacts on ecosystem services in the United States. Proc. Natl. Acad. Sci. USA 2014, 111, 7492–7497. [Google Scholar] [CrossRef]
  11. Liu, Z.; He, C.; Wu, J. The relationship between habitat loss and fragmentation during urbanization: An empirical evaluation from 16 world cities. PLoS ONE 2016, 11, e0154613. [Google Scholar] [CrossRef]
  12. Goldewijk, K.K. Estimating global land use change over the past 300 years: The HYDE database. Glob. Biogeochem. Cycles 2001, 15, 417–433. [Google Scholar] [CrossRef]
  13. United Nations. New Urban Agenda (Habitat III); United Nations: Quito, Ecuador, 2017. [Google Scholar]
  14. European Commission Green Infrastructure InPolicy. 2023. Available online: https://environment.ec.europa.eu/topics/nature-and-biodiversity/green-infrastructure_en#policy (accessed on 18 February 2023).
  15. Felson, A.J.; Oldfield, E.E.; Bradford, M.A. Involving ecologists in shaping large-scale green infrastructure projects. BioScience 2013, 63, 882–890. [Google Scholar]
  16. Lerman, S.B.; Nislow, K.H.; Nowak, D.J.; DeStefano, S.; King, D.I.; Jones-Farrand, D.T. Using urban forest assessment tools to model bird habitat potential. Landsc. Urban Plan. 2014, 122, 29–40. [Google Scholar] [CrossRef]
  17. Jimenez, M.F.; Pejchar, L.; Reed, S.E.; McHale, M.R. The efficacy of urban habitat enhancement programs for conserving native plants and human-sensitive animals. Landsc. Urban Plan. 2022, 220, 104356. [Google Scholar] [CrossRef]
  18. Kark, S.; Iwaniuk, A.; Schalimtzek, A.; Banker, E. Living in the city: Can anyone become an ‘urban exploiter’? J. Biogeogr. 2007, 34, 638–651. [Google Scholar] [CrossRef]
  19. Jokimäki, J.; Suhonen, J.; Kaisanlahti-Jokimäki, M.L. Urbanization and species occupancy frequency distribution patterns in core zone areas of European towns. Eur. J. Ecol. 2016, 2, 23–43. [Google Scholar] [CrossRef]
  20. Battisti, C.; Zullo, F. A recent colonizer bird as indicator of human-induced landscape change: Eurasian collared dove (Streptopelia decaocto) in a small Mediterranean island. Reg. Environ. Chang. 2019, 19, 2113–2121. [Google Scholar] [CrossRef]
  21. Callaghan, C.T.; Major, R.E.; Wilshire, J.H.; Martin, J.M.; Kingsford, R.T.; Cornwell, W.K. Generalists are the most urban-tolerant of birds: A phylogenetically controlled analysis of ecological and life history traits using a novel continuous measure of bird responses to urbanization. Oikos 2019, 128, 845–858. [Google Scholar] [CrossRef]
  22. Palacio, F.X. Urban exploiters have broader dietary niches than urban avoiders. Ibis 2020, 162, 42–49. [Google Scholar] [CrossRef]
  23. Šálek, M.; Grill, S.; Riegert, J. Nest-site selection of an avian urban exploiter, the Eurasian magpie Pica pica, across the urban-rural gradient. J. Vertebr. Biol. 2020, 70, 20086-1. [Google Scholar] [CrossRef]
  24. Møller, A.P.; Díaz, M. Avian preference for close proximity to human habitation and its ecological consequences. Curr. Zool. 2018, 64, 623–630. [Google Scholar] [CrossRef]
  25. Adams, L.W. Urban Wildlife Habitats: A Landscape Perspective; U of Minnesota Press: Minneapolis, MN, USA, 1994; Volume 3. [Google Scholar]
  26. Alberti, M. Advances in Urban Ecology: Integrating Humans and Ecological Processes in Urban Ecosystems; Springer: New York, NY, USA, 2008. [Google Scholar]
  27. Karimi, J.D.; Corstanje, R.; Harris, J.A. Bundling ecosystem services at a high resolution in the UK: Trade-offs and synergies in urban landscapes. Landsc. Ecol. 2021, 36, 1817–1835. [Google Scholar] [CrossRef]
  28. Marzluff, J.M. Worldwide urbanization and its effects on birds. In Avian Ecology and Conservation in An Urbanizing World; Springer: Berlin/Heidelberg, Germany, 2001; pp. 19–47. [Google Scholar]
  29. Jokimäki, J.; Suhonen, J.; Jokimäki-Kaisanlahti, M.L.; Carbó-Ramírez, P. Effects of urbanization on breeding birds in European towns: Impacts of species traits. Urban Ecosyst. 2016, 19, 1565–1577. [Google Scholar] [CrossRef]
  30. Concepción, E.D.; Moretti, M.; Altermatt, F.; Nobis, M.P.; Obrist, M.K. Impacts of urbanisation on biodiversity: The role of species mobility, degree of specialisation and spatial scale. Oikos 2015, 124, 1571–1582. [Google Scholar] [CrossRef]
  31. Donihue, C.M.; Lambert, M.R. Adaptive evolution in urban ecosystems. Ambio 2015, 44, 194–203. [Google Scholar] [CrossRef] [PubMed]
  32. Lerman, S.B.; Narango, D.L.; Avolio, M.L.; Bratt, A.R.; Engebretson, J.M.; Groffman, P.M.; Hall, S.J.; Heffernan, J.B.; Hobbie, S.E.; Larson, K.L.; et al. Residential yard management and landscape cover affect urban bird community diversity across the continental USA. Ecol. Appl. 2021, 31, e02455. [Google Scholar] [CrossRef]
  33. McKinney, M.L. Urbanization as a major cause of biotic homogenization. Biol. Conserv. 2006, 127, 247–260. [Google Scholar] [CrossRef]
  34. Marcacci, G.; Westphal, C.; Wenzel, A.; Raj, V.; Nölke, N.; Tscharntke, T.; Grass, I. Taxonomic and functional homogenization of farmland birds along an urbanization gradient in a tropical megacity. Glob. Chang. Biol. 2021, 27, 4980–4994. [Google Scholar] [CrossRef]
  35. Lancaster, R.K.; Rees, W.E. Bird communities and the structure of urban habitats. Can. J. Zool. 1979, 57, 2358–2368. [Google Scholar] [CrossRef]
  36. Clergeau, P.; Savard, J.P.L.; Mennechez, G.; Falardeau, G. Bird abundance and diversity along an urban-rural gradient: A comparative study between two cities on different continents. Condor 1998, 100, 413–425. [Google Scholar] [CrossRef]
  37. Shwartz, A.; Muratet, A.; Simon, L.; Julliard, R. Local and management variables outweigh landscape effects in enhancing the diversity of different taxa in a big metropolis. Biol. Conserv. 2013, 157, 285–292. [Google Scholar] [CrossRef]
  38. Kim, K. Morphological analysis of green infrastructure in the Seoul metropolitan area, South Korea. Landsc. Ecol. Eng. 2015, 11, 259–268. [Google Scholar]
  39. Morrison, M.L. Bird populations as indicators of environmental change. In Current Ornithology; Springer: Boston, MA, USA, 1986; Volume 3, pp. 429–451. [Google Scholar]
  40. Canterbury, G.E.; Martin, T.E.; Petit, D.R.; Petit, L.J.; Bradford, D.F. Bird communities and habitat as ecological indicators of forest condition in regional monitoring. Conserv. Biol. 2000, 14, 544–558. [Google Scholar] [CrossRef]
  41. Sekercioglu, C.H. Increasing awareness of avian ecological function. Trends Ecol. Evol. 2006, 21, 464–471. [Google Scholar] [CrossRef] [PubMed]
  42. Morelli, F.; Reif, J.; Díaz, M.; Tryjanowski, P.; Ibáñez-Álamo, J.D.; Suhonen, J.; Jokimäki, J.; Kaisanlahti-Jokimäki, M.-L.; Møller, A.P.; Bussière, R.; et al. Top ten birds indicators of high environmental quality in European cities. Ecol. Indic. 2021, 133, 108397. [Google Scholar] [CrossRef]
  43. Kang, W.; Minor, E.S.; Park, C.R.; Lee, D. Effects of habitat structure, human disturbance, and habitat connectivity on urban forest bird communities. Urban Ecosyst. 2015, 18, 857–870. [Google Scholar] [CrossRef]
  44. Amaya-Espinel, J.D.; Hostetler, M.; Henriquez, C.; Bonacic, C. The influence of building density on Neotropical bird communities found in small urban parks. Landsc. Urban Plan. 2019, 190, 103578. [Google Scholar] [CrossRef]
  45. De Groot, M.; Flajšman, K.; Mihelič, T.; Vilhar, U.; Simončič, P.; Verlič, A. Green space area and type affect bird communities in a South-eastern European city. Urban For. Urban Green. 2021, 63, 127212. [Google Scholar] [CrossRef]
  46. Liordos, V.; Jokimäki, J.; Kaisanlahti-Jokimäki, M.L.; Valsamidis, E.; Kontsiotis, V.J. Patch, matrix and disturbance variables negatively influence bird community structure in small-sized managed green spaces located in urban core areas. Sci. Total Environ. 2021, 801, 149617. [Google Scholar] [CrossRef]
  47. Sander, M.M.; Tietze, D.T. Impacts of Traffic Infrastructure on Urban Bird Communities: A Review. Sustainability 2022, 14, 16805. [Google Scholar] [CrossRef]
  48. Hennings, L.A.; Edge, W.D. Riparian bird community structure in Portland, Oregon: Habitat, urbanization, and spatial scale patterns. Condor 2003, 105, 288–302. [Google Scholar] [CrossRef]
  49. Forman, R.F.F.; Godron, M. Landscape Ecology; Wiley: New York, NY, USA, 1986. [Google Scholar]
  50. Mills, G.S.; Dunning, J.B., Jr.; Bates, J.M. Effects of urbanization on breeding bird community structure in southwestern desert habitats. Condor 1989, 91, 416–428. [Google Scholar] [CrossRef]
  51. Asoskova, N.I.; Durnev, Y.A.; Moroshenko, N.V. Birds of the Cities of Russia. Association of scientific editions of KMK: St. Petersburg/Moscow, Russia, 2012. [Google Scholar]
  52. Clergeau, P.; Jokimäki, J.; Savard, J.P.L. Are urban bird communities influenced by the bird diversity of adjacent landscapes? J. Appl. Ecol. 2001, 38, 1122–1134. [Google Scholar] [CrossRef]
  53. Björklund, M.; Ruiz, I.; Senar, J.C. Genetic differentiation in the urban habitat: The great tits (Parus major) of the parks of Barcelona city. Biol. J. Linn. Soc. 2010, 99, 9–19. [Google Scholar] [CrossRef]
  54. Aleknavičius, P. Aplinkosaugos ir Aplinkotvarkos teisė: Metodiniai Patarimai; Ardiva: Kaunas, Lietuva, 2008; ISBN 978-9955-760-91-7. [Google Scholar]
  55. Priednieks, J.; Kuresoo, A.; Kurlavičius, P. Rekomendacii k Ornitologičeskomu Monitoringu v Pribaltike; Zinatne: Ryga, Latvia, 1986. (In Russian) [Google Scholar]
  56. Bibby, C.J.; Burgess, N.D.; Hillis, D.M.; Hill, D.A.; Mustoe, S. Bird Census Techniques; Elsevier: Amsterdam, The Netherlands, 2000. [Google Scholar]
  57. Kurlavičius, P. Birds of Forest Islands in South-East Baltic Region; Baltic ECO: Vilnius, Lithuania, 1995; 263p. [Google Scholar]
  58. Krebs, C.J. Ecological Methodology; Harper Row: New York, NY, USA, 1989; 654p. [Google Scholar]
  59. Hammer, Ø.; Harper, D.A.T.; Ryan, P.D. PAST: Paleontological statistics software package for education and data analysis. Palaeontol. Electron. 2001, 4, 4. [Google Scholar]
  60. Dierschke, F.V. Die Sommervogelbestände nordwestdeutscher Kiefernforsten. Vogelwelt 1973, 94, 201–225. [Google Scholar]
  61. Kurlavičius, P. Biotopičeskoje raspredelenije ptic v agronasaždenijach; Mokslas: Vilnius, Lietuva, 1986. [Google Scholar]
  62. Flade, M. Die Brutvogelgemeinschaften Mittel-und Norddeutschlands: Grundlagen für den Gebrauch Vogelkundlicher Daten in der Landschaftsplanung; IHW: Eching, Germany, 1994; ISBN 10: 393016700X/ISBN 13: 9783930167005. [Google Scholar]
  63. Gil-Tena, A.; Saura, S.; Brotons, L. Effects of forest composition and structure on bird species richness in a Mediterranean context: Implications for forest ecosystem management. For. Ecol. Manag. 2007, 242, 470–476. [Google Scholar] [CrossRef]
  64. Illera, J.C.; Atienza, J.C. Foraging shifts by the Blue Tit (Parus caeruleus) in relation to arthropod availability in a mixed woodland during the spring-summer period. Ardeola 1995, 42, 39–48. [Google Scholar]
  65. Hobson, K.A.; Bayne, E. Breeding bird communities in boreal forest of western Canada: Consequences of “unmixing” the mixedwoods. Condor 2000, 102, 759–769. [Google Scholar]
  66. Díaz, L. Influences of forest type and forest structure on bird communities in oak and pine woodlands in Spain. For. Ecol. Manag. 2006, 223, 54–65. [Google Scholar] [CrossRef]
  67. Cannon, A. The significance of private gardens for bird conservation. Bird Conserv. Int. 1999, 9, 287–297. [Google Scholar] [CrossRef]
  68. Goddard, M.A.; Dougill, A.J.; Benton, T.G. Scaling up from gardens: Biodiversity conservation in urban environments. Trends Ecol. Evol. 2010, 25, 90–98. [Google Scholar] [CrossRef] [PubMed]
  69. Goddard, M.A.; Ikin, K.; Lerman, S.B. Ecological and social factors determining the diversity of birds in residential yards and gardens. In Ecology and Conservation of Birds in Urban Environments; Springer: Berlin/Heidelberg, Germany, 2017; pp. 371–397. [Google Scholar]
  70. Havlíček, J.; Riegert, J.; Bandhauerová, J.; Fuchs, R.; Šálek, M. Species-specific breeding habitat association of declining farmland birds within urban environments: Conservation implications. Urban Ecosyst. 2021, 24, 1259–1270. [Google Scholar] [CrossRef]
  71. Batten, L.A. Breeding bird species diversity in relation to increasing urbanisation. Bird Study 1972, 19, 157–166. [Google Scholar] [CrossRef]
  72. Idzelis, R.L.; Jankaitė, A.; Oškinis, V.; Pakalnis, R.; Venckus, Z.; Virbickas, T. Assessment of the state of natural environment in Vilnius city. In Proceedings of the 7th International Conference Environmental Engineering, Vilnius, Lithuania, 22–23 May 2008; pp. 154–162. [Google Scholar]
  73. McKinney, M.L. Effects of urbanization on species richness: A review of plants and animals. Urban Ecosyst. 2008, 11, 161–176. [Google Scholar] [CrossRef]
  74. Bisikirskienė, L.; Brazaitis, G. The influence of urbanization on diversity and abundance of breeding bird species in Kaunas city. In Human and Nature Safety 2020: Selected Papers; Vytautas Magnus University Agriculture Academy: Akademija, Lithuania, 2020; pp. 123–125. [Google Scholar]
  75. Shochat, E.; Lerman, S.B.; Anderies, J.M.; Warren, P.S.; Faeth, S.H.; Nilon, C.H. Invasion, competition, and biodiversity loss in urban ecosystems. BioScience 2010, 60, 199–208. [Google Scholar] [CrossRef]
  76. Boal, C.W.; Mannan, R.W. Nest-site selection by Cooper’s Hawks in an urban environment. J. Wildl. Manag. 1998, 62, 864–871. [Google Scholar] [CrossRef]
  77. DeStefano, S.; DeGraaf, R.M. Exploring the ecology of suburban wildlife. Front. Ecol. Environ. 2003, 1, 95–101. [Google Scholar] [CrossRef]
  78. Wilson, D.S.; Yoshimura, J. On the coexistence of specialists and generalists. Am. Nat. 1994, 144, 692–707. [Google Scholar] [CrossRef]
  79. Julliard, R.; Clavel, J.; Devictor, V.; Jiguet, F.; Couvet, D. Spatial segregation of specialists and generalists in bird communities. Ecol. Lett. 2006, 9, 1237–1244. [Google Scholar] [CrossRef]
  80. Staude, I.R.; Overbeck, G.E.; Fontana, C.S.; Bencke, G.A.; Silva, T.W.D.; Mimet, A.; Pereira, H.M. Specialist birds replace generalists in grassland remnants as land use change intensifies. Front. Ecol. Evol. 2021, 8, 597542. [Google Scholar] [CrossRef]
  81. Logminas, V.; Nedzinskas, V.; Drobelis, E. Lietuvos fauna. Paukščiai 2; Mokslas: Vilnius, Lietuva, 1991; ISBN 5-420-00398-8. [Google Scholar]
  82. IUCN 2023. The IUCN Red List of Threatened Species. Version 2022-2. Available online: https://www.iucnredlist.org (accessed on 19 April 2023).
  83. Kareklas, K.; Wilson, J.; Kunc, H.P.; Arnott, G. Signal complexity communicates aggressive intent during contests, but the process is disrupted by noise. Biol. Lett. 2019, 15, 20180841. [Google Scholar] [CrossRef] [PubMed]
  84. Juškaitis, R. Is nesting in closed nestboxes advantageous for the European Robin (Erithacus rubecula)? Avian Res. 2021, 12, 21. [Google Scholar] [CrossRef]
  85. Önsal, Ç.; Yelimlieş, A.; Akçay, Ç. Aggression and multimodal signalling in noise in the European robin. Biorxiv 2022. [Google Scholar] [CrossRef]
  86. Logminas, V.; Nedzinskas, V.; Drobelis, E. Lietuvos fauna. Paukščiai 1; Mokslas: Vilnius, Lietuva, 1990; ISBN 5-420-00397-X. [Google Scholar]
  87. Bea, A.; Svazas, S.; Grishanov, G.; Kozulin, A.; Stanevicius, V.; Astafieva, T.; Olano, I.; Raudonikis, L.; Butkauskas, D.; Sruoga, A. Woodland and urban populations of the woodpigeon Columba palumbus in the Eastern Baltic region. Ardeola 2011, 58, 315–321. [Google Scholar] [CrossRef]
  88. Jusys, V.; Karalius, S.; Raudonikis, L. Lietuvos Paukščių Pažinimo Vadovas; Lutute: Kaunas, Lietuva, 2012; ISBN 978-9955-37-144-1. [Google Scholar]
  89. Tomiałojć, L. Impact of Nest Predators on Migratory Woodpigeons Columba palumbus in Central Europe—Breeding Densities and Nesting Success in Urban Versus Natural Habitats. Acta Ornithol. 2021, 55, 139–154. [Google Scholar] [CrossRef]
  90. Svazas, S. Population status of pigeons and doves in the eastern Baltic region. Naturzale 2001, 16, 71–81. [Google Scholar]
  91. Bochio, G.M.; Anjos, L. The importance of considering bird detectability for assessing biological integrity. Nat. Conserv. 2012, 10, 72–76. [Google Scholar] [CrossRef]
  92. van Heezik, Y.; Seddon, P.J. Counting birds in urban areas: A review of methods for the estimation of abundance. In Ecology and Conservation of Birds in Urban Environments; Springer: Berlin/Heidelberg, Germany, 2017; pp. 185–207. [Google Scholar]
  93. Morelli, F.; Brlík, V.; Benedetti, Y.; Bussière, R.; Moudrá, L.; Reif, J.; Svitok, M. Detection rate of bird species and what it depends on: Tips for field surveys. Front. Ecol. Evol. 2022, 9, 671492. [Google Scholar] [CrossRef]
  94. Conway, C.J.; Gibbs, J.P. Summary of intrinsic and extrinsic factors affecting detection probability of marsh birds. Wetlands 2011, 31, 403–411. [Google Scholar] [CrossRef]
  95. Farnsworth, G.L.; Pollock, K.H.; Nichols, J.D.; Simons, T.R.; Hines, J.E.; Sauer, J.R. A removal model for estimating detection probabilities from point-count surveys. Auk 2002, 119, 414–425. [Google Scholar] [CrossRef]
  96. Heikkinen, R.K.; Luoto, M.; Virkkala, R.; Rainio, K. Effects of habitat cover, landscape structure and spatial variables on the abundance of birds in an agricultural–forest mosaic. J. Appl. Ecol. 2004, 41, 824–835. [Google Scholar] [CrossRef]
  97. Catterall, C.P.; Freeman, A.N.; Kanowski, J.; Freebody, K. Can active restoration of tropical rainforest rescue biodiversity? A case with bird community indicators. Biol. Conserv. 2012, 146, 53–61. [Google Scholar] [CrossRef]
  98. Thompson, R.; Tamayo, M.; Sigurðsson, S. Urban bird diversity: Does abundance and richness vary unexpectedly with green space attributes? J. Urban Ecol. 2022, 8, juac017. [Google Scholar] [CrossRef]
  99. Pan-European Common Bird Monitoring Scheme. 2002. Available online: https://pecbms.info/ (accessed on 13 October 2023).
  100. Blair, R.B. Land use and avian species diversity along an urban gradient. Ecol. Appl. 1996, 6, 506–519. [Google Scholar] [CrossRef]
  101. Batáry, P.; Kurucz, K.; Suarez-Rubio, M.; Chamberlain, D.E. Non-linearities in bird responses across urbanization gradients: A meta-analysis. Glob. Chang. Biol. 2018, 24, 1046–1054. [Google Scholar] [CrossRef] [PubMed]
  102. Heggie-Gracie, S.D.; Krull, C.R.; Stanley, M.C. Urban divide: Predictors of bird communities in forest fragments and the surrounding urban matrix. Emu-Austral Ornithol. 2020, 120, 333–342. [Google Scholar] [CrossRef]
Figure 1. Study areas in Lithuania and the distribution of points in Kazlų Rūda as an example. Green circles correspond to urban areas surrounded by forest, yellow circles indicate agricultural landscapes, and the red circle indicates an extensive urbanized area.
Forests 14 02119 g001
Figure 2. Cumulative species increase in different landscape types, calculated via a rarefaction analysis.
Forests 14 02119 g002
Figure 3. Species richness (left), relative abundance (center), and Shannon–Weaver diversity index (right) values per point count in urbanized landscape types (For—surrounded by forest; Agr—agricultural landscapes; Urb F—forest city parks; Urb P- parks; Urb U—highly urbanized territories), predicted using a GLMM.
Forests 14 02119 g003
Figure 4. Bird species grouped by their relative abundance in urbanized habitat types.
Forests 14 02119 g004
Table 1. Parameter estimates determined using a generalized linear mixed model (GLMM) in different types of urban landscapes.
Fixed EffectEstimate±SEp
Species richness per point
Agr10.5830.7810.001
For10.620.7780.001
Urb F9.9440.70.001
Urb P8.4280.8450.446
Urb U7.7320.4040.001
Bird relative abundance per point
Agr14.3471.1820.002
For14.0561.1520.003
Urb F14.611.040.001
Urb P11.7351.2440.347
Urb U10.4830.5890.001
Shannon–Weaver diversity index
Agr2.5560.0860.001
For2.5720.0860.001
Urb F2.4530.0860.002
Urb P2.3130.1160.395
Urb U2.2020.060.001
Table 2. Differences in species richness (R), relative abundance (A), and Shannon–Weaver diversity index (D) values between urban landscape types. Only significant (p < 0.05) relationships are presented.
Landscape TypeForAgrUrbFUrb UUrb P
For- AR A DR A D
Agr -AR A DR A D
UrbFAA-R A DR A D
Urb UR A DR A DR A D-R A D
Urb PR A DR A DR A DR A D-
Disclaimer/Publisher’s Note: The statements, opinions and data contained in all publications are solely those of the individual author(s) and contributor(s) and not of MDPI and/or the editor(s). MDPI and/or the editor(s) disclaim responsibility for any injury to people or property resulting from any ideas, methods, instructions or products referred to in the content.

