Abstract
Breeding long-lived trees is challenging, but it has been shown that genomic information can be used to improve efficiency. In this study, genomic prediction (GP) was tested on selected individuals of a two-generation breeding population of Cryptomeria japonica, the most common plantation tree in Japan. In the 1980s, the second-generation plus trees (101 clones) were selected from about 8500 individuals obtained by cross-mating the first-generation plus trees (47 clones). RAD-seq based on 8664 SNPs was used to perform GP for three important traits in this population: tree height, wood stiffness, and male flower quantity. The association between traits and genotypes was modeled using five Bayesian models whose predictive accuracy was evaluated by cross-validation, revealing that the best model differed for each trait (BRR for tree height, BayesA for wood stiffness, and BayesB for male flower quantity). GP was 1.2–16.0 times more accurate than traditional pedigree-based methods, attributed to its ability to model Mendelian sampling. However, an analysis of the effects of intergenerational kinship showed that parent–offspring relationships reduce the predictive accuracy of GP for traits strongly affected by selection pressure. Overall, these results show that GP could significantly expedite tree breeding when supported by a deep understanding of the targeted population’s genetic background.
1. Introduction
Genomic prediction (GP) is the use of large numbers of genomic markers located on the genome to construct predictive models that explain breeding values or genotypic values [1]. Breeding methods for selecting superior individuals based on GP are called genomic selection (GS) [1]. It has been used extensively in cattle breeding since 2008 [2] and subsequently in the breeding of other animals and plants [3,4]. As a result, it has drawn interest from forest geneticists and tree breeders [5,6], who have shown that GS and GP can be effectively applied to forest trees [7]. Accelerated breeding using techniques such as GS and GP is extremely valuable for conifers because they must grow for multiple decades before harvesting [8].
Several statistical methods have been recommended for use in GP modeling, and it has been suggested that the best method in any given case will depend on the genetic architecture of the trait of interest [9]. However, results from actual operations have revealed minimal differences in the predictive accuracy between GP models [10,11], and traditional pedigree-based prediction methods have been more accurate than GP in some cases [12]. Careful model selection is, therefore, essential when performing GP, and the chosen model’s ability to outperform traditional pedigree-based prediction methods is an important criterion when deciding whether to incorporate GP into a tree-breeding program.
The selection of an appropriate target population is another important issue when considering GP because kinship within the population significantly affects the technique’s predictive accuracies when applied to forest trees. This has primarily been observed in studies examining one-generation full- and half-sib populations [10,13,14]. There have been comparatively few reports on applying GP to multiple generations in forest tree breeding where generation times are long [12,15]. Even the world’s most generationally renewed conifer, Pinus taeda (for which GS has recently been introduced), has only recently entered its fourth generation of breeding [16], and C. japonica in Japan is only in its second generation [17]. Consequently, there is little information on how cross-generational kinship influences the predictive accuracy of GP in tree breeding. Furthermore, trait information is expected to be more accurate for breeding populations consisting of clonal individuals, so GP should be particularly reliable in such populations [18]. However, this expectation has not yet been tested. With the right population set-up and accurate trait information, forward selection based on GP could greatly reduce the time needed for forest tree breeding by avoiding problems resulting from long generation times.
This work investigates the potential utility of GP in C. japonica, the most important forestry tree species in Japan: it is planted widely in all parts of the country, other than Okinawa, accounting for about 44% of Japan’s planted forest area [19]. Eastern Japan is dominated by seedling forestry derived from seed gardens, while western Japan, where this study was conducted, is dominated by clonal forestry based on cuttings from scion gardens [20]. Clonal forestry has been practiced in this region for over 500 years [21], and clonal values, i.e., genotypic values, are commonly estimated in clonal test sites to select plus trees. The GP in clonal forestry targets not only the breeding value but also the clonal value of the tree intended for clone deployment [18]. An advantage of implementing GS in a cloned population lies in constructing a prediction model based on a training population with reliable clonal values derived from phenotypic data collected on the clonally replicated individuals.
This study focuses on three traits: tree height, wood stiffness, and male flower quantity. Pollen-related characteristics such as male sterility and low pollen fecundity are important breeding targets for C. japonica in Japan because allergic reactions to its pollen have recently become a severe public health problem, affecting at least 26.5% of the Japanese population according to a nationwide epidemiological survey [22]. To address this problem, forest research institutes and forestry agencies in various regions have developed and made available male sterile individuals and individuals with low pollen fertility [20,23,24]. Male flower quantity is generally assessed after 15 years or more when trees have reached maturity. GP could, therefore, greatly shorten breeding programs targeting this variable. Tree height is also an important trait because it is directly related to production. Consequently, it has been the subject of numerous GP studies [25,26]. However, tree height is also strongly influenced by the environment, making it difficult to estimate clonal values [27]. Therefore, in this study, GP was performed using clonal values calculated for populations of clones planted in multiple test sites to incorporate the effects of both microenvironmental differences within clonal test sites and macroenvironmental differences between them. Wood stiffness is another major breeding objective in tree breeding programs. The properties of wood are age dependent [28] and are generally assessed by distinguishing juvenile wood (i.e., wood from trees aged up to 15 years since planting) from mature wood. This means that many years of growth are needed to obtain reliable stiffness data. The use of GP to select trees with high wood stiffness could thus significantly accelerate C. japonica breeding programs targeting this trait.
Because parentage and sibling relationships are thought to create genetic similarities between clones and influence the accuracy of GP predictions [29], prior knowledge about the genetic relationships of the studied population is important [7,12]. There have been many reports of exogenous pollen contamination in seed orchards [30,31], and mating errors may also occur during artificial crosses. Moreover, forest tree breeding takes place over many years, so when dealing with material that was bred over 50 years ago, as in the case studied here, confirmation and correction of parentage information using DNA information is essential for efficient breeding [32].
Here, GP was tested to address three questions. First, if five Bayesian statistical methods are used to model three traits (tree height, wood stiffness, and male flower quantity), do the optimal models for each trait differ? Second, can the genomic estimated clonal value (GECV) achieve greater predictive accuracy than traditional pedigree-based prediction? Third, how does intergenerational kinship impact the accuracy of GP predictions? Answering these three questions could reveal ways to improve the accuracy of GP and thereby help to increase the efficiency of forward selection significantly.
2. Materials and Methods
2.1. Population Composed of Two Generations
The effectiveness of GP was tested in a two-generation population composed of selected individuals, which was created as follows. The first-generation (hereafter G1) plus trees consisted of 47 clones. G1 plus trees were selected mainly from planted forests in the 1950s by phenotypically comparing individual trees and selecting those with superior growth and shape around Saga Prefecture. Second-generation seedling individuals were produced from 1965 to 1972 using 26 unrelated clones from the G1 plus trees as founders with a mating design that included diallel crosses [33,34] (Figure 1). Approximately 8500 second-generation (hereafter G2) seedlings produced from about 300 combinations of parents were planted between 1969 and 1972 with lineage management. Test sites planted with G2 seedlings were established at six locations in Saga Prefecture, Japan [34]. Based on the results of a height and form survey conducted in the 1980s, when the G2 trees were approximately 10 years old, 101 individuals were selected as G2 plus trees and clonally propagated with cuttings. The G2 plus trees were selected based only on height data because equipment to measure wood stiffness in standing trees was not yet available and the pollen allergy problem was not recognized at the time.
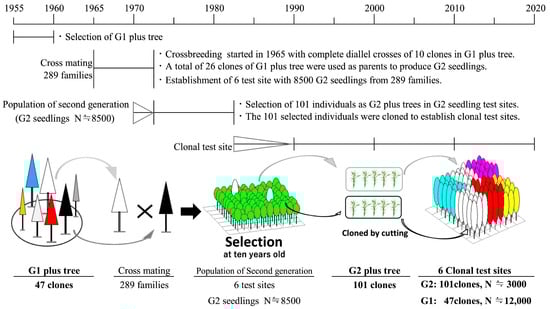
Figure 1.
History of artificial crossbreeding and selection of Cryptomeria japonica (Japanese cedar) plus trees in Saga Prefecture, Japan.
2.2. Study Sites
We studied six clonal test sites in Saga Prefecture (Site 110, Lat. 33°22′ N, Long. 130°07′ E, Elev. 600 m, planted in 1983; Site 111, Lat. 33°24′ N, Long. 130°06′ E, Elev. 550 m, planted in 1984; Site 112, Lat. 33°19′ N, Long. 130°08′ E, Elev. 500 m, planted in 1985; Site 113, Lat. 33°15′ N, Long. 129°52′ E, Elev. 250 m, planted in 1986; Site 115, Lat. 33°21′ N, Long. 130°09′ E, Elev. 580 m, planted in 1988; Site 116, Lat. 33°27′ N, Long. 130°16′ E, Elev. 500 m, planted in 1989) (Figure 2). The G2 plus trees and G1 plus trees from their parent generation were planted simultaneously at these sites, and the sites were settled based on randomized complete block designs with three replicates and multiple trees per clone. A wealth of trait data exists for the populations at each site due to the continuous research conducted over more than 30 years since their planting.
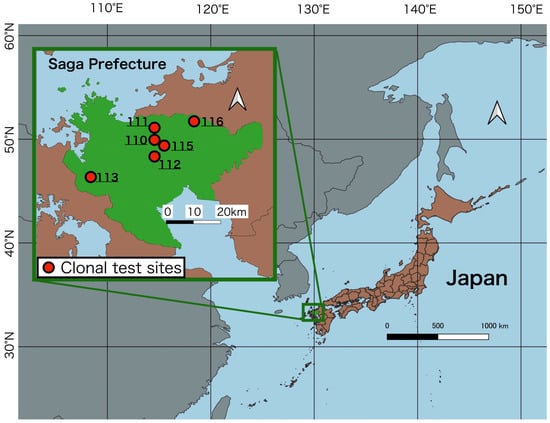
Figure 2.
Locations of the clonal test sites in Saga Prefecture, Japan.
2.3. Phenotypic Data and Clonal Values
We evaluated the predictive performance of GP for three important traits in clonally propagated G1 and G2 plus trees: tree height, wood stiffness, and male flower quantity. This study is concerned with breeding material that is actually selected for the purpose of creating suitable varieties, not just for research purposes. There are a few missing research data on the breeding process over half a century. Therefore, the number of clones subjected to GP analysis was 142 (G1:47, G2:95), 145 (G1:44, G2:101), and 148 (G1:47, G2:101) for each trait, respectively (Table 1). The reasons for the differences from the 148 (G1:47, G2:101) genotyped clones and the method used to calculate the clonal values are described below.

Table 1.
Numbers of clones and individuals surveyed and phenotyping ages used to estimate clonal values for each trait.
Tree height was evaluated when the trees were 10 years old because genetic traits are easier to assess at this stage before competition for light and other resources between individuals becomes more intense. Clonal values for 139 clones (G1:44 clones, G2:95 clones) out of a total of 148 clones (G1:47 clones, G2:101 clones) were calculated using the best linear unbiased prediction (BLUP) method [35] based on the corrected tree heights. No data or published scores for 6 of the 101 G2 clones, which were therefore excluded from the analysis. Corrections for tree height were performed by calculating spatial correlation residuals from the tree height and tree location maps (Figure S1) representing a total of 14,918 individuals (range: 5–735 individuals per clone) in the 6 clonal test sites (Tables S1 and S2). The corrected tree heights were then used to calculate clonal values using the BLUP method, with the effect of each site on tree height as a fixed effect. These calculations were performed in the breedR-package [36,37] of the R platform [38], in which the autoregressive AR model for spatial analysis [39] was implemented. Three of the 47 G1 clones were not planted in the clonal test sites but already have published scores [40]. Therefore, the published scores for these clones were converted to clonal values (see details in Supplementary Materials S1 and Table S2).
Wood stiffness was assessed in two surveys: (1) a survey of lumber from trees over 30 years old using a fast Fourier transform (FFT) analyzer (RION, Tokyo, Japan) and (2) standing tree surveys using a TreeSonic timer (FAKOPP, Sopron, Hungary) or a Fakopp ultrasonic timer (FAKOPP, Sopron, Hungary). The lumber surveys provided the most reliable stiffness data because they examined trees over 30 years old, and the wood properties of timber change when a tree goes from juvenile (aged 0 to 15 years) to mature (over 15 years old). However, due to the high cost of surveys, only 73 clones (G1: 27 clones, G2: 46 clones) out of a total of 148 clones were examined in the lumber survey, and another 72 (G1: 17 clones, G2: 55 clones) were included in the standing tree survey (Tables S1 and S3). The remaining three clones of the 47 G1 clones were not present at the clonal test sites and were excluded from the survey. The lumber surveys were performed as follows. First, logs taken from standing trees at 0.4–2.4 m above ground level after stress wave times were measured with a TreeSonic timer. Lumber (dimensions: 2000 mm × 38 mm × 89 mm) was then obtained by cutting each log outwards sequentially from both sides across the pith (Figure S2). After drying, the dynamic Young’s modulus of the lumber was measured using an FFT analyzer. In total, 1403 pieces of lumber (4–63 per clone) were measured in this way. For each log, the two pieces of lumber touching the pith (779 pieces in total) were classified as juvenile timber, and the outer timber (624 pieces) was classified as mature lumber. Clonal values for wood stiffness were then calculated using the BLUP method [35] with two fixed effects: the juvenile/mature status of the lumber and its average annual ring width. This calculation was performed using rstan version 2.21.2 [41] on the R platform [38], which enables efficient calculations. The wood stiffness of the 72 clones not included in the lumber survey was determined in standing tree surveys (see details in Supplementary Materials S2 and Table S3).
Male flower quantity in the G1 generation (47 clones) was assessed using published scores calculated on the basis of field research conducted between 1988 and 1997 [40]. For the G2 generation (101 clones), data from field research conducted between 2008 and 2013 was used instead (Tables S1 and S4). Due to the large annual variation in male flower quantity, surveys were conducted over six to nine years in G1 and four to six years in G2 on mature individuals over 15 years of age. Although the survey periods differed, both field surveys were conducted using the same methodology. As described by Toda et al. [42], the distribution of male flower setting was evaluated using a six-point scale based on observations of the canopy surface. This scale has the following possible scores: 0: no male flowers; 1: a few male flowers; 2: a low number of male flowering branches or low number of male flowers on some branches; 3: a moderate number of male flowering branches or degree of male flowering; 4: almost all branches have a significant amount of male flowers, or some branches have a large amount of male flowers; 5: the entire canopy is covered with a large amount of male flowers. The raw observed data for the clonal test site were used to calculate clonal values for the male flower quantity of each G2 clone were calculated using the BLUP method [35] as implemented in rstan version 2.21.2 [41] on the R platform [38], with the year of measurement as a fixed effect. Conversely, the clonal values for the G1 clones were derived from their published scores (see details in Supplementary Materials S3 and Table S4).
2.4. Genotype Data and SNP Discovery
DNA was extracted from one individual from each of the 148 clones included in the study. Total genomic DNA was extracted from 100 mg of each sample using the DNeasy Plant Mini Kit (Qiagen, Hilden, Germany). The concentration of extracted DNA was quantified using the QubitTM dsDNA Broad Range Assay Kit (Thermo Fisher Scientific, Waltham, MA, USA). Double digest restriction site-associated DNA sequencing (ddRADseq) libraries were prepared as previously described [43]. Briefly, genomic DNAs were double digested using PstI and Sau3AI restriction endonucleases (Invitrogen, Waltham, MA, USA), ligated with Y-shaped adaptors, and amplified using PCR with KAPA HiFi polymerase (KAPA BIOSYSTEMS, Boston, MA, USA).
After PCR amplification with adapter-specific primer pairs (Access Array Barcode Library for Illumina, Fluidigm, South San Francisco, CA, USA), an equal amount of DNA from each sample was mixed and size-selected with BluePippin 2% agarose gel (Sage Science, Beverly, MA, USA). Approximately 450 bp library fragments were retrieved. The quality of the library was checked using KAPA Library Quantification Kits on a LightCycler 480 Instrument (Roche, Basel, Switzerland). Finally, nucleotide sequence libraries were sequenced using a high-throughput Illumina Hi-Seq X Ten platform (Macrogen, Inc., Seoul, Republic of Korea) to generate 150 bp long paired-end reads.
All individuals genotyped in this work were sequenced using the Illumina Hi-Seq X Ten platform. The resulting raw reads were processed using the dDocent v.2.9.4 pipeline [44] followed by quality trimming (Trimmomatic v.0.33) [45], de novo assembly to create reference reads (CD-HIT v.4.6.6), read mapping (BWA mem v.0.7.12) [46], and SNP calling (FreeBayes v.0.9.20) [47]. Filtering was performed using VCFtools [48], and finally, unnatural SNPs were removed based on the parent–offspring relationships described in the available breeding records based on microsatellite markers.
2.5. SNP-Based Pedigree Reconfirmation in Tree Breeding Programs
This study reconfirmed breeding records by paternity testing using CERVUS v.3.0 [49,50] based on SNP data from 900 randomly selected loci. First, G2 clones (101 clones) with records of artificial mating were assumed to have no records. Next, paternity testing was performed using CERVUS with all G1 clones (47 clones) as candidate parents. CERVUS is a pairwise likelihood comparison approach that calculates likelihood scores for each candidate parent–offspring pair. A “parent pair-sexes unknown” analysis was performed in CERVUS to find the most likely female and male parents for each offspring; parentage was considered confirmed if the LOD score was positive with an allele mismatch percentage below 1%. For paternal assignments, we determined significance using the delta score, which is the difference in LOD scores between the most likely and second most likely candidate parent pairs. The critical delta score to assign parentage with 95% confidence was determined by simulating 10,000 offspring, assuming that the genotyping error rate was 1% and about 50% of candidate parents were sampled.
2.6. Pedigree-Based Prediction Using Mid-Parent Values
In the traditional pedigree-based approach, the clonal values of G2 clones are predicted to equal the mean of the parental breeding values. Therefore, in the absence of phenotype data, this approach predicts the same clonal value (known as the mid-parent value) for all offspring within a full-sib family [51]. The predicted clonal value of the offspring is obtained from the mean of the parental breeding values for the G1 trees. This would require phenotypic data of the complete set of 8500 G2 seedlings tested. However, the seedling population has now been drastically reduced, and parental information could not be recovered. Because the recent research in C. japonica breeding has shown that clonal value could potentially be used as a proxy for the breeding value [52], the present study utilized the parental clonal value for the prediction of the clonal value of the offspring. To obtain the mid-parent value, the parents and their clonal values for the traits of interest must be known. A total of 87 of the G2 clones satisfied these requirements for tree height, 72 for wood stiffness, and 92 for male flower quantity. Predictive accuracy based on pedigree relationships in G2 clones was determined by calculating the Pearson’s correlation coefficient between the mid-parent value and the actual clonal value.
2.7. Bayesian GP Models and Genome Estimated Clonal Values (GECVs)
GECVs were obtained using five different Bayesian genome-wide regression models for the three traits of interest. These models were designated BayesA, BayesB, BayesCπ, Bayesian lasso (BL), and Bayesian ridge regression (BRR). All of them were implemented in the BGLR package [53,54] of the R platform [38].
To estimate the parameters of each model, 200,000 MCMC iterations were performed with a burn-in period of 50,000 cycles, retaining every fifth sample. Five-fold cross-validation was then used to evaluate each model’s predictive accuracy. Finally, each model’s GP accuracy was determined by calculating the Pearson’s correlation coefficient between the GECVs and the corresponding clonal values.
2.8. Cross-Validation Sampling Methods and Prediction Accuracy
The accuracies of the statistical models were compared using two methods. First, all clones were split into five sets for 5-fold cross-validation. Random sampling of the G1 and G2 clones was used to ensure that both G1 and G2 clones were represented in each set. In detail, since there are 142–148 clones (tree height: 142 clones, wood stiffness: 145 clones, male flower quantity: 148 clones) in total, each of the five sets consisted of 28–30 clones, and cross-validation was performed by about 120 clones for training and about 30 clones for validation.
Second, to investigate the impact of intergenerational kinship on predictive accuracy, the G1 clones were divided into two groups: “G1_parent”, comprising parent of G2 clones, and “G1_unrelated”, comprising clones with no offspring in G2. Each G1 group was then combined with the full set of G2 clones to form two groups, one containing parents and their offspring (G1_parent + G2) and the other with no parental relationships (G1_unrelated + G2). We next performed 5-fold cross-validation within the groups after randomly dividing each group into five sets as in the first method. The GP accuracy of difference sampling was determined by calculating the Pearson’s correlations between the GECVs and the clonal values obtained by cross-validation sampling. For each trait, the model found to have the highest predictive accuracy when using the first method (which neglects intergenerational relationships) was then tested for predictive accuracy in the second method (which incorporates the effects of intergenerational relationships).
3. Results
3.1. Relationships between Phenotypic Traits
Figure 3 shows the comparison of clonal values between generations in each trait and the correlations between the clonal values for tree height, wood stiffness, and male flower quantity. For tree height, the clonal value of G2 significantly exceeded that of G1 (t = −10.4, p = 2.2e − 16). However, there were no significant intergenerational differences in wood stiffness (t = −0.08, p = 0.93, ns) or male flower quantity (t = −1.71, p = 0.09, ns). The Pearson’s correlation coefficients between the traits revealed weak correlations between tree height and wood stiffness (r = 0.24, p < 0.05) and between tree height and male flower quantity (r = 0.28, p < 0.01). There was no correlation between wood stiffness and male flower quantity (r = 0.12, p = 0.17, ns).
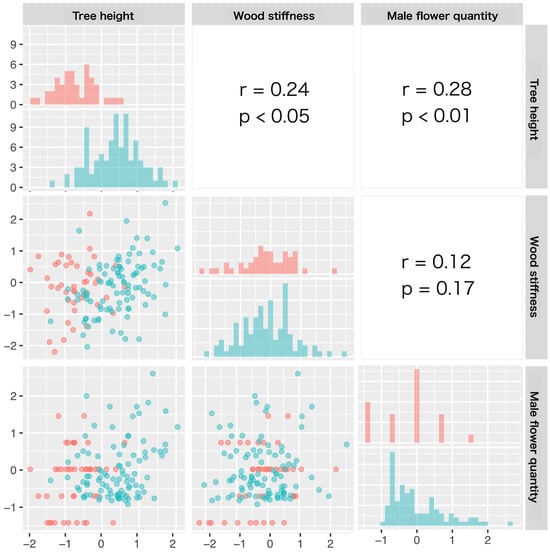
Figure 3.
Scatter plots (lower diagonal), histograms (diagonal), and correlations (upper diagonal) showing the relationships between the clonal values for tree height, wood stiffness, and male flower quantity. Data for G1 and G2 clones are shown in pink and blue, respectively. Correlations in the figure are between traits considering all data (G1 and G2 combined).
3.2. Genotypic Data and SNP Discovery
Sequencing was performed successfully for every sampled individual from the 148 clones using the Illumina Hi-Seq X Ten platform. A total of 904 million reads (904,372,436 reads) corresponding to 79.86 Gb of sequence data were obtained, with an average of 6.11 million reads (6,110,625 reads) per sample. The raw reads were subjected to quality trimming, de novo assembly to create reference reads, and read mapping before SNP calling. The first filtering step using VCFtools enabled successful genotyping of over 50% of the sampled individuals using the following settings: maximum missing parameter = 0.5, minimum number of alleles = 3 (mac 3), minimum quality score = 30 (minQ 30), and minimum sequencing depth per SNP and individual = 3 (minDP3). After this process, 70,743 SNPs were retained as genotypic differences for GP analysis.
To maximize the number of individuals and loci in the final dataset, filtering was performed by applying the following criteria: calling rate > 95%, minor allele frequency (MAF) < 0.05, and minDP < 20. This reduced the total number of SNPs to 23,847. Filtering loci by heterozygous allele balance and the proportion of individual missing data per locus then reduced the total number of SNPs to 10,578. Finally, in 1914, unnatural SNPs were removed based on the parent–offspring relationships described in the breeding records, resulting in a total of 8664 SNPs retained for GP analysis.
3.3. Pedigree Reconfirmation
Parentage information for 101 clones in G2 was checked using CERVUS v.3.0 (Table S5). Among the 202 parents of the 101 G2 clones, nine could not be assigned to any of the 47 G1 clones used as candidate parents. All of the remaining 193 parents were successfully assigned to a G1 clone (Figure 4a).
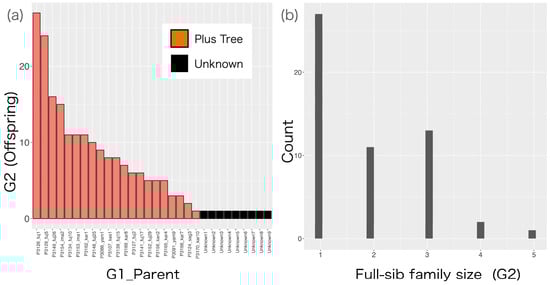
Figure 4.
(a) Number of offspring in G2 per parent (G1_Parent). G1_Parent clones labeled “unknown” on the x-axis represent parents who were not assigned to any G1 clone by the CERVUS v.3.0 software. (b) Histogram of full-sib family size in G2.
As regards the pedigree relationships between G1 and G2, 21 G1 clones were parents of G2 clones, and the parent with the most offspring had 28 G2 clones (mean = 9.19 clones). The most frequent full-sib family size was three (13 full-sib families), and there were 28 clones with no full-sibs (Figure 4b).
3.4. Genomic Prediction and Comparison of Models for the Three Traits
The predictive accuracies of the statistical models used for GP were compared for each of the three traits of interest (Table 2 and Table S6). The lowest predictive accuracy was achieved for male flower quantity: the predictive accuracy for this trait was lower than that for tree height by 0.06–0.15 and that for wood stiffness by 0.05–0.11. The models with the highest predictive accuracy for each trait differed: BRR was most accurate for tree height (r = 0.60), BayesA for wood stiffness (r = 0.57), and BayesB for male flower quantity (r = 0.48).
Table 2.
Predictive accuracies achieved using genomic data (5 methods) and pedigree data (mid-parent values).
3.5. GECVs vs. Pedigree-Based Prediction Using the Mid-Parent Value
GECVs achieved greater predictive accuracy than the traditional approach using the mid-parent value for all traits (Figure 5, Table 2). This outcome was especially pronounced for tree height and male flower quantity: the predictive accuracy of GP exceeded that of the pedigree-based approach by 0.37–0.45 and 0.42–0.45, respectively, for these two traits.
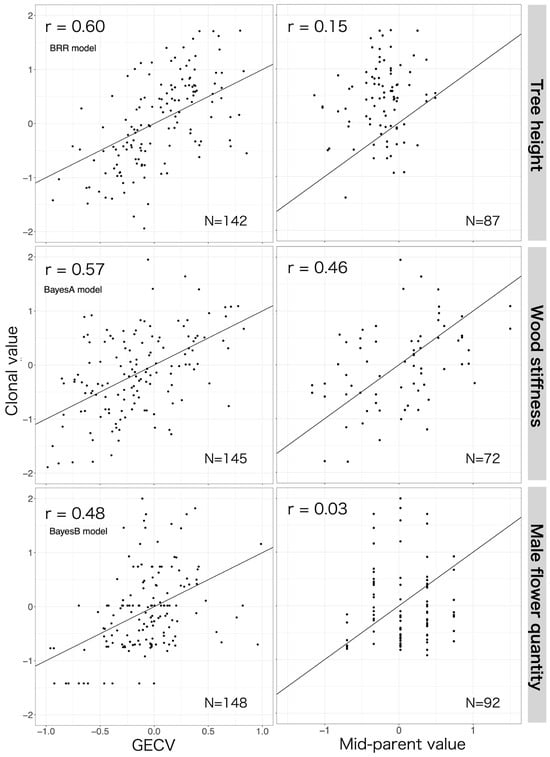
Figure 5.
The predictive accuracy (r) of genomic estimated clonal values (GECVs) (left figure) and the mid-parent value, i.e., the mean of the clonal values of the two parents (right figure). The line y = x is plotted in black. The GECVs for each trait were calculated using the model shown to be most accurate for that trait by cross-validation, i.e., BRR for tree height, BayesA for wood stiffness, and BayesB for male flower quantity (see Table 2). The values on the x-axis are the same for all upper graphs, and the y-axis is also the same on the left and right. The GECV in the left graph includes the first generation in the prediction due to cross-validation. The graph on the right only includes the second generation as a predictor.
The relationship between the GECV and the mid-parent value based on full-sib families with three or more siblings is shown in Figure 6. Traditional pedigree-based methods rely on averaging the clonal values of the parents and thus produce a single predicted value for all siblings, whereas the genomic marker-based GECV generates unique predictions for each sibling.
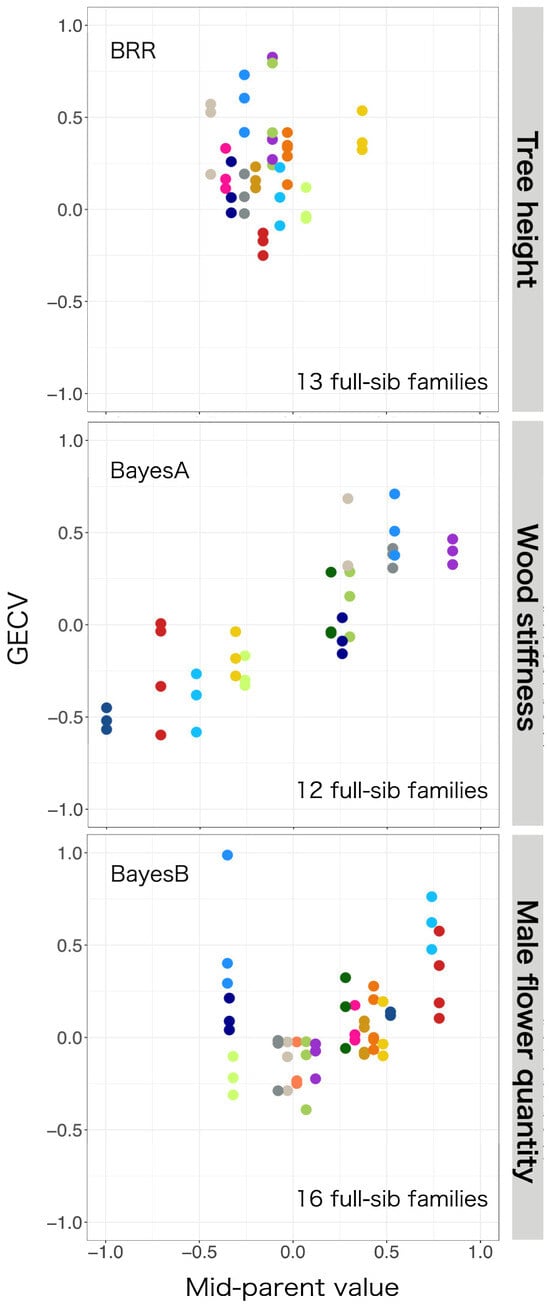
Figure 6.
Scatter plots of genomic estimated clonal values (GECVs) and predictions based on pedigree (mid-parent value) for tree height (top), wood stiffness (middle), and male flower quantity (bottom) in clones from different full-sib families. GECVs based on genomic prediction are plotted on the vertical axis, and pedigree-based mid-parent values are plotted on the horizontal axis. Results for full-sibs from the same family are plotted in the same color circles. The mid-parent values of full-sibs are expected to be identical, whereas the GECVs of full-sibs are unique. The most accurate models for each phenotype were used (see Table 2).
3.6. Impact of Intergenerational Relationships
Predictive accuracy was determined for a parent–offspring group (G1_parent + G2) and a group without parental relationships (G1_unrelated + G2) (Table 3 and Table S7). Tree height and male flower quantity were predicted more accurately (by 0.21 and 0.15, respectively) for the groups without parental relationships (G1_unrelated + G2). Conversely, wood stiffness was predicted more accurately (by 0.05) for the parent–offspring group (G1_parent + G2).
Table 3.
Impact of intergenerational kinship on the accuracy of genomic prediction.
4. Discussion
4.1. Impact of Selection on the Three Traits
With regards to tree height, the clonal value for G2 determined in the clonal test site exceeded that for G1, demonstrating the effect of selecting G2 plus trees from a seedling population of about 8500 individuals based on height measurements at a tree age of approximately 10 years. However, the intergenerational comparison revealed no effect of selection on wood stiffness or male flower quantity.
The GP results for tree height constitute one of this work’s most important contributions because there are few reported examples of GP being applied to trees from two-generation clonal populations [12] and none where the populations were subjected to intense selection between generations.
4.2. Most Accurate GP Models for the Three Traits
The finding that the optimal prediction models for each trait differed may indicate that the relationship between traits and genetic information is trait dependent [9]. The fact that the BRR model most accurately predicted tree height is consistent with previous reports that this trait is influenced by many weakly effective loci [10,54]. As wood stiffness is said to be heritable [55], it was expected to be most accurately predicted by the BayesA model [1,56]. Male flower quantity was predicted most accurately by the BayesB model, which may suggest that it is controlled by a small number of loci, unlike the other two traits [4,57]. The maximum differences in prediction accuracy among the models were 0.08, 0.07, and 0.03 in tree height, wood stiffness, and male flower quantity, respectively. In summary, selecting the appropriate model for the trait of interest seems to be important for improving predictive accuracy when using GP, although the differences between models were often small [10,11]. At present, it may be best to compare the accuracy of several GP models for different traits before choosing a model to adopt.
4.3. GP vs. Pedigree-Based Prediction
The GECV had a higher predictive accuracy than the mid-parent value, suggesting that it can be a more effective breeding tool than prediction based on pedigree data [8,9]. This may be because the G2 plus trees examined in this work were from a population of full- and half-sibs with strong kinship, which should enhance the predictive accuracy of GP [13,14,58].
Furthermore, the traditional pedigree-based approach using mid-parent values provides a single prediction for all full-sibs within a family [51], whereas the marker-based GECV generates unique predictions for each full-sib. This could be taken to mean that GP models the phenomenon of Mendelian segregation [59]. If GP can correctly capture the Mendelian sampling effect, it could significantly improve the outcomes of breeding programs while also reducing the time needed for forward selection [7,8].
4.4. Impact of Across Generations
Contrary to expectations, wood stiffness was the only trait more accurately predicted in the group with parent–offspring relationships. Wood stiffness shows a high heritability [55], which increases the predictive accuracy of GP [56]. In other words, wood stiffness is an easy trait to predict from parental information. Therefore, accurate evaluation of parental clonal values for this trait is important for efficient breeding.
Conversely, tree height was predicted more accurately for the groups without parent–offspring relationships. This trait was subject to intense selection pressure when the G2 plus trees were selected from the population of G1 offspring, which would not be a problem if GP only detected associations with specific loci associated with trait information. However, in reality, it also uses associations with pedigree information, which affects predictive accuracy [29]. Hence, when targeting a population that has been selected and is expected to be strongly affected by dominance and epistatic components of non-additive effects, the kinship between the training and predicted populations should be considered [59]. Furthermore, the use of a GP model including these non-additive effects is reported to improve the accuracy of predictions [60,61].
Male flower quantity in C. japonica is a highly heritable trait [62] that is more easily predicted by GP than tree height or material quality [17]. However, the present results show that male flower quantity was more accurately predicted in the group without parent–offspring relationships between generations, even though this trait was not subjected to anthropogenic selection pressure. These discrepancies may be due to limitations on the accuracy of the clonal values based on field survey data. Male flower quantity differs from other traits in that it requires continuous surveys over multiple years to accurately determine each tree’s potential for male flower production, and the survey results used in this work were based on observations made over different periods for different groups (G1: 1988~1997, G2: 2008~2013). In addition, this trait is difficult to measure and is most accurately measured when surveyed by multiple people [63]. The correlation between clonal values and mid-parent values was also low for male flower quantity. Therefore, certain full-sib families have unnaturally large deviations from the relationship between the GECV and mid-parent value (for example, the full-sibs in the bottom row of Figure 6, which had the highest GECV for this trait but the lowest mid-parent value) should be re-examined to identify potential assessment errors. Much of the discussion about GP has focused on the benefits of using the vast quantities of genetic information provided by NGS technologies, but it is important to recall that it is also fundamentally dependent on reliable trait information, so compiling accurate trait information remains as important as ever [64]. One benefit of using GP is that it can reveal anomalies in trait information such as those mentioned above.
4.5. Application of Genomic Prediction in C. japonica Breeding
We found that prediction of phenotypic traits (tree height, wood stiffness, male flower quantity) using genome-wide SNPs from clonal tests was more accurate than traditional pedigree-based prediction. This suggests that GP can improve the breeding efficiency of C. japonica by applying the clonal test results. This indicates that the clonal test would be essential in clonal forestry areas. Furthermore, the clonal tests could provide early validation of GP results by analyzing juvenile–mature correlations and environmental effects based on data from first- and second-generation clonal test sites beyond 30 years of age. The combination of traditional clonal tests with the new technology of GP would set the standard for C. japonica breeding, as it would save a great deal of time and cost while at the same time increasing the accuracy of the tests.
5. Conclusions
This study underscores the potential of genomic prediction (GP) in enhancing C. japonica breeding programs, especially with cloned populations. Key findings include: (1) GP consistently outperforms traditional pedigree-based predictive methods, especially when equipped with precise trait and pedigree data from clonal testing. (2) The enhanced accuracy of GP is largely due to its proficiency in capturing Mendelian sampling effects. (3) Implementing forward selection based on GECVs can address challenges in forest tree breeding arising from their extended lifespans and the time lag in trait measurement across generations. (4) While our research spotlights the merits of using GP across two generations, it also highlights potential pitfalls. Specifically, while DNA encodes both traits and pedigree information, ensuring continuity across generations, the parent–offspring kinship can reduce prediction accuracy under selective breeding conditions. (5) In summation, GP emerges as a promising tool for forest tree breeding, provided predictions are astutely validated and interpreted considering the genetic backdrop and trait specifics of the targeted population.
Supplementary Materials
The following supporting information can be downloaded at: https://www.mdpi.com/article/10.3390/f14102097/s1, Supplementary Materials S1: Method of deriving clonal values for trait of tree height. Supplementary Materials S2: Method of deriving clonal values for trait of wood stiffness. Supplementary Materials S3: Method of deriving clonal values for trait of male flower quantity. Figure S1: (a) Tree height at age 10 years in the clonal test site, (b) Spatial autocorrelation residuals. Background maps are red relief image maps. Figure S2: Methods for measuring the wood stiffness of lumber products (2000 × 38 × 89 mm) using FFT analyzer. Table S1: Numbers of clones and individuals surveyed and phenotyping ages used to estimate clonal values for each trait. Table S2: Numbers of individuals and mean tree heights in 6 clonal test sites used to calculate clonal values for tree height. Table S3: Number of individuals or lumber pieces and mean values per clone used to calculate clonal values for wood stiffness. Table S4: Numbers of individuals and mean male flower index survey scores per clone used to calculate clonal values for male flower quantity. Table S5: Results of a parent–child analysis performed with Cervus 3.0 using 900 SNPS markers. Table S6: Five-fold cross-validation test results for the population consisting of G1 and G2. Table S7: (a) Five-fold cross-validation test results for the population consisting of G1_parent and G2, (b) Five-fold cross-validation test results for the population consisting of G1_unrelated and G2.
Author Contributions
Conceptualization, A.E. and Y.T.; sequencing and SNP genotyping, K.U. and A.E.; pedigree reconfirmation, A.E.; tree height analysis, A.E.; wood stiffness analysis, A.E.; male flower quantity analysis, A.E.; genomic prediction, H.M., K.U. and A.E.; writing—original draft preparation, A.E.; writing—review and editing, K.U., H.M. and Y.T. All authors have read and agreed to the published version of the manuscript.
Funding
This work was partly supported by the Agriculture, Forestry and Fisheries Research Council of Japan (no. 18064868) and the JSPS KAKENHI program (grant no. 21H02240).
Data Availability Statement
Data is contained within the article or Supplementary Materials.
Acknowledgments
We would like to acknowledge D. Hayashizaki, Y. Tara, T. Moriguchi, and the other members of Saga Prefectural Forest Experimental Station for their assistance with field investigations and laboratory experiments. We are also grateful to E. Fukatsu at the Forest Tree Breeding Center of the Forestry Forest Products Research Institute (FFPRI) for teaching us about the fundamentals of forest tree breeding: pedigree reconstruction, trait evaluation by BLUP, and spatial analysis. We additionally thank K. Nakao at Kansai Research Center, FFPRI, for his support when conducting GIS, as well as Y. Ikami and H. Ido at FFPRI for guidance on measuring wood stiffness. Finally, we thank the late N. Hara, who created the breeding material for this study over half a century ago, and many other senior colleagues who have managed the breeding material in the intervening years.
Conflicts of Interest
The authors declare no conflict of interest.
References
- Meuwissen, T.H.E.; Hayes, B.; Goddard, M. Prediction of total genetic value using genome-wide dense marker maps. Genetics 2001, 157, 1819–1829. [Google Scholar] [CrossRef]
- VanRaden, P.M.; Van Tassell, C.P.; Wiggans, G.R.; Sonstegard, T.S.; Schnabel, R.D.; Taylor, J.F.; Schenkel, F. Invited review: Reliability of genomic predictions for North American Holstein bulls. J. Dairy Sci. 2009, 92, 16–24. [Google Scholar] [CrossRef]
- Kranis, A.; Gheyas, A.A.; Boschiero, C.; Turner, F.; Yu, L.; Smith, S.; Talbot, R.; Pirani, A.; Brew, F.; Kaiser, P.; et al. Development of a high density 600K SNP genotyping array for chicken. BMC Genom. 2013, 14, 59. [Google Scholar] [CrossRef] [PubMed]
- Jannink, J.-L.; Lorenz, A.J.; Iwata, H. Genomic selection in plant breeding: From theory to practice. Brief. Funct. Genom. 2010, 9, 166–177. [Google Scholar] [CrossRef]
- Grattapaglia, D.; Resende, M.D. Genomic selection in forest tree breeding. Tree Genet. Genomes 2011, 7, 241–255. [Google Scholar] [CrossRef]
- Iwata, H.; Hayashi, T.; Tsumura, Y. Prospects for genomic selection in conifer breeding: A simulation study of Cryptomeria japonica. Tree Genet. Genomes 2011, 7, 747–758. [Google Scholar] [CrossRef]
- Isik, F. Genomic selection in forest tree breeding: The concept and an outlook to the future. New For. 2014, 45, 379–401. [Google Scholar] [CrossRef]
- Lenz, P.R.N.; Nadeau, S.; Azaiez, A.; Gerardi, S.; Deslauriers, M.; Perron, M.; Isabel, N.; Beaulieu, J.; Bousquet, J. Genomic prediction for hastening and improving efficiency of forward selection in conifer polycross mating designs: An example from white spruce. Heredity 2020, 124, 562–578. [Google Scholar] [CrossRef] [PubMed]
- Kainer, D.; Stone, E.A.; Padovan, A.; Foley, W.J.; Külheim, C. Accuracy of genomic prediction for foliar terpene traits in Eucalyptus polybractea. G3 Genes Genomes Genet. 2018, 8, 2573–2583. [Google Scholar] [CrossRef]
- Ratcliffe, B.; El-Dien, O.G.; Klápště, J.; Porth, I.; Chen, C.; Jaquish, B.; El-Kassaby, Y.A. A comparison of genomic selection models across time in interior spruce (Picea engelmannii × glauca) using unordered SNP imputation methods. Heredity 2015, 115, 547. [Google Scholar] [CrossRef]
- Thistlethwaite, F.R.; Ratcliffe, B.; Klápště, J.; Porth, I.; Chen, C.; Stoehr, M.U.; El-Kassaby, Y.A. Genomic prediction accuracies in space and time for height and wood density of Douglas-fir using exome capture as the genotyping platform. BMC Genom. 2017, 18, 930. [Google Scholar] [CrossRef] [PubMed]
- Bartholome, J.; Van Heerwaarden, J.; Isik, F.; Boury, C.; Vidal, M.; Plomion, C.; Bouffier, L. Performance of genomic predictionwithin and across generations in maritime pine. BMC Genom. 2016, 17, 604. [Google Scholar] [CrossRef] [PubMed]
- Beaulieu, J.; Doerksen, T.; Clément, S.; MacKay, J.; Bousquet, J. Accuracy of genomic selection models in a large population of open-pollinated families in white spruce. Heredity 2014, 113, 343. [Google Scholar] [CrossRef] [PubMed]
- Lenz, P.R.; Beaulieu, J.; Mansfield, S.D.; Clément, S.; Desponts, M.; Bousquet, J. Factors affecting the accuracy of genomic selection for growth and wood quality traits in an advanced-breeding population of black spruce (Picea mariana). BMC Genom. 2017, 18, 335. [Google Scholar] [CrossRef]
- Isik, F.; Bartholomé, J.; Farjat, A.; Chancerel, E.; Raffin, A.; Sanchez, L.; Plomion, C.; Bouffier, L. Genomic selection in maritime pine. Plant Sci. 2016, 242, 108–119. [Google Scholar] [CrossRef]
- North Carolina State University Cooperative Tree Improvement Program [NCSUCTIP]. 66st Annual Report, North Carolina State University Cooperative Tree Improvement Program. Department of Forestry and Environmental Resources, 2022. Available online: https://www.treeimprovement.org/annual-reports/files/AR66 (accessed on 30 December 2022).
- Hiraoka, Y.; Fukatsu, E.; Mishima, K.; Hirao, T.; Teshima, K.M.; Tamura, M.; Tsubomura, M.; Iki, T.; Kurita, M.; Takahasi, M. Potential of genome-wide studies in unrelated plus trees of a coniferous species, Cryptomeria japonica (Japanese cedar). Front. Plant Sci. 2018, 9, 1322. [Google Scholar] [CrossRef]
- Grattapaglia, D. Twelve Years into Genomic Selection in Forest Trees: Climbing the Slope of Enlightenment of Marker Assisted Tree Breeding. Forests 2022, 13, 1554. [Google Scholar] [CrossRef]
- Tsumura, Y. Cryptomeria. In Wild Crop Relatives: Genomics and Breeding Resources, Forest Trees; Kole, C., Ed.; Springer: Berlin/Heidelberg, Germany, 2011; pp. 49–64. [Google Scholar]
- Takahashi, M.; Miura, M.; Fukatsu, E.; Hiraoka, Y.; Kurita, M. Research and project activities for breeding of Cryptomeria japonica D. Don in Japan. J. For. Res. 2023, 28, 83–97. [Google Scholar] [CrossRef]
- Ohba, K. Clonal forestry with sugi (Cryptomeria japonica). In Clonal Forestry; Ahuja, M.R., Libby, W.J., Eds.; Conservation and application; Springer: Berlin/Heidelberg, Germany, 1993; Volume II, pp. 66–90. [Google Scholar]
- Nakae, K.; Baba, K. Update on epidemiology of pollinosis in Japan: Changes over the last 10 years. Clin. Exp. Allergy Rev. 2010, 10, 2–7. [Google Scholar] [CrossRef]
- Saito, M. Breeding strategy for the pollinosis preventive cultivars of Cryptomeria japonica D. Don. J. Jpn. For. Soc. 2010, 92, 316–323, (In Japanese with English Summary). [Google Scholar] [CrossRef]
- Hasegawa, Y.; Ueno, S.; Wei, F.J.; Matsumoto, A.; Uchiyama, K.; Ujino-Ihara, T.; Hakamata, T.; Fujino, T.; Kasahara, M.; Bino, T.; et al. Identification and genetic diversity analysis of a male-sterile gene (MS1) in Japanese cedar (Cryptomeria japonica D. Don). Sci. Rep. 2021, 11, 1496. [Google Scholar] [CrossRef] [PubMed]
- Grattapaglia, D.; Silva-Junior, O.B.; Resende, R.T.; Cappa, E.P.; Muller, B.S.F.; Tan, B.Y.; Isik, F.; Ratcliffe, B.; El-Kassaby, Y.A. Quantitative Genetics and Genomics Converge to Accelerate Forest Tree Breeding. Front. Plant Sci. 2018, 9, 1693. [Google Scholar] [CrossRef]
- Calleja-Rodriguez, A.; Pan, J.; Funda, T.; Chen, Z.; Baison, J.; Isik, F.; Abrahamsson, S.; Wu, H.X. Evaluation of the efficiency of genomic versus pedigree predictions for growth and wood quality traits in Scots pine. BMC Genom. 2020, 21, 796. [Google Scholar] [CrossRef] [PubMed]
- Fukatsu, E.; Hiraoka, Y.; Kuramoto, N.; Yamata, H.; Takahashi, M. Effectiveness of spatial analysis in Cryptomeria japonica D. Don (sugi) forward selection revealed by validation using progeny and clonal tests. Ann. For. Sci. 2018, 75, 96. [Google Scholar] [CrossRef]
- Ishiguri, F.; Kawashima, M.; Iizuka, K.; Yokota, S.; Yoshizawa, N. Relationship between stress-wave velocity of standing tree and wood quality in 27-year-old Hinoki (Chamaecyparis obtusa Endl.). J. Soc. Mat. Sci. Japan 2006, 55, 576–582, (In Japanese with English Summary). [Google Scholar] [CrossRef][Green Version]
- Habier, D.; Fernando, R.L.; Dekkers, J.C.M. The impact of genetic relationship information on genome-assisted breeding values. Genetics 2007, 177, 2389–2397. [Google Scholar] [CrossRef]
- Moriguchi, Y.; Tani, N.; Itoo, S.; Kanehira, F.; Tanaka, K.; Yomogida, H.; Taira, H.; Tsumura, Y. Gene flow and mating system in five Cryptomeria japonica D. Don seed orchards as revealed by analysis of microsatellite markers. Tree Genet. Genomes 2005, 1, 174–183. [Google Scholar] [CrossRef]
- Moriguchi, Y.; Yomogida, H.; Iwata, H.; Takahashi, M.; Taira, H.; Tsumura, Y. Paternity analysis in a progeny test of Cryptomeria japonica revealed adverse effects of pollen contamination from outside seed orchards on morphological traits. Tree Genet. Genomes 2011, 7, 1089–1097. [Google Scholar] [CrossRef]
- Tsumura, Y. Utilization of microsatellite marker for genetic and breeding studies in forest tree species. J. Jpn. For. Soc. 2004, 86, 184–190, (In Japanese with English Summary). [Google Scholar]
- Hara, N. Annual Report in 1964, Artificial Crossbreeding Trials of Plus Trees; Saga Prefectural Forest Experimental Station: Saga, Japan, 1965; pp. 6–8. (In Japanese) [Google Scholar]
- Yamaguchi, N.; Hara, N. Annual report in 1971, Field Adaptation Trials of Second Generation of Plus Trees; Saga Prefectural Forest Experimental Station: Saga, Japan, 1972; pp. 36–49. (In Japanese) [Google Scholar]
- Robinson, G.K. That BLUP is a good thing: The estimation of random effects. Stat. Sci. 1991, 6, 15–32. [Google Scholar]
- Mori, H.; Ueno, S.; Ujino-Ihara, T.; Fujiwara, T.; Yamashita, K.; Kanetani, S.; Endo, R.; Matsumoto, A.; Uchiyama, K.; Matsui, Y. Mapping quantitative trait loci for growth and wood property traits in Cryptomeria japonica across multiple environments. Tree Genet. Genomes 2019, 15, 43. [Google Scholar] [CrossRef]
- Munoz, F. breedR: Statistical Methods for Forest Genetic Resources Analysts. 2015. Available online: https://prodinra.inra.fr/record/329057 (accessed on 25 January 2023).
- R Core Team. R: A Language and Environment for Statistical Computing; R Foundation for Statistical Computing: Vienna, Austria, 2022. [Google Scholar]
- Dutkowski, G.W.; Costa, E.; Silva, J.; Gilmour, A.R.; Wellendorf, H.; Aguiar, A. Spatial analysis enhances modelling of a wide variety of traits in forest genetic trials. Can. J. Forest Res. 2006, 36, 1851–1870. [Google Scholar] [CrossRef]
- Kyushu Region Council of Forestry Research Institutes. Characteristic Table of Sugi (Cryptomeria japonica) Plus Tree; Kyushu Region Council of Forestry Research Institutes: Kumamoto, Japan, 1998. (In Japanese) [Google Scholar]
- Carpenter, B.; Gelman, A.; Hoffman, M.D.; Lee, D.; Goodrich, B.; Betancourt, M.; Brubaker, M.; Guo, J.; Li, P.; Riddell, A. Stan: A Probabilistic Programming Language. J. Stat. Softw. 2017, 76, 1. [Google Scholar] [CrossRef]
- Toda, T.; Takeuchi, H.; Nishimura, K.; Fujimoto, Y. Male flower setting of plus tree clones of Cryptomeria japonica (D Don) in Kyushu. Bull. Natl. For. Tree Breed. 1996, 14, 77–88, (In Japanese with English Summary). [Google Scholar]
- Ueno, S.; Uchiyama, K.; Moriguchi, Y.; Ujino-Ihare, T.; Matsumoto, A.; Wei, F.; Saito, M.; Higuchi, Y.; Futamura, N.; Kanamori, H.; et al. Scanning RNA-Seq and RAD-Seq approach to develop SNP markers closely linked to MALE STERILITY 1 (MS1) in Cryptomeria japonica D. Don. Breed. Sci. 2019, 69, 19–29. [Google Scholar] [CrossRef]
- Puritz, J.B.; Hollenbeck, C.M.; Gold, J.R. dDocent: A RADseq, variant-calling pipeline designed for population genomics of non-model organisms. PeerJ 2014, 2, e431. [Google Scholar] [CrossRef]
- Bolger, A.M.; Lohse, M.; Usadel, B. Trimmomatic: A flexible trimmer for Illumina sequence data. Bioinformatics 2014, 30, 2114–2120. [Google Scholar] [CrossRef]
- Li, H.; Durbin, R. Fast and accurate short read alignment with Burrows–Wheeler transform. Bioinformatics 2009, 25, 1754–1760. [Google Scholar] [CrossRef]
- Garrison, E.; Marth, G. Haplotype-based variant detection from short-read sequencing. arXiv 2012, arXiv:12073907. [Google Scholar]
- Danecek, P.; Auton, A.; Abecasis, G.; Albers, C.A.; Banks, E.; DePristo, M.A.; Handsaker, R.E.; Lunter, G.; Marth, G.T.; Sherry, S.T. The variant call format and VCFtools. Bioinformatics 2011, 27, 2156–2158. [Google Scholar] [CrossRef]
- Marshall, T.C.; Slate, J.; Kruuk, L.E.; Pemberon, J.M. Statistical confidence for likelihood-based paternity inference in natural populations. Mol. Ecol. 1998, 7, 639–655. [Google Scholar] [CrossRef] [PubMed]
- Kalinowski, S.T.; Taper, M.L.; Marshall, T.C. Revising how the computer program CERVUS accommodates genotyping error increases success in paternity assignment. Mol. Ecol. 2007, 16, 1099–1106. [Google Scholar] [CrossRef] [PubMed]
- Falconer, D.S. Introduction to Quantitative Genetics, 4th ed.; Longman Scientific and Technical: London, UK, 1996. [Google Scholar]
- Yasuda, Y.; Iki, T.; Takashima, Y.; Takahashi, M.; Hiraoka, Y.; Mishima, K. Genetic gains in wood property can be achieved by indirect selection and nondestructive measurements in full-sib families of Japanese cedar (Cryptomeria japonica. D. Don) plus tree clones. Ann. For. Sci. 2021, 78, 50. [Google Scholar] [CrossRef]
- Pérez, P.; de Los Campos, G. Genome-wide regression and prediction with the BGLR statistical package. Genetics 2014, 198, 483–495. [Google Scholar] [CrossRef]
- Müller, B.S.; Neves, L.G.; de Almeida Filho, J.E.; Resende, M.F.; Muñoz, P.R.; dos Santos, P.E.; Paludzyszyn Filho, E.; Kirst, M.; Grattapaglia, D. Genomic prediction in contrast to a genome-wide association study in explaining heritable variation of complex growth traits in breeding populations of Eucalyptus. BMC Genom. 2017, 18, 524. [Google Scholar] [CrossRef]
- Fujisawa, Y.; Ohta, S.; Nishimura, K.; Toda, T.; Tajima, M. Wood characteristics and genetic variations in sugi (Cryptomeria japonica). 3. Estimation of variance-components of the variation in dynamic modulus of elasticity with plus-tree clones. Mokuzai Gakkaishi 1994, 40, 457–464. [Google Scholar]
- Resende, M.D.V.; Resende, M.F.R.; Sansaloni, C.P.; Petroli, C.D.; Missiaggia, A.A.; Aguiar, A.M.; Abad, J.M.; Takahashi, E.K.; Rosado, A.M.; Faria, D.A.; et al. Genomic selection for growth and wood quality in Eucalyptus: Capturing the missing heritability and accelerating breeding for complex traits in forest trees. New Phytol. 2012, 194, 116–128. [Google Scholar] [CrossRef]
- De los Campos, G.; Hickey, J.M.; Pong-Wong, R.; Daetwyler, H.D.; Calus, M.P. Whole-genome regression and prediction methods applied to plant and animal breeding. Genetics 2013, 193, 327–345. [Google Scholar] [CrossRef]
- Chen, Z.-Q.; Baison, J.; Pan, J.; Karlsson, B.; Andersson, B.; Westin, J.; García-Gil, M.R.; Wu, H.X. Accuracy of genomic selection for growth and wood quality traits in two control-pollinated progeny trials using exome capture as the genotyping platform in Norway spruce. BMC Genom. 2018, 19, 946. [Google Scholar] [CrossRef]
- Zapata-Valenzuela, J.; Whetten, R.W.; Neale, D.; McKeand, S.; Isik, F. Genomic estimated breeding values using genomic relationship matrices in a cloned population of loblolly pine. G3 Genes Genomes Genet. 2013, 3, 909–916. [Google Scholar] [CrossRef]
- Resende, R.; Resende, M.; Silva, F.; Azevedo, C.; Takahashi, E.; Silva, O.; Grattapaglia, D. Assessing the expected response to genomic selection of individuals and families in Eucalyptus breeding with an additive-dominant model. Heredity 2017, 119, 245–255. [Google Scholar] [CrossRef] [PubMed]
- Covarrubias-Pazaran, G. Genome-Assisted Prediction of Quantitative Traits Using the R Package sommer. PLoS ONE 2016, 11, e0156744. [Google Scholar] [CrossRef] [PubMed]
- Tsubomura, M.; Fukatsu, E.; Nakada, R.; Fukuda, Y. Inheritance of male flower production in Cryptomeria japonica (sugi) estimated from analysis of a diallel mating test. Ann. For. Sci. 2012, 69, 867–875. [Google Scholar] [CrossRef]
- Tsubomura, M.; Fukatsu, E.; Watanabe, A. Evaluation of male flower production in sugi (Cryptomeria japonica) plus tree clones selected from a Kanto breeding region. J. Jpn. For. Soc. 2013, 95, 156–162, (In Japanese with English Summary). [Google Scholar] [CrossRef]
- Coffey, M. Dairy cows: In the age of the genotype, phenotype is king. Anim. Front. 2020, 10, 19–22. [Google Scholar] [CrossRef]
Disclaimer/Publisher’s Note: The statements, opinions and data contained in all publications are solely those of the individual author(s) and contributor(s) and not of MDPI and/or the editor(s). MDPI and/or the editor(s) disclaim responsibility for any injury to people or property resulting from any ideas, methods, instructions or products referred to in the content. |
© 2023 by the authors. Licensee MDPI, Basel, Switzerland. This article is an open access article distributed under the terms and conditions of the Creative Commons Attribution (CC BY) license (https://creativecommons.org/licenses/by/4.0/).