Local Adaptation in Natural Populations of Toona ciliata var. pubescens Is Driven by Precipitation and Temperature: Evidence from Microsatellite Markers
Abstract
1. Introduction
2. Materials and Methods
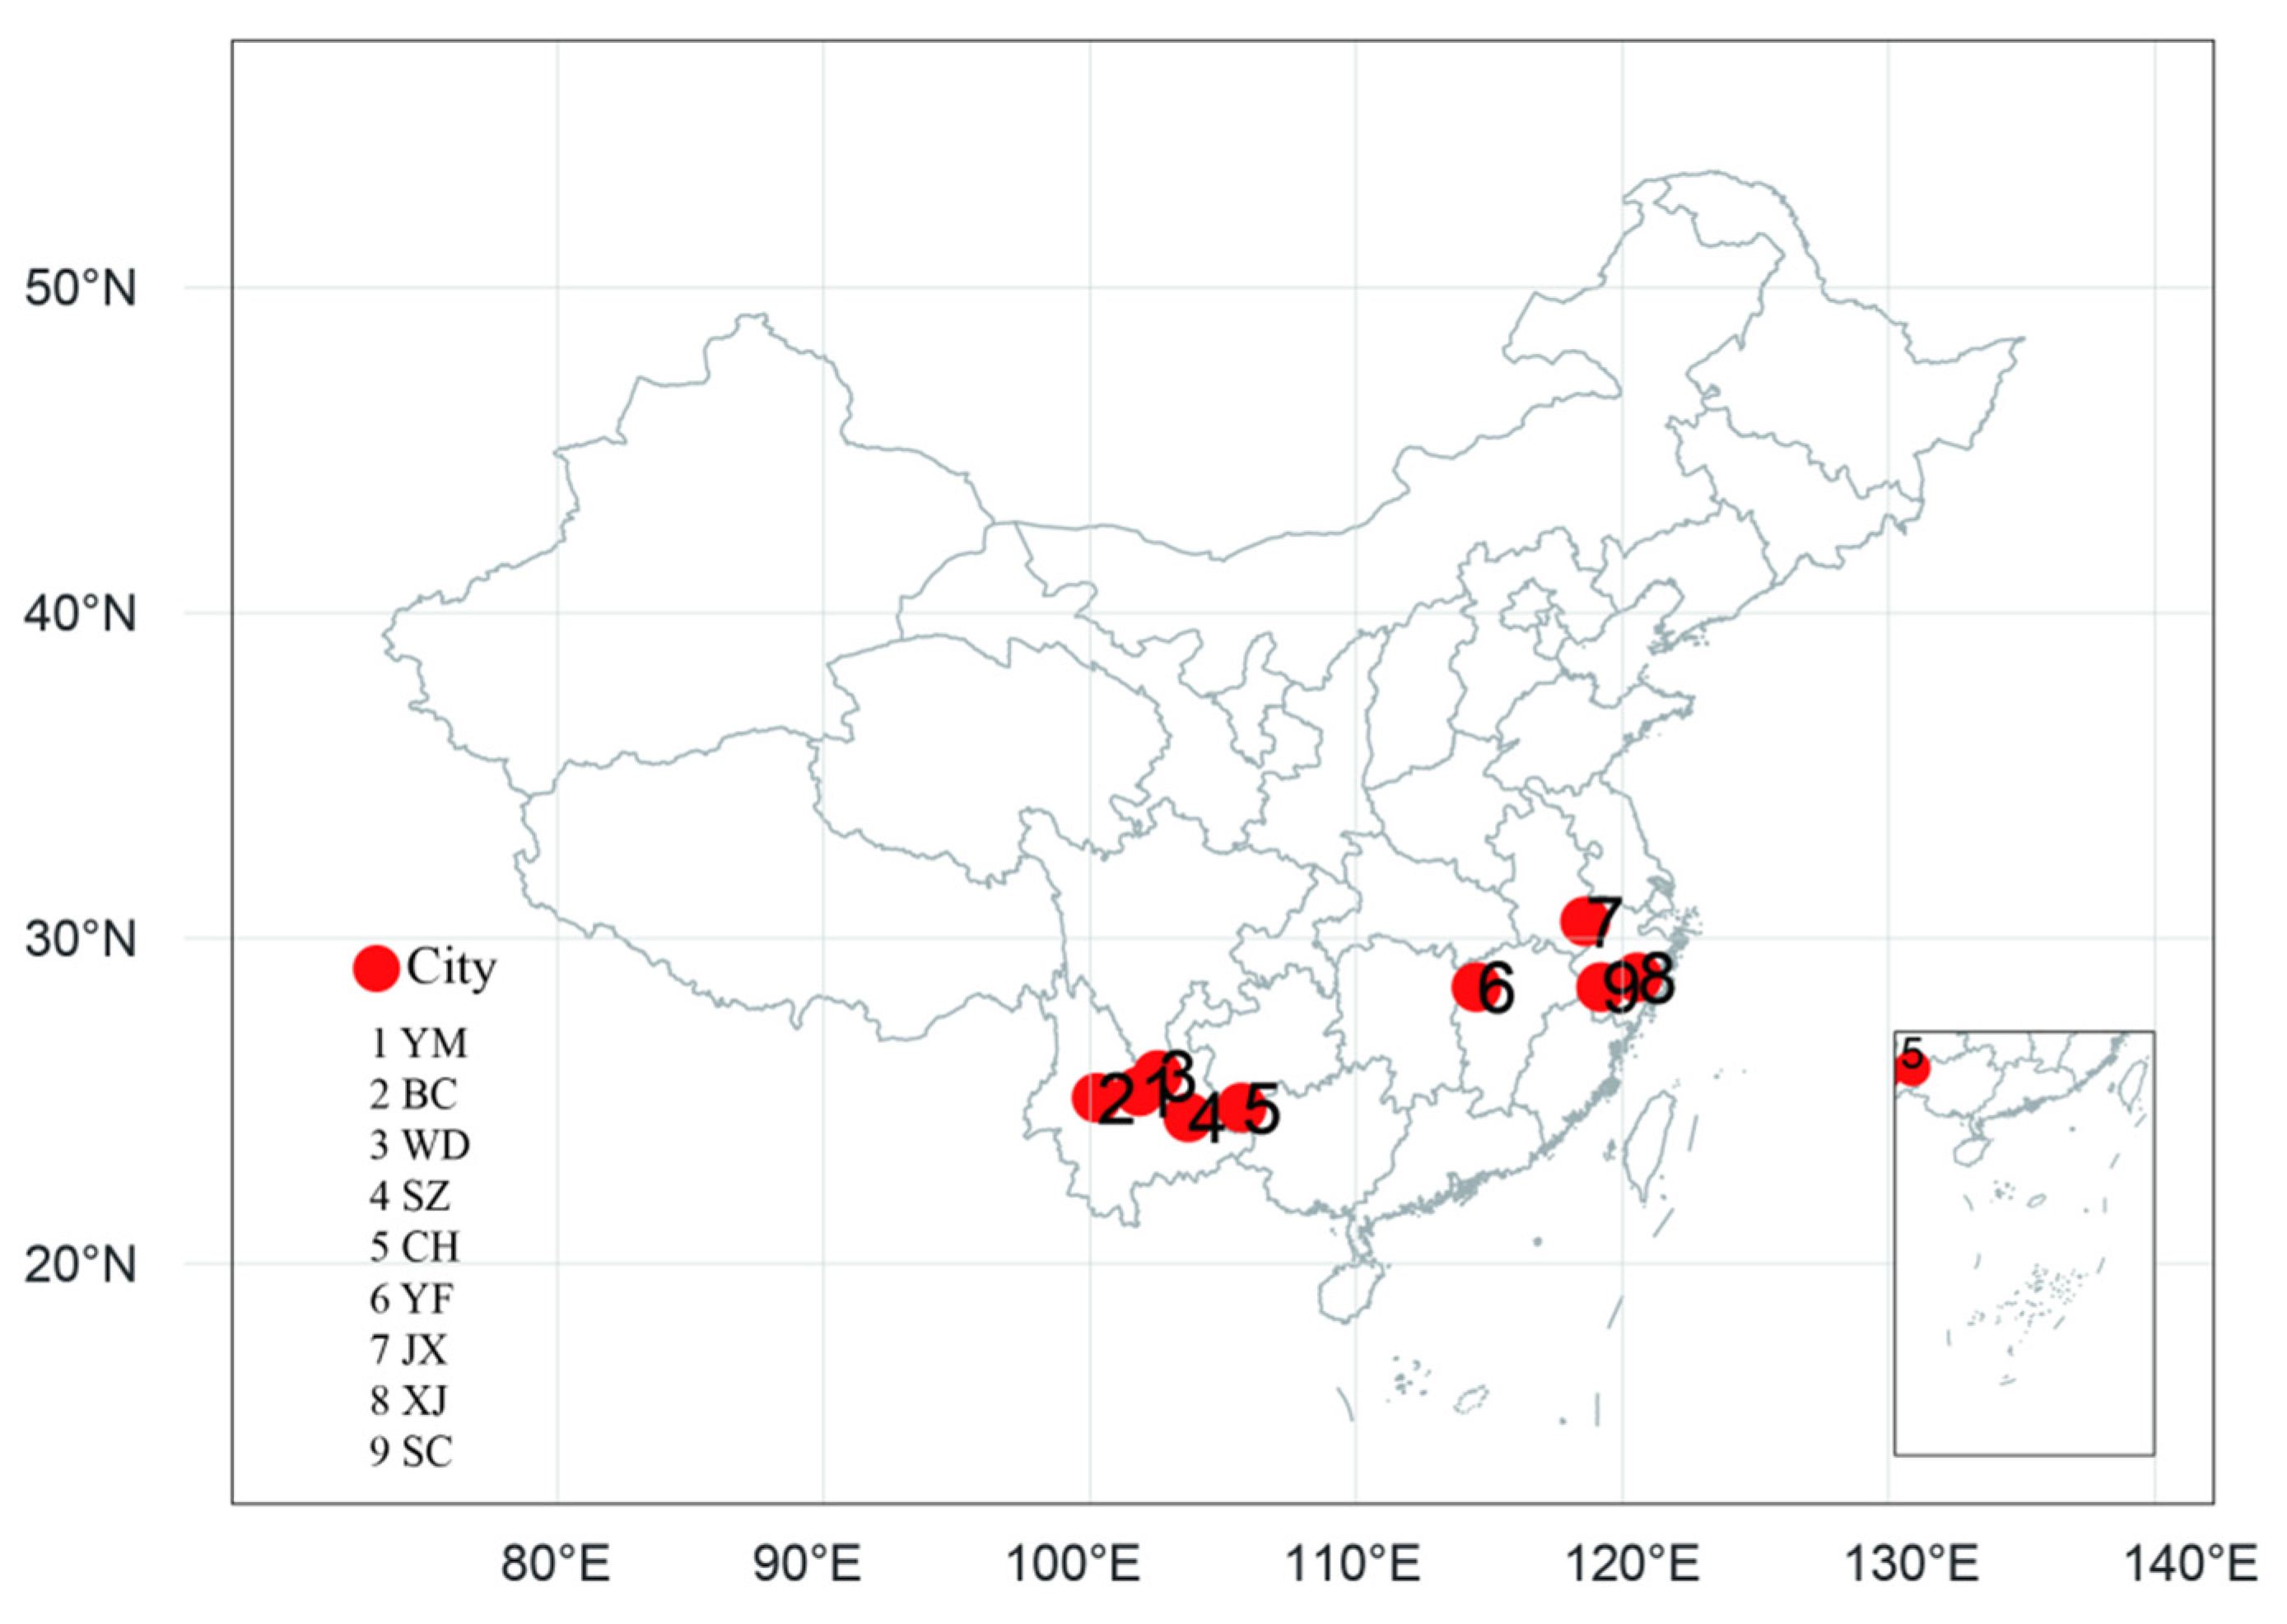
2.1. Sampled Populations
2.2. Molecular Analysis
2.3. Climatic Data
2.4. General Statistical Analyses
2.5. Identification of Outlier Loci
2.6. Genetic Variation Related with Climatic and Geographic Distance
2.7. Associations between Microsatellite Allele Frequency and Climatic and Geographical Variables
3. Results and Analysis
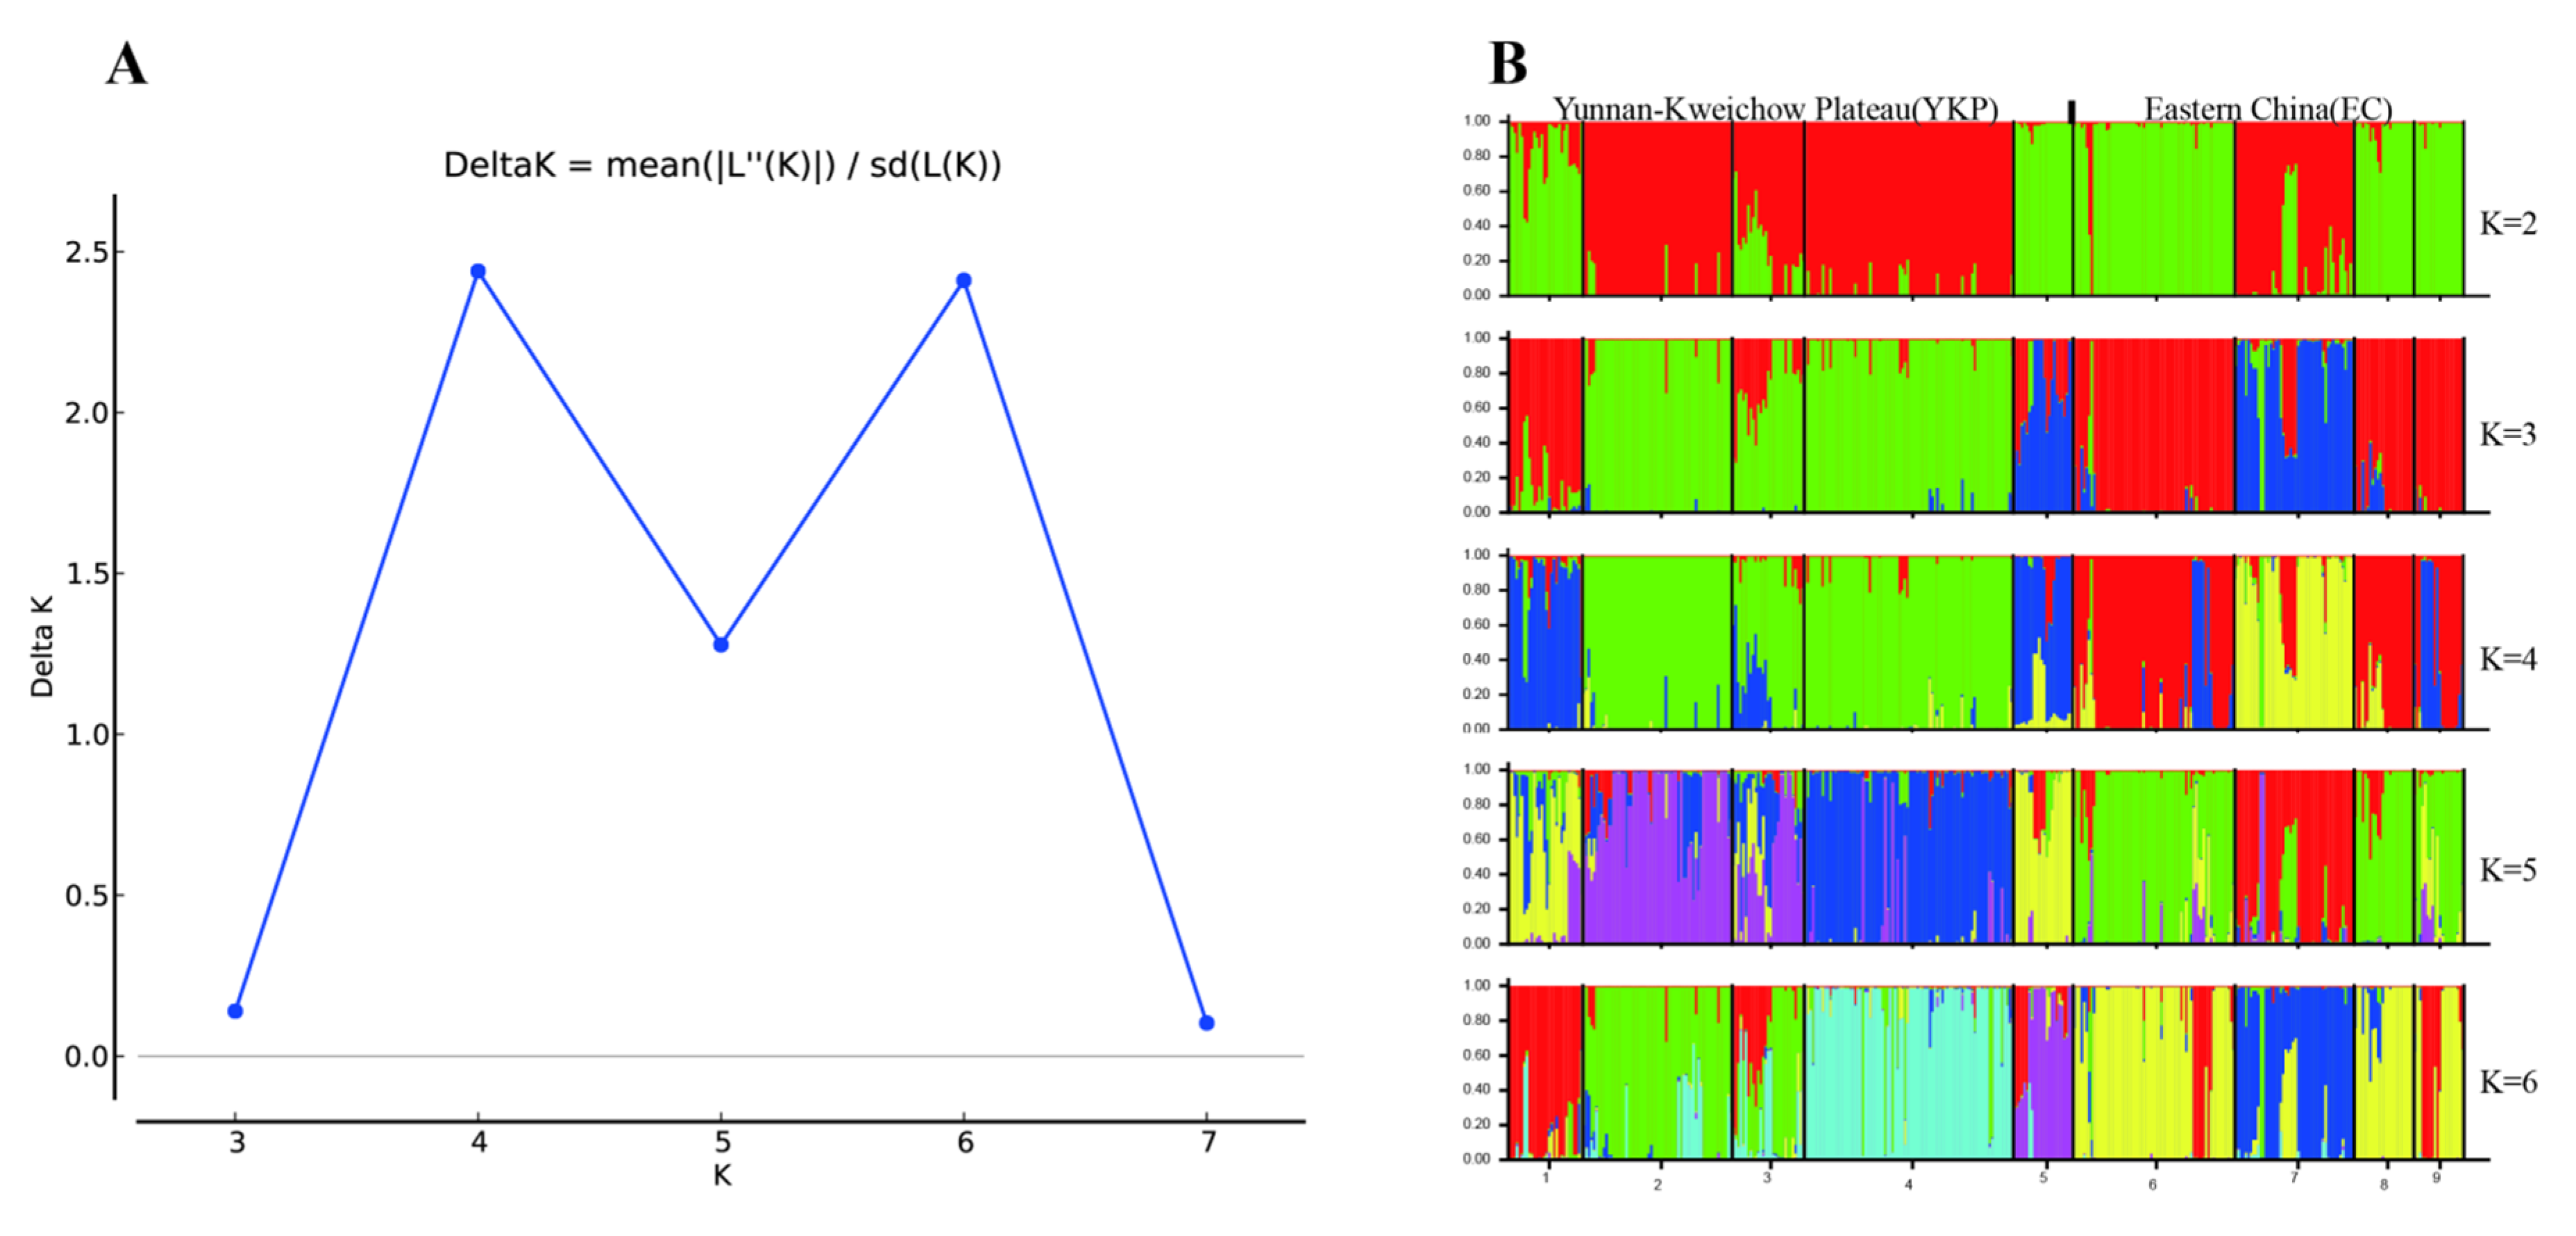
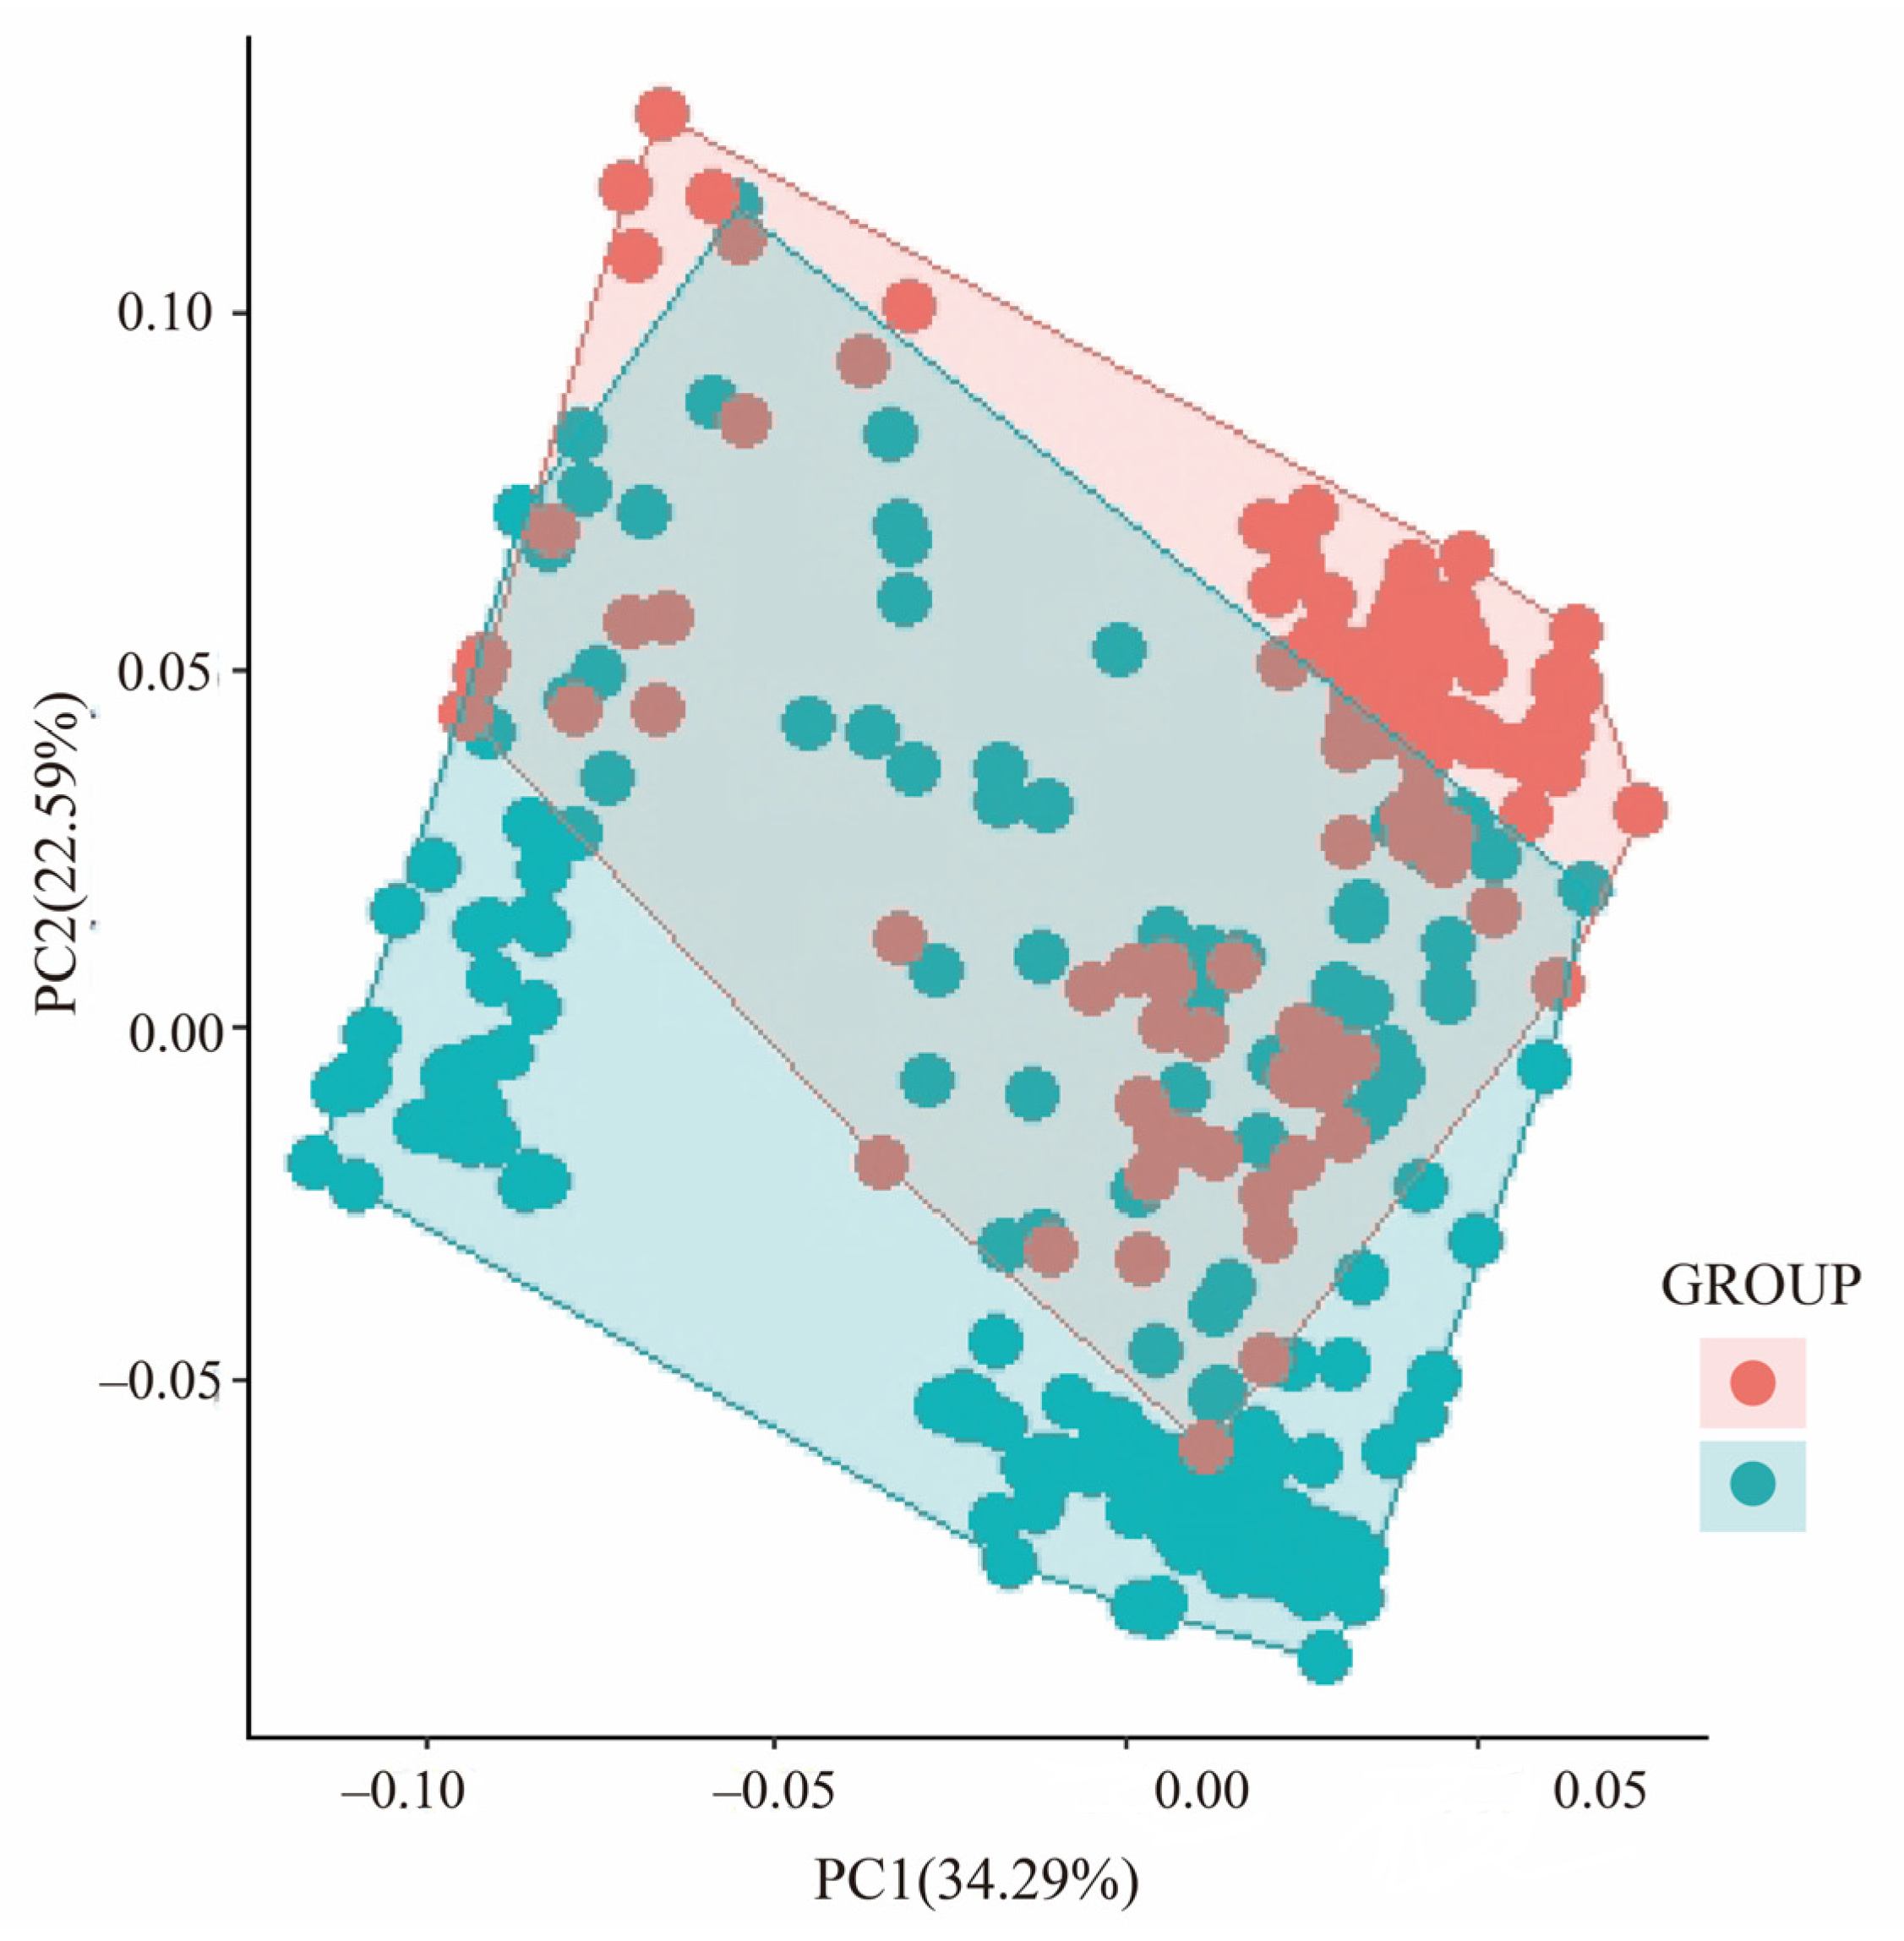
3.1. Genetic Variation and Population Structure
3.2. Genetic Differentiation and the Identification of Outlier Loci
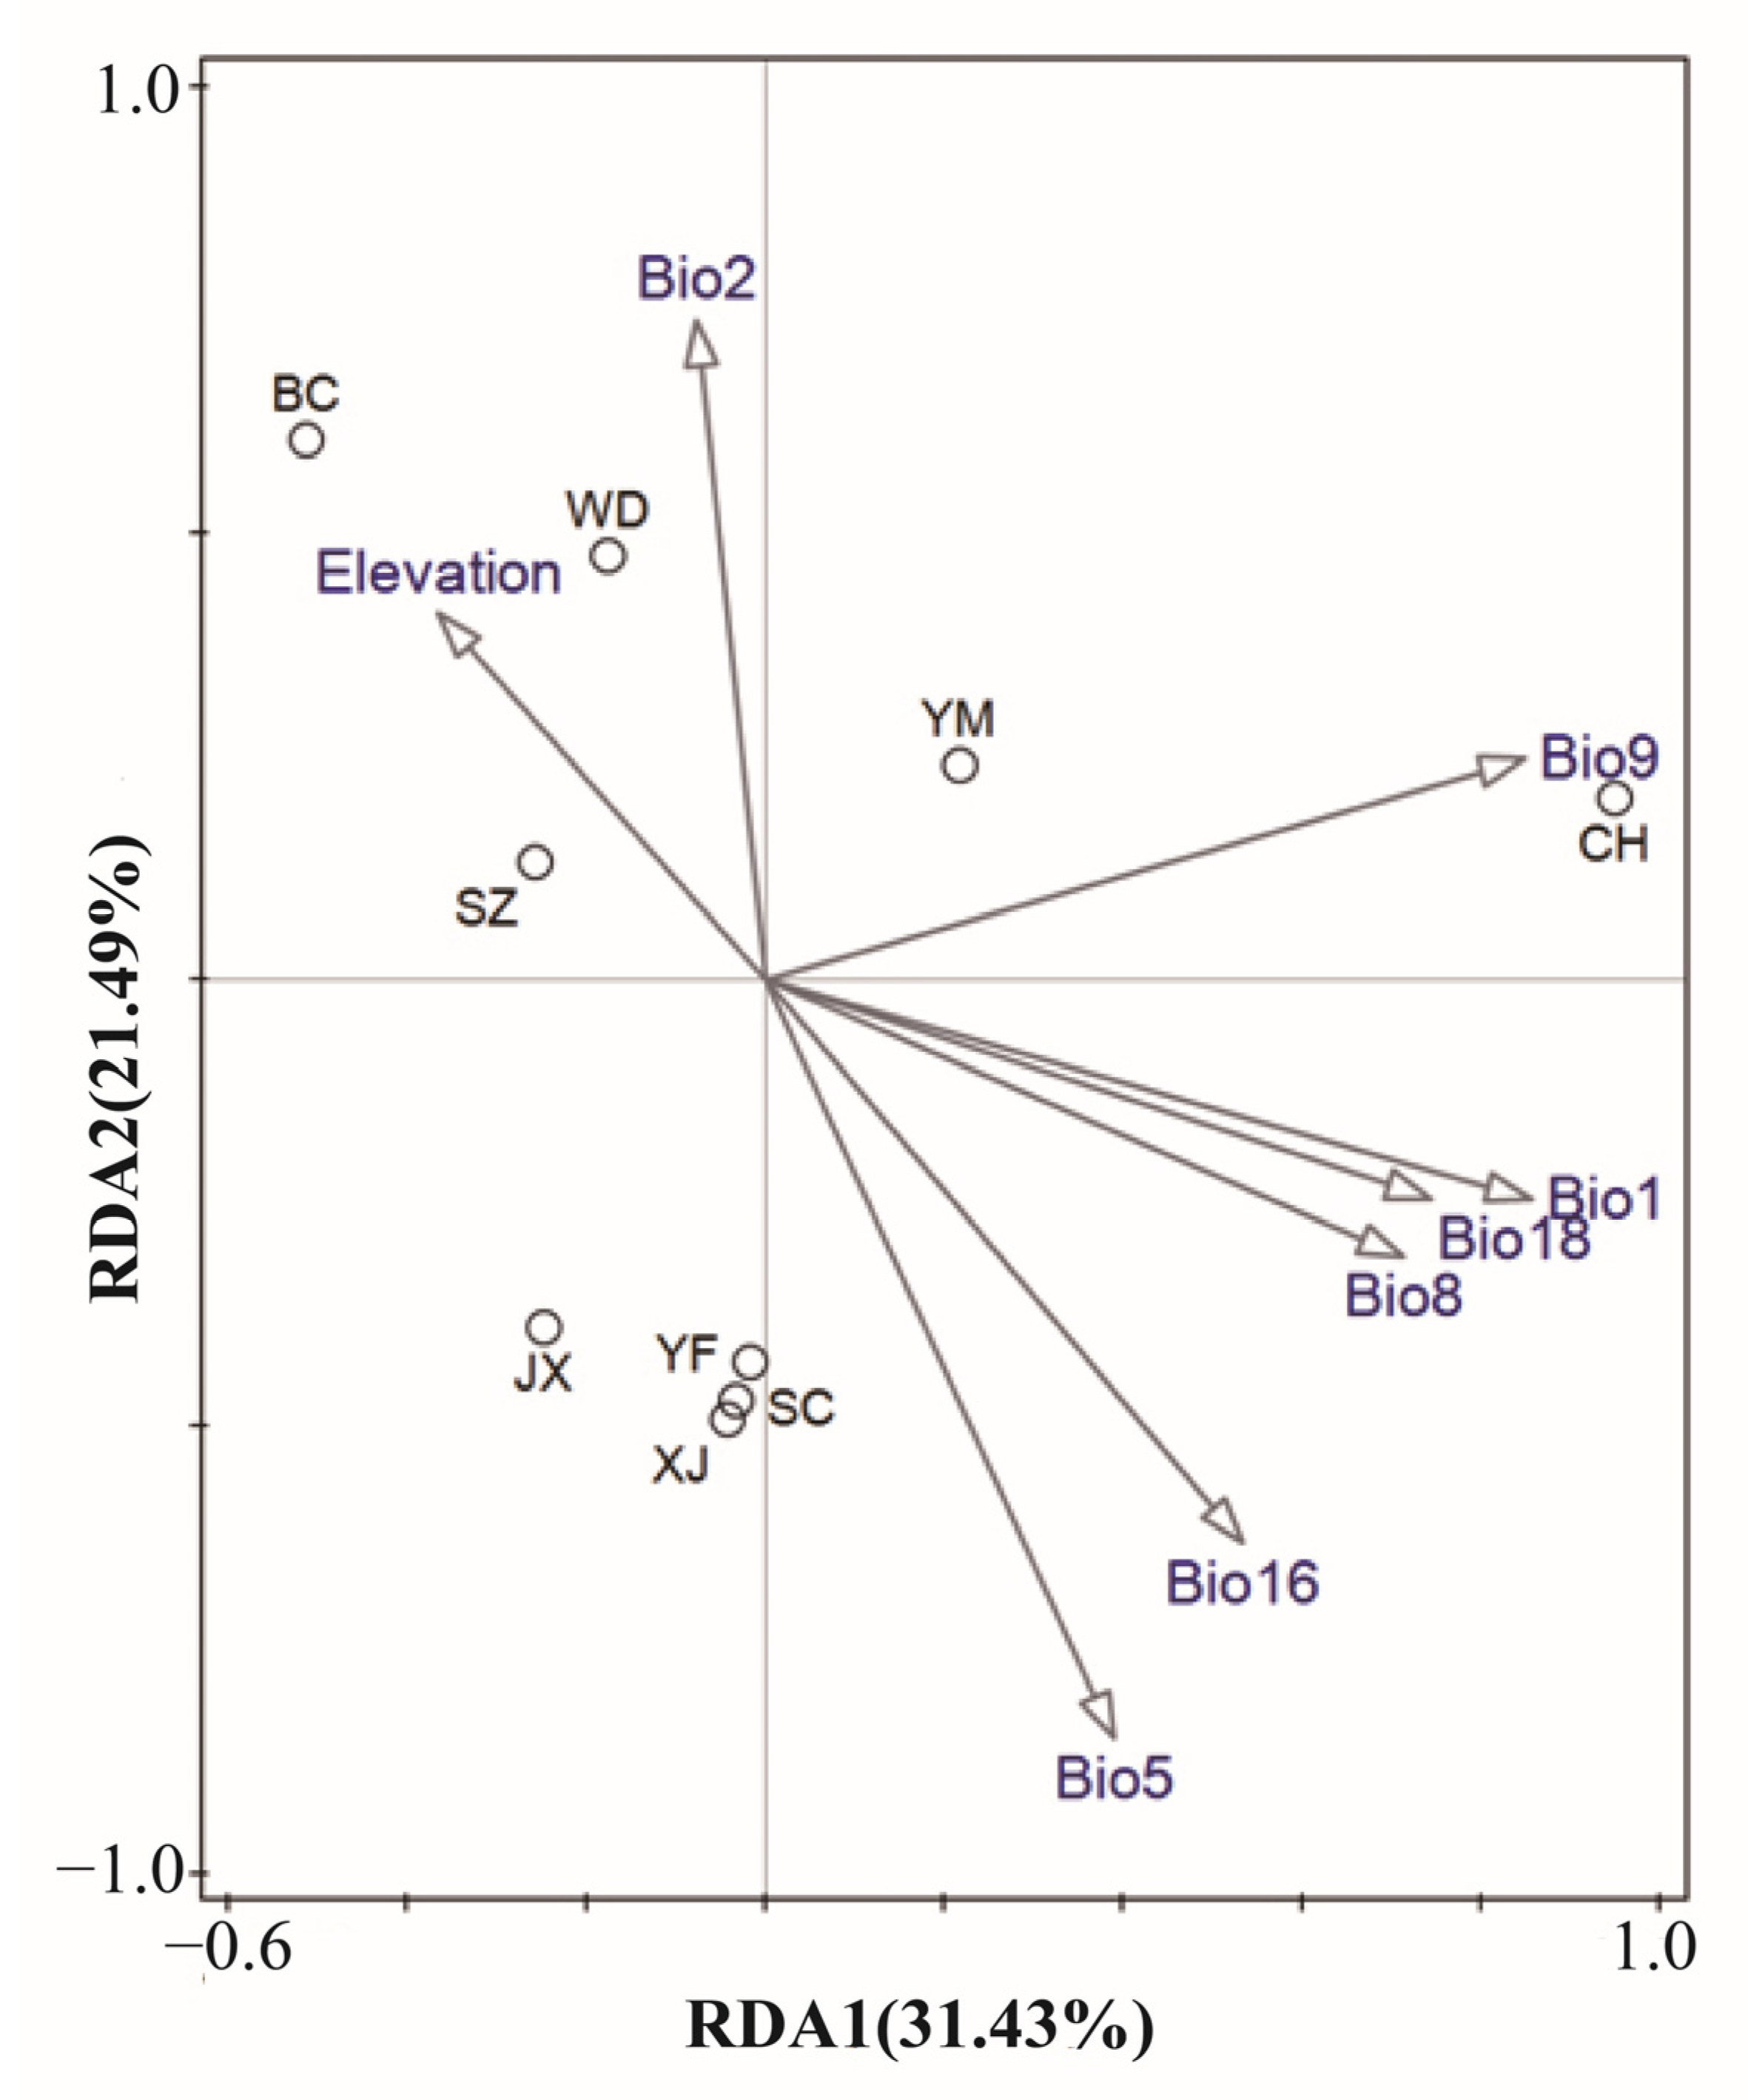
3.3. Genetic Variation Explained by Climatic and Geographical Distance
3.4. Associations between Microsatellite Allele Frequency and Climatic and Geographical Variables
4. Discussion
4.1. Population Structure and Genetic Differentiation
4.2. Outlier Loci Detection and Associations with Environmental Variables
5. Conclusions
Author Contributions
Funding
Data Availability Statement
Conflicts of Interest
References
- Jun, L.; Xiuzong, S.; Yitai, C.; Guiping, H.; Tianlin, W. Isolation of Microsatellite DNA from endangered tree Toona ciliata var. pubescens and optimization of SSR reaction system. China Biotechnol. 2006, 26, 50–55. [Google Scholar]
- Zhang, L.; Guo, L.H.; Du, T.Z.; Hu, S.Z. The effects of shading and soil water content on photosynthesis of Toona ciliata var. pubescens seedlings. J. Nanjing For. Univ. 2006, 49, 63–66. [Google Scholar]
- Liu, J.; Chen, Y.T.; Sun, Z.X.; Jiang, J.; He, G.; Rao, L.; Wu, T. Spatial Genetic Structure of Toona ciliata var. pubescens Populations in Terms of Spatial Autocorrelation Analysis. Sci. Silvae Sin. 2008, 44, 45–52. [Google Scholar]
- Jun, L.; Jingmin, J.; Yitai, C. Genetic diversity of central and peripheral populations of Toona ciliata var. pubescens, an endangered tree species endemic to China. Genet. Mol. Res. GMR 2014, 13, 4579–4590. [Google Scholar]
- Liguo, F. China Plant Red Data Book: Rare and Endangered Plants; Science Press: Beijing, China, 1992. [Google Scholar]
- Luhuan, L.; Shuihu, J. Spermatophyta flora of Gutianshan Nature Reserve in Zhejiang. J. Beijing For. Univ. 2000, 22, 33–39. [Google Scholar]
- Guangfu, Z. Study on rare and threatened plants of Anhui and their conservation. J. Anhui Norm. Univ. 2000, 23, 36–40. [Google Scholar]
- Xinzhong, L.; Heping, W. Scientific Investigation and Research on Guanshan Natural Reserve in Jiangxi Province; Forestry Press: Beijing, China, 2005. [Google Scholar]
- Savolainen, O.; Lascoux, M.; Merilä, J. Ecological genomics of local adaptation. Nat. Rev. Genet. 2013, 14, 807–820. [Google Scholar] [CrossRef]
- Brousseau, L.; Postolache, D.; Lascoux, M.; Drouzas, A.D.; Källman, T.; Leonarduzzi, C.; Liepelt, S.; Piotti, A.; Popescu, F.; Roschanski, A.M.; et al. Local Adaptation in European Firs Assessed through Extensive Sampling across Altitudinal Gradients in Southern Europe. PLoS ONE 2016, 11, e158216. [Google Scholar] [CrossRef]
- Savolainen, O.; Knürr, T. Gene Flow and Local Adaptation in Trees. Annu. Rev. Ecol. Evol. Syst. 2007, 38, 595–619. [Google Scholar] [CrossRef]
- Morgenstern, E.K. Geographic Variation in Forest Trees: Genetic Basis and Application of Knowledge in Silviculture; UBC Press: Vancouver, BC, USA, 1996. [Google Scholar]
- Keller, S.R.; Soolanayakanahally, R.Y.; Guy, R.D.; Silim, S.N.; Olson, M.S.; Tiffin, P. Climate-driven local adaptation of ecophysiology and phenology in balsam poplar, Populus balsamifera L. (Salicaceae). Am. J. Bot. 2011, 98, 99–108. [Google Scholar] [CrossRef]
- Howe, G.T.; Aitken, S.N.; Neale, D.B.; Jermstad, K.D.; Wheeler, N.C.; Chen, T.H. From genotype to phenotype: Unraveling the complexities of cold adaptation in forest trees. Can. J. Bot. 2003, 81, 1247–1266. [Google Scholar] [CrossRef]
- Davis, M.B. Range shift and adaptive response to Quaternary climate change. Science 2001, 292, 673–679. [Google Scholar] [CrossRef] [PubMed]
- Mosca, E.L.E.N.A.; Eckert, A.J.; Di Pierro, E.A.; Rocchini, D.; La Porta, N.; Belletti, P.; Neale, D.B. The geographical and environmental determinants of genetic diversity for four alpine conifers of the European Alps. Mol. Ecol. 2015, 21, 5530–5545. [Google Scholar] [CrossRef]
- Holderegger, R.; Kamm, U.; Gugerli, F. Adaptive vs. neutral genetic diversity: Implications for landscape genetics. Landsc. Ecol. 2006, 21, 797–807. [Google Scholar] [CrossRef]
- Lowry, D.B. Landscape evolutionary genomics. Biol. Lett. 2010, 6, 502–504. [Google Scholar] [CrossRef]
- Schoville, S.D.; Bonin, A.; François, O.; Lobreaux, S.; Melodelima, C.; Manel, S. Adaptive Genetic Variation on the Landscape: Methods and Cases. Annu. Rev. Ecol. Evol. Syst. 2012, 43, 23–43. [Google Scholar] [CrossRef]
- Coop, G.; Witonsky, D.; Di Rienzo, A.; Pritchard, J.K. Using Environmental Correlations to Identify Loci Underlying Local Adaptation. Genetics 2010, 185, 1411. [Google Scholar] [CrossRef]
- Hanson, J.O.; Rhodes, J.R.; Riginos, C.; Fuller, R.A. Environmental and geographic variables are effective surrogates for genetic variation in conservation planning. Proc. Natl. Acad. Ences 2017, 114, 12755–12760. [Google Scholar] [CrossRef]
- Riccioni, G.; Cariani, A.; Ferrara, G.; Cannas, R.; Melis, R.; Stagioni, M.; Addis, P.; Tinti, F. Evolutionary constraints limiting the variation of Expressed Sequence Tag-linked microsatellite loci, prevent the detection of local adaptation in Mediterranean Bluefin tuna. Fish. Res. 2017, 190, 157–163. [Google Scholar] [CrossRef]
- Hijmans, R.J.; Cameron, S.E.; Parra, J.L.; Jones, P.G.; Jarvis, A. Very high resolution interpolated climate surfaces for global land areas. Int. J. Climatol. 2005, 25, 1965–1978. [Google Scholar] [CrossRef]
- Nei, M. Estimation of average heterozygosity and genetic distance from a small number of individuals. Genetics 1978, 89, 583–590. [Google Scholar] [CrossRef]
- Yeh, F.; Yang, R.C. POPGENE 1.32; POPGENE-for the Analysis of Genetic Variation among and within Populations Using Co-dominant and Dominant Markers: Edmonton, Canada, 2000. [Google Scholar]
- Excoffier, L.; Lischer, H.E.L. Arlequin suite ver 3.5: A new series of programs to perform population genetics analyses under Linux and Windows. Mol. Ecol. Resour. 2010, 10, 564–567. [Google Scholar] [CrossRef] [PubMed]
- Pritchard, J.K.; Stephens, M.J.; Donnelly, P.J. Inference of Population Structure Using Multilocus Genotype Data. Genetics 2000, 155, 945–959. [Google Scholar] [CrossRef] [PubMed]
- Gaggiotti, F.O. A Genome-Scan Method to Identify Selected Loci Appropriate for Both Dominant and Codominant Markers: A Bayesian Perspective. Genetics 2008, 180, 977–993. [Google Scholar]
- Beaumont, M.A.; Nichols, R.A. Evaluating Loci for Use in the Genetic Analysis of Population Structure. Proc. R. Soc. Lond. 1996, 263, 1619–1626. [Google Scholar]
- Excoffier, L.; Hofer, T.; Foll, M. Detecting loci under selection in a hierarchically structured population. Heredity 2009, 103, 285–298. [Google Scholar] [CrossRef]
- Oksanen, J.; Blanchet, F.G.; Kindt, R.; Legendre, P.; Minchin, P.; O’Hara, R.B.; Simpson, G.; Solymos, P.; Stevens, M.H.H.; Wagner, H. Vegan: Community Ecology Package. In R package Version 2.0–2; Vegan: Community Ecology Package; R Foundation for Statistical Computing: Vienna, Austria, 2011. [Google Scholar]
- Lascoux, M.; Glémin, S.; Savolainen, O. Local Adaptation in Plants. In eLS; John Wiley & Sons, Ltd: Chichester, UK, 2016. [Google Scholar]
- Leimu, R.; Fischer, M. A meta-analysis of local adaptation in plants. PLoS ONE 2008, 3, e4010. [Google Scholar] [CrossRef]
- Lewontin, R.C.; Krakauer, J. Distribution of gene frequency as a test of the theory of the selective neutrality of polymorphisms. Genetics 1973, 74, 175–195. [Google Scholar] [CrossRef]
- Abebe, T.D.; Naz, A.A.; Léon, J. Landscape genomics reveal signatures of local adaptation in barley (Hordeum vulgare L.). Front. Plant Sci. 2015, 6, 813. [Google Scholar] [CrossRef]
- Miao, C.Y.; Li, Y.; Yang, J.; Mao, R.L. Landscape genomics reveal that ecological character determines adaptation: A case study in smoke tree (Cotinus coggygria Scop.). BMC Evol. Biol. 2017, 17, 202. [Google Scholar] [CrossRef]
- Brown, J.A.; Beatty, G.E.; Montgomery, W.I.; Provan, J. Broad-scale genetic homogeneity in natural populations of common hazel (Corylus avellana) in Ireland. Tree Genet. Genomes 2016, 12, 122. [Google Scholar] [CrossRef]
- Ebrahimi, A.; Nejad Sattari, T.; Assadi, M.; Larijani, K.; Mehregan, I. Morphological and Molecular Differentiation in Populations of Persian Oak (Quercus Brantii Lindl.) in Southwestern Iran. Egypt. J. Bot. 2017, 57, 379–393. [Google Scholar] [CrossRef][Green Version]
- Graignic, N.; Tremblay, F.; Bergeron, Y. Influence of northern limit range on genetic diversity and structure in a widespread North American tree, sugar maple (Acer saccharum Marshall). Ecol. Evol. 2018, 8, 2766–2780. [Google Scholar] [CrossRef]
- Szasz-Len, A.M.; Konnert, M. Genetic diversity in European beech (Fagus sylvatica L.) seed stands in the Romanian Carpathians. Ann. For. Res. 2018, 61, 65–80. [Google Scholar] [CrossRef]
- Walton, C.; Handley, J.M.; Collins, F.H.; Baimai, V.; Harbach, R.E.; Deesin, V.; Butlin, R.K. Genetic population structure and introgression in Anopheles dirus mosquitoes in South-east Asia. Mol. Ecol. 2001, 10, 569–580. [Google Scholar] [CrossRef] [PubMed]
- Hahn, T.; Kettle, C.J.; Ghazoul, J.; Frei, E.R.; Matter, P.; Pluess, A.R. Patterns of Genetic Variation across Altitude in Three Plant Species of Semi-Dry Grasslands. PLoS ONE 2012, 7, e41608. [Google Scholar] [CrossRef]
- Samuk, K.; Owens, G.L.; Delmore, K.E.; Miller, S.E.; Rennison, D.J.; Schluter, D. Gene flow and selection interact to promote adaptive divergence in regions of low recombination. Mol. Ecol. 2017, 26, 4378–4390. [Google Scholar] [CrossRef]
- Slatkin, M. Gene Flow in Natural Populations. Annu. Rev. Ecol. Syst. 1985, 16, 393–430. [Google Scholar] [CrossRef]
- Shen, D.; Bo, W.; Xu, F.; Wu, R. Genetic diversity and population structure of the Tibetan poplar (Populus szechuanica var. tibetica) along an altitude gradient. BMC Genet. 2014, 15, S11. [Google Scholar] [CrossRef]
- Temunović, M.; Franjić, J.; Satovic, Z.; Grgurev, M.; Frascaria-Lacoste, N.; Fernández-Manjarrés, J.F. Environmental Heterogeneity Explains the Genetic Structure of Continental and Mediterranean Populations of Fraxinus angustifolia Vahl. PLoS ONE 2012, 7, e42764. [Google Scholar] [CrossRef]
- Yuan, S.; Guo, C.; Ma, L.; Wang, R. Environmental conditions and genetic differentiation:what drives the divergence of coexisting Leymus chinensis ecotypes in a large-scale longitudinal gradient? J. Plant Ecol. 2016, 9, 616–628. [Google Scholar] [CrossRef]
- Lind, J.F.; Gailing, O. Genetic structure of Quercus rubra L. and Quercus ellipsoidalis E. J. Hill populations at gene-based EST-SSR and nuclear SSR markers. Tree Genet. Genomes 2013, 9, 707–722. [Google Scholar] [CrossRef]
- Di Pierro, E.A.; Mosca, E.; González-Martínez, S.C.; Binelli, G.; Neale, D.B.; La Porta, N. Adaptive variation in natural Alpine populations of Norway spruce (Picea abies [L.] Karst) at regional scale: Landscape features and altitudinal gradient effects. For. Ecol. Manag. 2017, 405, 350–359. [Google Scholar] [CrossRef]
- Körner, C. Alpine Plant life: Functional Plant Ecology of High Mountain Ecosystems: With 218 Figures, 4 Color Plates and 47 Tables; Springer: Amsterdam, The Netherlands, 2003. [Google Scholar]
- Chaves, M.M.; Maroco, J.P.; Pereira, J.S. Understanding plant responses to drought-from genes to the whole plant. Funct. Plant Biol. 2003, 30, 239–264. [Google Scholar] [CrossRef] [PubMed]
- Skøt, L.; Sackville Hamilton, N.R.; Mizen, S.; Chorlton, K.H.; Thomas, I.D. Molecular genecology of temperature response in Lolium perenne: 2. association of AFLP markers with ecogeography. Mol. Ecol. 2002, 11, 1865–1876. [Google Scholar] [CrossRef] [PubMed]
- Richardson, B.A.; Rehfeldt, G.E.; Kim, M.S. Congruent climate-related genecological responses from molecular markers and quantitative traits for western white pine (Pinus monticola). Int. J. Plant Sci. 2009, 170, 1120–1131. [Google Scholar] [CrossRef]
- Manel, S.; Poncet, B.N.; Legendre, P.; Gugerli, F.; Holderegger, R. Common factors drive adaptive genetic variation at different spatial scales in Arabis alpina. Mol. Ecol. 2010, 19, 3824–3835. [Google Scholar] [CrossRef]
- Manel, S.; Gugerli, F.; Thuiller, W.; Alvarez, N.; Legendre, P.; Holderegger, R.; Gielly, L.; Taberlet, P.; IntraBioDiv Consortium. Broad-scale adaptive genetic variation in alpine plants is driven by temperature and precipitation. Mol. Ecol. 2012, 21, 3729–3738. [Google Scholar] [CrossRef]


| Population | No. | Province | Region | Longitude | Latitude | Altitude/m | Individual Samples |
|---|---|---|---|---|---|---|---|
| Yifeng | YF | Jiangxi | EC | 114°29′ E | 28°30′ N | 375 | 65 |
| Jingxian | JX | Anhui | EC | 118°35′ E | 30°31′ N | 450 | 48 |
| Xianju | XJ | Zhejiang | EC | 120°32′ E | 28°48′ N | 620 | 24 |
| Suichang | SC | Zhejiang | EC | 119°12′ E | 28°30′ N | 510 | 20 |
| Binchuan | BC | Yunnan | YKP | 100°16′ E | 25°02′ N | 1520 | 60 |
| Yuanmou | YM | Yunnan | YKP | 101°49′ E | 25°17′ N | 1230 | 30 |
| Wuding | WD | Yunnan | YKP | 102°08′ E | 25°47′ N | 1702 | 29 |
| Shizong | SZ | Yunnan | YKP | 103°42′ E | 24°21′ N | 912 | 84 |
| Ceheng | CH | Guizhou | YKP | 105°40′ E | 24°36′ N | 710 | 24 |
| Locus | Primer Sequences (5′–3′) | Repeat Motif | Allele Size (bp) | Ta (°C) | GenBank Accession No. |
|---|---|---|---|---|---|
| Tc01 | F:GACTCGTGACACTTAGCCTGTA | (TTTCTC)7 | 231 | 55 | DQ453903 |
| R:CTGGCGTAATCATGGTCATAC | |||||
| Tc02 | F:TAGGAAAGGCAAGGTGGG | (AG)14 | 20 | 55 | DQ453904 |
| R:GGGTGGTCGATGAGGGTT | |||||
| Tc03 | F:AGTAATAGCCTGTAGAGCAG | (AG)13 | 242 | 55 | DQ453905 |
| R:AGAGTGGGGTGGTCGATGAG | |||||
| Tc04 | F:GAAACCAGCAGGCAGAGC | (AG)10 | 230 | 55 | DQ453906 |
| R:GAAGAAGGGTGAGCGAGA | |||||
| Tc05 | F:GATTACGCCAGGCAAACG | (CT)6 | 290 | 55 | DQ453907 |
| R:TTGAATATGGGAGAAGGT | |||||
| Tc06 | F:ATGGATGAGTGTGCGATAGG | (TC)7 | 280 | 55 | DQ453912 |
| R:TGTGATGTAGGAGTCTGAAC | |||||
| Tc07 | F:TGTCTCAGTTTATGCTGGCGT | (TC)8 | 260 | 55 | DQ453914 |
| R:CTGCCCAATCAACAAGAG | |||||
| Tc08 | F:TCAATGCAATTTAGGAGGAA | (GA)8 | 291 | 52 | DQ778303 |
| R:TGCTTGTTGAACCCTGTG | |||||
| Tc-A2 | F:TGGAAAGATTTCATGGGCTC | (TTC)5 | 199 | 60 | MH593319 |
| R:GGTGTGAATTGTCGGCTGTA | |||||
| Tc-A3 | F:AATGTGGAATGGAATGGAGC | (TA)6 | 272 | 60 | MH593320 |
| R:CGTCTCTTTCCCAACCTCAC | |||||
| Tc-A7 | F:GGGTCCATTTCTCAGTGGTC | (TGGGG)5 | 166 | 59 | MH593321 |
| R:TTCAACTCATCCCGTTCACA | |||||
| Tc-A9 | F:TCGGGTGGTAAGGCTAAAGA | (AGC)5 | 234 | 60 | MH593322 |
| R:TTTTGCATTGCGTAGCATTC | |||||
| Tc-A12 | F:GAGATCGGTCCCTCTTCTCC | (CTT)5 | 183 | 60 | MH593323 |
| R:TAGCGGAGGGGATAGGAAGT | |||||
| Tc-B4 | F:CCTGGGAAAGTTGTCAGCTC | (GCA)5 | 149 | 60 | MH593324 |
| R:CAAGCTGGGTTTCTTCTTGG | |||||
| Tc-B11 | F:AGATCAAATCCGGGGAGATT | (TA)6 | 133 | 60 | MH593325 |
| R:CAGCAAAGCCAACTCATCAA | |||||
| Tc-B25 | F:CAGTGCGATCATCACCCTTA | (TA)6 | 273 | 60 | MH593326 |
| R:GGTTCCGGGATTGTAGGACT | |||||
| Tc-B26 | F:GGAGTTGCCATGGATGAAGT | (GCT)6 | 207 | 60 | MH593327 |
| R:CCAGGATCAGCAACCTCAAT | |||||
| Tc-B27 | F:GGCAGAGAAGAGCGGTTTTA | (AG)8 | 191 | 60 | MH593328 |
| R:CGGATCTTTCGCAACGTAGT | |||||
| Tc-C11 | F:CAAGCGAAGAGAGAGAAAGAGG | (AGA)5 | 195 | 60 | MH593329 |
| R:ACCAAAGCTTTAGGCAGCAA | |||||
| Tc-C26 | F:AACAGAAATTCGCCAACCAG | (AAC)7 | 250 | 60 | MH593330 |
| R:AATTCACACCAGCCACTTCC | |||||
| Tc-C49 | F:TAAACCTCCCAAGGTAGCGA | (TGC)6 | 267 | 60 | MH593331 |
| R:GCACGACAGCACTTCATGTT | |||||
| Tc-C50 | F:TGGACACCAAGGGATCTAGC | (AGC)5 | 235 | 60 | MH593332 |
| R:TTTGGGTCCATGATCCATCT | |||||
| Tc-C66 | F:GCACAGGTCATGAAAGAGCA | (TA)6 | 250 | 60 | MH593333 |
| R:CACCAGCAAAACGAAGAACA | |||||
| Tc-C77 | F:CGGAAAAACCTCAATTGTTTTG | (AT)8 | 229 | 60 | MH593334 |
| R:TGCAATAACAGCACCAGCTC | |||||
| Tc-C81 | F:AACGGTCAGAATCTGGATGG | (GGT)6 | 269 | 60 | MH593335 |
| R:GCACCACCACCCCTAGAGTA |
| Factors | Name | Description |
|---|---|---|
| Climate variables | Bio1 | mean annual air temperature |
| Bio2 | mean diurnal air temperature range | |
| Bio3 | isothermality | |
| Bio4 | temperature seasonality | |
| Bio5 | mean daily maximum air temperature of the warmest month | |
| Bio6 | mean daily minimum air temperature of the coldest month | |
| Bio7 | annual range of air temperature | |
| Bio8 | mean daily mean air temperatures of the wettest quarter | |
| Bio9 | mean daily mean air temperatures of the driest quarter | |
| Bio10 | mean daily mean air temperatures of the warmest quarter | |
| Bio11 | mean daily mean air temperatures of the coldest quarter | |
| Bio12 | annual precipitation amount | |
| Bio13 | precipitation amount of the wettest month | |
| Bio14 | precipitation amount of the driest month | |
| Bio15 | precipitation seasonality | |
| Bio16 | mean monthly precipitation amount of the wettest quarter | |
| Bio17 | mean monthly precipitation amount of the driest quarter | |
| Bio18 | mean monthly precipitation amount of the warmest quarter | |
| Bio19 | mean monthly precipitation amount of the coldest quarter |
| Population | Na | Ne | HO | HE | PIC |
|---|---|---|---|---|---|
| YF | 3.40 | 2.08 | 0.58 | 0.49 | 0.42 |
| JX | 4.04 | 2.41 | 0.49 | 0.54 | 0.48 |
| XJ | 2.64 | 1.93 | 0.63 | 0.46 | 0.38 |
| SC | 2.76 | 2.12 | 0.48 | 0.51 | 0.42 |
| YM | 3.92 | 2.56 | 0.66 | 0.61 | 0.53 |
| BC | 3.32 | 2.32 | 0.74 | 0.50 | 0.42 |
| WD | 3.52 | 2.33 | 0.67 | 0.53 | 0.46 |
| SZ | 3.72 | 2.02 | 0.59 | 0.43 | 0.36 |
| CH | 3.83 | 2.82 | 0.32 | 0.60 | 0.54 |
| Mean | 3.46 | 2.29 | 0.57 | 0.52 | 0.45 |
| Source of Variation | d.f. | Sum of Squares | Percentage of Variation | p-Value |
|---|---|---|---|---|
| Among regions | 1 | 784.051 | 10.5 | 0.001 ** |
| Among populations within regions | 8 | 1946.535 | 30.4 | 0.001 ** |
| Within populations | 375 | 4856.182 | 59.1 | 0.001 ** |
| Total | 384 | 7586.768 |
| Allele | Elevation | Bio1 | Bio2 | Bio5 | Bio8 | Bio9 | Bio16 | Bio18 |
|---|---|---|---|---|---|---|---|---|
| Tc05-1 | −0.151 | 0.227 | −0.384 | 0.693 * | −0.066 | −0.085 | 0.410 | −0.039 |
| Tc05-2 | −0.024 | 0.058 | −0.180 | 0.420 | −0.063 | −0.126 | 0.268 | −0.179 |
| Tc05-4 | 0.264 | −0.280 | 0.555 | −0.478 | −0.307 | −0.011 | −0.511 | −0.423 |
| Tc05-5 | −0.012 | −0.442 | 0.144 | −0.436 | −0.163 | −0.366 | −0.410 | −0.202 |
| Tc05-6 | 0.626 | −0.550 | 0.183 | −0.559 | −0.522 | −0.326 | −0.434 | −0.375 |
| Tc05-7 | −0.296 | 0.810 ** | −0.129 | 0.269 | 0.720 * | 0.841 ** | 0.501 | 0.841 ** |
| Tc07-1 | 0.212 | −0.251 | 0.575 | −0.487 | −0.295 | 0.018 | −0.444 | −0.328 |
| Tc07-2 | 0.234 | −0.453 | 0.731 * | −0.787 * | −0.457 | −0.065 | −0.669 * | −0.436 |
| Tc07-3 | −0.004 | 0.266 | 0.017 | 0.349 | 0.170 | 0.169 | 0.363 | −0.077 |
| Tc07-4 | −0.398 | 0.322 | −0.472 | 0.661 | 0.255 | 0.032 | 0.467 | 0.217 |
| Tc07-5 | −0.246 | 0.432 | −0.587 | 0.447 | 0.520 | 0.159 | 0.480 | 0.675 * |
| Tc07-6 | −0.227 | −0.113 | 0.117 | −0.184 | 0.021 | −0.098 | −0.076 | 0.089 |
| Tc07-7 | 0.540 | −0.561 | 0.369 | −0.654 | −0.523 | −0.269 | −0.612 | −0.510 |
| Tc-A7-1 | −0.176 | 0.211 | −0.454 | 0.728 * | −0.043 | −0.141 | 0.430 | −0.023 |
| Tc-A7-2 | −0.082 | 0.161 | −0.251 | 0.496 | 0.052 | −0.052 | 0.361 | −0.059 |
| Tc-A7-4 | 0.232 | −0.185 | 0.546 | −0.451 | −0.224 | 0.091 | −0.457 | −0.327 |
| Tc-A7-5 | 0.008 | −0.442 | 0.207 | −0.475 | −0.193 | −0.333 | −0.439 | −0.227 |
| Tc-A7-6 | 0.626 | −0.550 | 0.183 | −0.559 | −0.522 | −0.326 | −0.434 | −0.375 |
| Tc-B11-1 | 0.231 | −0.253 | 0.541 | −0.463 | −0.291 | 0.003 | −0.436 | −0.336 |
| Tc-B11-2 | 0.214 | −0.311 | 0.809 ** | −0.808 ** | −0.356 | 0.136 | −0.635 | −0.315 |
| Tc-B11-3 | 0.077 | −0.258 | −0.060 | 0.221 | −0.247 | −0.431 | 0.043 | −0.501 |
| Tc-B11-4 | −0.437 | 0.505 | −0.454 | 0.715 * | 0.338 | 0.250 | 0.559 | 0.360 |
| Tc-B11-5 | −0.225 | 0.416 | −0.570 | 0.398 | 0.570 | 0.156 | 0.488 | 0.688 * |
| Tc-B11-7 | 0.536 | −0.558 | 0.371 | −0.653 | −0.521 | −0.266 | −0.612 | −0.511 |
Disclaimer/Publisher’s Note: The statements, opinions and data contained in all publications are solely those of the individual author(s) and contributor(s) and not of MDPI and/or the editor(s). MDPI and/or the editor(s) disclaim responsibility for any injury to people or property resulting from any ideas, methods, instructions or products referred to in the content. |
© 2023 by the authors. Licensee MDPI, Basel, Switzerland. This article is an open access article distributed under the terms and conditions of the Creative Commons Attribution (CC BY) license (https://creativecommons.org/licenses/by/4.0/).
Share and Cite
Fan, Y.; Dai, J.; Wei, Y.; Liu, J. Local Adaptation in Natural Populations of Toona ciliata var. pubescens Is Driven by Precipitation and Temperature: Evidence from Microsatellite Markers. Forests 2023, 14, 1998. https://doi.org/10.3390/f14101998
Fan Y, Dai J, Wei Y, Liu J. Local Adaptation in Natural Populations of Toona ciliata var. pubescens Is Driven by Precipitation and Temperature: Evidence from Microsatellite Markers. Forests. 2023; 14(10):1998. https://doi.org/10.3390/f14101998
Chicago/Turabian StyleFan, Yanru, Jianhua Dai, Yi Wei, and Jun Liu. 2023. "Local Adaptation in Natural Populations of Toona ciliata var. pubescens Is Driven by Precipitation and Temperature: Evidence from Microsatellite Markers" Forests 14, no. 10: 1998. https://doi.org/10.3390/f14101998
APA StyleFan, Y., Dai, J., Wei, Y., & Liu, J. (2023). Local Adaptation in Natural Populations of Toona ciliata var. pubescens Is Driven by Precipitation and Temperature: Evidence from Microsatellite Markers. Forests, 14(10), 1998. https://doi.org/10.3390/f14101998


