Article

Local Adaptation in Natural Populations of Toona ciliata var. pubescens Is Driven by Precipitation and Temperature: Evidence from Microsatellite Markers

Research Institute of Subtropical Forestry, Chinese Academy of Forestry, Hangzhou 311400, China
*
Author to whom correspondence should be addressed.
Forests 2023, 14(10), 1998; https://doi.org/10.3390/f14101998
Submission received: 18 August 2023 / Revised: 19 September 2023 / Accepted: 28 September 2023 / Published: 5 October 2023
(This article belongs to the Section Genetics and Molecular Biology)

Abstract

:
Environmental factors are strong drivers of local adaptation in forest tree species. Toona ciliata var. pubescens, an endangered tree species endemic to China, is widely distributed across Eastern and Southwestern China. In this study, we used 8 genomic microsatellite markers and 17 EST-SSR markers across nine populations from the Yunnan–Kweichow Plateau and Eastern China, to explore the adaptive variation and genetic structure of T. ciliata var. pubescens. Patterns of population structure were apparent using a Bayesian clustering program, STRUCTURE, which identified four distinct clusters. We identified four outlier loci that were potentially under selection using the Dirichlet-multinomial and hierarchic simulation models. Through the Mantel test, it was found that geographic and climatic factors have jointly affected the genetic structure of T. ciliata var. pubescens in the study area. Based on redundancy analysis (RDA), it was shown that the correlation between climatic variables associated with variation is stronger than that of geographic variables. It is worth mentioning that the eight alleles from outlier loci have potentially adaptive and are associated with either precipitation or temperature variables. All analyses revealed high genetic diversity and significant genetic differentiation in the populations of T. ciliata var. pubescens. This indicated that the climatic variables including precipitation and temperature are drivers of local adaptation in the populations of T. ciliata var. pubescens.

1. Introduction

Toona ciliata var. pubescens, known as “Chinese mahogany” in China, is deciduous, broad-leaved, fast-growing, entomophilous tree species of the Toona genus in the Meliaceae family. T. ciliata var. pubescens has red heartwood and an attractive growth grain, making it a valuable timber species in China [1,2,3]. Stands have been reduced due to continuously changing environmental, logging and slow regeneration [4]; in this case, T. ciliata var. pubescens is listed as a second-class endangered tree species in China [5,6,7,8]. Extant populations of T. ciliata var. pubescens are now mainly distributed along a 2000 km belt spanning the subtropical monsoon region, from the southwestern Yunnan–Kweichow Plateau to Eastern China. Due to the broad distribution of this species, its populations provide ideal material for the study of adaptive genetic variation.
Populations with a large geographical distribution tend to exhibit adaption to local environmental conditions [9]. Local adaptation occurs as populations evolve into different ecotypes in response to their local environmental conditions [10]. Local adaptation is a key driver of forest tree species’ evolution and diversification. There are many examples of adaptive divergence in forest tree populations across a variety of spatial scales. Genetic differentiation in forest tree species is driven by environmental heterogeneity and the balance between selection and gene flow [11]. High levels of genetic variation among populations of forest tree species are common [12]. This variation often occurs along climatic gradients of temperature and precipitation [13], indicating strong local adaptation to climate [14]. Local adaptation is also thought to be an important response to global climate changes [15]. To predict tree species’ responses to a changing environment, it is first necessary to understand the adaptive genetic variation in natural populations. This information will assist forest resource managers in their efforts to mitigate the impacts of global climate change [16].
Adaptive genetic variation is defined as the variation found between the genomes in a species resulting from natural selection [17,18,19]. This variation is likely to emerge when selective forces are heterogeneous across a species’ range. Genome-scan methods have been developed to study adaptive genetic variation by screening genetic markers and identifying those that are likely to be linked to the loci under selection [20,21,22]. By investigating the spatial distribution of alleles at different spatial scales (e.g., individual, population, metapopulation), these methods can determine the relationships between environmental variables and adaptive genetic variation.
At present, there are few reports and studies on the relationship between climate and environmental factors of T. ciliata var. pubescens and its adaptive genetic variation. The purpose of this work was to investigate the genetic structure and diversity of populations in T. ciliata var. pubescens, to examine the importance of geographical and climatic factors in constructing the genetic variation model of T. ciliata var. pubescens, and to identify the most important variables related to its genetic variation; this also provides a theoretical basis for its genetic conservation.

2. Materials and Methods

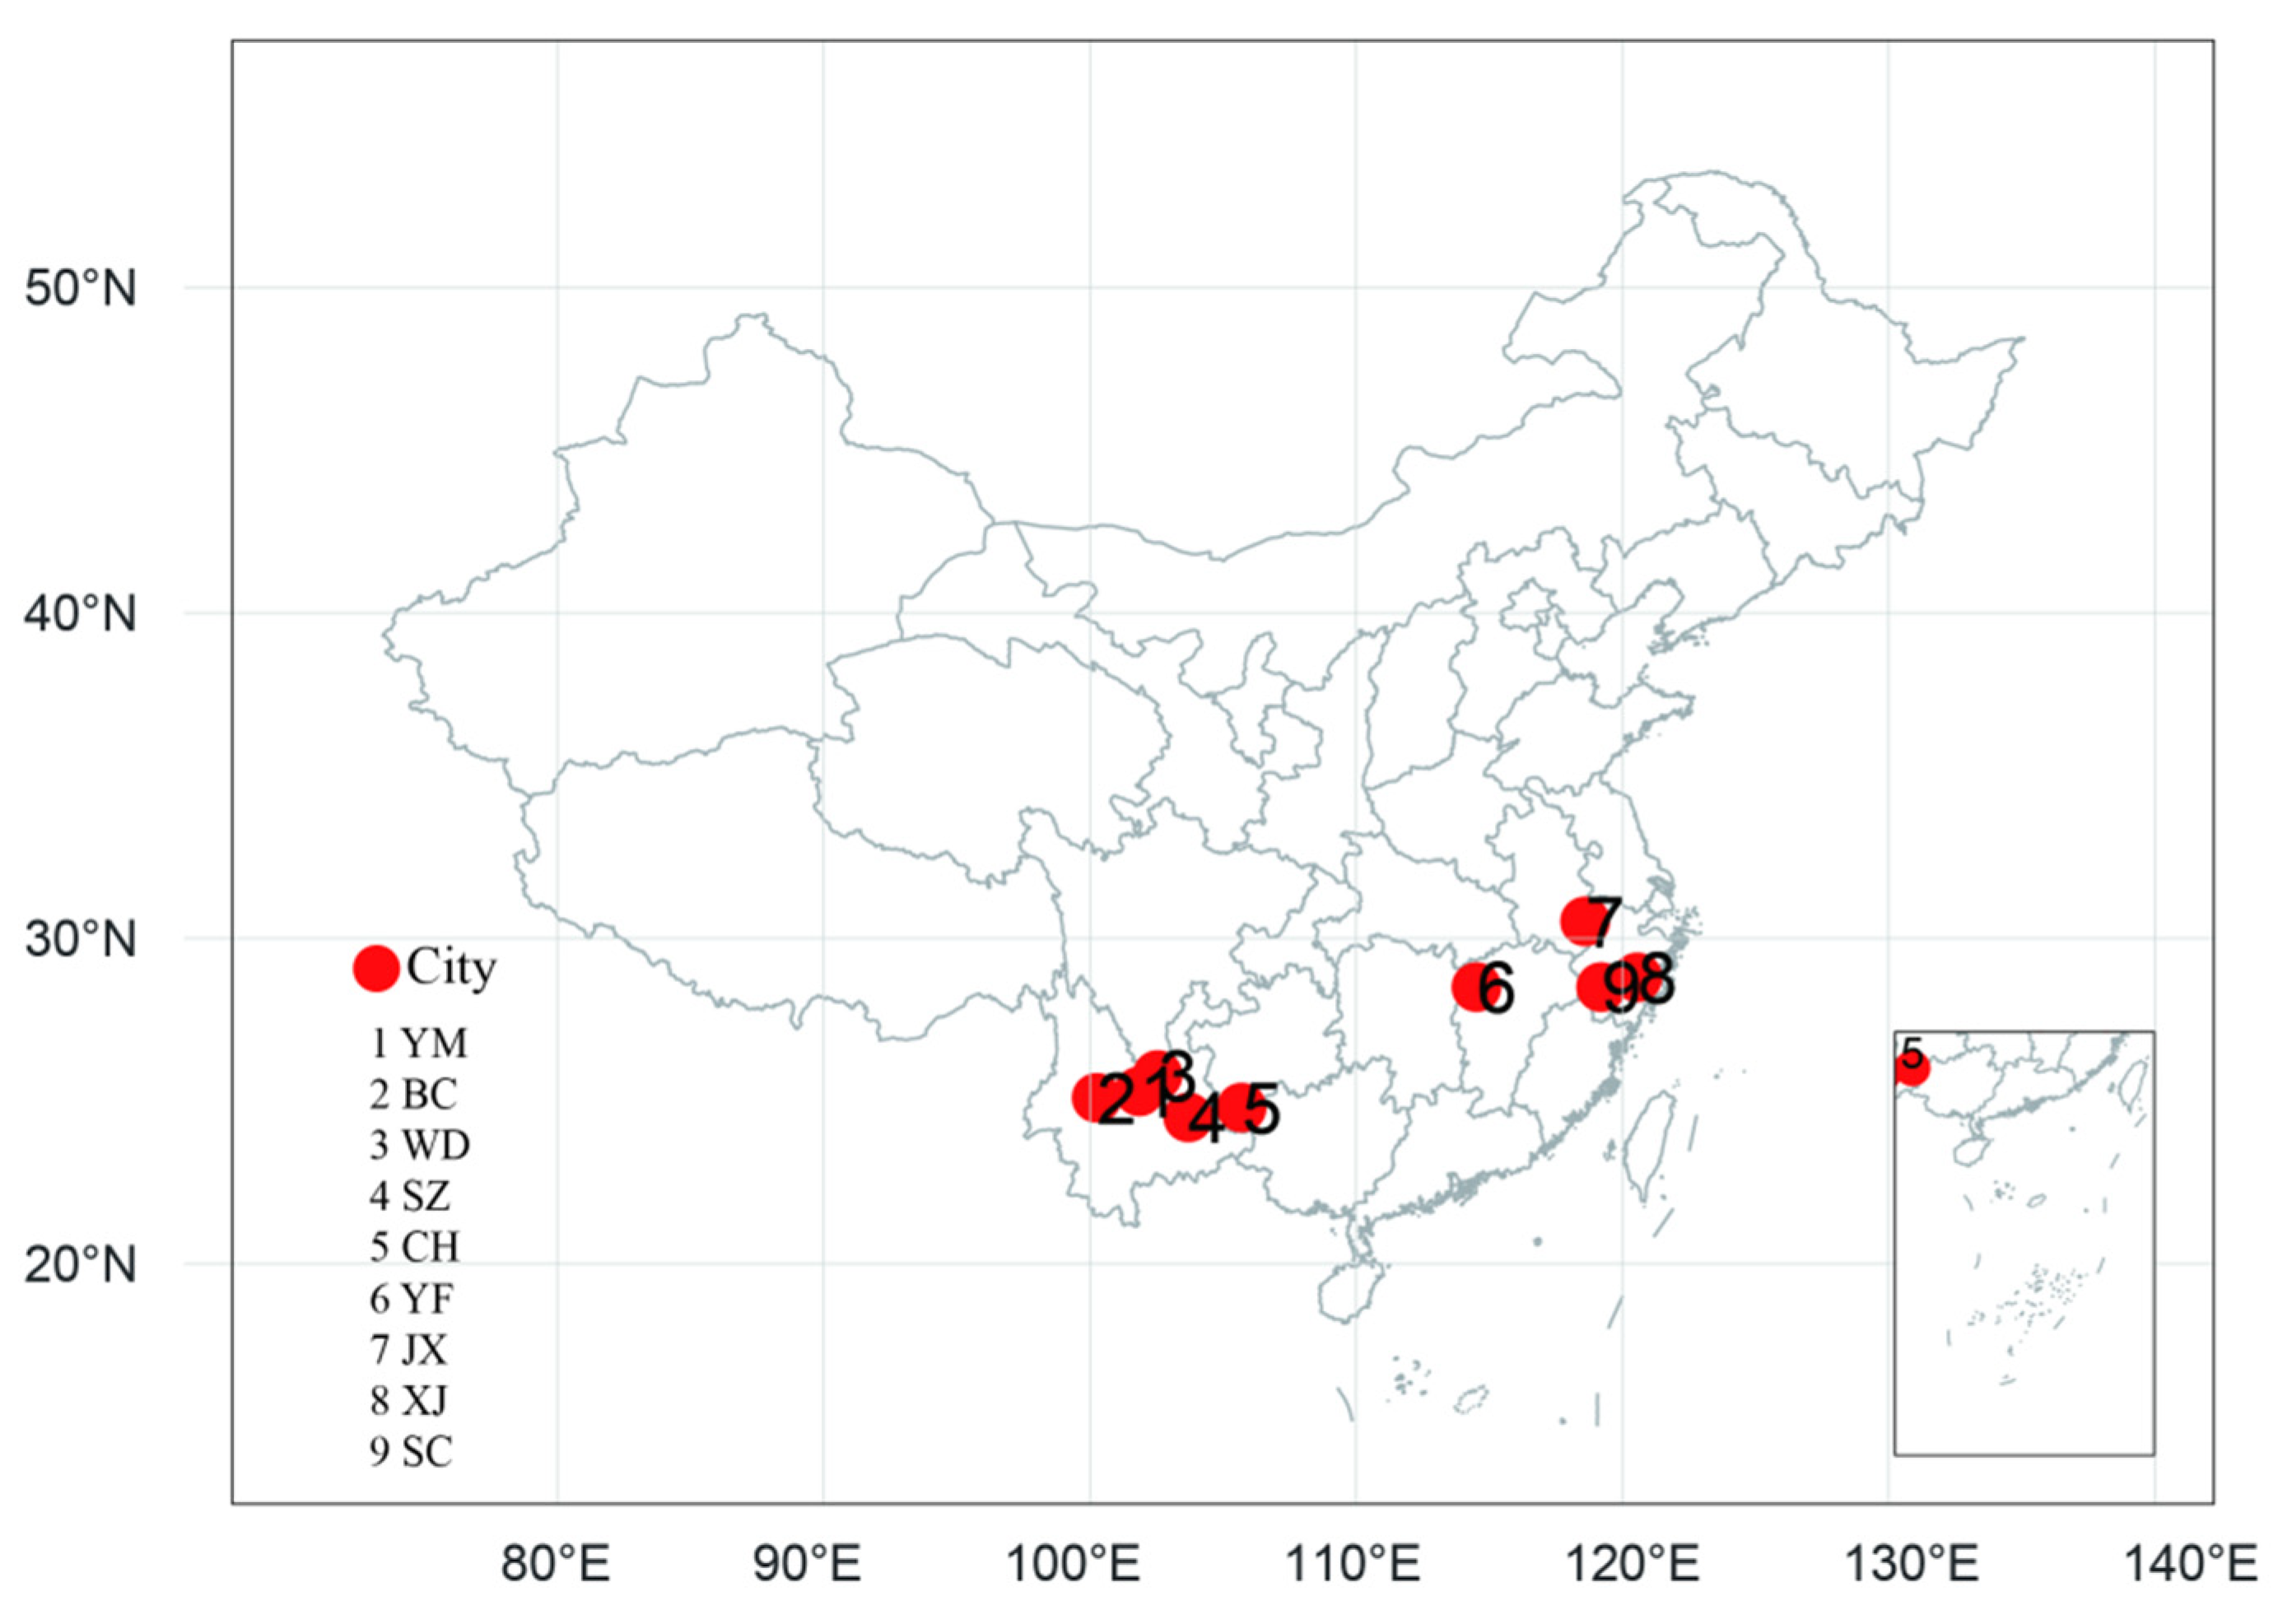
2.1. Sampled Populations

Nine natural populations of T. ciliata var. pubescens were chosen from two main regions, the Yunnan–Kweichow Plateau (YKP) and Eastern China (EC), including the cities of Binchuan, Yuanmou, Wuding, and Shizong in Yunnan Province; Ceheng in Guizhou Province; Xianju and Suichang in Zhejiang Province; Jingxian in Anhui Province; and Yifeng in Jiangxi Province. Both the YKP and EC belong to the subtropical monsoon climate. The YKP is high in the north and low in the south, descending in steps from north to south, with an altitude of 400–3500 m. Therefore, it has a rich and diverse natural environment, with significant climate differences. However, the EC has moderate annual temperatures, abundant rainfall, humid air, and four distinct seasons. Details of the environmental conditions characterizing each population are presented in Table 1 and Figure 1. Fresh leaves were collected from individual canopy trees for a total of 384 individual samples, of which 227 were from the YKP and 157 were from the EC. The leaves were dried rapidly by a ratio of silica gel to leaf biomass of 10:1. GPS (Magellan, eXporist 600, USA) was used to record the position of each individual sample.

2.2. Molecular Analysis

Total genomic DNA was isolated from each sample with the DNeasy Plant Mini Kit (Qiagen, Hilden, Germany). Twenty-five microsatellite loci were analyzed (Table 2), including eight genomic microsatellite markers (Tc01~Tc08) [1] which were previously validated by our research group, and seventeen EST-SSR markers (Tc-A2~Tc-C81) which were obtained through transcriptome sequencing information on the roots, stems, and leaves of T. ciliata var. pubescens. PCR amplification was performed using the MYCYLE PCR Apparatus (BIORED, Hercules, CA, USA). A 10 μL reaction mix was used, comprising 1 μL genomic DNA, 0.2 μM for each forward primers and reverse primers, and 5 μL 2 × Master Mix (TSINGKE, Hangzhou, China). The reaction program of PCR was to undergo pre-denaturation at 94 °C for 4 min, undergo 35 denaturation-annealing cycles (1 min at 94 °C denaturation, 0.5 min at 52–55 °C annealing, and 1 min at 72 °C extension), and finally extend at 72 °C for 10 min. All PCR products were separated on the Qsep100 Genetic Analyzer (Bioptic, Xinbei Taiwan). The sizes of fragments were determined based on an internal lane standard (GeneScan 600 LIZ, Applied Biosystems, Foster City, CA, USA). The banding patterns were manually checked in the Q-Analyzer 2.0 software (Bioptic, Xinbei Taiwan).

2.3. Climatic Data

Bio-climatic data for the 9 populations were extracted from the WorldClim 30-arcsec (ca.1 km) data set (http://www.worldclim.org/) [23]. In total, 22 environmental factors were considered. Three are geographical factors, namely, latitude of the population(Lat), longitude of the population(Lon), and elevation of the population (Ele). The remaining nineteen are bio-climatic factors (Bio1 to Bio19). The description of each bio-climatic factor is shown in Table 3.

2.4. General Statistical Analyses

The mean observed number of alleles (Na), effective number of alleles (Ne), observed heterozygosity (HO), expected heterozygosity (HE), and polymorphism information content (PIC) [24] were calculated for each population using POPGENE 32 (Version 1.32, Edmonton, AB, Canada) [25]. The analysis of molecular variance (AMOVA) for the genetic variation between regions and populations was conducted with ARLEQUIN 3.5 [26]. Significance testing was provided by 1000 permutations. The STRUCTURE 2.3.4 software (CA, USA) [27] was used to compute the most likely number of population clusters (K). The number of possible clusters (K) varied from 2 to 8 with ten replications each, and the most suitable value was selected through comparison. GenAlex6.502 was used for principal coordinate analysis (PCoA) to draw a scatter plot consisting of principal coordinates 1 and 2.

2.5. Identification of Outlier Loci

The detection of outlier loci was performed by means of two different software packages, ARLEQUIN 3.5 [26] and BayeScan [28]. Both methods use locus-specific genetic differentiation (FST) outliers to detect candidate markers under selection [29]. The ARLEQUIN software was used to perform analysis with a hierarchic simulation model. The hierarchic model is supposed to be the most suitable one for populations sharing recent common ancestry, reducing the number of false-positive outlier loci [30]. BayeScan is a Bayesian-based method that depends on a highly differentiated locus [28], relative to background differentiation levels, and selects sites with a false discovery rate (FDR) of less than 0.05 in the results. Both the ARLEQUIN and BayeScan analyses use default settings.

2.6. Genetic Variation Related with Climatic and Geographic Distance

To analyze the correlation between climatic, geographic, and genetic distances, a Mantel test was performed using the vegan package in R version 3.3.2 (R Foundation for Statistical Computing, Vienna, Austria) [31]. Levels of significance was tested with 10,000 permutations. Pairwise genetic and geographic distance matrices were calculated using GenAlex and a standardized Euclidian distance matrix was produced for bioclimatic variables using SPSS v.22 (SPSS Inc., Chicago, IL, USA; http://www.spss.com). We performed redundancy analysis (RDA) by Canoco4.5 to examine the relative contribution of geographic and climatic data, and combination of the variables in driving genetic structure [31]. To avoid an overestimation of the contribution of environmental variables to the population structure, strongly correlated climatic and geographical factors were excluded from the original 22 variables by Pearson’s correlation analysis. The eight remaining variables (Ele, Bio1, Bio2, Bio5, Bio8, Bio9, Bio16, and Bio18) were selected for RDA and environmental association analyses.

2.7. Associations between Microsatellite Allele Frequency and Climatic and Geographical Variables

Pearson’s correlation analysis was used to investigate the associations between allele frequency of outlier loci and different climatic and geographical variables using SPSS 19.0 (SPSS Inc., Chicago, IL, USA). Markers with a frequency of less than 0.05 were removed from the analysis.

3. Results and Analysis

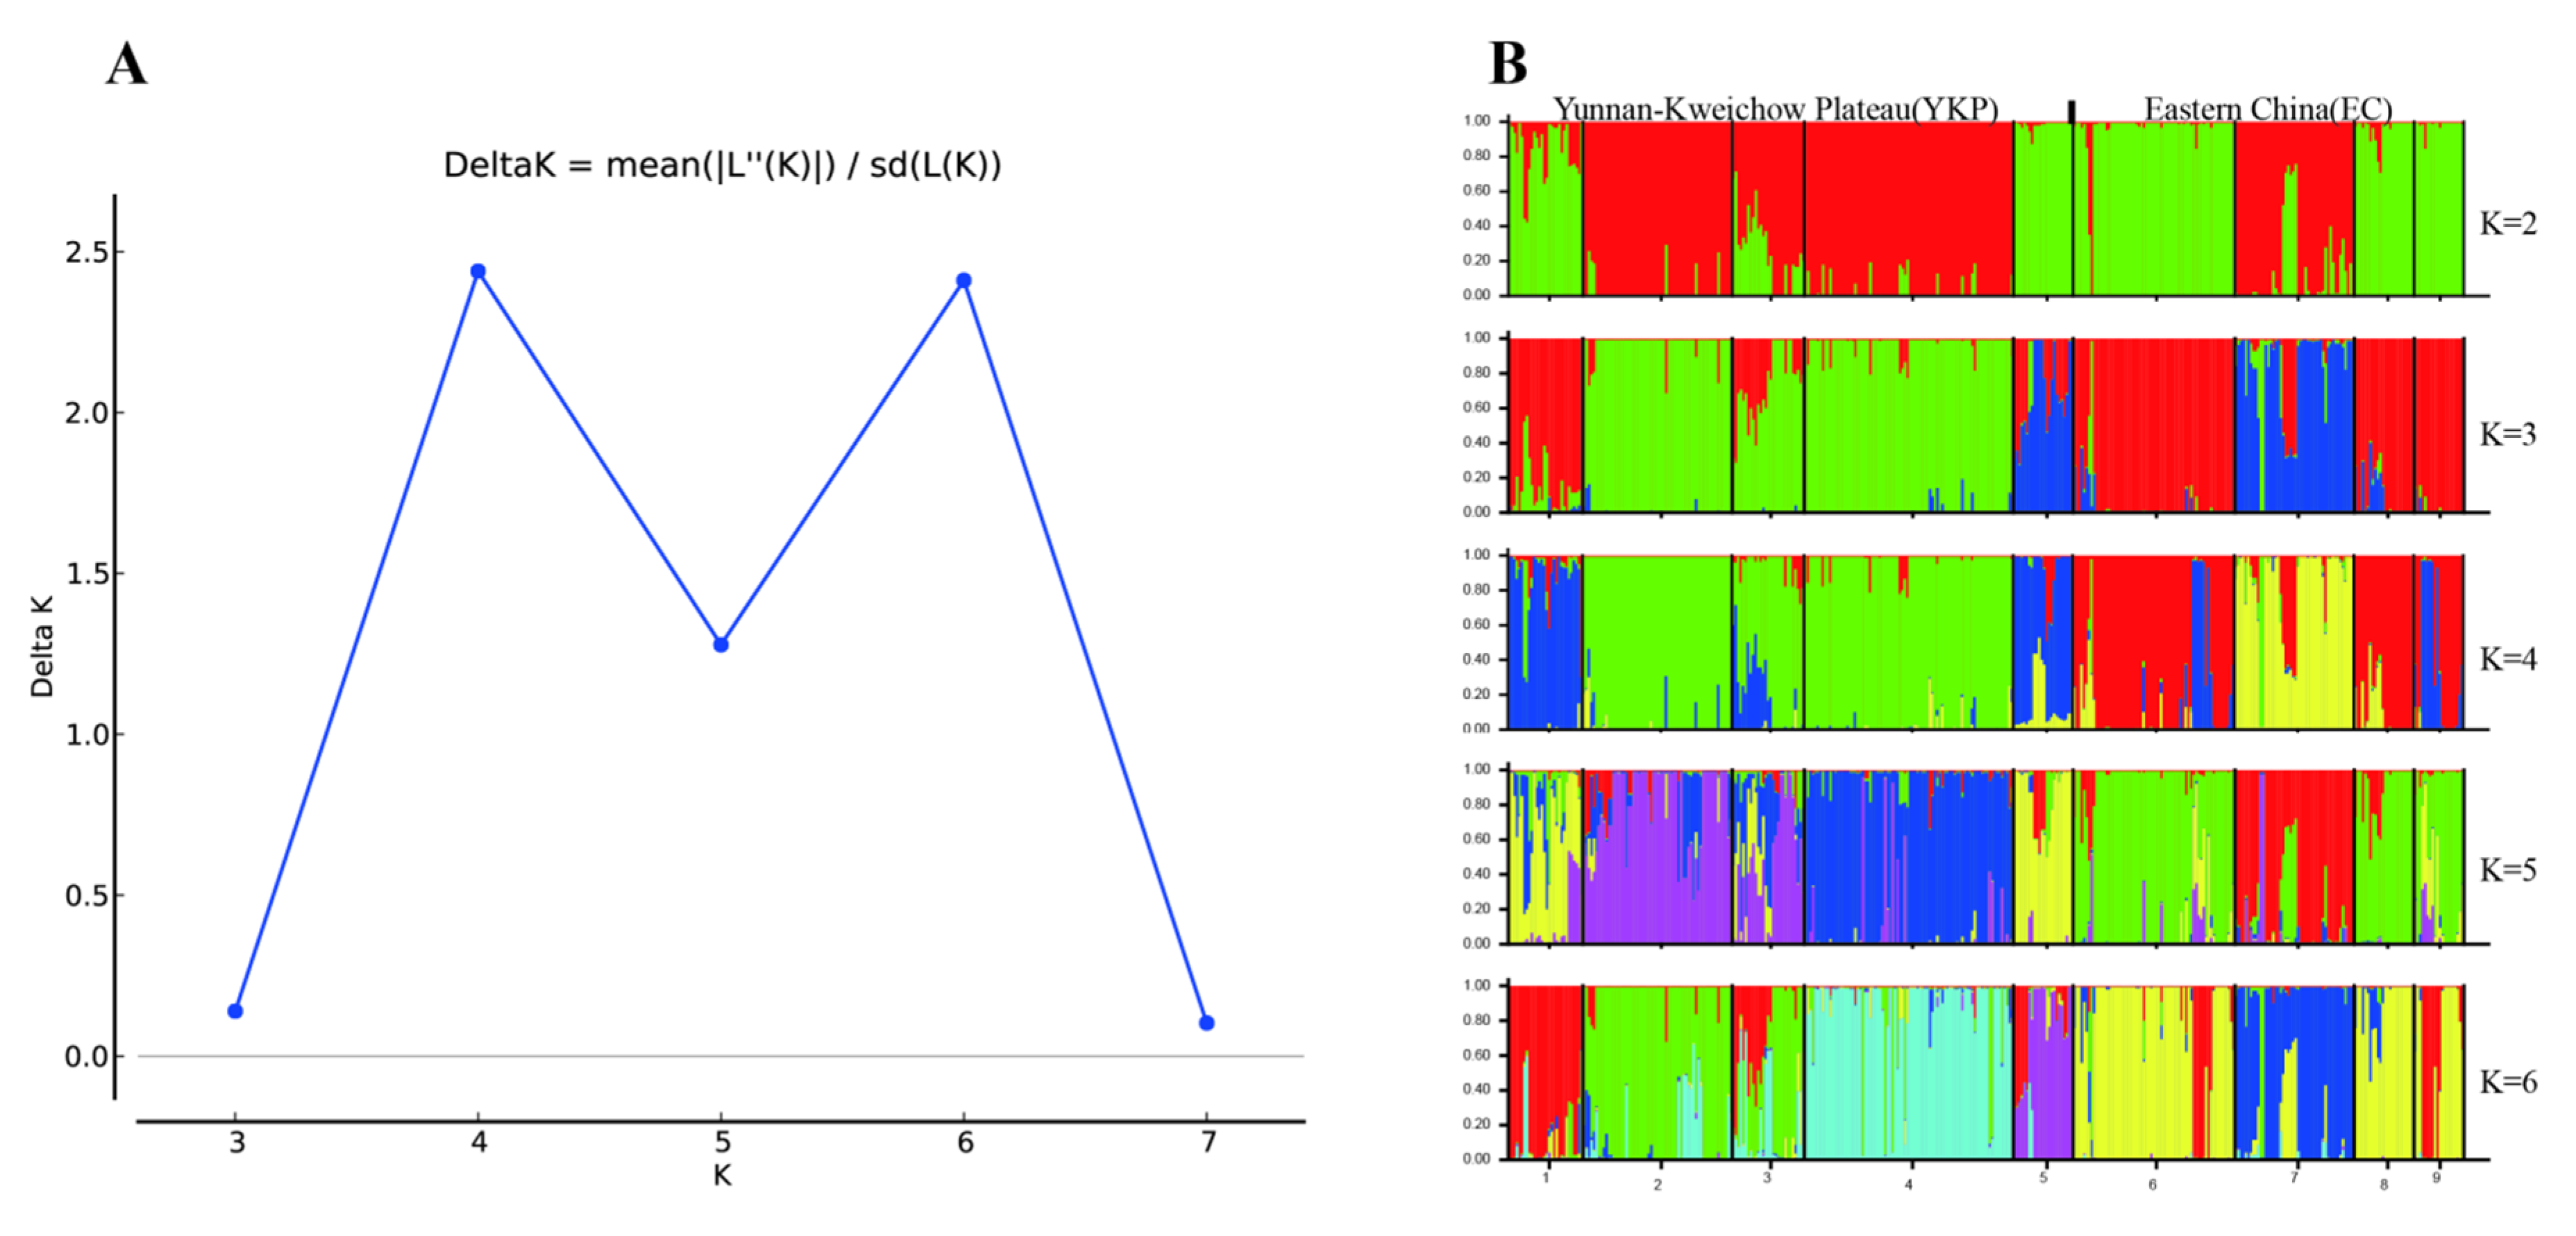
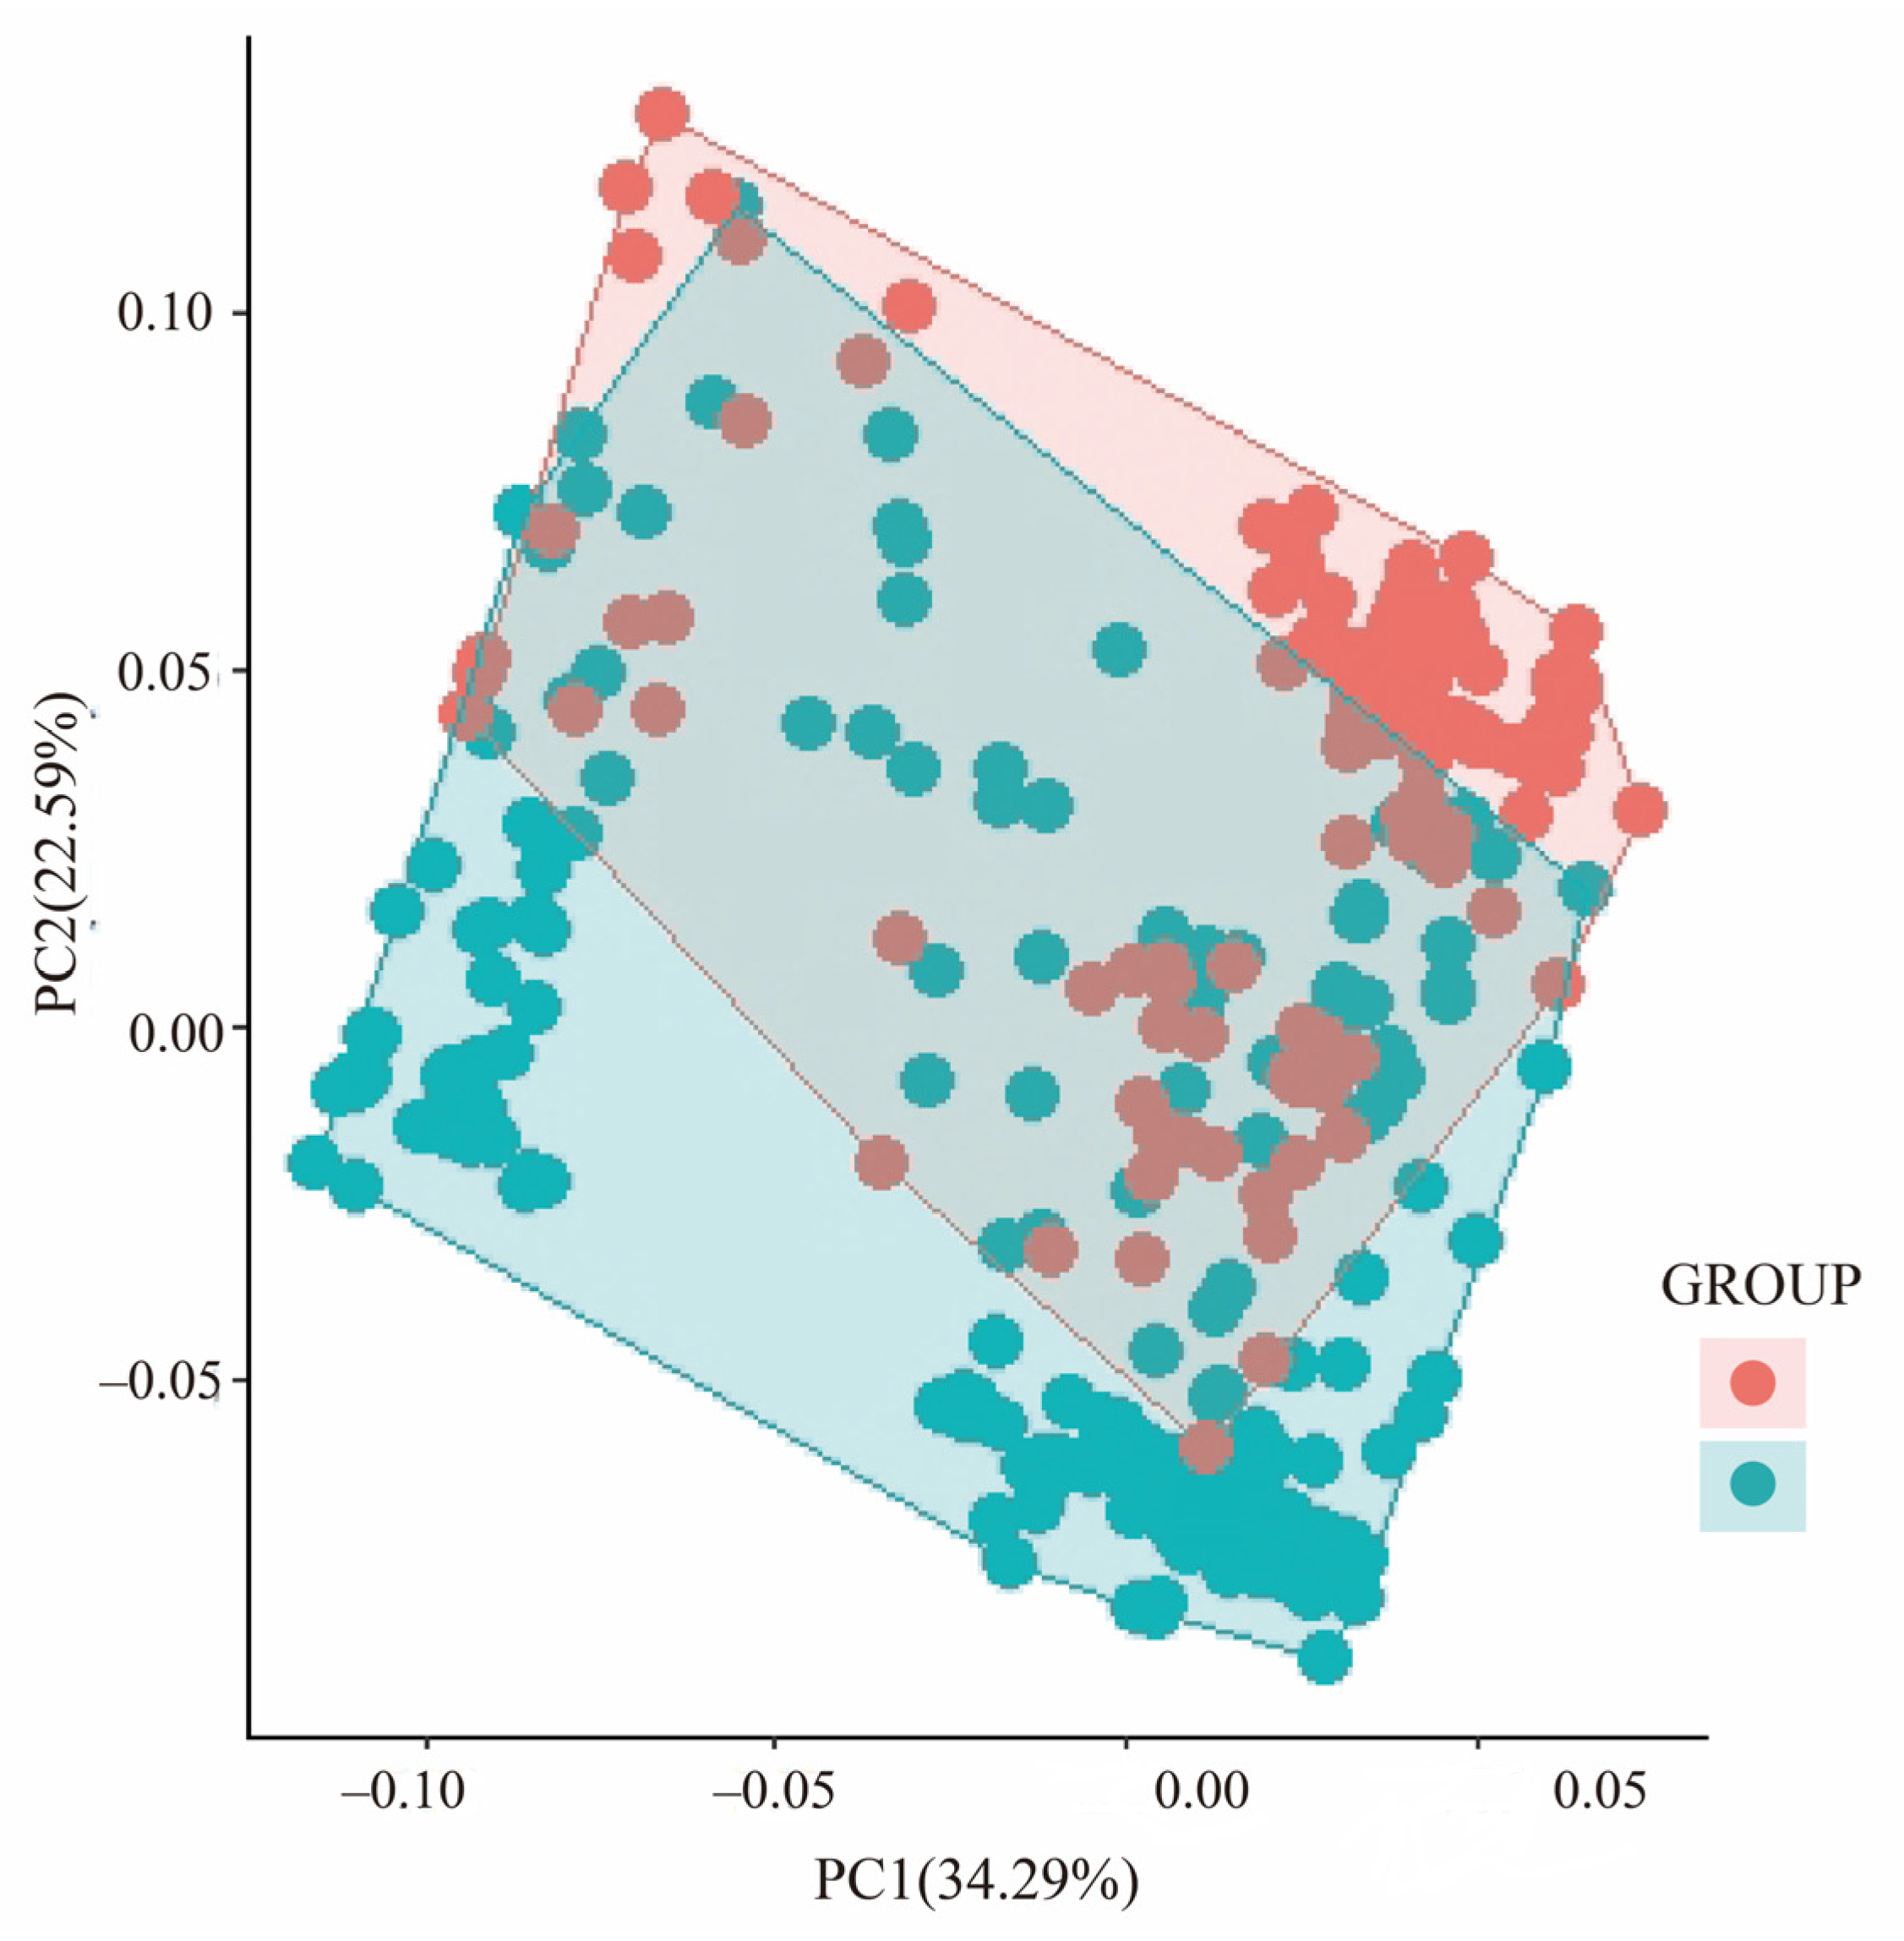
3.1. Genetic Variation and Population Structure

The statistical analysis results are presented in Table 4. The Na ranged from 2.64 in population XJ to 4.04 in population JX with a global mean of 3.46. The Ne ranged from 1.93 in population XJ to 2.82 in population CH, with an average of 2.29. It can be seen that there is a significant difference between the values of Na and Ne. The HO was 0.32–0.74, and the mean value was 0.57. The HE ranged from 0.43 to 0.61 with an average of 0.52. The mean of HO was slightly higher than that of HE.
When analyzing the genetic structure of the populations, the rate of change in the Napierian logarithm probability relative to the standard deviation (ΔK) showed a distinct ΔK peak at K = 4 (Figure 2A). Therefore, it indicated that populations of T. ciliata var. pubescens were structured into four distinct clusters. The clusters were closely related to geography (Figure 2B). As shown in the figure, the distribution was reasonable when K = 4, and the four groups could be divided into two regions (YKP and EC). Principal component analysis (PCoA) was conducted on all samples to further explore the genetic relationship between populations of T. ciliata var. pubescens. The results showed that the first three principal coordinates of the PCoA of 384 individuals explained 34.29%, 22.59%, and 12.61% of the genetic variation, respectively, and accounted for 69.49% of the total variation (Figure 3).

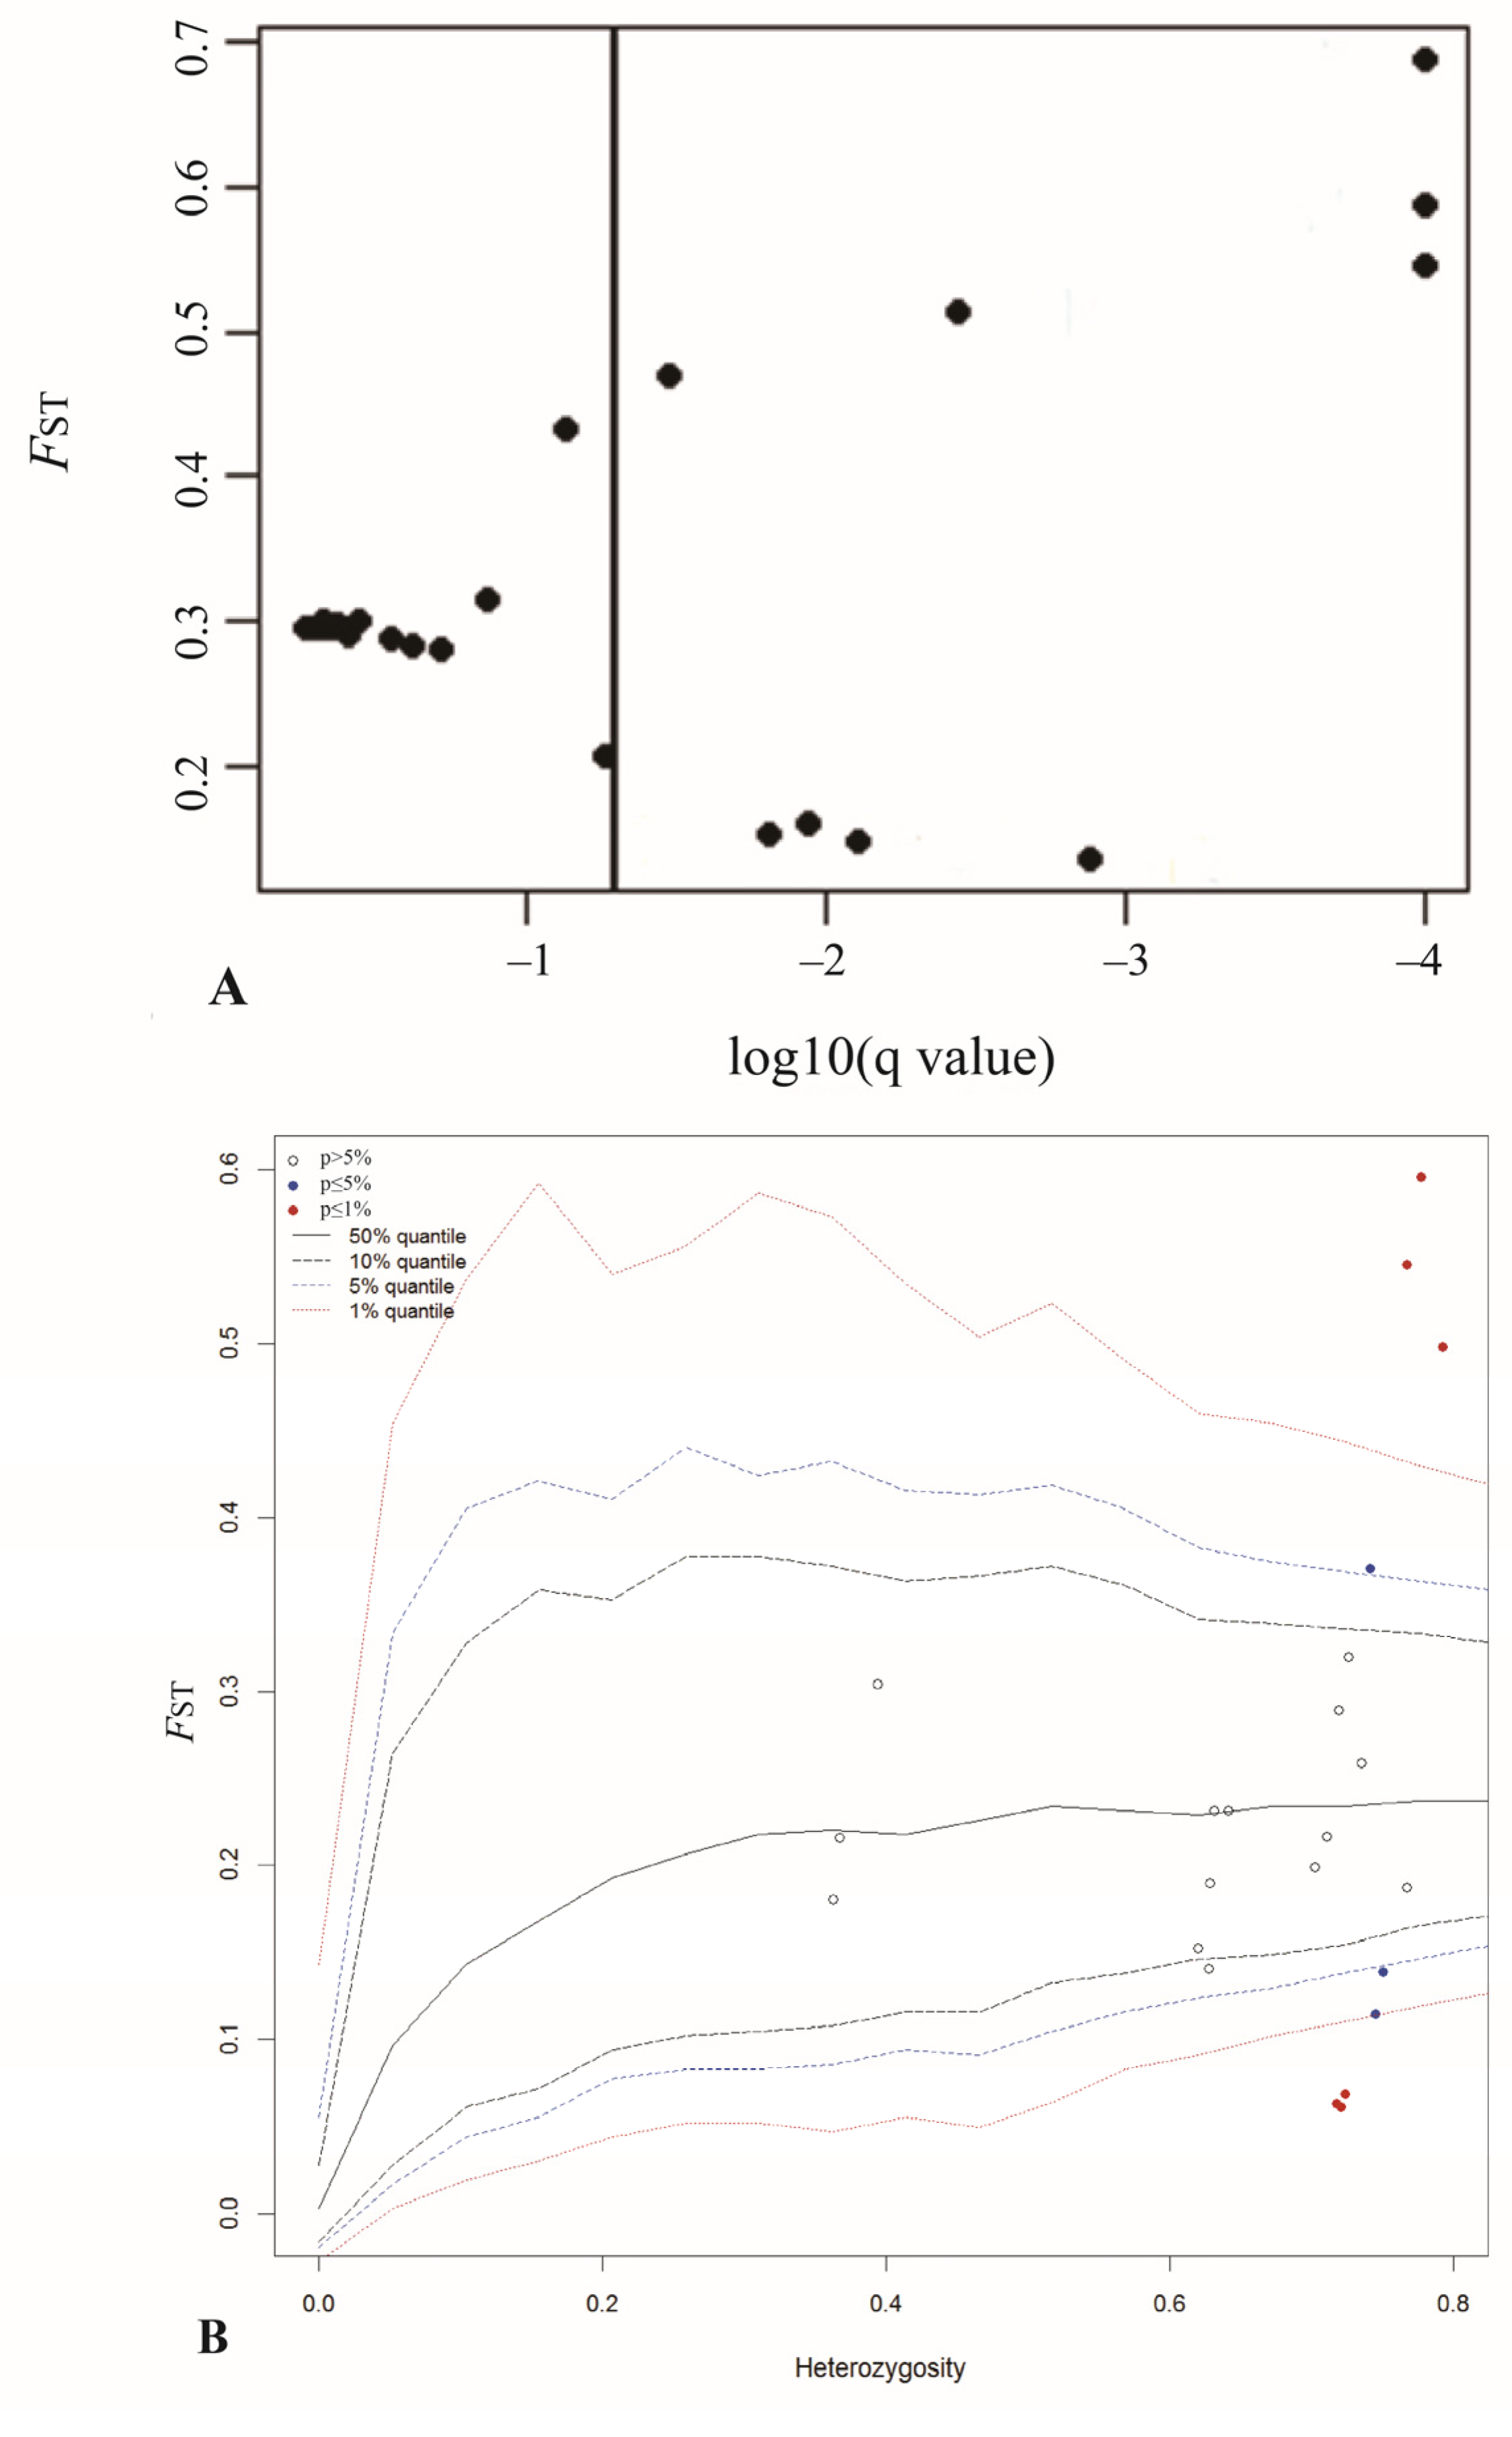
3.2. Genetic Differentiation and the Identification of Outlier Loci

The AMOVA showed highly significant genetic differentiation across levels of aggregation: among regions, among populations, and within populations (Table 5). This indicated that environmental factors partially affected the genetic variation. Genetic variation within populations has the highest variance component (59.1%); the remaining variations occur among regions and populations. The percentage of estimated genetic variation among regions is 10.5%, and the value among populations is 30.4% (Table 5).
Nine outlier loci (FDR = 0.05) were detected by BayeScan, including loci Tc01, Tc02, Tc05, Tc07, Tc-A7, Tc-B11, Tc-B25, Tc-C11, and Tc-C50. The hierarchical approach performed in ARLEQUIN reported six outlier loci with a significant p-value, including Tc05, Tc07, Tc-A7, Tc-B11, Tc-C49, and Tc-C66. Four outlier loci (Tc05, Tc07, Tc-A7, and Tc-B11) were the same in both analysis methods (Figure 4).

3.3. Genetic Variation Explained by Climatic and Geographical Distance

The Mantel test revealed a significant correlation between genetic distance and geographical distance (r  =  0.3815, p  =  0.002), and a significant correlation between genetic distance and climatic distance (r  =  0.5624, p  =  0.003). The results of RDA explained that the variation related with climatic variables played a more important role than that linked to elevation (29.4% and 4.8%, respectively). The percentages of the total eigenvalues of axes 1 and 2 were 31.43% and 21.49%, respectively (Figure 5).

3.4. Associations between Microsatellite Allele Frequency and Climatic and Geographical Variables

The correlations between allele frequencies and the eight selected environmental variables are presented in Table 6. Six alleles (Tc05-1, Tc05-7, Tc07-2, Tc-A7-1, Tc-B11-2, and Tc-B11-4) were associated with temperature variables, namely, mean annual air temperature (Bio1), mean diurnal air temperature range (Bio2), mean daily maximum air temperature of the warmest month (Bio5), mean daily mean air temperatures of the wettest quarter (Bio8), and mean daily mean air temperatures of the driest quarter (Bio9). Four alleles (Tc05-7, Tc07-2, Tc07-5 and Tc-B11-5) were associated with precipitation variables, namely, mean monthly precipitation amount of the wettest quarter (Bio16) and mean monthly precipitation amount of the warmest quarter (Bio18).

4. Discussion

4.1. Population Structure and Genetic Differentiation

Quantifying local adaptation is fundamentally important for population conservation, evolution, and global-change biology [32,33]. Population analyses of adaptive genetic variation have become more sophisticated since FST was first used to investigate local adaptation at the molecular level in 1973 [34,35,36]. In this study, we used landscape genomics modeling to infer local adaptation to climatic and geographical factors in natural populations of T. ciliata var. pubescens. We found high levels of intra-population genetic variation, consistent with other studies of broad-leaved trees [37,38,39,40]. Our STRUCTURE analysis showed that the nine populations of T. ciliata var. pubescens were most parsimoniously grouped into four distinct genetic clusters (cluster1–cluster4).
These clusters likely relate to ecotypes from different geographical regions: cluster1 and cluster2 from the Yunnan–Kweichow Plateau (YKP); cluster3 and cluster4 from Eastern China (EC). However, when two clusters were specified (K = 2) in the STRUCTURE analysis (Figure 2B), the populations did not segregate by region (e.g., BC, WD, SZ, and JX were in one cluster). One possible reason for this could be historical gene flow [41,42,43] between populations of T. ciliata var. pubescens. Estimating gene flow is a vital element in local adaptation studies, since it can have a strong (often antagonistic) effect on local genetic structure [44,45]. However, due to climate change and habitat fragmentation, gene flow is likely restricted among populations of T. ciliata var. pubescens [18]. We speculate that due to the large distance and limited gene exchange, the genetic variation of the population will become smaller and smaller.
Two hypotheses could explain the genetic differentiation among populations observed in this study. First, the distance between the two regions of the Yunnan–Kweichow Plateau and Eastern China (>1000 km) may have inhibited gene flow. Second, significant environmental differences between the two regions may have driven divergent selection and local adaptation in the two regions. Populations in the two regions may represent different ecotypes. Ecotype differentiation can be evaluated by multivariate environmental and genetic distance analyses [46,47]. RDA analysis can combine multiple environmental factors simultaneously, and its results are intuitive, clear, and contain a large amount of information. In this study, the Mantel test and RDA showed that geographical (elevation) and climatic factors have jointly affected the genetic differentiation of T. ciliata var. pubescens.

4.2. Outlier Loci Detection and Associations with Environmental Variables

Four out of twenty-five loci from this study were identified as outlier loci by BayeScan and ARLEQUIN. This result is consistent with previous landscape genomics studies, such as the 2 outlier loci out of 15 loci in Quercus rubra L. and Quercus ellipsoidalis identified by E. J. Hill [48], and the 19 outlier loci out of 144 loci in Picea abies identified by L. Karst [49].
We expected that the outlier loci would be associated with the environmental variables. Pearson’s correlation between allele frequency of outlier loci and geographical and climatic factors showed that climatic variables, such as temperature and precipitation variables (Bio1, Bio2, Bio5, Bio8, Bio9, Bio16, and Bio18), were the main environmental variables affecting the adaptation of T. ciliata var. pubescens. Temperature and precipitation strongly affect the survival of plants, often via complex pathways [50]. Low temperature has adverse effects on plants from small to cellular levels, as well as on tissues and organs, thereby inhibiting their growth, development, and even survival. Precipitation limitations, especially insufficient precipitation during the growing season, can have limitations similar to low temperature on plant growth, development, and reproduction. These environmental factors are likely to act as major drivers of selection in plants [51]. We found the temperature and precipitation variables to be correlated with several of the allele frequencies at the outlier loci in T. ciliata var. pubescens that we studied. Previous studies have shown the prominent role of temperature and precipitation in driving adaptation of plants [52,53,54,55]. The correlations between climate and signals of adaptation in T. ciliata var. pubescens studied here indicate that there should be ample standing genetic variation available in populations of T. ciliata var. pubescens for adaptation to occur in the course of climate change.

5. Conclusions

As a precious tree species in China, T. ciliata var. pubescens is widely distributed, and studying its genetic variation is of great significance. Our study utilized 25 microsatellite markers to conduct genetic variation analysis on 384 samples from the YKP and EC, that revealed a high genetic diversity and significant genetic differentiation among populations of T. ciliata var. pubescens. Significant correlations between genetic distance and climatic and geographical distance were identified, which suggested that climatic and geographical variables were responsible for the adaptive variation among populations. The RDA results indicate that climatic variables had a stronger association with genetic variation than elevation. Eight alleles from four outlier loci are potentially associated with adaptation to two climatic factors: precipitation and temperature. We thus predict that the genetic diversity of T. ciliata var. pubescens will decline due to future climate change, which may exacerbate the endangered form of T. ciliata var. pubescens. Therefore, it is necessary to strengthen the conservation of different geographic populations of T. ciliata var. pubescens, and more research is needed to assess the capabilities of local adaptation to new environmental conditions in populations of T. ciliata var. pubescens. This study analyzed the results of local adaptation of T. ciliata var. pubescens from the perspectives of climate factors and altitude. As for the impact of other factors such as terrain, soil, and human interference on its distribution, further collection and accumulation of relevant data are needed for analysis to reveal its causes more comprehensively. In summary, in order to implement effective management and ecological conservation, more research is needed to evaluate the local adaptability of T. ciliata var. pubescens populations to new environments.

Author Contributions

Y.F. carried out the data analysis, and revised the manuscript; J.D. and Y.W. helped to perform the experiment; J.L. provided suggestions on the experimental design and analyses. All authors have read and agreed to the published version of the manuscript.

Funding

This research was supported by the “National key R & D project” (2021YFD2200305) and the “Zhejiang Science and Technology Major Program on Agricultural New Variety Breeding” (2021C02070-4).

Data Availability Statement

The data presented in this study are available on request from the corresponding author. The data are not publicly available due to the data will be used to write additional articles T. ciliata var. pubescens.

Conflicts of Interest

The authors declare no conflict of interest.

References

  1. Jun, L.; Xiuzong, S.; Yitai, C.; Guiping, H.; Tianlin, W. Isolation of Microsatellite DNA from endangered tree Toona ciliata var. pubescens and optimization of SSR reaction system. China Biotechnol. 2006, 26, 50–55. [Google Scholar]
  2. Zhang, L.; Guo, L.H.; Du, T.Z.; Hu, S.Z. The effects of shading and soil water content on photosynthesis of Toona ciliata var. pubescens seedlings. J. Nanjing For. Univ. 2006, 49, 63–66. [Google Scholar]
  3. Liu, J.; Chen, Y.T.; Sun, Z.X.; Jiang, J.; He, G.; Rao, L.; Wu, T. Spatial Genetic Structure of Toona ciliata var. pubescens Populations in Terms of Spatial Autocorrelation Analysis. Sci. Silvae Sin. 2008, 44, 45–52. [Google Scholar]
  4. Jun, L.; Jingmin, J.; Yitai, C. Genetic diversity of central and peripheral populations of Toona ciliata var. pubescens, an endangered tree species endemic to China. Genet. Mol. Res. GMR 2014, 13, 4579–4590. [Google Scholar]
  5. Liguo, F. China Plant Red Data Book: Rare and Endangered Plants; Science Press: Beijing, China, 1992. [Google Scholar]
  6. Luhuan, L.; Shuihu, J. Spermatophyta flora of Gutianshan Nature Reserve in Zhejiang. J. Beijing For. Univ. 2000, 22, 33–39. [Google Scholar]
  7. Guangfu, Z. Study on rare and threatened plants of Anhui and their conservation. J. Anhui Norm. Univ. 2000, 23, 36–40. [Google Scholar]
  8. Xinzhong, L.; Heping, W. Scientific Investigation and Research on Guanshan Natural Reserve in Jiangxi Province; Forestry Press: Beijing, China, 2005. [Google Scholar]
  9. Savolainen, O.; Lascoux, M.; Merilä, J. Ecological genomics of local adaptation. Nat. Rev. Genet. 2013, 14, 807–820. [Google Scholar] [CrossRef]
  10. Brousseau, L.; Postolache, D.; Lascoux, M.; Drouzas, A.D.; Källman, T.; Leonarduzzi, C.; Liepelt, S.; Piotti, A.; Popescu, F.; Roschanski, A.M.; et al. Local Adaptation in European Firs Assessed through Extensive Sampling across Altitudinal Gradients in Southern Europe. PLoS ONE 2016, 11, e158216. [Google Scholar] [CrossRef]
  11. Savolainen, O.; Knürr, T. Gene Flow and Local Adaptation in Trees. Annu. Rev. Ecol. Evol. Syst. 2007, 38, 595–619. [Google Scholar] [CrossRef]
  12. Morgenstern, E.K. Geographic Variation in Forest Trees: Genetic Basis and Application of Knowledge in Silviculture; UBC Press: Vancouver, BC, USA, 1996. [Google Scholar]
  13. Keller, S.R.; Soolanayakanahally, R.Y.; Guy, R.D.; Silim, S.N.; Olson, M.S.; Tiffin, P. Climate-driven local adaptation of ecophysiology and phenology in balsam poplar, Populus balsamifera L. (Salicaceae). Am. J. Bot. 2011, 98, 99–108. [Google Scholar] [CrossRef]
  14. Howe, G.T.; Aitken, S.N.; Neale, D.B.; Jermstad, K.D.; Wheeler, N.C.; Chen, T.H. From genotype to phenotype: Unraveling the complexities of cold adaptation in forest trees. Can. J. Bot. 2003, 81, 1247–1266. [Google Scholar] [CrossRef]
  15. Davis, M.B. Range shift and adaptive response to Quaternary climate change. Science 2001, 292, 673–679. [Google Scholar] [CrossRef] [PubMed]
  16. Mosca, E.L.E.N.A.; Eckert, A.J.; Di Pierro, E.A.; Rocchini, D.; La Porta, N.; Belletti, P.; Neale, D.B. The geographical and environmental determinants of genetic diversity for four alpine conifers of the European Alps. Mol. Ecol. 2015, 21, 5530–5545. [Google Scholar] [CrossRef]
  17. Holderegger, R.; Kamm, U.; Gugerli, F. Adaptive vs. neutral genetic diversity: Implications for landscape genetics. Landsc. Ecol. 2006, 21, 797–807. [Google Scholar] [CrossRef]
  18. Lowry, D.B. Landscape evolutionary genomics. Biol. Lett. 2010, 6, 502–504. [Google Scholar] [CrossRef]
  19. Schoville, S.D.; Bonin, A.; François, O.; Lobreaux, S.; Melodelima, C.; Manel, S. Adaptive Genetic Variation on the Landscape: Methods and Cases. Annu. Rev. Ecol. Evol. Syst. 2012, 43, 23–43. [Google Scholar] [CrossRef]
  20. Coop, G.; Witonsky, D.; Di Rienzo, A.; Pritchard, J.K. Using Environmental Correlations to Identify Loci Underlying Local Adaptation. Genetics 2010, 185, 1411. [Google Scholar] [CrossRef]
  21. Hanson, J.O.; Rhodes, J.R.; Riginos, C.; Fuller, R.A. Environmental and geographic variables are effective surrogates for genetic variation in conservation planning. Proc. Natl. Acad. Ences 2017, 114, 12755–12760. [Google Scholar] [CrossRef]
  22. Riccioni, G.; Cariani, A.; Ferrara, G.; Cannas, R.; Melis, R.; Stagioni, M.; Addis, P.; Tinti, F. Evolutionary constraints limiting the variation of Expressed Sequence Tag-linked microsatellite loci, prevent the detection of local adaptation in Mediterranean Bluefin tuna. Fish. Res. 2017, 190, 157–163. [Google Scholar] [CrossRef]
  23. Hijmans, R.J.; Cameron, S.E.; Parra, J.L.; Jones, P.G.; Jarvis, A. Very high resolution interpolated climate surfaces for global land areas. Int. J. Climatol. 2005, 25, 1965–1978. [Google Scholar] [CrossRef]
  24. Nei, M. Estimation of average heterozygosity and genetic distance from a small number of individuals. Genetics 1978, 89, 583–590. [Google Scholar] [CrossRef]
  25. Yeh, F.; Yang, R.C. POPGENE 1.32; POPGENE-for the Analysis of Genetic Variation among and within Populations Using Co-dominant and Dominant Markers: Edmonton, Canada, 2000. [Google Scholar]
  26. Excoffier, L.; Lischer, H.E.L. Arlequin suite ver 3.5: A new series of programs to perform population genetics analyses under Linux and Windows. Mol. Ecol. Resour. 2010, 10, 564–567. [Google Scholar] [CrossRef] [PubMed]
  27. Pritchard, J.K.; Stephens, M.J.; Donnelly, P.J. Inference of Population Structure Using Multilocus Genotype Data. Genetics 2000, 155, 945–959. [Google Scholar] [CrossRef] [PubMed]
  28. Gaggiotti, F.O. A Genome-Scan Method to Identify Selected Loci Appropriate for Both Dominant and Codominant Markers: A Bayesian Perspective. Genetics 2008, 180, 977–993. [Google Scholar]
  29. Beaumont, M.A.; Nichols, R.A. Evaluating Loci for Use in the Genetic Analysis of Population Structure. Proc. R. Soc. Lond. 1996, 263, 1619–1626. [Google Scholar]
  30. Excoffier, L.; Hofer, T.; Foll, M. Detecting loci under selection in a hierarchically structured population. Heredity 2009, 103, 285–298. [Google Scholar] [CrossRef]
  31. Oksanen, J.; Blanchet, F.G.; Kindt, R.; Legendre, P.; Minchin, P.; O’Hara, R.B.; Simpson, G.; Solymos, P.; Stevens, M.H.H.; Wagner, H. Vegan: Community Ecology Package. In R package Version 2.0–2; Vegan: Community Ecology Package; R Foundation for Statistical Computing: Vienna, Austria, 2011. [Google Scholar]
  32. Lascoux, M.; Glémin, S.; Savolainen, O. Local Adaptation in Plants. In eLS; John Wiley & Sons, Ltd: Chichester, UK, 2016. [Google Scholar]
  33. Leimu, R.; Fischer, M. A meta-analysis of local adaptation in plants. PLoS ONE 2008, 3, e4010. [Google Scholar] [CrossRef]
  34. Lewontin, R.C.; Krakauer, J. Distribution of gene frequency as a test of the theory of the selective neutrality of polymorphisms. Genetics 1973, 74, 175–195. [Google Scholar] [CrossRef]
  35. Abebe, T.D.; Naz, A.A.; Léon, J. Landscape genomics reveal signatures of local adaptation in barley (Hordeum vulgare L.). Front. Plant Sci. 2015, 6, 813. [Google Scholar] [CrossRef]
  36. Miao, C.Y.; Li, Y.; Yang, J.; Mao, R.L. Landscape genomics reveal that ecological character determines adaptation: A case study in smoke tree (Cotinus coggygria Scop.). BMC Evol. Biol. 2017, 17, 202. [Google Scholar] [CrossRef]
  37. Brown, J.A.; Beatty, G.E.; Montgomery, W.I.; Provan, J. Broad-scale genetic homogeneity in natural populations of common hazel (Corylus avellana) in Ireland. Tree Genet. Genomes 2016, 12, 122. [Google Scholar] [CrossRef]
  38. Ebrahimi, A.; Nejad Sattari, T.; Assadi, M.; Larijani, K.; Mehregan, I. Morphological and Molecular Differentiation in Populations of Persian Oak (Quercus Brantii Lindl.) in Southwestern Iran. Egypt. J. Bot. 2017, 57, 379–393. [Google Scholar] [CrossRef]
  39. Graignic, N.; Tremblay, F.; Bergeron, Y. Influence of northern limit range on genetic diversity and structure in a widespread North American tree, sugar maple (Acer saccharum Marshall). Ecol. Evol. 2018, 8, 2766–2780. [Google Scholar] [CrossRef]
  40. Szasz-Len, A.M.; Konnert, M. Genetic diversity in European beech (Fagus sylvatica L.) seed stands in the Romanian Carpathians. Ann. For. Res. 2018, 61, 65–80. [Google Scholar] [CrossRef]
  41. Walton, C.; Handley, J.M.; Collins, F.H.; Baimai, V.; Harbach, R.E.; Deesin, V.; Butlin, R.K. Genetic population structure and introgression in Anopheles dirus mosquitoes in South-east Asia. Mol. Ecol. 2001, 10, 569–580. [Google Scholar] [CrossRef] [PubMed]
  42. Hahn, T.; Kettle, C.J.; Ghazoul, J.; Frei, E.R.; Matter, P.; Pluess, A.R. Patterns of Genetic Variation across Altitude in Three Plant Species of Semi-Dry Grasslands. PLoS ONE 2012, 7, e41608. [Google Scholar] [CrossRef]
  43. Samuk, K.; Owens, G.L.; Delmore, K.E.; Miller, S.E.; Rennison, D.J.; Schluter, D. Gene flow and selection interact to promote adaptive divergence in regions of low recombination. Mol. Ecol. 2017, 26, 4378–4390. [Google Scholar] [CrossRef]
  44. Slatkin, M. Gene Flow in Natural Populations. Annu. Rev. Ecol. Syst. 1985, 16, 393–430. [Google Scholar] [CrossRef]
  45. Shen, D.; Bo, W.; Xu, F.; Wu, R. Genetic diversity and population structure of the Tibetan poplar (Populus szechuanica var. tibetica) along an altitude gradient. BMC Genet. 2014, 15, S11. [Google Scholar] [CrossRef]
  46. Temunović, M.; Franjić, J.; Satovic, Z.; Grgurev, M.; Frascaria-Lacoste, N.; Fernández-Manjarrés, J.F. Environmental Heterogeneity Explains the Genetic Structure of Continental and Mediterranean Populations of Fraxinus angustifolia Vahl. PLoS ONE 2012, 7, e42764. [Google Scholar] [CrossRef]
  47. Yuan, S.; Guo, C.; Ma, L.; Wang, R. Environmental conditions and genetic differentiation:what drives the divergence of coexisting Leymus chinensis ecotypes in a large-scale longitudinal gradient? J. Plant Ecol. 2016, 9, 616–628. [Google Scholar] [CrossRef]
  48. Lind, J.F.; Gailing, O. Genetic structure of Quercus rubra L. and Quercus ellipsoidalis E. J. Hill populations at gene-based EST-SSR and nuclear SSR markers. Tree Genet. Genomes 2013, 9, 707–722. [Google Scholar] [CrossRef]
  49. Di Pierro, E.A.; Mosca, E.; González-Martínez, S.C.; Binelli, G.; Neale, D.B.; La Porta, N. Adaptive variation in natural Alpine populations of Norway spruce (Picea abies [L.] Karst) at regional scale: Landscape features and altitudinal gradient effects. For. Ecol. Manag. 2017, 405, 350–359. [Google Scholar] [CrossRef]
  50. Körner, C. Alpine Plant life: Functional Plant Ecology of High Mountain Ecosystems: With 218 Figures, 4 Color Plates and 47 Tables; Springer: Amsterdam, The Netherlands, 2003. [Google Scholar]
  51. Chaves, M.M.; Maroco, J.P.; Pereira, J.S. Understanding plant responses to drought-from genes to the whole plant. Funct. Plant Biol. 2003, 30, 239–264. [Google Scholar] [CrossRef] [PubMed]
  52. Skøt, L.; Sackville Hamilton, N.R.; Mizen, S.; Chorlton, K.H.; Thomas, I.D. Molecular genecology of temperature response in Lolium perenne: 2. association of AFLP markers with ecogeography. Mol. Ecol. 2002, 11, 1865–1876. [Google Scholar] [CrossRef] [PubMed]
  53. Richardson, B.A.; Rehfeldt, G.E.; Kim, M.S. Congruent climate-related genecological responses from molecular markers and quantitative traits for western white pine (Pinus monticola). Int. J. Plant Sci. 2009, 170, 1120–1131. [Google Scholar] [CrossRef]
  54. Manel, S.; Poncet, B.N.; Legendre, P.; Gugerli, F.; Holderegger, R. Common factors drive adaptive genetic variation at different spatial scales in Arabis alpina. Mol. Ecol. 2010, 19, 3824–3835. [Google Scholar] [CrossRef]
  55. Manel, S.; Gugerli, F.; Thuiller, W.; Alvarez, N.; Legendre, P.; Holderegger, R.; Gielly, L.; Taberlet, P.; IntraBioDiv Consortium. Broad-scale adaptive genetic variation in alpine plants is driven by temperature and precipitation. Mol. Ecol. 2012, 21, 3729–3738. [Google Scholar] [CrossRef]
Figure 1. Distribution of sampled natural populations of T. ciliata var. pubescens. The red dot represents the location of the sampling city, and the numbers 1–9 represent the name of the city.
Forests 14 01998 g001
Figure 2. Analysis results of the genetic structure of the nine populations of T. ciliata var. pubescens. (A) The relationship between Delta K and K values. (B) The genetic structure of the T. ciliata var. pubescens population with different K values (K = 4–6).
Forests 14 01998 g002
Figure 3. The principal coordinate analysis (PCoA) of the 384 T. ciliata var. pubescens individuals.
Forests 14 01998 g003
Figure 4. Results of the BayeScan search for putative outlier loci affected by selection. (A) This plot presents FST against log10(q-value), which is the FDR analog of the p-value. The line represents threshold FDR = 0.05 and the red dots are the outlier loci that are potentially affected by selection. (B) Outlier loci were detected under the hierarchical island model (HIM) with ARLEQUIN 3.5. Loci significant at 5% (blue dots) and 1% (red dots) are indicated.
Forests 14 01998 g004
Figure 5. RDA results of relative contributions of climate and altitude.
Forests 14 01998 g005
Table 1. Geographic location and individual samples for nine natural populations of T. ciliata var. pubescens.
PopulationNo.ProvinceRegionLongitudeLatitudeAltitude/mIndividual Samples
YifengYFJiangxiEC114°29′ E28°30′ N37565
JingxianJXAnhuiEC118°35′ E30°31′ N45048
XianjuXJZhejiangEC120°32′ E28°48′ N62024
SuichangSCZhejiangEC119°12′ E28°30′ N51020
BinchuanBCYunnanYKP100°16′ E25°02′ N152060
YuanmouYMYunnanYKP101°49′ E25°17′ N123030
WudingWDYunnanYKP102°08′ E25°47′ N170229
ShizongSZYunnanYKP103°42′ E24°21′ N91284
CehengCHGuizhouYKP105°40′ E24°36′ N71024
Table 2. Characteristics of 25 microsatellite loci developed in T. ciliata var. pubescens.
LocusPrimer Sequences (5′–3′)Repeat MotifAllele Size (bp)Ta (°C)GenBank Accession No.
Tc01F:GACTCGTGACACTTAGCCTGTA(TTTCTC)723155DQ453903
R:CTGGCGTAATCATGGTCATAC
Tc02F:TAGGAAAGGCAAGGTGGG(AG)142055DQ453904
R:GGGTGGTCGATGAGGGTT
Tc03F:AGTAATAGCCTGTAGAGCAG(AG)1324255DQ453905
R:AGAGTGGGGTGGTCGATGAG
Tc04F:GAAACCAGCAGGCAGAGC(AG)1023055DQ453906
R:GAAGAAGGGTGAGCGAGA
Tc05F:GATTACGCCAGGCAAACG(CT)629055DQ453907
R:TTGAATATGGGAGAAGGT
Tc06F:ATGGATGAGTGTGCGATAGG(TC)728055DQ453912
R:TGTGATGTAGGAGTCTGAAC
Tc07F:TGTCTCAGTTTATGCTGGCGT(TC)826055DQ453914
R:CTGCCCAATCAACAAGAG
Tc08F:TCAATGCAATTTAGGAGGAA(GA)829152DQ778303
R:TGCTTGTTGAACCCTGTG
Tc-A2F:TGGAAAGATTTCATGGGCTC(TTC)519960MH593319
R:GGTGTGAATTGTCGGCTGTA
Tc-A3F:AATGTGGAATGGAATGGAGC(TA)627260MH593320
R:CGTCTCTTTCCCAACCTCAC
Tc-A7F:GGGTCCATTTCTCAGTGGTC(TGGGG)516659MH593321
R:TTCAACTCATCCCGTTCACA
Tc-A9F:TCGGGTGGTAAGGCTAAAGA(AGC)523460MH593322
R:TTTTGCATTGCGTAGCATTC
Tc-A12F:GAGATCGGTCCCTCTTCTCC(CTT)518360MH593323
R:TAGCGGAGGGGATAGGAAGT
Tc-B4F:CCTGGGAAAGTTGTCAGCTC(GCA)514960MH593324
R:CAAGCTGGGTTTCTTCTTGG
Tc-B11F:AGATCAAATCCGGGGAGATT(TA)613360MH593325
R:CAGCAAAGCCAACTCATCAA
Tc-B25F:CAGTGCGATCATCACCCTTA(TA)627360MH593326
R:GGTTCCGGGATTGTAGGACT
Tc-B26F:GGAGTTGCCATGGATGAAGT(GCT)620760MH593327
R:CCAGGATCAGCAACCTCAAT
Tc-B27F:GGCAGAGAAGAGCGGTTTTA(AG)819160MH593328
R:CGGATCTTTCGCAACGTAGT
Tc-C11F:CAAGCGAAGAGAGAGAAAGAGG(AGA)519560MH593329
R:ACCAAAGCTTTAGGCAGCAA
Tc-C26F:AACAGAAATTCGCCAACCAG(AAC)725060MH593330
R:AATTCACACCAGCCACTTCC
Tc-C49F:TAAACCTCCCAAGGTAGCGA(TGC)626760MH593331
R:GCACGACAGCACTTCATGTT
Tc-C50F:TGGACACCAAGGGATCTAGC(AGC)523560MH593332
R:TTTGGGTCCATGATCCATCT
Tc-C66F:GCACAGGTCATGAAAGAGCA(TA)625060MH593333
R:CACCAGCAAAACGAAGAACA
Tc-C77F:CGGAAAAACCTCAATTGTTTTG(AT)822960MH593334
R:TGCAATAACAGCACCAGCTC
Tc-C81F:AACGGTCAGAATCTGGATGG(GGT)626960MH593335
R:GCACCACCACCCCTAGAGTA
Table 3. Bio1–Bio19 for analyzing relative contributions.
Factors NameDescription
Climate variablesBio1mean annual air temperature
Bio2mean diurnal air temperature range
Bio3isothermality
Bio4temperature seasonality
Bio5mean daily maximum air temperature of the warmest month
Bio6mean daily minimum air temperature of the coldest month
Bio7annual range of air temperature
Bio8mean daily mean air temperatures of the wettest quarter
Bio9mean daily mean air temperatures of the driest quarter
Bio10mean daily mean air temperatures of the warmest quarter
Bio11mean daily mean air temperatures of the coldest quarter
Bio12annual precipitation amount
Bio13precipitation amount of the wettest month
Bio14precipitation amount of the driest month
Bio15precipitation seasonality
Bio16mean monthly precipitation amount of the wettest quarter
Bio17mean monthly precipitation amount of the driest quarter
Bio18mean monthly precipitation amount of the warmest quarter
Bio19mean monthly precipitation amount of the coldest quarter
Table 4. Summary of genetic variation in T. ciliata var. pubescens populations.
Population Na Ne HO HE PIC
YF 3.40 2.08 0.58 0.49 0.42
JX 4.04 2.41 0.49 0.54 0.48
XJ 2.64 1.93 0.63 0.46 0.38
SC 2.76 2.12 0.48 0.51 0.42
YM 3.92 2.56 0.66 0.61 0.53
BC 3.32 2.32 0.74 0.50 0.42
WD 3.52 2.33 0.67 0.53 0.46
SZ 3.72 2.02 0.59 0.43 0.36
CH 3.83 2.82 0.32 0.60 0.54
Mean 3.46 2.29 0.57 0.52 0.45
Na: mean observed number of alleles; Ne: effective number of alleles; HO: observed heterozygosity; HE: expected heterozygosity; PIC: polymorphic information content.
Table 5. Analysis of molecular variance (AMOVA) for the genetic variation.
Source of Variation d.f. Sum of Squares Percentage of Variation p-Value
Among regions 1 784.051 10.5 0.001 **
Among populations within regions 8 1946.535 30.4 0.001 **
Within populations 375 4856.182 59.1 0.001 **
Total 384 7586.768
** p-value ≤ 0.01.
Table 6. Pearson’s correlation between allele frequency at outlier loci and geographic and climatic factors.
AlleleElevationBio1Bio2Bio5Bio8Bio9Bio16Bio18
Tc05-1−0.1510.227−0.3840.693 *−0.066−0.0850.410−0.039
Tc05-2−0.0240.058−0.1800.420−0.063−0.1260.268−0.179
Tc05-40.264−0.2800.555−0.478−0.307−0.011−0.511−0.423
Tc05-5−0.012−0.4420.144−0.436−0.163−0.366−0.410−0.202
Tc05-60.626−0.5500.183−0.559−0.522−0.326−0.434−0.375
Tc05-7−0.2960.810 **−0.1290.2690.720 *0.841 **0.5010.841 **
Tc07-10.212−0.2510.575−0.487−0.2950.018−0.444−0.328
Tc07-20.234−0.4530.731 *−0.787 *−0.457−0.065−0.669 *−0.436
Tc07-3−0.0040.2660.0170.3490.1700.1690.363−0.077
Tc07-4−0.3980.322−0.4720.6610.2550.0320.4670.217
Tc07-5−0.2460.432−0.5870.4470.5200.1590.4800.675 *
Tc07-6−0.227−0.1130.117−0.1840.021−0.098−0.0760.089
Tc07-70.540−0.5610.369−0.654−0.523−0.269−0.612−0.510
Tc-A7-1−0.1760.211−0.4540.728 *−0.043−0.1410.430−0.023
Tc-A7-2−0.0820.161−0.2510.4960.052−0.0520.361−0.059
Tc-A7-40.232−0.1850.546−0.451−0.2240.091−0.457−0.327
Tc-A7-50.008−0.4420.207−0.475−0.193−0.333−0.439−0.227
Tc-A7-60.626−0.5500.183−0.559−0.522−0.326−0.434−0.375
Tc-B11-10.231−0.2530.541−0.463−0.2910.003−0.436−0.336
Tc-B11-20.214−0.3110.809 **−0.808 **−0.3560.136−0.635−0.315
Tc-B11-30.077−0.258−0.0600.221−0.247−0.4310.043−0.501
Tc-B11-4−0.4370.505−0.4540.715 *0.3380.2500.5590.360
Tc-B11-5−0.2250.416−0.5700.3980.5700.1560.4880.688 *
Tc-B11-70.536−0.5580.371−0.653−0.521−0.266−0.612−0.511
* p-value ≤ 0.05, ** p-value ≤ 0.01.
Disclaimer/Publisher’s Note: The statements, opinions and data contained in all publications are solely those of the individual author(s) and contributor(s) and not of MDPI and/or the editor(s). MDPI and/or the editor(s) disclaim responsibility for any injury to people or property resulting from any ideas, methods, instructions or products referred to in the content.

