Abstract
Scent is the key character of the horticultural ornamental plant rose, and benzenoid–phenylpropanoid compounds are the main source of scent. However, the underlying biosynthesis mechanism of these benzenoid–phenylpropanoid scent metabolites during Rosa flowering is poorly understood. In this study, the volatile metabolome and transcriptome conjoint analysis was conducted on the six stages petals of the variety ‘Lanxing’ to investigate the synthesis of benzenoid–phenylpropanoid metabolites. A total of 25 benzenoid–phenylpropanoid volatile compounds were identified, of which eugenol possessed the highest content. Meanwhile, transcriptome analysis produced 87.9 million clean reads and 22,004 differentially expressed genes (DEGs). Group pairwise comparison of gene ontology (GO) and Kyoto encyclopedia of genes and genomes (KEGG) enrichment analysis found DEGs were enriched into phenylpropanoid compound synthesis related pathway. Weighted gene co-expression network analysis (WGCNA) found a MEgreenyellow gene module (650 DEGs) correlated with phenylpropanoid compounds. Based on the eugenol content variation and gene spatio-temporal expression, a key candidate gene RcEGS32 related to the synthesis of eugenol was identified. Co-expression network analysis found that five transcription factors, RcMYB1, RcBES1, RcERF2, RcbHLH1, and RcTUB, may act as regulators in the eugenol synthesis process by directly binding to RcEGS32 or forming a complex unit. This study provided key insights into the formation of the scent substance eugenol during flowering, offering a valuable volatile metabolome and transcriptome resource for the future target trait-related gene discovery of roses.
1. Introduction
Rose is one of the most important ornamental plants that is cultivated worldwide [1]. It possesses great economic value in perfume, garden ornamental, and medicine for its scent, color, recurrent blooming, and other characteristics [2]. Currently, there has been an increasing demand for scented rose flowers among the consumers [3]. To meet the market requirement, the breeders have paid great attention to improving the scent trait during artificial and natural selection processes. Therefore, the investigation of screening the rose scent metabolites production and emission related gene has great industrial value.
Phenylpropanoids are a group of aroma secondary metabolites which are synthesized in the shikimic acid pathway with aromatic amino acids phenylalanine as a precursor [4]. Eugenol is one of the key volatile scent phenylpropanoid compounds. It is also widespread in plants which have specific properties, such as attracting pollinators or defending against fungi and bacteria [5]. The eugenol synthase (EGS), an NAPDH-dependent reductase belonging to the PIP (Pinoresinol–lariciresinol reductase, Isoflavone reductase, and Phenylcoumaran benzylic ether reductase) family [6]. To date, only few EGSs have been identified and functionally characterized in different species, such as Basil (Ocimum basilicum, ObEGS1), Clarkia breweri (Clarkia pulchella, CbEGS1 and CbEGS2), and Petunia (Petunia hybrid, PhEGS1) [7,8,9]. These enzyme genes produce the eugenol with the same substrate coniferyl acetate, and mostly specifically express in the upper and lower parts of the petals [10]. In Rosa, a previous study cloned a eugenol synthase gene (RcEGS) from the petals of Rosa chinensis and confirmed its molecular function [11]. There have been no reports on the rich aroma of eugenol in modern roses (Rosa hybrida). Up to now, a few R2R3 type MYB (v-myb avian myeloblastosis viral oncogene homolog) transcription factors (TFs) have been identified and confirmed to regulate the expression of structural genes within the volatile benzenoid/phenylpropanoid pathway. In strawberry (Fragaria×ananassa), an R2R3 MYB transcription factor (FaEOBII) was found that was involved in regulating the biosynthesis of eugenol synthesis in petals [12]. Along the way, further research finds that transcription factor FaDOF2 acts as a subsidiary role with FaEOBII to control the expression of eugenol synthesis gene [13]. Similarity, the orthologous gene PhEOBII in petunia regulates the volatile phenylpropanoid compound biosynthesis by binding to the promoter region of ODORANT1 (ODO1) [14]. However, there has been no report about the transcription factor that participates in the eugenol synthesis process in Rosa hybrida until now.
Omic is a molecular term which means comprehensive or global assessment of a set of molecules, and it mainly comprises four types (genomic, transcriptomic, proteomic, and metabolomic) to provide the universal detection of concerned gene sequences in a biological sample [15]. The advanced development of high-throughput technologies has led biological studies vary from single omic to a multi-omics era, such as interaction between transcriptomic–metabolomics, genomic–proteomics, and genomic–transcriptomics [16]. The potential causative changes that lead to the biology phenotype variation could be discovered by integrating different type of omics data [17]. Recently, the union of transcriptome and metabolome has been widely used to accelerate the understanding of intrinsic metabolite synthesis biological process [18]. Transcriptome provides a way for new gene discovery and transcription identification, which acts as a great role in mining genes related to plant secondary metabolite biosynthesis [19]. A great deal of functional genes have been detected by analyzing different tissues transcriptome results in plants, such as Torreya (Torreya grandis), Sorghum (Sorghum bicolor), and Potato (Solanum tuberosum) [20,21,22]. Metabolome focuses on high-throughput identification and quantification analysis metabolites in organism at a precise time point, which provides insight into ongoing intracellular activities regulated by metabolites [23]. By correlating the metabolites status with other omics data states, it can contribute to identify function genes and elucidate of pathways involved in plant metabolism process [19]. There were very limited studies that investigated the gene expression and metabolites variation by unifying volatile metabolome and transcriptome in rose.
In this study, in order to identify genes associated with the synthesis of the rosa aromatic substance eugenol, volatile metabolome and transcriptome were performed and correlated at six flower developmental stages of the variety ‘Lanxing’. Through integrating these multi-omics and qRT-PCR data, a key eugenol synthesis candidate gene RcEGS32 was identified. Five transcription factors, RcMYB1, RcBES1, RcERF2, RcbHLH1, and RcTUB, may act as regulators in the eugenol synthesis process by directly binding to RcEGS32 or forming a complex unit. These results revealed the molecular synthesis mechanism information of eugenol and offered valuable genetic resource of Rosa hybrida, which laid the foundation for improving utilization of Rosa hybrida aroma substance.
2. Materials and Methods
2.1. Sample Preparation
The variety of ‘Lanxing’ was cultivated in the resource nursery of Institute of Forestry and Pomology, Beijing Academy of Agricultural and Forestry Sciences (Beijing, China). The petal tissues of six flower developmental stages (stage 0 to 5) were collected and stored in liquid nitrogen at once. The phenotypic characteristics of the different flowering stages of the variety ‘Lanxing’ were shown in Figure 1. Each stage included three independent biological replicates for volatile metabolome and transcriptome, individually. For stage 3, the flower tissue of sepal, leaf, style, anther, and petal were sampled and placed in liquid nitrogen, immediately. All the prepared samples were kept at −80 °C for the following experiments. The variety ‘Lanxing’ petal exhibited the typical flavor to the phenylpropanoid compound eugenol. Since the phenylpropanoid scent type of rose is rare in the market, it possesses great ornamental and economy value (Figure 1). Thus, we chose the variety ‘Lanxing’ as material to study phenylpropanoid compound inner genetic information.
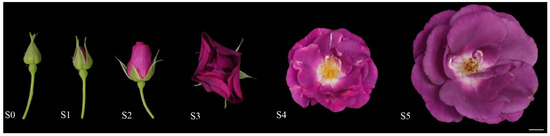
Figure 1.
The different flowering stages of the variety ‘Lanxing’. Bar = 1 cm, S0: bud stage, S1: bud stage with color petal, S2: Early-open stage, S3: half-open stage, S4: blooming stage, S5: the final stage of blooming.
2.2. Volatile Metabolome
The headspace solid-phase micro extraction (HS-SPME) method was adopted to extract volatiles from stage 0 to 5, and each sample was performed three replicates. The HS-SPME procedure was conducted as follows. Around 0.5 g of petal powder was accurately weighted and placed in the top empty bottles with saturated NaCl solution and internal standard solution. The sample was vibrated for 5 min at 60 °C. Then, a 120 um DVB/CWR/PDMS extraction head was inserted to implement headspace extraction for 15 min and analyzed for 5 min at 250 °C for gas chromatograph mass spectrometry (GC-MS). Chromatographic condition technique parameters were as follows: carrier gas: helium; column: DB-5MS (30 m × 250 mm × 0.25μm); ion source temperature: 230 °C; electron energy: 70 eV; solvent (hexyl hydride) delay: 5 min; oven temperature ramp: 40 °C for 5 min, then increasing to 280 °C at a rate of 6 °C min−1, and hold for 5 min. Mass spectrometry condition technique parameters were as follows: column flow: 1.0 mL min−1; scan mode: sim (selective ion monitoring); quad temperature: 150 °C; front injection temperature: 250 °C; front inlet mode: splitless; transfer line temperature: 280 °C. A quality control sample (prepared by mixing samples) was inserted into every 10 test samples to monitor the repeatability during instrumental analysis.
2.3. RNA Extraction
The samples (sepal, leaf, style, anther, and petal) were grinded into powder in a mortar with liquid nitrogen. Total RNA was extracted by using the RNAprep Pure Plant Kit (Tiangen Biotech, Beijing, China). The quality and quantity of RNA were checked by Agilent 2100 Bioanalyzer (Agilent, Santa Clara, CA, USA) and Qubit 2.0 fluorometer (Thermo Scientific, Waltham, MA, USA), and the RNA integrity was assessed by agarosa gel electrophoresis. A total of 18 eligible RNA samples (6 stages × 3 replicates) were obtained for transcriptome analysis, and 15 RNA samples (5 tissues × 3 replicates) at stage 3 were combined with the 18 samples from different developmental stages to conduct qRT-PCR analysis.
2.4. Transcriptome
The libraries were constructed and sequenced on the Illumina HisSeqTM 4000 platform in Metware Technologies Corporation (Wuhan, China). A total of 18 transcriptome profiles (6 stages × 3 replicates) have been deposited in China National GeneBank DataBase with an accession number CNP0004652. The raw data were filtered by removing reads with adapter, reads with low quality (threshold value ≤ 20) exceeding more 50%, and reads with unknown base surpass 10% to obtain clean data. The filtered reads were aligned and annotated to the R. chinensis reference genome by using HISAT2 software (version 2.2.0) [24]. The level of gene expression was calculated by fragments per kilobase of transcript sequence per million base pairs sequenced (FPKM) method. The significant differential expression genes in each comparison were examined by DESeq2 R package (version 1.20.0) based on |log2Fold Change| ≥ 1 and false discovery rate < 0.05.
2.5. Statistical Analysis
Pearson correlation coefficients were used to determine the correlation of the metabolites content or gene expression between every two samples by using R software (version 4.2.1). Principal component analysis (PCA) was performed using PCA3D package (version 0.10.2) in R software (version 4.2.1). The relative content of the different volatiles were standardized and centralized in the K-means clustering algorithm (n_cluster varied from 2–9). Heat map of gene expression level was plotted using TBtools with the ‘Log Scale’ and ‘Row Scale’ [25]. Other figures were drawn through SigmaPlot software (version 10.0).
2.6. Identification of EGS Genes in R. chinensis
The Hidden Markov Model (HMM) of the EGS-type NADPH domain (PF13460) was obtained from the Pfam database (http://pfam-legacy.xfam.org/family/PF13460, accessed on 1 June 2022). HMM was used as probe to screen EGS genes in R. chinensis genome (https://www.rosaceae.org/, accessed on 1 August 2022) by HMMER software (version 3.1), and the E value was set to E < 10−3 [26]. The protein sequences of the EGS genes were confirmed in the SMART website (http://smart.embl-heidelberg.de/, accessed on 1 October 2022) to ensure the accuracy of the obtained EGS genes. The isoelectric points, amino acid sequence length, and molecular weight of each EGS protein was predicted in the online website (http://web.expasy.org/compute_pi, accessed on 1 November 2022). The phylogenetic tree of EGS protein was constructed by the neighbor joining method in the MEGA-X.
2.7. Weighted Gene Co-Expression Network Analysis
Weighted gene co-expression network analysis (WGCNA) was conducted in the R software to analyze the co-expression network. The network construction and module detection for DEGs were conducted using an unsigned type of topological overlap matrix (TOM) with a minimal module size of 30, and a merge cut height of 0.30 [27,28]. The different colors represented different gene expression WGCNA module pattern. The module eigenvalue was calculated for the relationship between different WGCNA modules and key volatile metabolites in the benzenoid–phenylpropanoid metabolic pathway. The co-expression networks between the key EGS genes and transcription factors within the corresponding WGCNA module was established using Cytoscape (version 3.9.1) [29].
2.8. Real-Time PCR
The first strand cDNA was synthesized with approximately 2 μg RNA using the Thermo Scientific RevertAid Kit (Thermo Scientific, Waltham, MA, USA) according to the manufacturer’s instructions. The RcEGS26 and RcEGS32 gene primers were designed using Primer3 (version 3.0) (http://frodo.wi.mit.edu/primer3/input.htm, accessed on 1 December 2022) online software. RcActin gene was used as internal gene (XM_024323957.2). The primers were presented in Table S1. qRT-PCR was performed in a 10 μL reaction system including 1 μL of cDNA template, 1 μL of forward primer, 1 μL of reverse primer, 5 μL of Bio-Rad mix, and 2 μL of ddH2O. qRT-PCR was performed on the Bio-Rad CFX96 (Bio-Rad, Hercules, CA, USA) with the following program: 95 °C for 5 min, 39 cycles of 95 °C for 5 s, and 60 °C for 15 s, 65 °C for 5 s, 95 °C for 50 s. The relative transcript levels were calculated using 2−ΔΔCT method. Each sample obtained three biological replicates, and one qRT-PCR experiment was conducted to each biological replicate.
3. Results
3.1. Identification of Scent Substance Eugenol during Flowering
To gain an overview understanding of the volatile metabolites variation within the benzenoid–phenylpropanoid metabolic pathway, the HS-SPME combined with GC-MS/MS method was used to analyze the volatiles changes during the variety ‘Lanxing’ flowering. The Pearson correlation analysis showed that the correlation index ranged from 0.980 to 1.000 within three biological replicates across different developmental stages (Figure S1). Principal component analysis showed the credibility of the volatiles for each sample in each flowering stage and the separation among different flowering stages (Figure S2A). Three groups of principal components explained 46.44%, 29.63%, and 9.69% of the variation, respectively. Samples were discriminately clustered in different groups according to the distinct flowering stages, which indicates the contents of volatiles changed during the flowering stages. A venn diagram was used to analyze the overlap and specific volatile component among five pairwise comparisons (S0 vs. S1, S0 vs. S2, S0 vs. S3, S0 vs. S4, and S0 vs. S5) (Figure S2B). A total of 328 volatiles were detected in all comparisons, which means that these volatiles possessed sustainable effect during flowering. Additionally, there were also specific volatiles in one or several pairwise comparisons.
K-means clustering analysis grouped all the volatiles into eight profiles, and captured the change trend of different volatile profiles (Figure 2). In sub class 1, the content of 44 volatiles increased from S0 to S3, and then a decrease occurred during the period from S3 to S5. For the volatile of sub class 2 and 6, the content exhibited uprise trend from S0 to S3 and S4 to S5, and decreased between S3 and S4. The component of volatiles in sub class 4 and 7 increased from S0 to S1 and S3 to S4, while it decreased from S2 to S3 and S4 to S5. For the period from S0 to S4, the volatile content variation trend contrary to the stage between S4 and S5 in the sub class 5 and 8. The volatility in sub class 3 keeps the decreasing trend from S0 to S5 period.
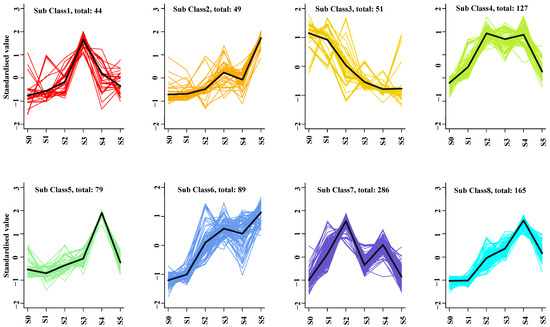
Figure 2.
Cluster analysis of 890 volatiles based on the K-means method.
A total of 25 kinds of benzenoid–phenylpropanoid metabolites were identified in volatile metabolome, including p-cresol, phenol, 3-methyl-phenol, 2-methoxy-phenol, m-tert-butyl-phenol, propofol, 4-propyl-phenol, 3-methoxy-5-methylphenol, orcinol, 3,5-dimethyl-phenol, 2,4-dichloro-phenol, 3-ethyl-phenol, 2,3,6-trimethyl-phenol, 5-hydroxyindane, 2-(1,1-dimethylethyl)-phenol, eugenol, methyleugenol, 1,3-benzenediol-4,5-dimethyl, 2-[(ethylsulfinyl)methy]-phenol, coniferyl alcohol, 5-methyl-2-(1-methylethenyl)-4-hexen-1-ol, 2-naphthalenol, 5-pentyl-1,3-benzenediol, 1-hydroxyanthraquinone, and 9-phenanthrenol (Figure 3a). Among them, eugenol possessed 38.19% content among the all metabolites which means eugenol is the most important benzenoid–phenylpropanoid metabolite. The detailed information of these 25 metabolites is presented in Table S2. Among them, eugenol showed minimum content at S0 stage, and increased slightly from S0 to S2 stage. There was a dramatic increase from S2 to S3, and then a significant decrease from S3 to S5 stage (Figure 3b). Combining with the variety ‘Lanxing’ flowering process, the highest content of eugenol at S3 (half-open) stage contributed to accumulate eugenol at S4 (blooming) stage to attract pollinator and viewer for the blooming period of the variety ‘Lanxing’ only last around five days. This result represented that the emission time of scent substance eugenol was corresponding to the insect vector natural pollination biology phenomenon.
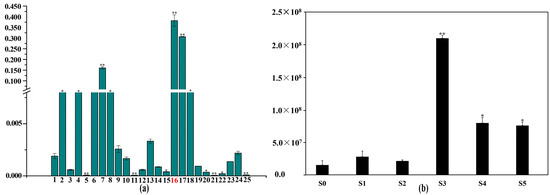
Figure 3.
Identification of benzenoid–phenylpropanoid volatiles in the variety ‘Lanxing’ different flowering stages. (a) Total content of 25 kinds of benzenoid–phenylpropanoid volatile compounds. The red font number 16 represented the metabolite eugenol. Note: The correspondence benzenoid–phenylpropanoid volatile metabolites from 1 to 25 were annotated in x-axis as follows: p-cresol, phenol, 3-methyl-phenol, 2-methoxy-phenol, m-tert-butyl-phenol, propofol, 4-propyl-phenol, 3-methoxy-5-methylphenol, orcinol, 3,5-dimethyl-phenol, 2,4-dichloro-phenol, 3-ethyl-phenol, 2,3,6-trimethyl-phenol, 5-hydroxyindane, 2-(1,1-dimethylethyl)-phenol, eugenol, methyleugenol, 1,3-benzenediol-4,5-dimethyl, 2-[(ethylsulfinyl)methy]-phenol, coniferyl alcohol, 5-methyl-2-(1-methylethenyl)-4-hexen-1-ol, 2-naphthalenol, 5-pentyl-1,3-benzenediol, 1-hydroxyanthraquinone, and 9-phenanthrenol. The y-axis symbols the percentage for each metabolite. (b) Variation trend of eugenol content. The x-axis represents different developmental stage of the variety ‘Lanxing’. The y-axis represents each metabolite peak area in mass spectrum. The * and ** indicate significant difference at 0.05 and 0.01 level, respectively.
3.2. The Gene Expression Level Alteration during Flowering
To explore the molecular regulation mechanism of the benzenoid–phenylpropanoid volatile metabolite eugenol during the variety ‘Lanxing’ flowering, RNA-seqs were conducted at six time point during the variety flowering process. A total of 898,426,282 raw reads and 879,486,970 clean reads were produced, which consisted of 131.93 Gb clean bases (Table S3). The average Q20 and Q30 were 97.21% and 92.19%, respectively (Table S3). The average GC content and uniquely mapping rate were 46.65% and 83.50%, respectively (Table S3). Additionally, the total mapped reads for clean reads in each library ranged from 85.53% to 86.79%. The Pearson correlation analysis showed that the correlation index ranged from 0.980 to 1.000 within three biological replicates, and the correlation index ranged from 0.242 to 0.860 between different developmental stages (Figure 4a). Principal component analysis was applied to reveal the relationship for three biological replicates across different flowering stages. The samples from the same biological replicates were clearly assigned together according to the flowering stages (Figure 4b).
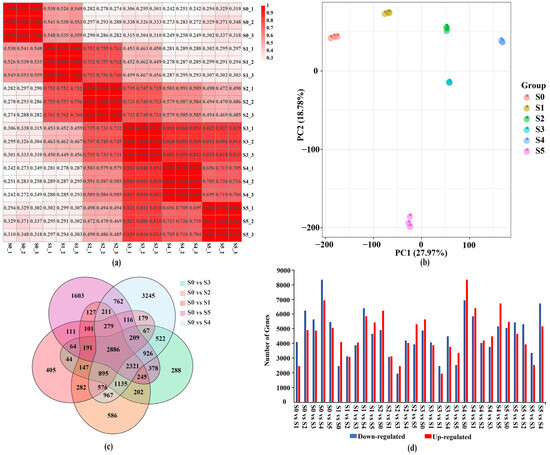
Figure 4.
Analysis of the transcriptome data during the variety ‘Lanxing’ flowering. (a) The correlation heatmap analysis among different pairwise samples. (b) Principal component analysis of gene expression value of tested materials. (c) Venn diagrams show commonly or uniquely DEGs among different comparison sets. (d) The number of upregulated and downregulated genes in 30 pairwise comparison sets.
Through pairwise comparison sets analysis, 405, 586, 288, 3245, and 1603 DEGs were specific to S0 vs. S1, S0 vs. S2, S0 vs. S3, S0 vs. S4, and S0 vs. S5, respectively (Figure 4c). A total of 2886 DEGs were shared in all comparison sets, suggesting that these genes play specific roles during the variety ‘Laxing’ flowering by expression level variation (Figure 4c). In summary, 22,004 DEGs were identified in 15 compared combinations sets (Figure 4d). For the comparison sets S0 vs. S1, S0 vs. S2, S0 vs. S3, and S0 vs. S5, the number of downregulated DEGs was higher than that of upregulated DEGs, which suggested the flowering process was accompanied by activating gene expression. Nevertheless, the number of upregulated DEGs was higher than that of downregulated DEGs in S1 vs. S5, S2 vs. S5, S3 vs. S5, and S4 vs. S5. The reason for this phenomenon was that the flower was enduring period of decay resulting in the decrease of metabolism related gene expression level.
3.3. Functional Annotation of DEGs during Flowering
Gene Ontology (GO) and Kyoto Encyclopedia of Genes and Genomes (KEGG) enrichment analysis were conducted to identify the genes that may be involved in aroma volatiles synthesis during the variety flowering. The GO enrichment analysis results showed that the DEGs were classified into three main GO categories as biological process, cellular component, and molecular function in the top 25 enrichment terms (Figure S3, Table S4). In all four pairwise comparison groups, there were 22, 33, and 45 GO terms significantly enriched in biological process, molecular function, and cellular component, respectively. For the cellular component, three terms (‘apoplast’, ‘extracellular region’, and ‘cell periphery’) were enriched in all comparison groups, indicating that the whole rosa flowering process was accompanied by extracellular and apoplast activity around cell. In the S0 vs. S1 comparison group, the first five numbers of DEGs enriched GO term were ‘intrinsic component of membrane’ (1584), ‘integral component of membrane’ (1516), ‘cell periphery’ (1029), ‘oxidoreductase activity’ (487), and ‘transcription factor activity’ (396). In the S0 vs. S2 comparison group, ‘intrinsic component of membrane’ (2579), ‘cell periphery’ (1708), ‘plasma membrane’ (1483), ‘oxidoreductase activity’ (795), and ‘extracellular region” (564) were the most enriched GO terms. For the comparisons S0 vs. S3 and S0 vs. S5, there were four common GO terms (‘membrane’, ‘membrane part’, ‘intrinsic component of membrane’, and ‘response to stimulus’) that were enriched.
To further explore the biological functions of DEGs, the KEGG enrichment analysis was conducted (Figure S4, Table S5). KEGG enrichment analysis results indicated that ‘alpha-linolenic acid metabolism’, ‘metabolic pathways’, ‘glycolysis / gluconeogenesis’, ‘starch and sucrosa metabolism’, ‘linoleic acid metabolism’, and ‘biosynthesis of secondary metabolites’ were significantly enriched GO term in all four comparisons, indicating that the DEGs related to these biological processes have sustained effect during rosa flowering. Among all energy and matter metabolic pathways, only these six metabolic pathways specifically play energy and matter supply roles during the variety ‘Lanxing’ flowering. Compared to other species, the phenylpropanoid volatile aroma compounds is rare in rosa, which makes it possible to be the characteristic scent [5]. Thus, the phenylpropanoid-compound-related KEGG pathway was specifically screened during rosa flowering. The KEGG pathways ‘phenylalanine, tyrosine and tryptophan biosynthesis’, ‘phenylpropanoid biosynthesis’, and ‘phenylalanine metabolism’ were regarded as having critical roles in phenylpropanoid formation during the variety flowering.
3.4. WGCNA Modules Related to Eugenol Biosynthesis in the Variety ‘Lanxing’
In order to explore the relationship between DEGs and benzenoid–phenylpropanoid volatile metabolites, WGCNA analysis was conducted to 22,004 DEGs from six different flowering stages. According to the WGCNA analysis result, 16 distinct co-expression modules were identified and labeled with different colors in a dendrogram (Figure 5a). Among all modules, the MEturquoise module showed the most number of 3366 DEGs, while the MElightcyan had the least number of 120 DEGs. A labelled heatmap was used to exhibit and analyze the relationship between the co-expression module and three benzenoid–phenylpropanoid volatile metabolites (Figure 5b; Table S6). The MEgreen, MEgreenyellow, MEsalmon, MEpink, MEmidnightblue, MEyellow, MEblack, and MEred modules exhibited different degrees of positive correlation with volatile compound eugenol. For the volatile compound cinnamic acid, there were eight modules (MEpurple, MEtan, MEgreen, MEgreenyellow, MEsalmon, MEmagenta, MEpink, and MEblack) showed positive correlation phenomenon. The DEGs in module MEblack, MEpink, MEmagenta, MEsalmon, MEgreenyellow, MEtan, and MEpurple were positively correlated with the volatile compound coniferyl alcohol. Interestingly, the genes within MEgreenyellow module were positively related to all volatile compounds within benzenoid–phenylpropanoid metabolic pathway. Thus, the key benzenoid–phenylpropanoid volatile metabolite eugenol synthesis candidate gene could be exit in this module.
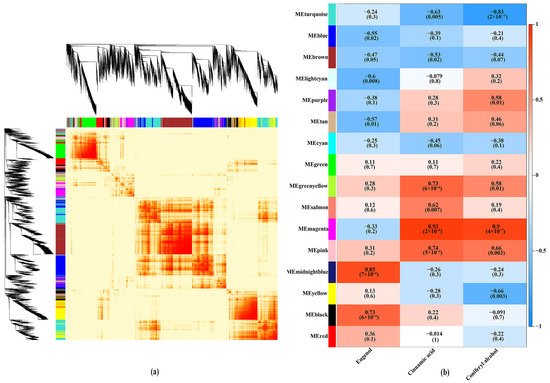
Figure 5.
Weighted gene co-expression network analysis of DEGs with metabolite content in benzenoid–phenylpropanoid metabolic pathway. (a) Hierarchical clustering tree of the modules. (b) Module-trait weight correlations calculated by Pearson correlation coefficients. The p value is annotated in parenthesis and the number in each rectangle represent correlation coefficients.
3.5. Identification of Key Eugenol Synthetic Enzyme Gene
Combing genomic and HMM domain information, 44 EGS gene family members were obtained in reference genome R. chinensis. The coding region length of the 44 EGS genes ranged from 966 to 2477 bp, while the protein length ranged from 287 to 614 amino acids (Table S7). The molecular weight was between 31.23 and 67.72 KD, and the isoelectric point varied from 5.21 to 9.02 (Table S7). The chromosome location information showed that 44 genes were randomly distributed on seven chromosomes, and they were renamed as RcEGS1 to RcEGS44 according to their position on the chromosomes (Figure 6).
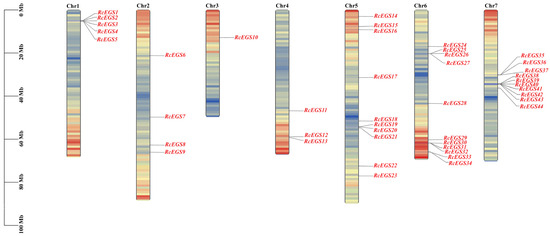
Figure 6.
The chromosome location of RcEGS gene family members.
To further study the functions and evolutionary characteristics of the EGS gene family, a phylogenetic tree was constructed using 44 RcEGSs protein sequences of RcEGSs. The phylogenetic analysis results suggested that the RcEGS gene family can be divided into three groups (Figure 7a). Clade I and Clade II contained five and 12 RcEGS genes, respectively. Clade III was the largest group, with 27 genes. To understand the expression pattern of RcEGS genes during the variety ‘Lanxing’ flowering process, the FPKM values of 44 RcEGS genes were used to make heatmaps (Figure 7b). RcEGS genes showed different expression profiles in the variety ‘Lanxing’ flowering stages. The candidate gene RcEGS26 and RcEGS32 were chosen for the expression pattern, which were similar to the content variation trend of the key benzenoid–phenylpropanoid compound eugenol.
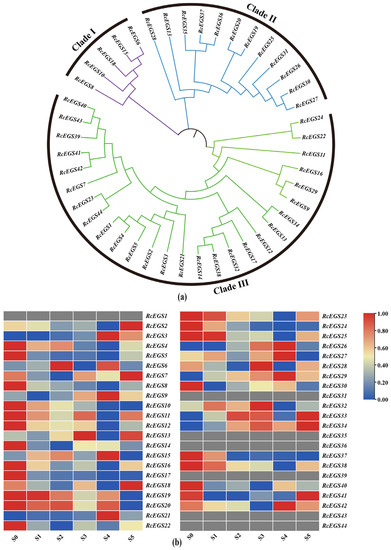
Figure 7.
The bioinformatics analysis of RcEGS gene family. (a) Phylogenetic analysis of RcEGS gene family. The purple, blue and green branch represents the clade I, clade II and clade III, respectively. (b) The expression variation of RcEGS gene family member during the variety ‘Lanxing’ flowering process.
A qRT-PCR analysis of RcEGS26 and RcEGS32 was conducted during the variety ‘Lanxing’ petal developmental process in accordance with the transcriptome data (Figure 8a,b). The expression pattern of these two genes was also analyzed in the sepal, leaf, style, anther, and petal by real-time PCR. The results manifested that RcEGS26 specific highly expressed in anther, but exhibited relatively low expression in petal and style, and was barely expressed within sepal and leaf (Figure 8c). The RcEGS32 gene was expressed significantly higher level in the petal than in the sepal, leaf, style, and anther tissue (Figure 8d). Interestingly, the expression level variation trend of RcEGS32 from stage 0 to 5 is similar to the eugenol content change. Additionally, the RcEGS32 gene was also included in benzenoid–phenylpropanoid volatile compounds highly related MEgreenyellow module in WGCNA analysis. Thus, these results demonstrated that RcEGS32 genes might be the critical genes involved in synthesis eugenol compound with coniferyl alcohol as a substrate.
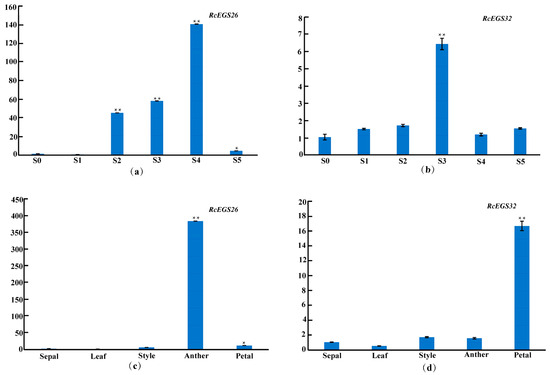
Figure 8.
Expression analysis of candidate EGS genes by RT-qPCR. Actin primers were used as the internal standard for each gene. (a) The expression patterns of RcEGS26 during the variety ‘Lanxing’ different flowering stages. (b) The expression patterns of RcEGS32 during the variety ‘Lanxing’ different flowering stages. (c) The expression patterns of RcEGS26 in the variety ‘Lanxing’ five floral organs (sepal, leaf, style, anther, and petal). (d) The expression patterns of RcEGS32 in the variety ‘Lanxing’ five floral organs (sepal, leaf, style, anther, and petal). The * and ** indicate significant difference at 0.05 and 0.01 level, respectively.
3.6. Identification of the Specific Transcription Factor about the Structural Gene RcEGS32
In order to identify the specific transcription factor binding to the structural gene RcEGS32, a co-expression network analysis exhibited the relationship between differentially expressed transcription factor and structural gene (RcEGS32) during the variety ‘Lanxing’ flowering process. The results showed that nine different types of transcription factor (MYB, Trihelix, NF-YB, bHLH, PHD, TUB, ERF, HD-ZIP, and BES1) were closely co-expressed with RcEGS32 (Figure 9a). The expression pattern analysis discovered that the transcription factor RcMYB1, RcBES1, RcERF2, RcbHLH1, and RcTUB displayed similar expression trend with structural gene RcEGS32 (Figure 9c). To further characterize the most likely transcription factor, the cis-elements within the promoter region of structural gene RcEGS32 were analyzed. The results showed that the RcEGS32 promoter region contained cis-acting regulatory element A-box, light responsiveness elements (G-box and BOX4), abscisic acid responsiveness element (ABRE), and common cis-acting element (CAAT-box). Additionally, MYB element was also identified (Figure 9b, Table S8). This evidence indicated that the expression of RcEGS32 may be induced by abscisic acid and light, and under regulation by transcription factor complex with RhMYB1 as core element. Combining all these results, RcMYB1 might directly govern the expression of RcEGS32 or by forming complex with RcBES1, RcERF2, RcbHLH1, or RcTUB during the variety ‘Lanxing’ flowering process.
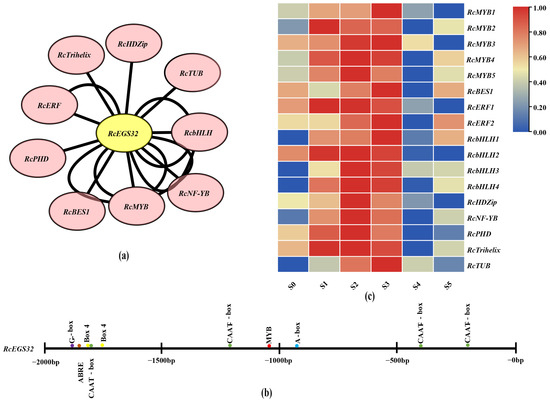
Figure 9.
The transcription factor anticipation of the structural gene RcEGS32. (a) Co-expression network analysis between differentially expressed transcription factor and structural gene RcEGS32 at flowering stages of the variety ‘Lanxing’. (b) The cis-element anticipation within the promoter region of structural gene. (c) The heatmap analysis of co-expression transcription factor with RcEGS32 during the variety ‘Lanxing’ flowering.
4. Discussion
Rose is a vital ornamental plant and popular as cut flowers or pot plants with a wide range of flower colors, flower types, flower scents, and so on [30]. Rosa petal scent is an important economic trait which offers raw material to produce fragrance substance in perfume industrial [31]. Plant aromatic substances are classified into three types of compounds as benzenoid–phenylpropanoid, terpene, and fatty acid derivatives based on their biosynthetic metabolic pathways [32]. Among them, benzenoid–phenylpropanoids are part of a large group of plant specialized metabolites, including phenylpropane, eugenol, phenethyl alcohol, and so on. Previous research found that the content of benzenoid–phenylpropanoid aroma substance was higher in purple petals, and a similar phenomenon also occurred in purple tomato [4,33]. Interestingly, the variety ‘Lanxing’ showed purple-blue flower, and it was chosen as material for its typical benzenoid–phenylpropanoid volatiles scent characteristic. In this study, a total of 1046 volatile compounds with different change trends from variety ‘Lanxing’ were detected by using GC-MS, which showed that rosa flowering is a complex metabolic process. The highest content of total scent substances was detected at the full-blooming stage (stage 3), which was consistent with a previous study [34]. K-means clustering analysis divided all volatile components into five variation trend groups based on content which has not reported previously. This could be caused by the activation time difference of related synthetic enzyme genes or interaction effect between insect pollination [35]. A sum of 25 benzenoid–phenylpropanoid compounds were identified in the variety ‘Lanxing’ petal tissue, and eugenol was the main benzenoid–phenylpropanoid type scent component. Previous research had found that phenyl ethanol was the highest scent component in R. odorata [36]. These results implied that a significant difference occurred in the key scent component among different rosa varieties. In a word, the variety ‘Lanxing’ is an ideal material to study benzenoid–phenylpropanoid scent substance.
Phenylpropanoids are a group of aroma secondary metabolites which can help the plant to attract pollinators, deter enemies, and work as an antioxidant [4,37]. The biosynthetic process of phenylpropanoids starts with aromatic amino acids phenylalanine in the shikimic acid pathway and divides into two directions under different structural genes. In one direction, the phenylalanine was catalyzed into phenylpyruvate under the effect of aromatic amino acid aminotransferase (AAAT3) effect and further synthesized into 2-phenylacetaidehyde by phenylpyruvic acid decarboxylase (PPDC) or directly synthesized into 2-phenylacetaidehyde under the effect of phenylacetaldehyde synthase effect. In the other direction, E-cinnamic was generated by phenylalanine ammonia lyase (PAL) and transferred by cinnamoyl-CoA hydratase-dehydrogenase (C4H) into p-coumaryl-CoA, which was catalyzed into coniferyl alcohol. Subsequently, under the reaction of coniferyl alcohol acyltransferase (CFAT), the coniferyl alcohol was transferred into coniferyl acetate and then formed the key scent substance eugenol by eugenol synthase [38]. Thus, these identified genes related to the biosynthesis of a chemical compound in phenylpropanoid metabolic pathway provide a new insight into the research of the molecular synthesis of Rosa phenylpropanoid floral substances molecular synthesis mechanisms research.
Eugenol was identified as a major scent substances in rose essential oil with a stable nature, antioxidative and antibacterial properties [39]. It is well known that eugenol produced via the phenylpropanoid pathway is determined by eugenol synthease (EGS). Current studies from the molecular aspects of this floral volatile have focused on the metabolism of eugenol, with several EGSs having been characterized in some species like Basil (Ocimum basilicum), Strawberry (Fragaria×ananassa), Clarkia breweri (Clarkia pulchella), and so on [9,13]. Previous researchers isolated RcEGS1 gene in petals of R. chinensis, and functional characterized from transcript level and protein level [13]. In this study, a new eugenol synthetase candidate gene in the variety ‘Lanxing’ was discovered by combining metabolome and transcriptome. RT-PCR analysis revealed that RhEGS32 exhibited similar changing pattern to eugenol during flowering, which was consisted to the former research [11]. The maximum level of eugenol content occurred in stage 3, indicating this is the optimal picking time to achieve maximum utilization value of eugenol. A similar optimal petal picking time selection method has also been reported in Yellowhorn (Xanthoceras sorbifolium) [40]. To confirm the mainly functional tissue of RhEGS32, tissue-specific expression found that RhEGS32 exhibited higher expression levels in petal than in other floral organs. This means that the petal is the RhEGS32’s mainly functional tissue and could be used as processed raw material.
Transcription factors act as key regulators for transcription expression in biological processes [41]. To date, the transcriptional regulatory network of the synthesis process of the Rosa scent substance synthesis process is poorly known. Only one transcription factor PAP1 (Production of anthocyanin pigment1) was confirmed to be a regulated scent substance synthesis by being introduced into Rosa hybrida ‘Pariser Charme’ [42]. To explore the upstream transcriptional regulatory mechanism of eugenol, a co-expression network between transcription factor and key synthesis gene RcEGS32 was constructed. Based on the expression pattern correlation to RcEGS32, five different types of TFs (RcMYB1, RhBES1, RhERF2, RhbHLH1, and RhTUB) were found correlated to RcEGS32, of which RcMYB1 genes was regarded as core element for the existence of MYB binding site within the promoter region of RcEGS32. Thus, the gene RcEGS32 could be directly regulated by RcMYB1 or by formed complex between RcMYB1 and other transcription factor (RhBES1, RhERF2, RhbHLH1, and RhTUB). In plants, several R2R3 type of MYB TFs have previously been reported associated with the formation of scent substances by directly regulating the expression of structure gene or the flow of precursors to phenylproanoid metabolism in different species [43,44,45]. Interestingly, the expression pattern of RcMYB1 was similar to the petal aging process, and the promoter region of RcEGS32 contains one abscisic acid responsiveness element (ABRE). This indicates that RcMYB1 may activate RcEGS32 in vivo and can also specifically bind to an ABRE, MYB cis-regulatory sequence, that controls petal scent substance production and aging at the same time. A similar phenomenon has also been reported about the MYB gene function in strawberry (Fragaria×ananassa) flowers and fruit organ [12]. All this evidence pointed out the RcMYB1 or RcMYB1 complex and RcEGS32 combining to form a transcriptional regulatory module to control eugenol synthesis. At a later stage, relevant over-expression, gene silencing, and enzyme activity in vitro experiments need to be conducted to validate their exact roles.
In conclusion, this study exhaustively explored the synthesis of eugenol at the volatile metabolome and transcriptome levels. Through an integrated analysis of the gene and metabolite variation trend, key candidate genes and TF genes involved in the regulation synthesis of eugenol were identified in the variety ‘Lanxing’. The functional characterization of these candidates’ gene and TFs will be carried out in the future. The results of this study revealed a potential synthesis and regulatory mechanism for the key scent substance eugenol, and offered valuable genetic resources for the Rosa hybrida.
5. Conclusions
In the present study, volatile metabolome and transcriptome analysis were conducted on the petals of the six developmental stages, and obtained 1046 metabolites and 22,004 DEGs. KEGG and GO enrichment analysis found that the DEGs were enriched into the phenylpropanoid compound-synthesis-related pathway. Weighted gene co-expression network analysis (WGCNA) narrowed the candidate gene into a 650 DEGs in a MEgreenyellow gene module. Based on the eugenol content variation and gene spatio-temporal expression, a key candidate gene RcEGS32 related to the synthesis of eugenol was identified. Meanwhile, co-expression network analysis found that five transcription factors, RcMYB1, RcBES1, RcERF2, RcbHLH1, and RcTUB, may act as regulators in the eugenol synthesis process by directly binding to RcEGS32 or forming a complex unit. Overall, this study contributed to a deeper understanding of synthesis and regulation genes for the key scent substance eugenol, and provided a valuable genetic resource for the future rose scent genetic improvement.
Supplementary Materials
The following supporting information can be downloaded at: https://www.mdpi.com/article/10.3390/f14101973/s1, Figure S1: Correlation analysis with Pearson’s Correlation Coefficient for volatile metabolome samples; Figure S2: Analysis of volatile metabolites among in the variety ‘Lanxing’ different flowering stages. (a) Principal component analysis (PCA) of test materials. (b) Venn diagram of common and specific volatiles among different comparison sets; Figure S3: GO enrichment analysis for DEGs among pairwise comparisons S0 vs. S1, S0 vs. S2, S0 vs. S3, and S0 vs. S5; Figure S4: KEGG enrichment analysis for DEGs among pairwise comparisons S0 vs. S1, S0 vs. S2, S0 vs. S3, and S0 vs. S5; Table S1: Primer sequences qRT-PCR; Table S2: Phenol volatile profiles of the variety ‘Lanxing’ at different flowering stages; Table S3: Quality statistics of filtered reads; Table S4: The top 25 significantly enriched GO terms among five pairwise comparisons; Table S5: The top 25 significantly enriched DEGs in all five comparison groups based on KEGG annotation; Table S6: Module genes of WGCNA analysis; Table S7: Characteristics of R. chinensis eugenol synthesis gene; Table S8: Cis-elements within the promoter region of RcEGS32.
Author Contributions
W.J. designed the research; P S., H.W., M.L., Y.K., and S.Z. performed the experiments; P.S. and Y.Y. analyzed the data; W.J., and P.S. wrote the paper. All authors have read and agreed to the published version of the manuscript.
Funding
This work was financially supported by the Science and Technology Innovation Ability Construction Projects of Beijing Academy of Agriculture and Forestry Science (KJCX20230110, KJCX20230221) and the Young Foundation of Institute of Forestry and Pomology (LGJJ202203).
Data Availability Statement
All data generated during the study are available within the manuscript and within its supplementary data.
Conflicts of Interest
The authors declare no conflict of interest.
References
- Shi, S.; Zhang, S.; Wu, J.; Liu, X.; Zhang, Z. Identification of long non-coding RNAs involved in floral scent of Rosa hybrida. Front. Plant Sci. 2022, 13, 996474. [Google Scholar] [CrossRef] [PubMed]
- Bendahmane, M.; Dubois, A.; Raymond, O.; Bris, M.L. Genetics and genomics of flower initiation and development in roses. J. Exp. Bot. 2013, 64, 847–857. [Google Scholar] [CrossRef] [PubMed]
- Bergougnoux, V.; Caissard, J.-C.; Jullien, F.; Magnard, J.-L.; Scalliet, G.; Cock, J.M.; Hugueney, P.; Baudino, S. Both the adaxial and abaxial epidermal layers of the rose petal emit volatile scent compounds. Planta 2007, 226, 853–866. [Google Scholar] [CrossRef] [PubMed]
- Mei, X.; Wan, S.; Lin, C.; Zhou, C.; Hu, L.; Deng, C.; Zhang, L. Integration of metabolome and transcriptome reveals the relationship of benzenoid–phenylpropanoid pigment and aroma in purple tea flowers. Front. Plant Sci. 2021, 12, 762330. [Google Scholar] [CrossRef]
- Atkinson, R.G. Phenylpropenes: Occurrence, distribution, and biosynthesis in fruit. J. Agric. Food. Chem. 2016, 66, 2259–2272. [Google Scholar] [CrossRef]
- Min, T.; Kasahara, H.; Bedgar, D.L.; Youn, B.; Lawrence, P.K.; Gang, D.R.; Halls, S.C.; Park, H.; Hilsenbeck, J.L.; Davin, L.B. Crystal structures of pinoresinol-lariciresinol and phenylcoumaran benzylic ether reductases and their relationship to isoflavone reductases. J. Agric. Food. Chem. 2003, 278, 50714–50723. [Google Scholar] [CrossRef]
- Raguso, R.A.; Pichersky, E. Floral volatiles from Clarkia breweri and C. concinna (Onagraceae): Recent evolution of floral scent and moth pollination. Plant Syst. Evol. 1995, 194, 55–67. [Google Scholar] [CrossRef]
- Verdonk, J.C.; De Vos, C.R.; Verhoeven, H.A.; Haring, M.A.; Van Tunen, A.J.; Schuurink, R.C. Regulation of floral scent production in petunia revealed by targeted metabolomics. Phytochemistry 2003, 62, 997–1008. [Google Scholar] [CrossRef]
- Koeduka, T.; Louie, G.V.; Orlova, I.; Kish, C.M.; Ibdah, M.; Wilkerson, C.G.; Bowman, M.E.; Baiga, T.J.; Noel, J.P.; Dudareva, N. The multiple phenylpropene synthases in both Clarkia breweri and Petunia hybrida represent two distinct protein lineages. Plant J. 2008, 54, 362–374. [Google Scholar] [CrossRef]
- Koeduka, T.; Sugimoto, K.; Watanabe, B.; Someya, N.; Kawanishi, D.; Gotoh, T.; Ozawa, R.; Takabayashi, J.; Matsui, K.; Hiratake, J. Bioactivity of natural O-prenylated phenylpropenes from I llicium anisatum leaves and their derivatives against spider mites and fungal pathogens. Plant Biol. 2014, 16, 451–456. [Google Scholar] [CrossRef]
- Yan, H.; Baudino, S.; Caissard, J.C.; Nicolè, F.; Zhang, H.; Tang, K.; Li, S.; Lu, S. Functional characterization of the eugenol synthase gene (RcEGS1) in rose. Plant Physiol. Biochem. 2018, 129, 21–26. [Google Scholar] [CrossRef] [PubMed]
- Medina-Puche, L.; Molina-Hidalgo, F.J.; Boersma, M.; Schuurink, R.C.; López-Vidriero, I.; Solano, R.; Franco-Zorrilla, J.M.; Caballero, J.L.; Blanco-Portales, R.; Muñoz-Blanco, J. An R2R3-MYB transcription factor regulates eugenol production in ripe strawberry fruit receptacles. Plant Physiol. 2015, 168, 598–614. [Google Scholar] [CrossRef] [PubMed]
- Molina-Hidalgo, F.J.; Medina-Puche, L.; Cañete-Gómez, C.; Franco-Zorrilla, J.M.; López-Vidriero, I.; Solano, R.; Caballero, J.L.; Rodríguez-Franco, A.; Blanco-Portales, R.; Muñoz-Blanco, J. The fruit-specific transcription factor FaDOF2 regulates the production of eugenol in ripe fruit receptacles. J. Exp. Bot. 2017, 68, 4529–4543. [Google Scholar] [CrossRef]
- Van Moerkercke, A.; Haring, M.A.; Schuurink, R.C. The transcription factor EMISSION OF BENZENOIDS II activates the MYB ODORANT1 promoter at a MYB binding site specific for fragrant petunias. Plant J. 2011, 67, 917–928. [Google Scholar] [CrossRef] [PubMed]
- Schenck, C.A.; Busta, L. Using interdisciplinary, phylogeny-guided approaches to understand the evolution of plant metabolism. Plant Mol. Biol. 2022, 109, 355–367. [Google Scholar]
- Liu, F.; Marshall, R.S.; Li, F. Understanding and exploiting the roles of autophagy in plants through multi-omics approaches. Plant Sci. 2018, 274, 146–152. [Google Scholar] [CrossRef]
- Hasin, Y.; Seldin, M.; Lusis, A. Multi-omics approaches to disease. Genome Biol. 2017, 18, 83. [Google Scholar]
- Cavill, R.; Jennen, D.; Kleinjans, J.; Briedé, J.J. Transcriptomic and metabolomic data integration. Brief. Bioinform. 2016, 17, 891–901. [Google Scholar] [CrossRef]
- Wu, Z.; Wang, Z.; Xie, Y.; Liu, G.; Shang, X.; Zhan, N. Transcriptome and Metabolome Profiling Provide Insights into Flavonoid Synthesis in Acanthus ilicifolius Linn. Genes 2023, 14, 752. [Google Scholar] [CrossRef]
- Suo, J.; Tong, K.; Wu, J.; Ding, M.; Chen, W.; Yang, Y.; Lou, H.; Hu, Y.; Yu, W.; Song, L. Comparative transcriptome analysis reveals key genes in the regulation of squalene and β-sitosterol biosynthesis in Torreya grandis. Ind. Crop. Prod. 2019, 131, 182–193. [Google Scholar]
- Ju, L.; Lv, N.; Yin, F.; Niu, H.; Yan, H.; Wang, Y.; Fan, F.; Lv, X.; Chu, J.; Ping, J. Identification of key genes regulating, Sorghum mesocotyl elongation through transcriptome analysis. Genes 2023, 14, 1215. [Google Scholar] [CrossRef] [PubMed]
- Li, Z.; Wang, J.; Wang, J. Identification of a comprehensive gene co-expression network associated with autotetraploid Potato (Solanum tuberosum L.) development using WGCNA Analysis. Genes 2023, 14, 1162. [Google Scholar] [CrossRef]
- Cambiaghi, A.; Ferrario, M.; Masseroli, M. Analysis of metabolomic data: Tools, current strategies and future challenges for omics data integration. Brief. Bioinform. 2017, 18, 498–510. [Google Scholar] [CrossRef] [PubMed]
- Kim, D.; Langmead, B.; Salzberg, S.L. HISAT: A fast spliced aligner with low memory requirements. Nat. Methods 2015, 12, 357–360. [Google Scholar] [CrossRef]
- Chen, C.; Chen, H.; Zhang, Y.; Thomas, H.R.; Frank, M.H.; He, Y.; Xia, R. TBtools: An integrative toolkit developed for interactive analyses of big biological data. Mol. Plant 2020, 13, 1194–1202. [Google Scholar] [CrossRef] [PubMed]
- Eddy, S.R. Accelerated profile HMM searches. PLoS Comput. Biol. 2011, 7, e1002195. [Google Scholar] [CrossRef]
- Zhang, B.; Horvath, S. A general framework for weighted gene co-expression network analysis. Stat. Appl. Genet. Mol. 2005, 4, 1. [Google Scholar] [CrossRef]
- Langfelder, P.; Horvath, S. WGCNA: An R package for weighted correlation network analysis. BMC Bioinform. 2008, 9, 559. [Google Scholar] [CrossRef]
- Saito, R.; Smoot, M.E.; Ono, K.; Ruscheinski, J.; Wang, P.L.; Lotia, S.; Pico, A.R.; Bader, G.D.; Ideker, T. A travel guide to Cytoscape plugins. Nat. Methods 2012, 9, 1069–1076. [Google Scholar] [CrossRef]
- Liu, J.; Fu, X.; Dong, Y.; Lu, J.; Ren, M.; Zhou, N.; Wang, C. MIKCC-type MADS-box genes in Rosa chinensis: The remarkable expansion of ABCDE model genes and their roles in floral organogenesis. Hortic. Res. 2018, 5, 25. [Google Scholar] [CrossRef]
- Hirata, H.; Ohnishi, T.; Tomida, K.; Ishida, H.; Kanda, M.; Sakai, M.; Yoshimura, J.; Suzuki, H.; Ishikawa, T.; Dohra, H. Seasonal induction of alternative principal pathway for rose flower scent. Sci. Rep. 2016, 6, 20234. [Google Scholar] [CrossRef] [PubMed]
- Liu, H.; Chai, Y.; Chen, H.; Chen, W.; Li, Y.; Liu, W.; Guo, S.; Sun, L.; Zhou, X.; Huang, C. Analysis of terpenoids and their gene regulatory networks on the basis of the transcriptome and metabolome of Opisthopappus longilobus. Front. Plant Sci. 2022, 13, 1015942. [Google Scholar] [CrossRef]
- da Silva Souza, M.A.; Peres, L.E.; Freschi, J.R.; Purgatto, E.; Lajolo, F.M.; Hassimotto, N.M. Changes in flavonoid and carotenoid profiles alter volatile organic compounds in purple and orange cherry tomatoes obtained by allele introgression. J. Sci. Food. Agric. 2020, 100, 1662–1670. [Google Scholar] [CrossRef]
- Sun, Y.; Wang, W.; Zhao, L.; Zheng, C.; Ma, F. Changes in volatile organic compounds and differential expression of aroma-related genes during flowering of Rosa rugosa ‘Shanxian’. Hortic. Environ. Biotechnol. 2019, 60, 741–751. [Google Scholar] [CrossRef]
- Dafni, A.; Lehrer, M.; Kevan, P. Spatial flower parameters and insect spatial vision. Biol. Rev. 1997, 72, 239–282. [Google Scholar] [CrossRef]
- Zhou, L.; Yu, C.; Cheng, B.; Han, Y.; Luo, L.; Pan, H.; Zhang, Q. Studies on the volatile compounds in flower extracts of Rosa odorata and R. chinensis. Ind. Crop. Prod. 2020, 146, 112143. [Google Scholar] [CrossRef]
- Cheng, S.; Fu, X.; Mei, X.; Zhou, Y.; Du, B.; Watanabe, N.; Yang, Z. Regulation of biosynthesis and emission of volatile phenylpropanoids/benzenoids in petunia× hybrida flowers by multi-factors of circadian clock, light, and temperature. Plant Physiol. Biochem. 2016, 107, 1–8. [Google Scholar] [CrossRef]
- Raymond, O.; Gouzy, J.; Just, J.; Badouin, H.; Verdenaud, M.; Lemainque, A.; Vergne, P.; Moja, S.; Choisne, N.; Pont, C. The Rosa genome provides new insights into the domestication of modern roses. Nat. Genet. 2018, 50, 772–777. [Google Scholar] [CrossRef]
- Aragüez, I.; Osorio, S.; Hoffmann, T.; Rambla, J.L.; Medina-Escobar, N.; Granell, A.; Botella, M.Á.; Schwab, W.; Valpuesta, V. Eugenol production in achenes and receptacles of strawberry fruits is catalyzed by synthases exhibiting distinct kinetics. Plant Physiol. 2013, 163, 946–958. [Google Scholar] [CrossRef]
- Wang, M.; Wang, X.; Xu, H.; Liu, X.; Bi, Q.; Wang, L. Integrated transcriptomics and metabolomics analysis to characterize the optimal picking time in yellowhorn (Xanthoceras sorbifolium) flowers. Ind. Crop. Prod. 2022, 187, 115389. [Google Scholar] [CrossRef]
- Liu, W.; Stewart, C.N., Jr. Plant synthetic promoters and transcription factors. Curr. Opin. Biotechnol. 2016, 37, 36–44. [Google Scholar] [CrossRef]
- Zvi, M.M.B.; Shklarman, E.; Masci, T.; Kalev, H.; Debener, T.; Shafir, S.; Ovadis, M.; Vainstein, A. PAP1 transcription factor enhances production of phenylpropanoid and terpenoid scent compounds in rose flowers. New Phytol. 2012, 195, 335–345. [Google Scholar] [CrossRef]
- Jian, W.; Cao, H.; Yuan, S.; Liu, Y.; Lu, J.; Lu, W.; Li, N.; Wang, J.; Zou, J.; Tang, N. SlMYB75, an MYB-type transcription factor, promotes anthocyanin accumulation and enhances volatile aroma production in tomato fruits. Hortic. Res. 2019, 6, 22. [Google Scholar] [CrossRef]
- Ke, Y.; Abbas, F.; Zhou, Y.; Yu, R.; Fan, Y. Auxin-responsive R2R3-MYB transcription factors HcMYB1 and HcMYB2 activate volatile biosynthesis in Hedychium coronarium flowers. Front. Plant Sci. 2021, 12, 710826. [Google Scholar] [CrossRef] [PubMed]
- Cao, X.; Xu, L.; Li, L.; Wan, W.; Jiang, J. TcMYB29a, an ABA-responsive R2R3-MYB transcriptional factor, upregulates taxol biosynthesis in Taxus chinensis. Front. Plant Sci. 2022, 13, 804593. [Google Scholar] [CrossRef]
Disclaimer/Publisher’s Note: The statements, opinions and data contained in all publications are solely those of the individual author(s) and contributor(s) and not of MDPI and/or the editor(s). MDPI and/or the editor(s) disclaim responsibility for any injury to people or property resulting from any ideas, methods, instructions or products referred to in the content. |
© 2023 by the authors. Licensee MDPI, Basel, Switzerland. This article is an open access article distributed under the terms and conditions of the Creative Commons Attribution (CC BY) license (https://creativecommons.org/licenses/by/4.0/).