Article

Transcriptomic and Non-Targeted Metabolomic Analyses Reveal Changes in Metabolic Networks during Leaf Coloration in Cyclocarya paliurus (Batalin) Iljinsk

1
College of Forestry, Nanjing Forestry University, Nanjing 210037, China
2
Co-Innovation Center for Sustainable Forestry in Southern China, Nanjing Forestry University, Nanjing 210037, China
*
Author to whom correspondence should be addressed.
Forests 2023, 14(10), 1948; https://doi.org/10.3390/f14101948
Submission received: 26 August 2023 / Revised: 14 September 2023 / Accepted: 22 September 2023 / Published: 25 September 2023
(This article belongs to the Special Issue Functional Genomics of Forest Trees)

Abstract

:
Secondary metabolites in Cyclocarya paliurus (Batalin) Iljinsk. leaves are beneficial for human health. The synthesis and accumulation of secondary metabolites form a complex process that is influenced by the trade-off between primary and secondary metabolism and by the biosynthetic pathways themselves. In this study, we explored the relationship between secondary metabolite accumulation and the activity of metabolic networks in leaves of C. paliurus. Leaves at three different growth stages were subjected to transcriptomic and non-targeted metabolomic analyses. The results revealed that nitrogen assimilation increased and carbon assimilation decreased as leaves matured, and the patterns of secondary metabolite accumulation and gene expression differed among the leaves at different growth stages. Mature green leaves had higher nitrogen assimilation and lower carbon assimilation, which were correlated with variations in secondary metabolite accumulation. As a major source of carbon and nitrogen, glutamine accumulated in the mature green leaves of C. paliurus. The accumulation of glutamine inhibited phenylalanine biosynthesis by modulating the pentose phosphate pathway but promoted acetyl-CoA biosynthesis through the tricarboxylic acid cycle. These changes led to decreased flavonoid contents and increased triterpenoid contents in mature leaves. These metabolomic and transcriptomic data reveal the differential expression of metabolic regulatory networks during three stages of leaf development and highlight the trade-off between primary and secondary metabolism. Our results provide a comprehensive picture of the metabolic pathways that are active in the leaves of C. paliurus at different growth stages.

1. Introduction

Cyclocarya paliurus (Batalin) Iljinsk., a tree species found only in subtropical China, has leaves that contain health-promoting secondary metabolites, including flavonoids, triterpenoids, and phenolic acids. Thus, this tree species has a unique medicinal and health function and has great potential for commercial development [1,2,3,4]. Secondary metabolite-containing extracts from C. paliurus can improve insulin sensitivity, regulate disordered glucose and lipid metabolism, and reduce blood lipid contents and blood pressure [5]. However, the secondary metabolite components in C. paliurus leaves are variable and the bioactive function of the products is not uniform, which have hindered the development of the C. paliurus industry.
The pattern of secondary metabolite accumulation in C. paliurus leaves has been explored in previous studies. Such studies have discovered the key transcription factors and enzymes in the flavonoid and triterpenoid biosynthetic pathways, including MYBs and UDP-glucose: flavonoid 3-O-glucosyltransferases (UFGTs), as well as their regulation mechanisms [6,7,8]. The fertilizer level and ratio of nitrogen to carbon affect the balance between plant growth and defense, which in turn affect biomass and secondary metabolite production [9,10]. Plant growth and the types and amounts of secondary metabolites also differ among genotypes and among populations growing in different geographical regions [11,12]. While most studies have focused on primary metabolism, secondary metabolism, or the relationship between the two, none has fully elucidated the metabolic network of C. paliurus and its relationship with secondary metabolite accumulation.
Plant secondary metabolite biosynthesis is affected by biotic and abiotic factors. The results of previous studies are not always consistent due to the complex effects of these factors on biosynthesis. Non-targeted metabolomic and transcriptomic analyses can provide descriptive data on secondary metabolite biosynthesis. In previous research, non-targeted metabolomic and transcriptomic methods have been used to study tea, with the ultimate goal of improving the leaf quality by regulating the contents of primary and secondary metabolites including flavonoids, amino acids, and polyphenols, and the ratio of polyphenols and amino acids [13,14,15]. Non-targeted metabolomic methods have also been used to analyze the development of fruit and leaf traits of other economically important plants [16,17,18]. In this study, transcriptomic and non-targeted metabolomic analyses were performed on leaves at different growth stages, with the aim of investigating the variability of the metabolic network of C. paliurus. This information will provide new insights into the secondary metabolism of C. paliurus and how it changes as leaves mature.

2. Material and Methods

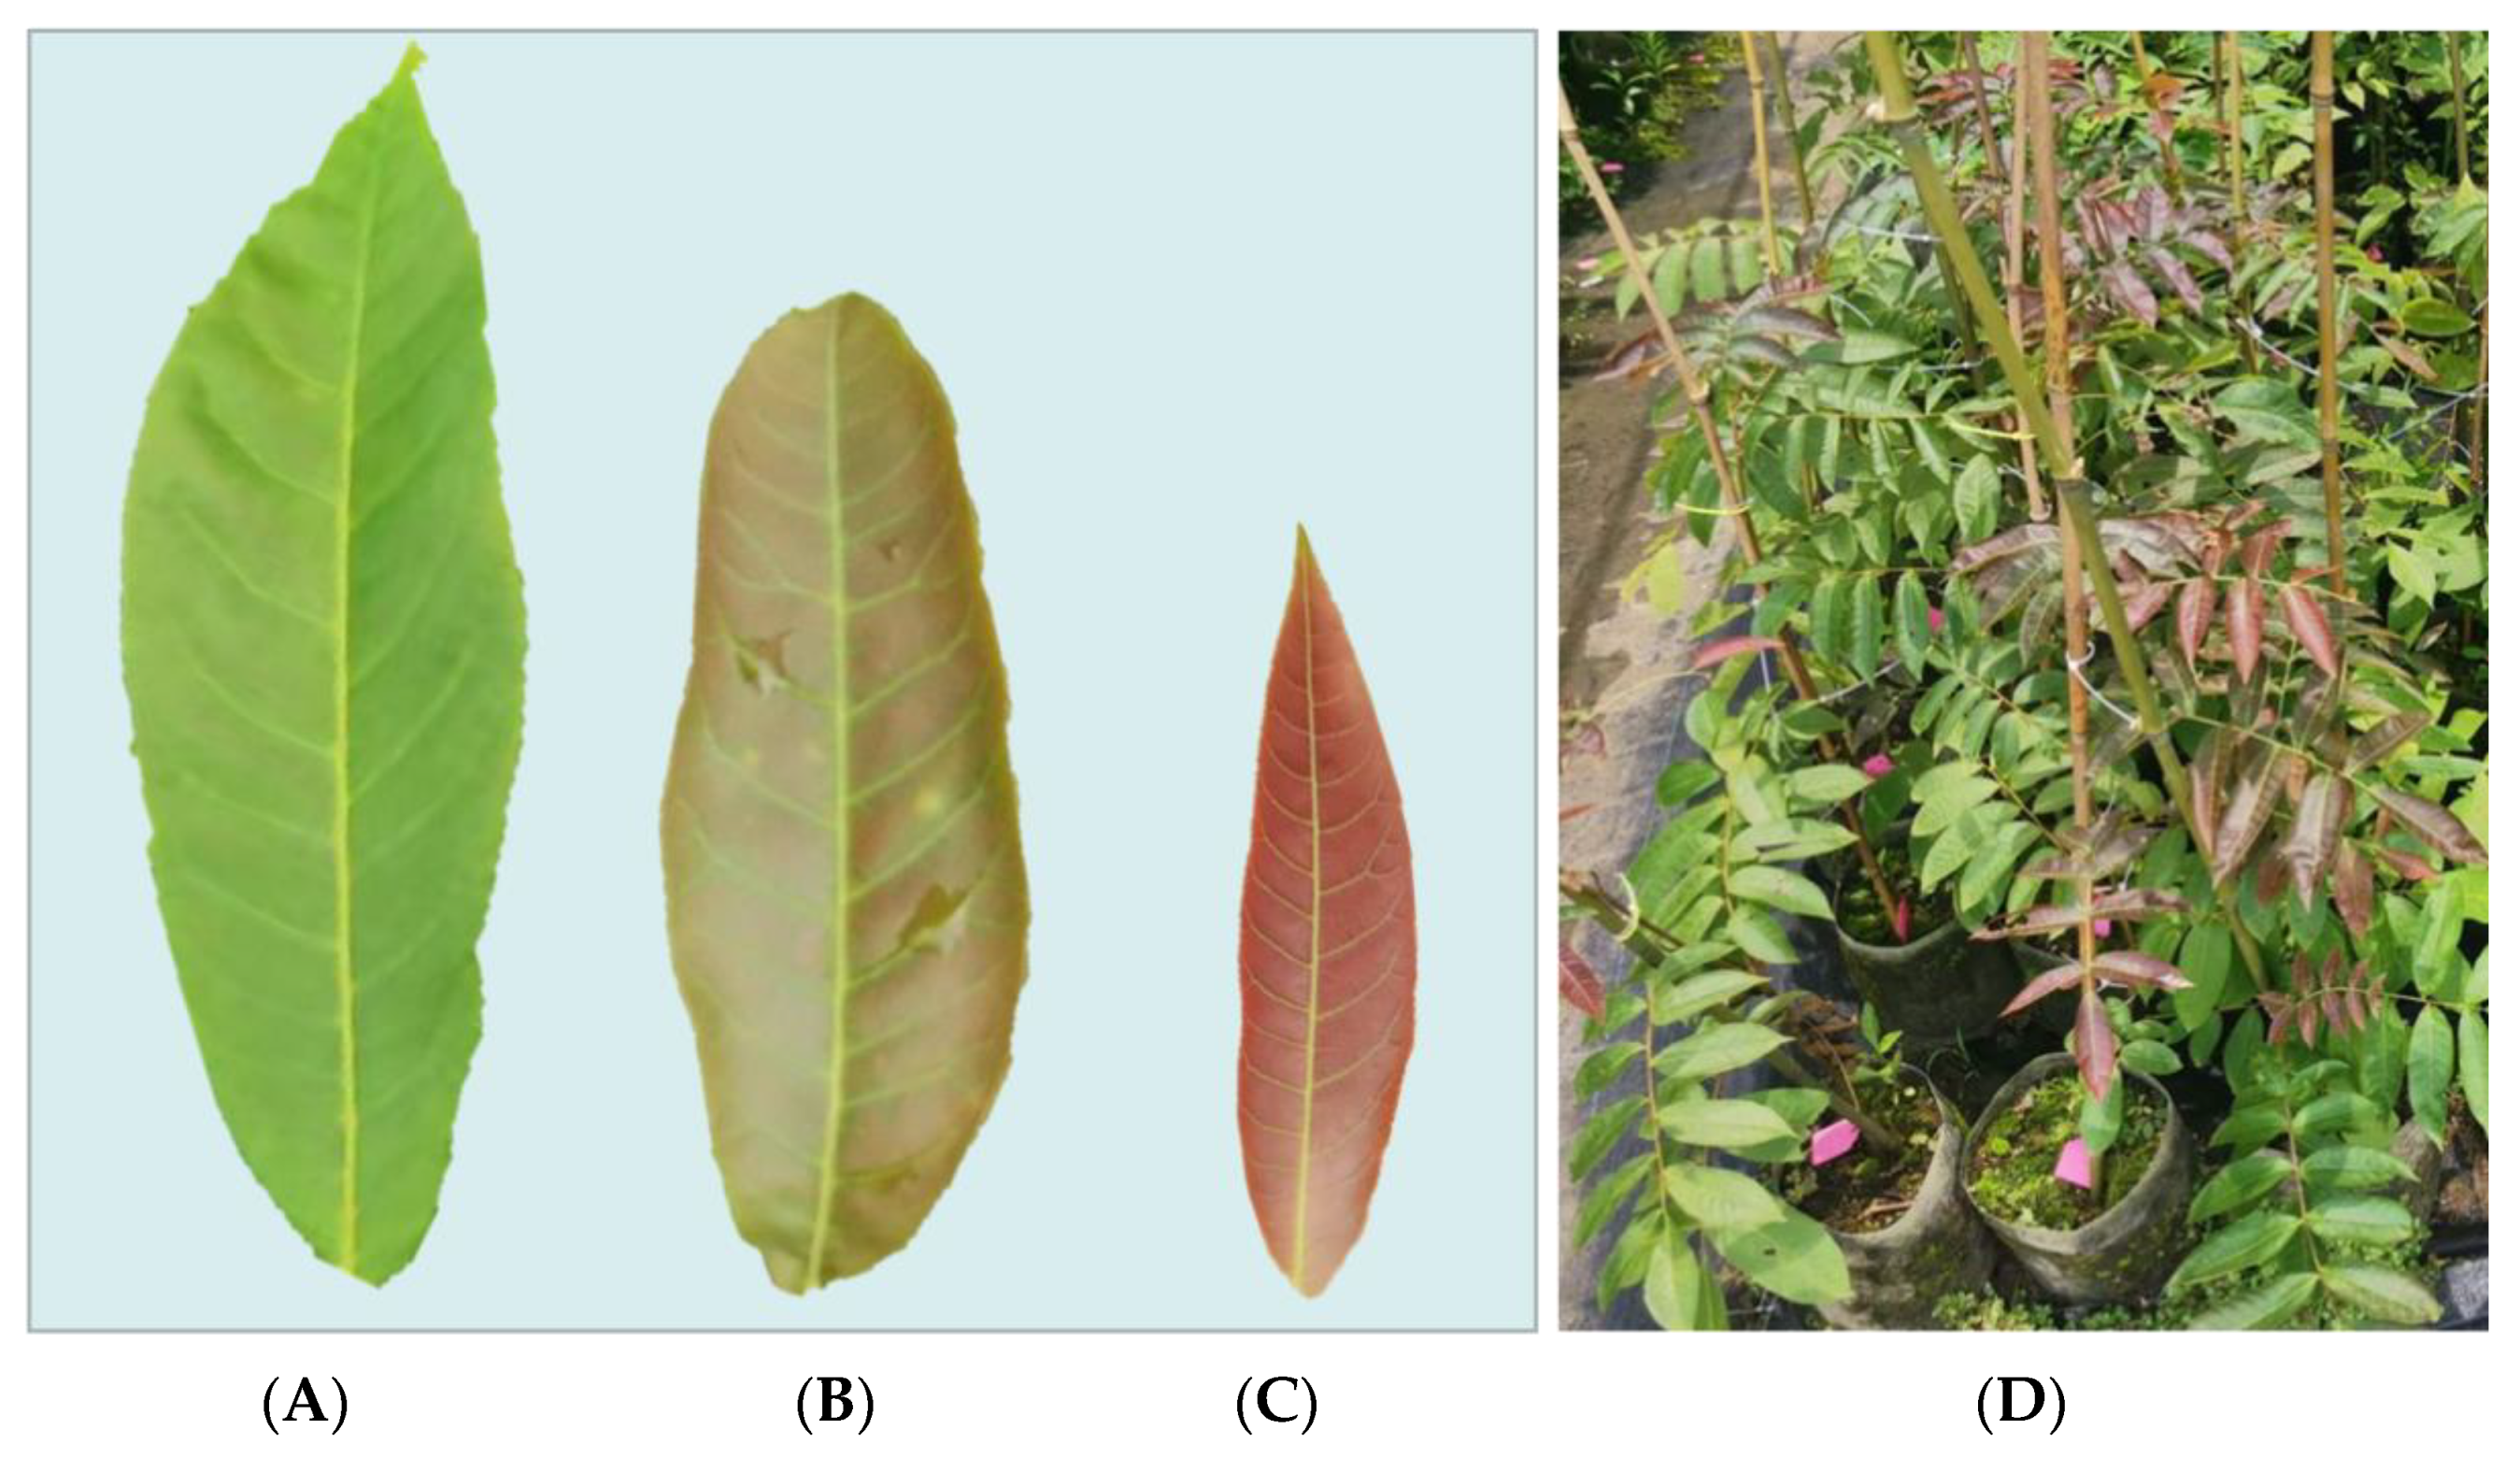
2.1. Plant Materials

The plants used in this study were grown at the germplasm resource nursery for C. paliurus, which is located in Nanjing, China. This area is in a mid-subtropical region. The annual average temperature is 15.4 °C, the annual frost-free period is 237 days, the annual average sunshine index is 2240 h, and the annual average rainfall is 1087.4 mm. The laboratory experiments were conducted at Nanjing Forestry University in Xuanwu District of Nanjing, Jiangsu Province, China.
Three-year-old C. paliurus clonal seedlings were sampled. Leaf samples were collected at three stages: the young red-leaf stage, intermediate stage, and mature green-leaf stage. Three samples were collected for each stage, from plants with similar growth under homogeneous site conditions (Figure 1). Leaves with consistent age, similar growth, and no obvious diseases or pests were selected for analysis. The samples were frozen rapidly in liquid nitrogen, transferred to dry ice, and stored at −80 °C until metabolic and transcriptomic analyses.

2.2. Determination of Metabolites

Metabolomic analyses were conducted using ultra-high performance liquid chromatography (UPLC) and tandem mass spectrometry (MS/MS) (Applied Biosystems 4500 QTRAP). Metabolites were identified using an in-house database. The methods used for sample preparation and extraction, UPLC separation, MS/MS, and qualitative and quantitative determination of metabolites were as described by Sun et al. (2021) [19]. Wuhan MetWare Biotechnology Co., Ltd. (www.metware.cn, accessed on 10 May 2023) provided technical support for the metabolomics analysis.

2.3. Transcriptome Analysis

Transcriptome data were obtained for leaf samples at three different growth stages. The transcriptome data were mapped to the reference genome for tetraploid C. paliurus, which we determined in our previous research [6]. The reference genome data for tetraploid C. paliurus have been deposited in GenBank at the NCBI (https://www.ncbi.nlm.nih.gov/, accessed on 15 May 2023) under the accession number MW118603.1. The methods used for RNA extraction from samples, RNA quantification, and sequencing of leaf transcriptomes were as described previously [19]. Transcriptome sequencing was performed on the Illumina Hiseq2500 platform to generate 150-bp paired-end sequences, with technical support from the Wuhan Maivey Company. The raw data of RNA sequences generated in this study have been deposited at the NCBI (www.ncbi.nlm.nih.gov/bioproject/PRJNA723183, accessed on 17 May 2023) [20].
The transcriptomic data were saved in FastQC format and then assembled by Trinity (version r20140717) using the paired-end method. Functional annotations were assigned to genes using the Kyoto Encyclopedia of Genes and Genomes (KEGG), Gene Ontology (GO), and Clusters of Orthologous Groups of proteins (COG) databases. Gene transcript levels in the UniGene library were determined using the RSEM method with Bowtie. The number of reads mapped to each gene was determined using Feature Counts v1.5.0-p3, and then FPKM (exon fragments per million fragments) values were calculated. Differentially expressed genes (DEGs) were identified using the DESeq2R package in R. The DEGs were identified as those showing a >2-fold change in transcript levels in pairwise comparisons. The false discovery rate (FDR) correction for DEGs was set to p < 0.05. Enrichment analysis of DEGs was conducted using the KEGG and GO platforms.

2.4. Data Analysis

The DEGs and differential metabolites detected in the same comparison group were mapped to the KEGG pathway map to better understand the relationship between genes and metabolites.
According to the results of KEGG enrichment analysis of differential metabolites and DEGs, the KEGG pathways coenriched with both differential metabolites and DEGs were selected. Statistical analyses such as multiple comparisons, cluster analysis, and analysis of variance were performed using SPSS v. 17.0 software. Principal component analysis was performed using Rv.2.5.0 (R Development Core Team, 2007) [19]. Canonical correlation analysis (CCA) of the DEGs and differential metabolites in each selected pathway were conducted using the CCA package in R. Cluster analysis and principal component analysis of metabolome data were conducted and the cluster heat map was constructed using tools in R (www.r-project.org/, accessed on 30 June 2023) [19]. The fold change values and VIP values of the orthogonal partial least squares discriminant analysis (OPLS-DA) model were combined to screen for metabolites showing significant differences among the three leaf samples using the KEGG database. Differential metabolites were annotated and displayed and then subjected to KEGG classification and enrichment analysis based on pathway types.

3. Results

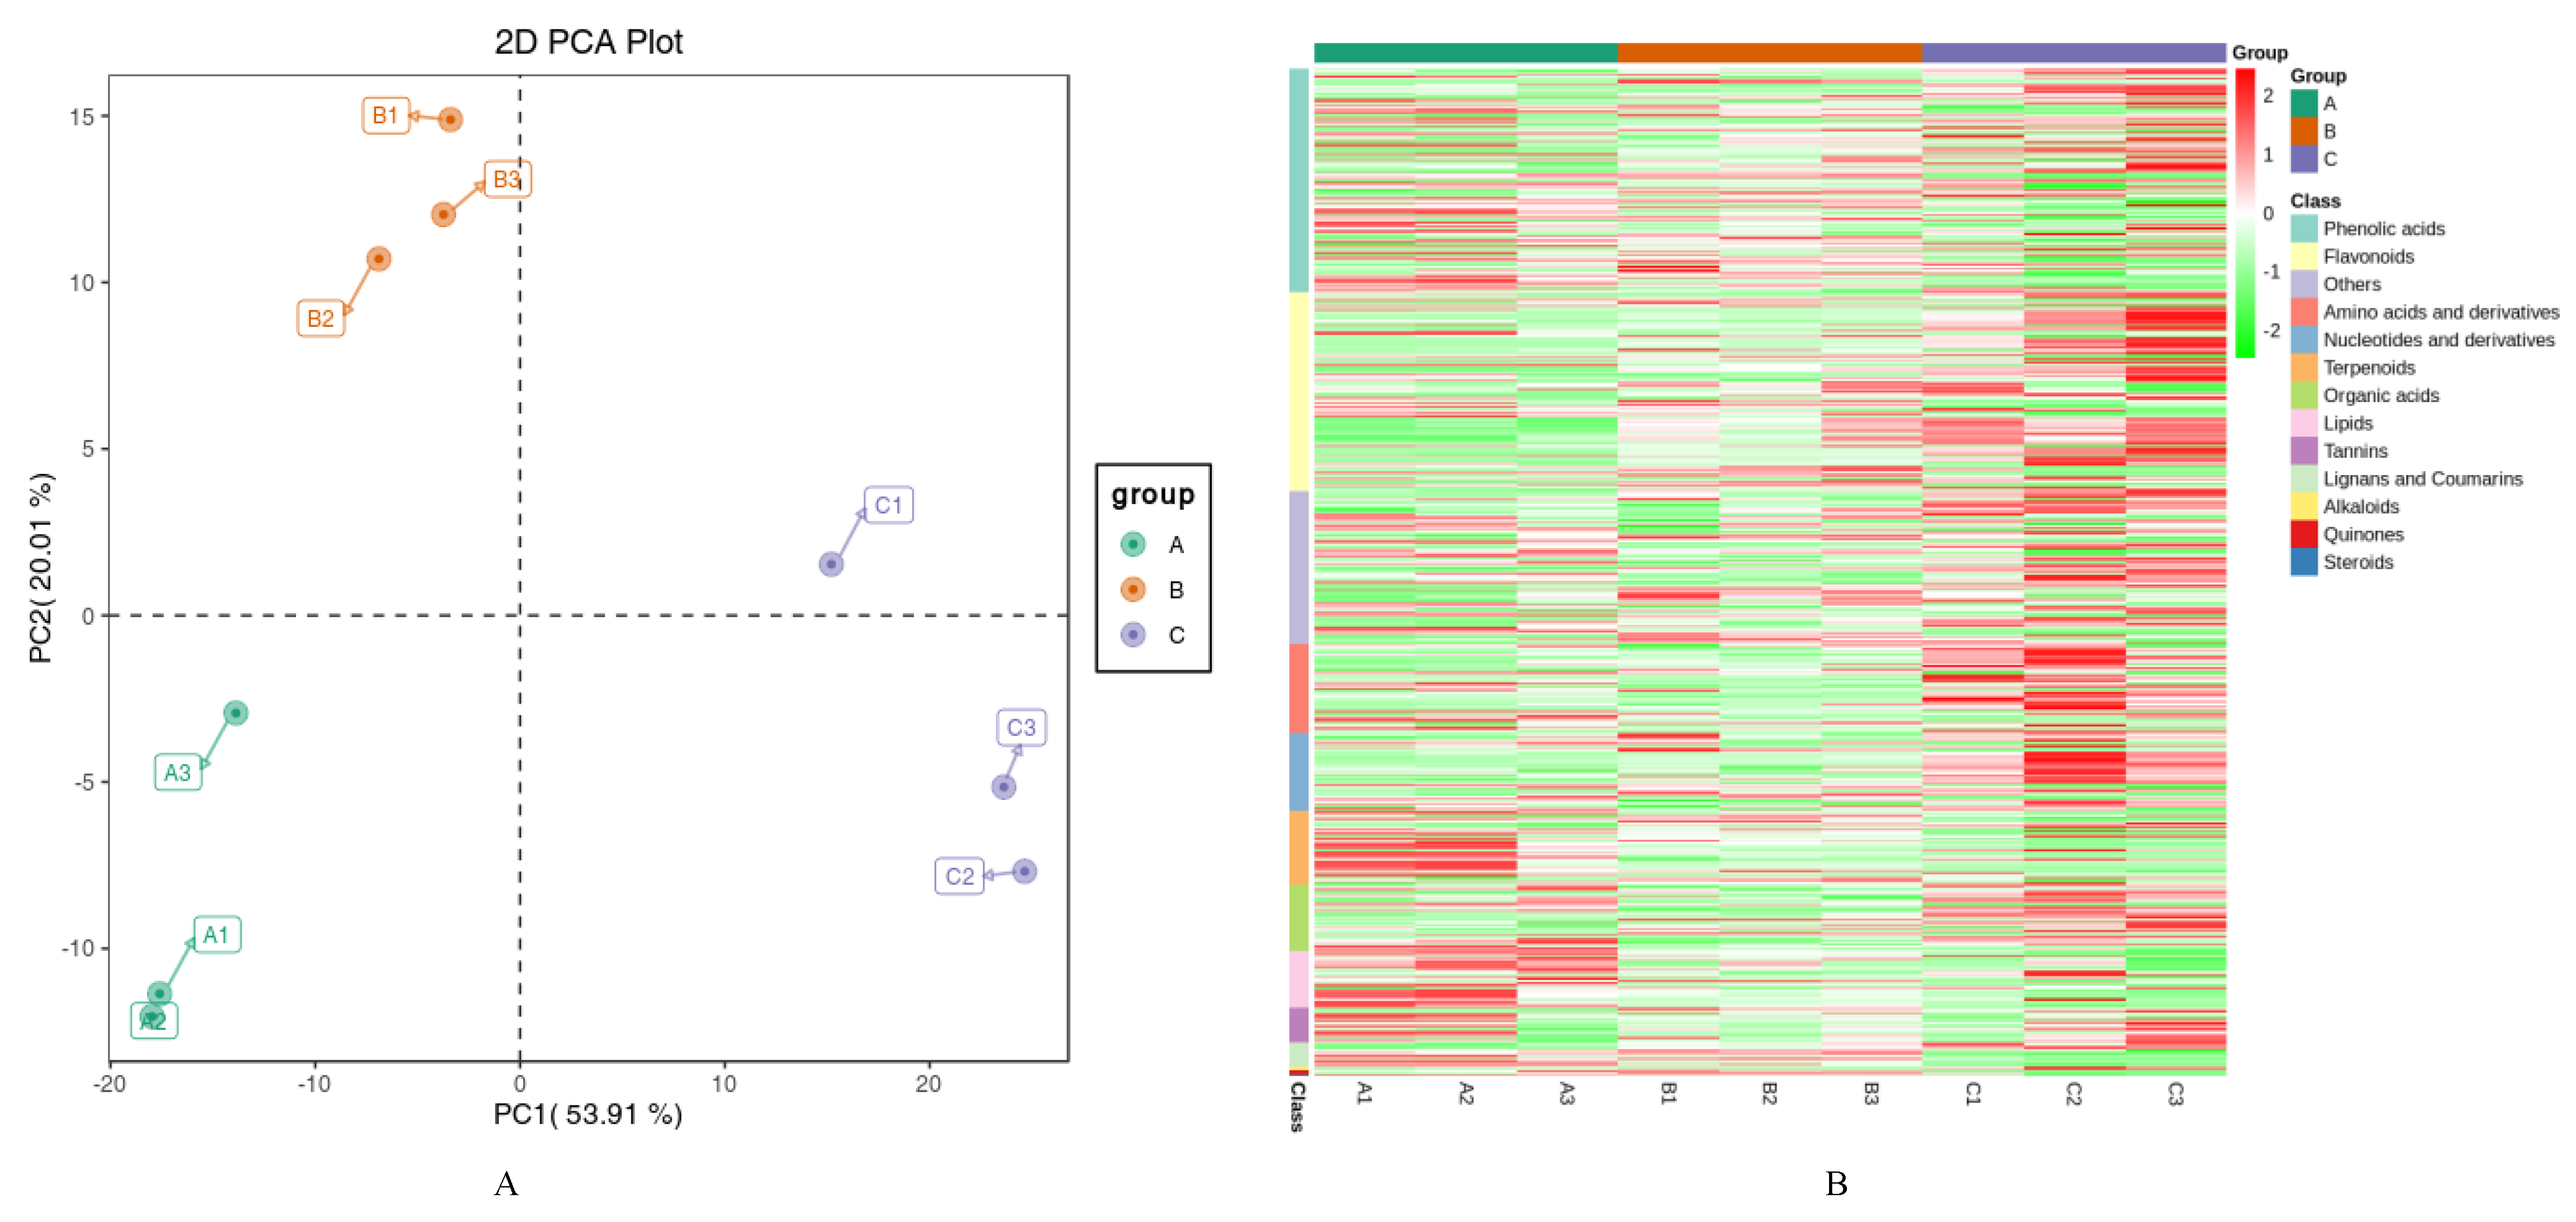
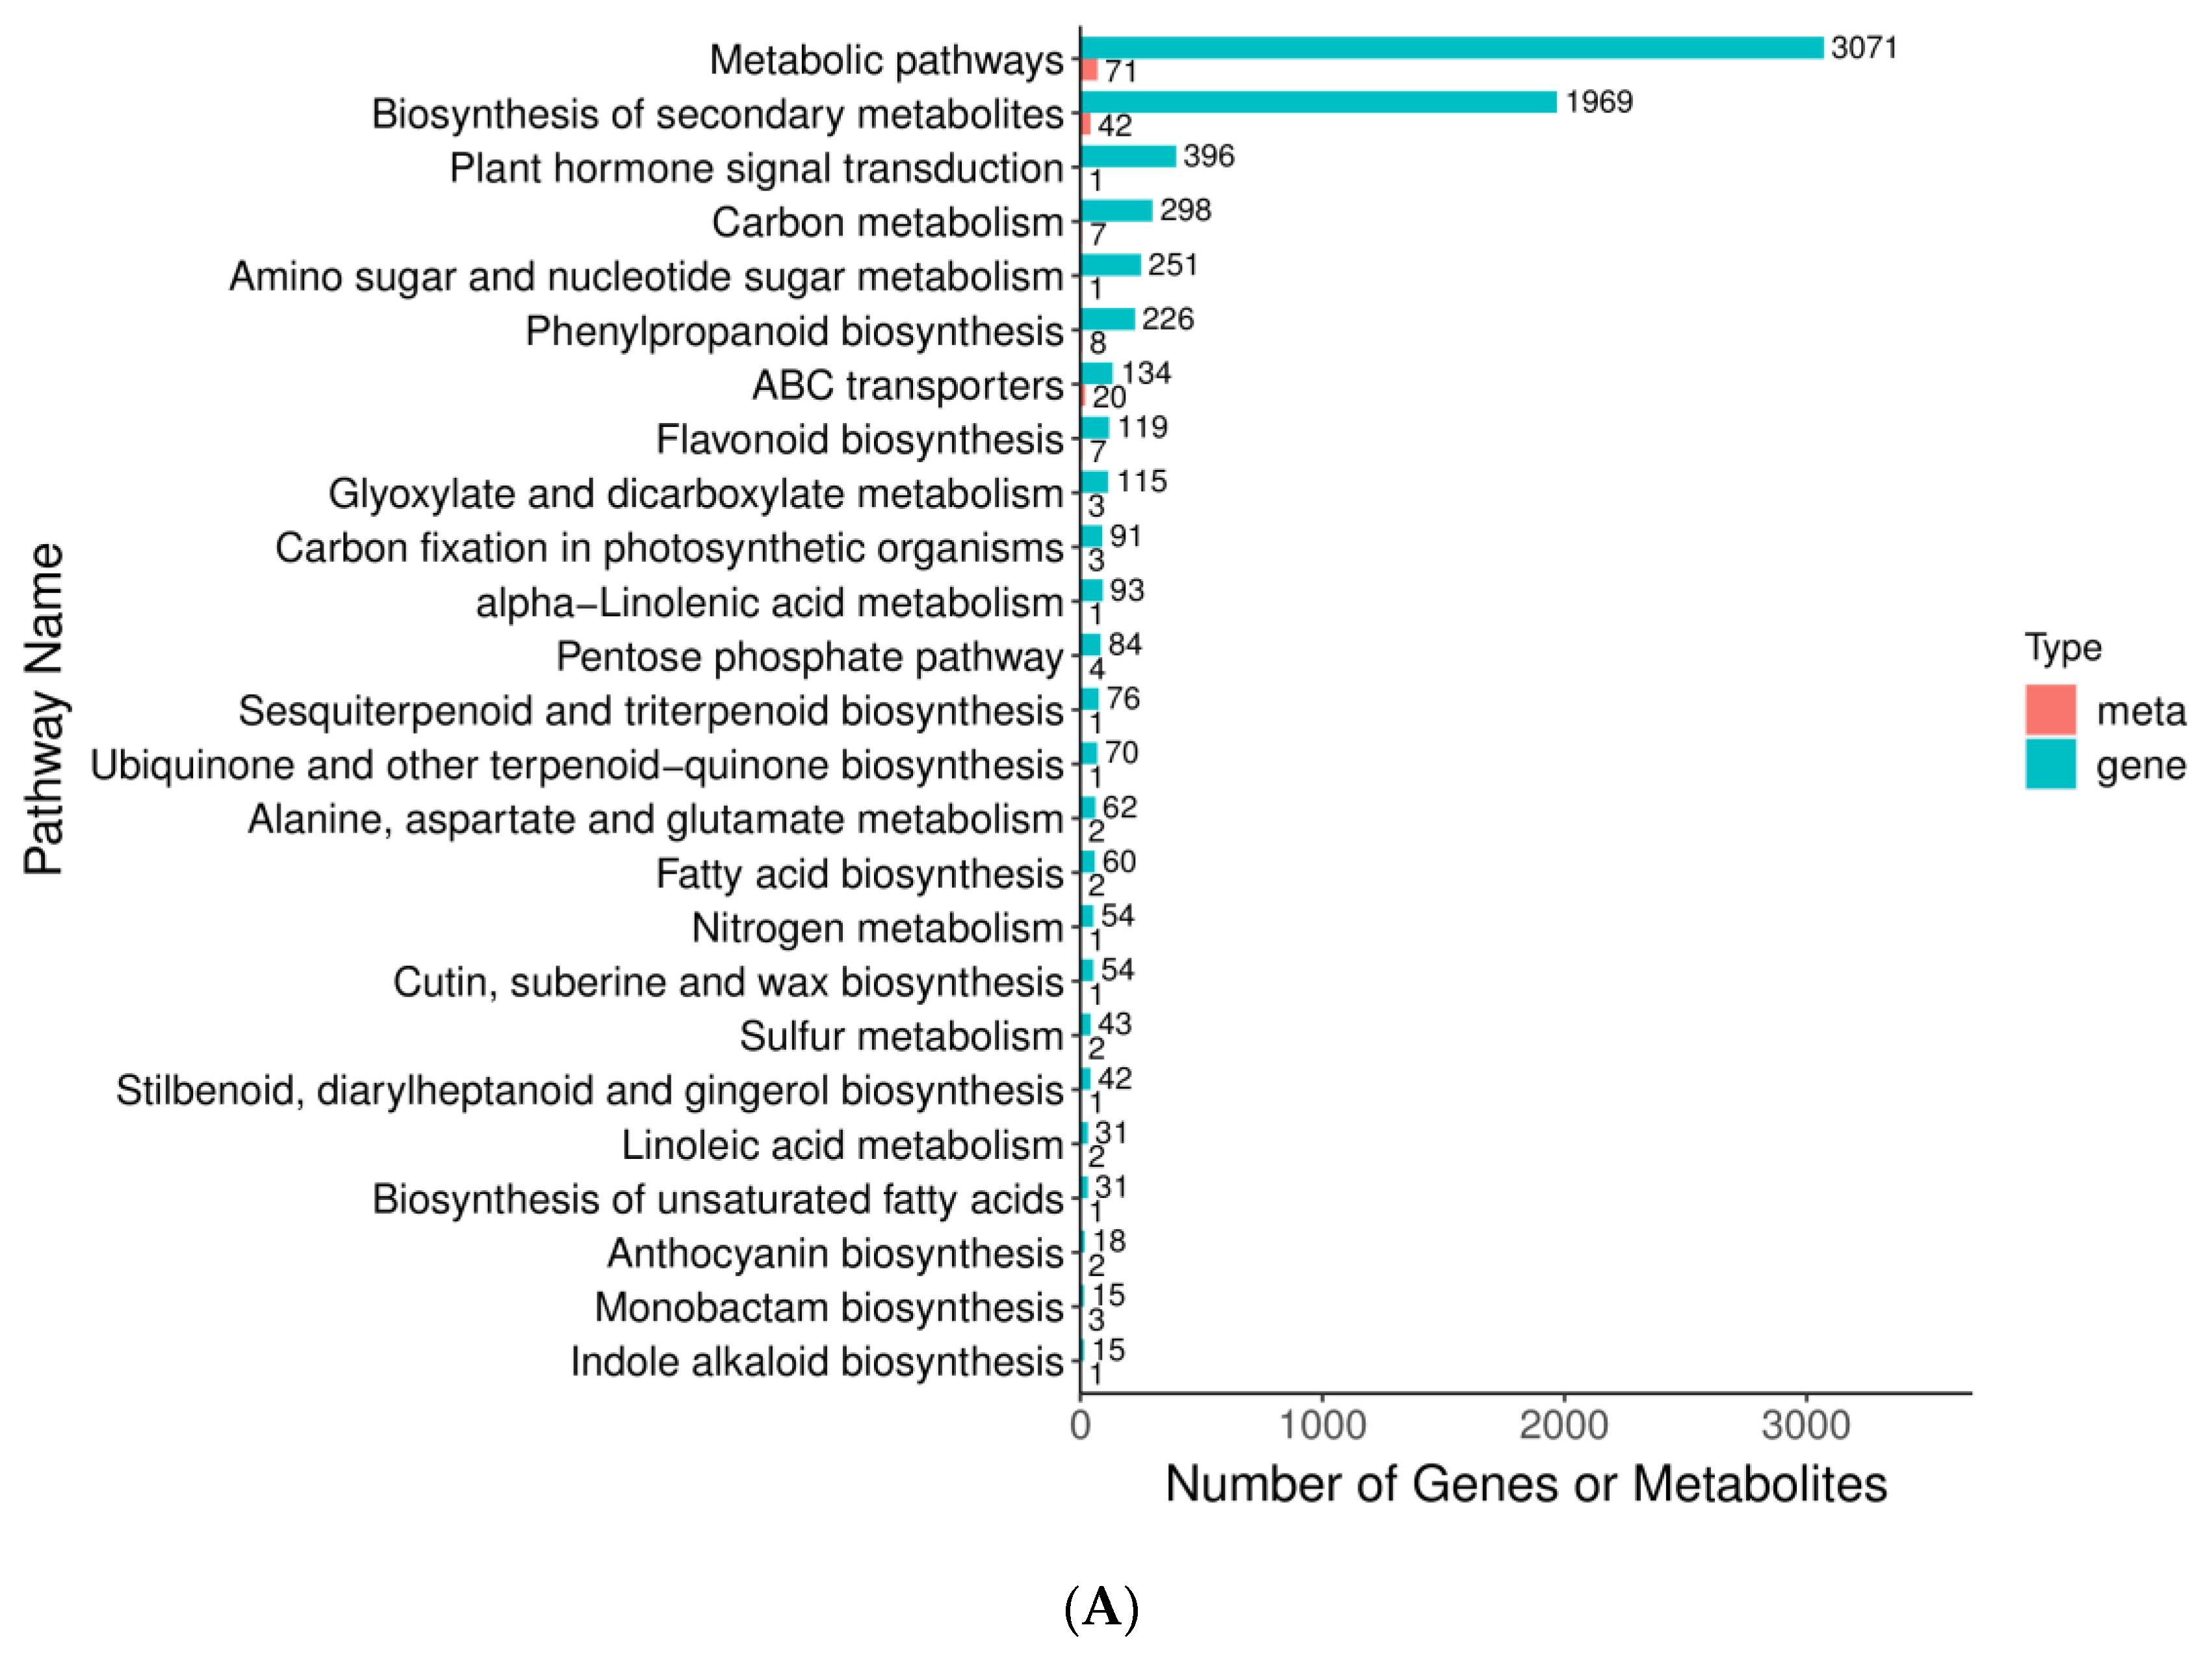
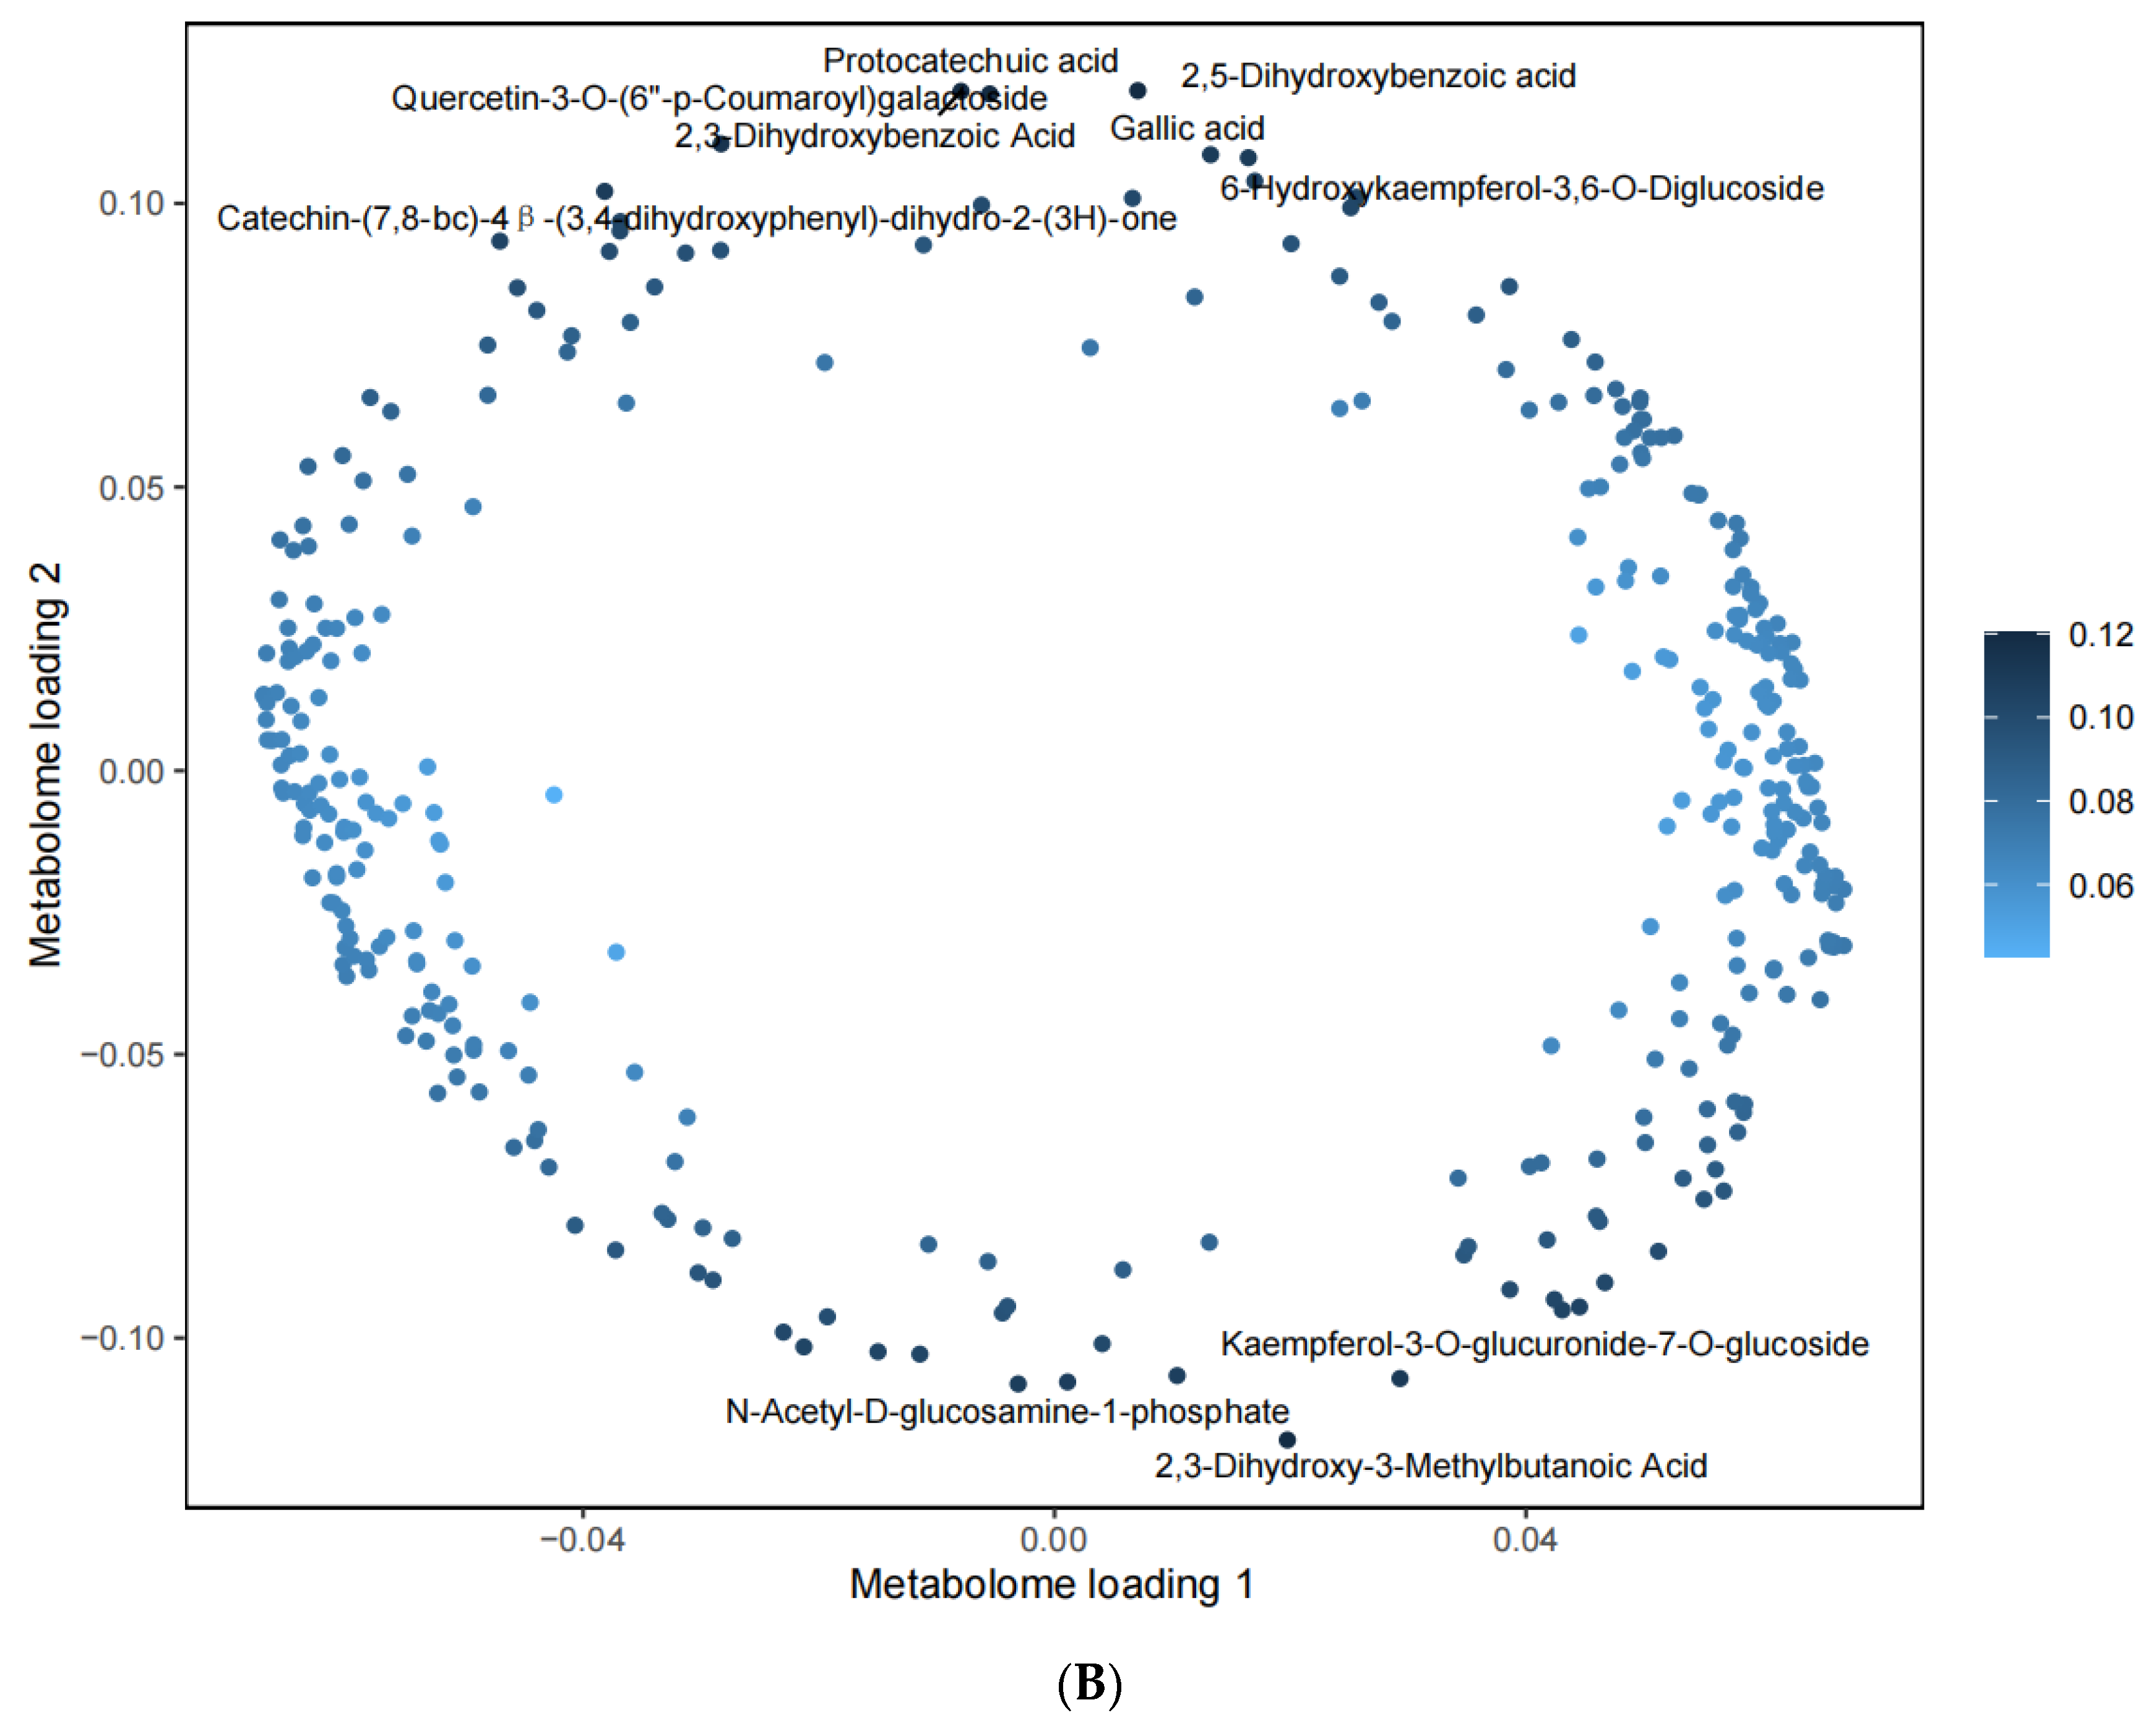
3.1. Metabolism and Transcriptome Association Analysis
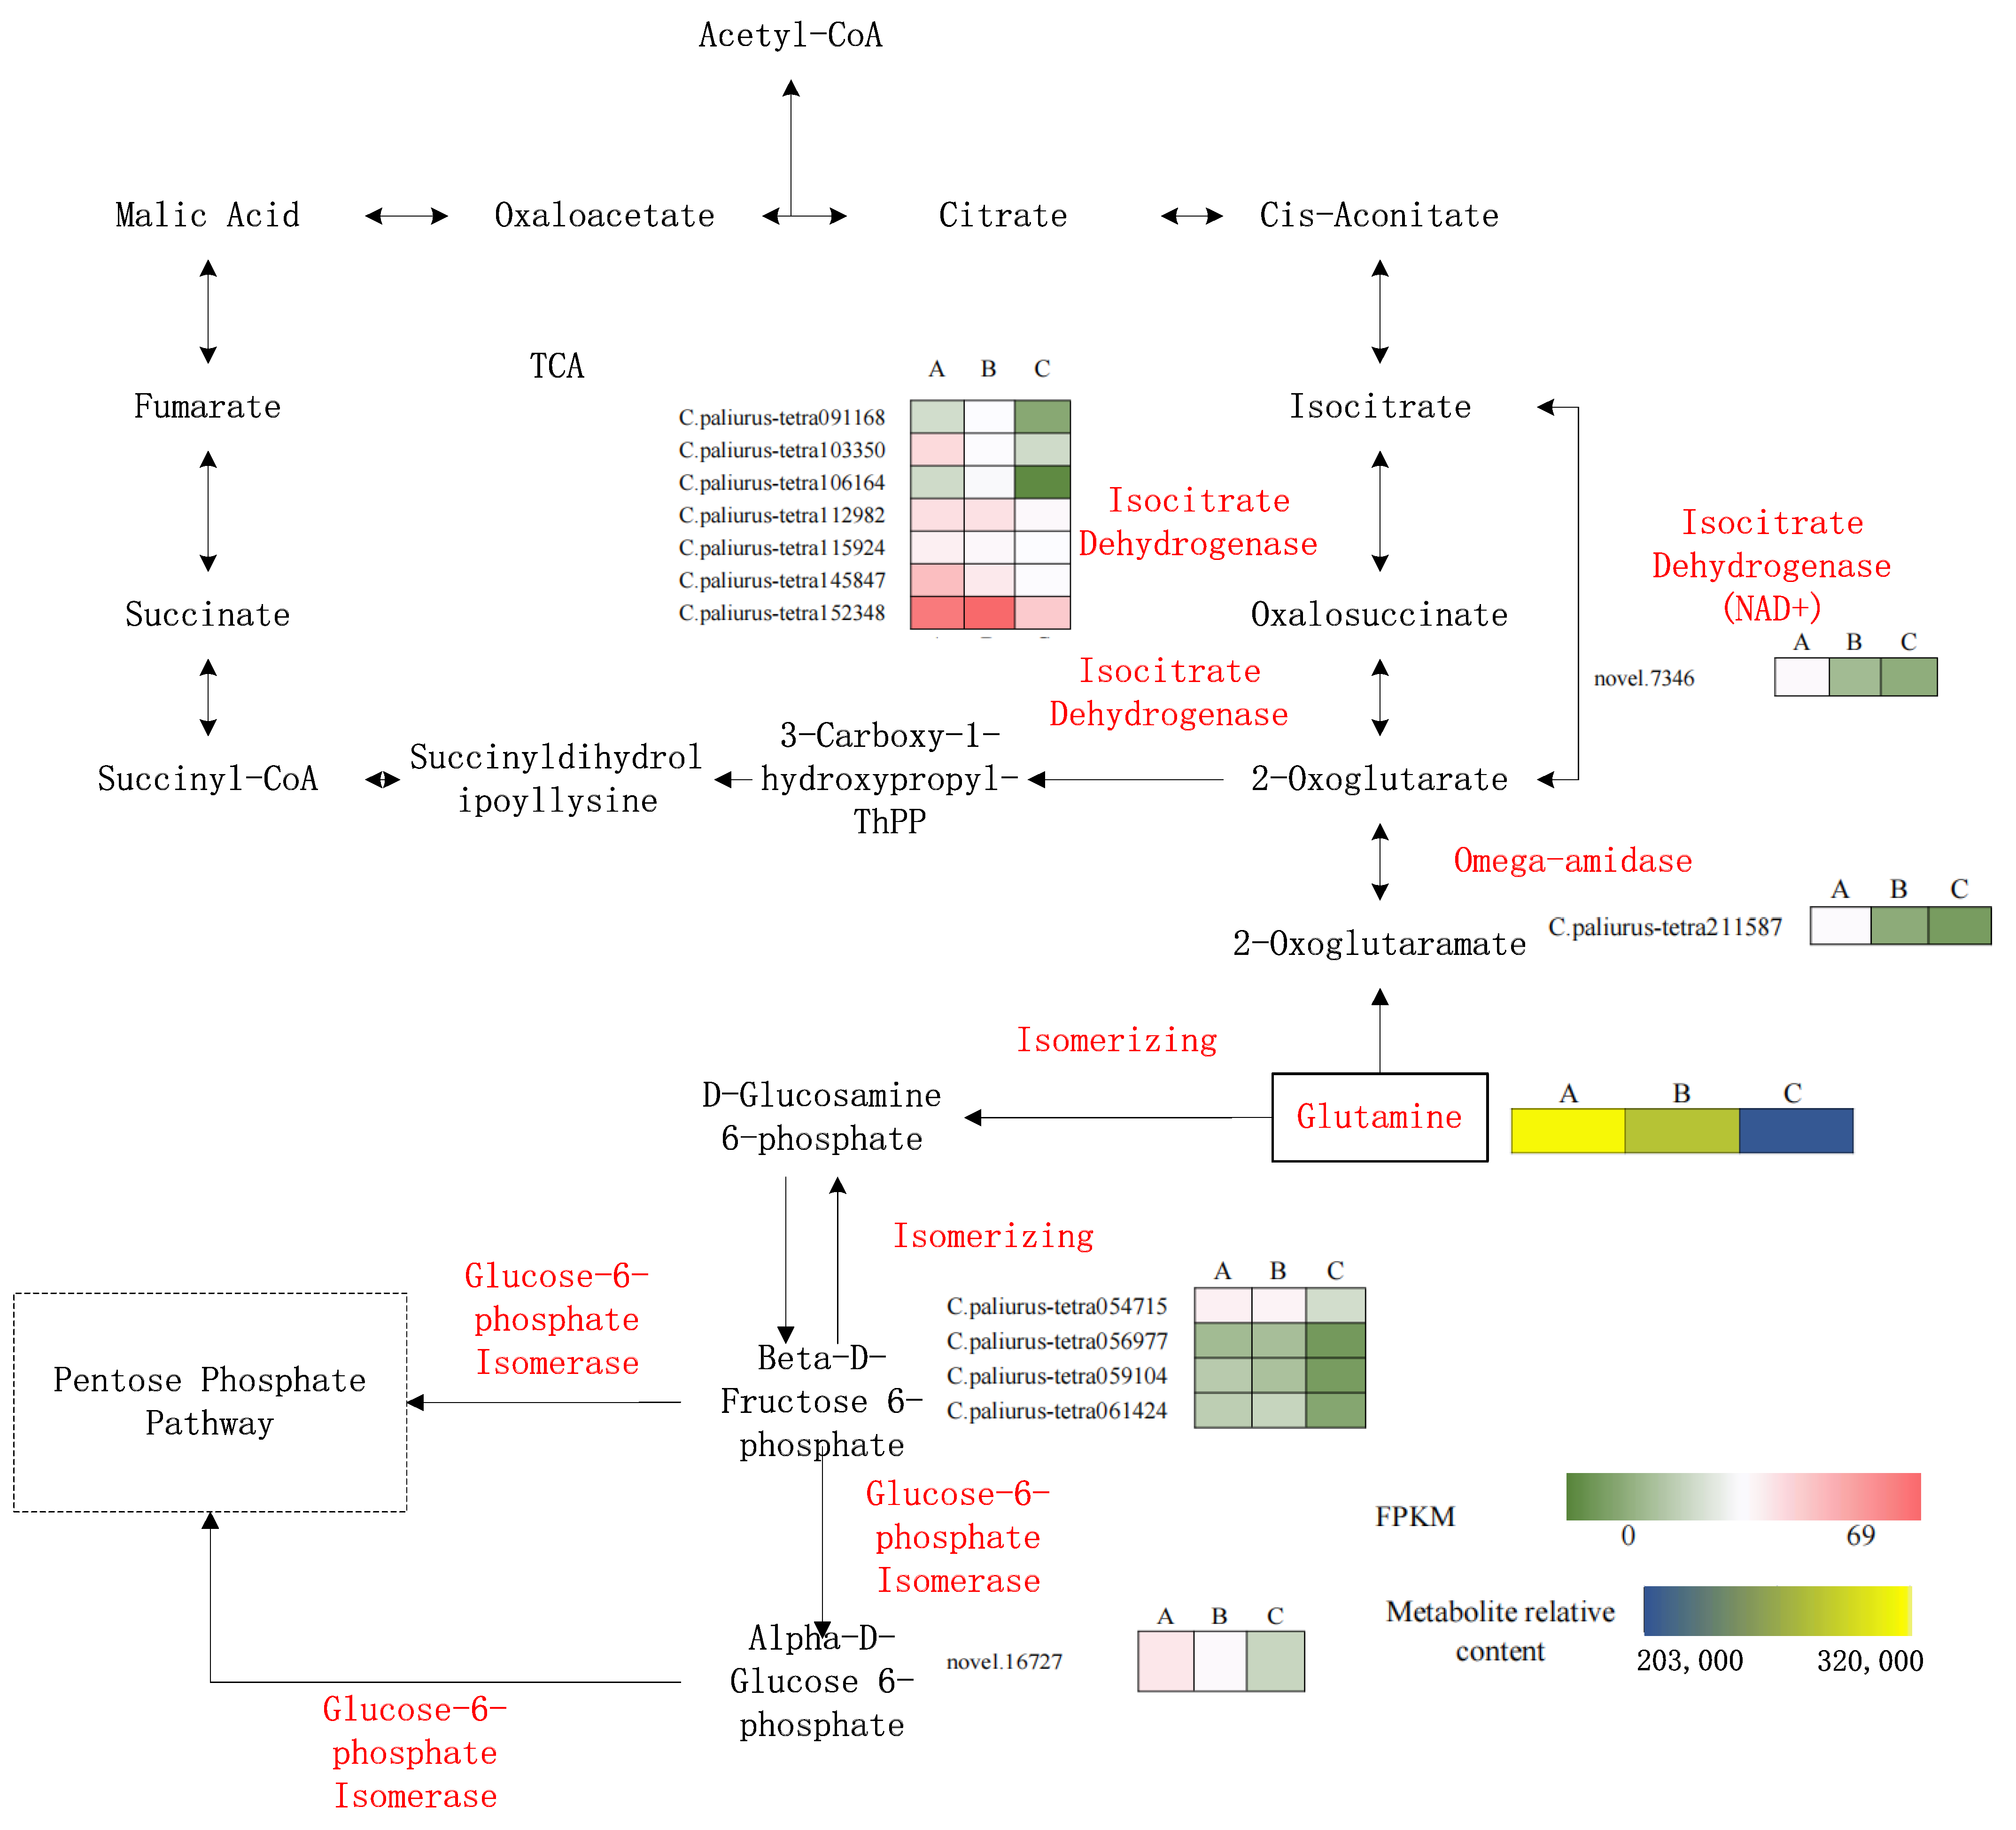
In the PCA of the metabolomic data, the leaf samples formed three separate groups (Figure 2A), confirming that C. paliurus leaves at the three growing stages showed significantly different metabolite compositions. A heat map was constructed to visualize the upregulated and downregulated metabolites in leaves at different stages of development (Figure 3B). There were differences in the concentrations of phenolic acids, flavonoids, amino acids, nucleotides, and triterpenoids among leaves at different growth stages. Compared with mature green leaves (A stage), the young red leaves (C stage) had higher concentrations of phenolic acids, flavonoids, and some amino acids. However, the concentrations of triterpenoids and tannins were higher in mature green leaves than in young red leaves.
According to the KEGG enrichment analyses (Figure 3A), the activities of amino acid biosynthesis, fatty acid biosynthesis, and flavone and flavonol biosynthesis pathways differed among the three stages of leaf growth. Our results revealed seven related DEGs in carbon metabolism, eight DEGs in phenylpropanoid biosynthesis, seven DEGs in flavonoid biosynthesis, and four DEGs in the pentose phosphate pathway. These results indicated that both primary and secondary metabolism differed among the three stages of leaf growth. According to the associated OPLS-DA analysis (Figure 3B), the metabolites most strongly correlated with DEGs were selected. These metabolites consisted of four flavonoids (quercetin-3-O-(6″-p-coumaroyl)galactoside, kaempferol-3-O-glucuronide-7-O-glucoside, 6-hydroxykaempferol-3,6-O-diglucoside, and catechin-(7,8-bc)-4β-(3,4-dihydroxyphenyl)-dihydro-2-(3H)-one); two phenolic acids (protocatechuic acid and 2,5-dihydroxybenzoic acid); one organic acid (2,3-dihydroxybenzoic acid); one tannin (gallic acid); and one other compound (N-acetyl-D-glucosamine-1-phosphate). These results showed that the biosynthesis of flavonoids and phenolic acids was regulated differently among leaves at different growth stages. To identify specific metabolites related to each biosynthesis pathway, we explored the relationships between genes and metabolites in different KEGG pathways.

3.2. N Metabolism

The results of the association analysis indicated that nitrogen metabolism significantly changed during leaf growth. As shown in Figure 4, genes encoding a nitrite transporter, nitrate reductase, and nitronate monooxygenase were significantly upregulated during leaf growth, indicating that nitrogen assimilation was enhanced as the leaves matured. As a result, the glutamine content was increased in mature green leaves, and the downregulation of glutamate synthase led to glutamine accumulation, which affected some related physiological activities (Table 1). Analyses of glutamine metabolism pathway enrichment revealed that both glutamine-fructose-6-phosphate transaminase and omega-amidase were upregulated, which supported the biosynthesis of D-glucosamine phosphate and 2-oxoglutarate (Figure 5). As a result, 2-oxoglutarate accumulated to higher levels as the leaves matured, thereby promoting the activity of the tricarboxylic acid (TCA) cycle. The upregulation of fructose 6-phosphate transaminase and glucose 6-phosphate isomerase during leaf development meant that D-glucosamine phosphate, which is a substrate for amino acid metabolism, was converted into beta-D-fructofuranose 6-phosphate and alpha-D-glucose 6-phosphate.
According to the association analysis, glutamine accumulated to high concentrations in mature green leaves, and related genes also exhibited high transcript levels in mature green leaves. Based on the amino acid biosynthesis (Table 1), the increase in glutamine content was related to increased contents of lysine, tryptophan, histidine, N-acetyl-L glutamic acid, and ribulose-5-phosphate. Glutamine accumulation also led to reduced contents of D-erythrosine-4-phosphate, phenylalanine, arginine, and lutein, implying that nitrogen metabolism is regulated not only by amino acids but also by secondary metabolites.

3.3. Relationships between Metabolites in Specific Pathways and DEGs

We conducted CCAs to explore the relationships between metabolites in specific pathways and up- and downregulation of gene expression during leaf development.
The CCA of the carbon fixation pathway showed that it was downregulated during leaf growth, and related genes in this pathway were highly correlated with the downregulation of D-erythrose-4-phosphate and aspartic acid (Figure 6A). These results highlight that nitrogen assimilation was upregulated and carbon assimilation was downregulated in mature green leaves compared with young red leaves. This may have affected downstream metabolic pathways, including secondary metabolism. As shown in Table 1, amino sugar metabolism provided substrates for ribose 5-phosphate biosynthesis in the growing leaves, while D-erythrose 4-phosphate accumulation was restrained by the downregulation of transketolase in the pentose phosphate pathway.
In the CCA of the pentose phosphate pathway (Figure 6B), decreases in the contents of D-erythrose-4-phosphate, D-ribose, and gluconic acid were highly correlated with the expression levels of related genes. However, the increased ribulose-5-phosphate content was only weakly correlated with increased expression of related genes. The increase in ribulose-5-phosphate content might be attributed to the decrease in D-erythrose-4-phosphate content and limited availability of substrates for the downstream biosynthesis pathway (Table 1).
In the CCA of phenylalanine, tyrosine, and tryptophan biosynthesis (Figure 6C), phenylalanine, shikimic acid and tryptophan all decreased alongside decreased D-erythrose-4-phosphate content, and the related genes were also downregulated. The decreased D-erythrosine-4-phosphate content led to the accumulation of phenylalanine, shikimic acid, and tryptophan.
In the CCA of the shikimic acid pathway (Figure 6D), the decreased D-erythrose 4-phosphate content led to substrate limitation for phenylalanine metabolism. In the mature green leaf period, 3-deoxy-7-phospholipid synthase, chorismate kinase, and chorismate mutase were significantly downregulated because of the lower contents of shikimate and phenylalanine.
In the CCA of the phenylpropanoid biosynthesis pathway (Figure 6E), the decreased phenylalanine content was related to the decreased 5-O-p-coumaroylquinic acid content, and the related genes were also downregulated. Intermediate products of lignans, including coniferal dehyde, coniferal alcohol, and syringin accumulated continuously in the mature green-leaf stage. Mature green leaves tended to accumulate lignans despite substrate limitation, but flavonoid accumulation was limited as indicated by the reduced contents of naringenin chalcone, pinobanksin, luteolin, quercetin, and 5-O-p-coumaroylquinic acid.
In the flavonoid biosynthetic pathway, the naringenin chalcone content decreased significantly along with decreases in the contents of phenylalanine and 5-O-p-coumaroylquinic acid (Figure 6F). As the naringenin chalcone content decreased, the contents of gallocatechin and epigallocatechin increased during leaf growth. The increased contents of these compounds downstream of the flavonoid biosynthesis pathway, as well as the upregulation of genes related to flavonoid biosynthesis, indicates that some branches of the flavonoid biosynthesis pathway were upregulated despite the shortage of substrates.
In the flavone and flavonol biosynthesis pathway (Figure 6F), the contents of quercetin, quercetin-3-O-glucoside, and quercetin-3-O-rutinoside content decreased as the luteolin content decreased during leaf growth, whereas the contents of kaempferol-3-O-rhamnoside, apigenin-6-C-glucoside, and kaempferol-3-O-rutinoside increased during leaf growth. Despite the shortage of substrates, genes involved in flavone and flavonol biosynthesis were upregulated during leaf growth, leading to the accumulation of flavones. The biosynthesis of anthocyanins downstream of flavonol biosynthesis was inevitably limited by the lack of substrates, and the production of cyanidin-3-O-glucoside and delphinidin-3-O-glucoside decreased as the leaves matured.

3.4. Acetyl-CoA Biosynthesis

According to the transcriptome analysis, glutamine accumulation in the mature green leaves regulated not only the pentose phosphate pathway but also the TCA cycle (Figure 5). The regulation of gene expression related to omega amidase is known to affect the amount of 2-oxoglutarate entering the TCA cycle. Isocitrate dehydrogenase and NAD+ were also enhanced facilitating the conversion of 2-oxoglutarate into isocitrate. This would facilitate the conversion of isocitrate to citrate, thereby providing more acetyl-CoA as the substrate for downstream pathways. Both acetyl-CoA and acetoacetyl-CoA are used as substrates by hydroxymethylglutaryl-CoA synthase, hydroxymethylglutaryl-CoA reductase (Figure 5), phosphomevalonate kinase, and diphosphomevalonate decarboxylase in the mevalonate pathway. This pathway synthesizes the terpenoid backbone, and its up-regulation leads to triterpenoid accumulation [19]. These findings indicate that the triterpenoid pathway was enhanced during leaf growth and that this pathway obtained more substrate (as acetyl-CoA) from nitrogen assimilation than from carbon assimilation.

4. Discussion

The biosynthesis and accumulation of secondary metabolites form a complex process that is largely influenced by the trade-off between primary and secondary metabolism, in addition to being regulated by biosynthetic pathways themselves. Thus, only limited conclusions can be drawn from studies on secondary metabolic pathways alone. Studies using a combination of metabolome and transcriptome analyses can reveal the differential expression of metabolic regulatory networks across different stages of leaf development. Characterization of the transcriptomic and metabolic profiles can clarify the trade-off between primary and secondary metabolism and comprehensively reflect the overall picture of metabolic pathway expression, thereby shedding light on the mechanisms by which different secondary metabolites accumulate during leaf growth.
Ruan et al. (2010) found that more glutamine accumulated in Camellia sinensis (L.) O. Kuntze tissues when they were supplied with sufficient nitrogen [13]. Similarly, we found that mature green leaves accumulated more glutamine than did young red leaves, suggesting that mature green leaves exhibit stronger nitrogen assimilation. Ruan et al. (2010) detected a small change in glutamate content and attributed it to homeostatic adjustment in the plant [13]. We also detected a small change in glutamate content in the maturing C. paliurus leaves in this study. The downregulation of glutamate synthase was related to the increase in glutamine content, which in turn restricted the biosynthesis of arginine and ornithine. Our results suggest that glutamine is a major source of carbon and nitrogen in mature green leaves, and its consumption may lead to carbon limitation. Lyubetskaya et al. (2006) suggested that carbon limitation adjusts the activity of the pentose phosphate pathway, with an increase in glucose-6-phosphate biosynthesis leading to ribulose-5-phosphate synthesis [21]. Consistent with the results of previous studies, we found that mature green leaves of C. paliurus tended to favor ribose-5-phosphate synthesis over D-erythrose-4-phosphate synthesis through enhanced glucose-6-phosphate synthesis, which further reduced the amount of substrate available for the phenylalanine biosynthesis pathway.
Flavonoid synthesis is mainly affected by phenylalanine ammonia-lyase. Qin et al. (2022) [10] also found that an intermediate nitrogen fertilizer level increased the contents of secondary metabolites, including flavonoids, triterpenoids, and polyphenols, in C. paliurus leaves. Sheng et al. (2021) found that the total flavonoid content first increased and then decreased during the growth of C. paliurus leaves, and attributed this to differences in the expression levels of genes encoding MYBs, UFGTs, and enzymes in the flavonoid biosynthesis pathway [22]. Du et al. (2022) observed that the total amino acid content continuously decreased during the development of C. paliurus leaves [23]. Yue et al. (2023) also found that the addition of nitrogen improved the photosynthetic efficiency of C. paliurus seedlings [24]. In contrast, Deng et al. (2019) found that carbon assimilation played a role in flavonoid accumulation, but an adequate nitrogen supply was also necessary [9]. The results of those studies implied that amino acids and secondary metabolite biosynthesis are connected within a metabolic network, but did not reveal details of their interactions. In the present study, we found that nitrogen restricted flavonoid accumulation via phenylalanine deficiency, rather than via downregulation of phenylalanine ammonia-lyase. Therefore, the decrease in flavonoid content during the growth of C. paliurus leaves may be attributed to the preferential supply of nitrogen to amino acid biosynthesis pathways, and to the limited supply of substrates for the flavonoid biosynthesis pathway.
In this study, we found that nitrogen strongly affected both primary and secondary metabolism in the leaves. Deng et al. (2019) [9] also considered that nitrogen availability significantly influenced flavonoid accumulation in C. paliurus, with a moderate level (0.63 mmol NH4NO3) of nitrogen fertilizer resulting in the highest total flavonoid content per plant [9]. Qin et al. (2021) [25] found that the nitrogen form significantly affected the accumulation of phenolic compounds. Deng et al. (2019) observed that the accumulation patterns of quercetin, isoquercitrin, and kaempferol were the same because they share the same biosynthesis pathway, and that the biosynthesis of flavanone-3-hydroxylase was strongly correlated with the total flavonoid content per plant, indicating that flavanone-3-hydroxylase was the key regulating enzyme [9]. In the present study, however, quercetin and kaempferol showed different patterns of accumulation, despite the overall enhancement of the flavonoid biosynthesis pathway during leaf development. It may therefore be inferred that the lack of phenylalanine caused a decrease in the accumulation of flavonoids and changes in the composition of flavonoids during leaf growth. This means that the leaves of C. paliurus exhibited differences in nitrogen and carbon assimilation efficiency at different stages of development, further affecting secondary metabolite biosynthesis downstream.
Our results show that in the maturing leaves of C. paliurus, the phenylalanine biosynthesis pathway, which is upstream of flavonoid biosynthesis, was downregulated by the lack of D-erythrose 4-phosphate as the substrate. The lack of substrate limited the accumulation of most flavonoids, including cyanidin-3-O-glucoside and delphinidin-3-O-glucoside. The activity of associated enzymes in the flavonoid biosynthesis pathway was more active in older leaves than in younger ones, resulting in the continuous accumulation of kaempferol-3-O-rutinoside, a product of the flavonoid biosynthesis pathway. Triterpenoid synthesis increased in mature green leaves because of the regulation of the flux of the terpenoid backbone, for which acetyl-CoA serves as the primary substrate. Previously, we found that key structural genes involved in the synthesis of the triterpenoid skeleton showed significant differences in their expression levels among different stages of leaf development. Furthermore, the changes in gene expression were consistent with the accumulation patterns of most triterpenoid monomers during leaf growth. In addition, genes encoding glycosyltransferases were found to be upregulated as the leaves matured [19]. Our previous study also found that phosphomevalonate kinase and diphosphomevalonate decarboxylase in the mevalonate pathway of terpenoid backbone biosynthesis were upregulated, resulting in further triterpenoid accumulation [19]. The results of the present study are consistent with the idea that the utilization of glutamine by the TCA cycle promotes acetyl-CoA biosynthesis, which supplies sufficient substrate for the mevalonate pathway. In their study on Ganoderma lucidum cells, Lian et al. (2021) also found that the carbon skeletons integrated into triterpenoids came from the TCA cycle and glycolysis under nitrogen-limited conditions [26].
This study presents a comprehensive analysis of the differential expression of metabolic regulatory networks across different leaf growth stages in C. paliurus, based on integrated metabolome and transcriptome data. Furthermore, we elucidate the intricate trade-off between primary and secondary metabolism, providing an overall depiction of metabolic pathways. To further investigate this trade-off, validation of RNA-Seq results through qPCR is required for specific biosynthesis pathways.

5. Conclusions

Transcriptomic and non-targeted metabolomic analyses were performed for C. paliurus leaves at different stages of growth. The major physiological changes during leaf growth were identified. The mature green leaves exhibited higher nitrogen assimilation and lower carbon assimilation than the young red leaves of C. paliurus, and this was identified as the main cause of the metabolic changes in the leaves. As a major source of carbon and nitrogen, glutamine accumulated in the leaves of C. paliurus and inhibited phenylalanine biosynthesis by modulating the pentose phosphate pathway. However, the accumulated glutamine also promoted acetyl-CoA biosynthesis through the TCA cycle, leading to a decrease in flavonoid content and an increase in triterpenoid content. These findings provide new insights into secondary metabolite biosynthesis in C. paliurus.

Author Contributions

Methodology and experimental design, C.S.; data curation, C.S.; data analysis, C.S.; Prepared with original draft by C.S.; Written, reviewed and edited by S.F. and X.S.; Acquisition of funds, C.S., S.F. and X.S. All authors have read and agreed to the published version of the manuscript.

Funding

This work was supported by the Key Research and Development Program of Jiangsu Province (BE2019388), the National Natural Science Foundation of China (32201541), the Priority Academic Program Development of Jiangsu Higher Education Institutions (PAPD) and the Doctorate Fellowship Foundation of Nanjing Forestry University. Funders had no role in the study. Design, data collection and analysis, decision to publish or preparation of the manuscript.

Data Availability Statement

The datasets generated during and/or analyzed during the current study are not publicly available due the data also form part of an ongoing study but are available from the corresponding author on reasonable request.

Conflicts of Interest

The authors declare no conflict of interest.

References

  1. Liu, Y.; Cao, Y.N.; Fang, S.Z.; Wang, T.L.; Yin, Z.Q.; Shang, X.L.; Yang, W.X.; Fu, X.X. Antidiabetic effect of Cyclocarya paliurus leaves depends on the contents of antihyperglycemic flavonoids and antihyperlipidemic triterpenoids. Molecules 2018, 23, 1042. [Google Scholar] [CrossRef] [PubMed]
  2. Qu, Y.Q.; Shang, X.L.; Fang, S.Z.; Zhang, X.T.; Fu, X.X. Genome assembly of two diploid and one auto-tetraploid Cyclocarya paliurus genomes. Sci. Data 2021, 12, 146. [Google Scholar] [CrossRef]
  3. Sun, C.; Zhong, W.; Fu, X.; Shang, X.; Fang, S. A study on growth and aboveground biomass production of juvenile Cyclocarya paliurus plantations. J. Nanjing For. Univ. 2022, 46, 138–144. [Google Scholar] [CrossRef]
  4. Yang, W.X.; Zhuang, J.Q.; Ding, S.Y.; Zhang, M.; Tian, Y.; Wan, S.Y.; Fang, S.Z. Study on cutting cultivation technology and rooting mechanism of Cyclocarya paliurus. Ecol. Chem. Eng. 2022, 29, 379–389. [Google Scholar] [CrossRef]
  5. Fang, S. A review on the development history and the resource silviculture of Cyclocarya paliurus industry. J. Nanjing For. Univ. 2022, 46, 115–126. [Google Scholar] [CrossRef]
  6. Qu, Y.Q.; Shang, X.L.; Zeng, Z.Y.; Yu, Y.H.; Bian, G.L.; Wang, W.L.; Liu, L.; Tian, L.; Zhang, S.C.; Wang, Q.; et al. Whole-genome duplication reshaped adaptive evolution in a relict plant species, Cyclocarya paliurus. Dev. Reprod. Biol. 2023. [Google Scholar] [CrossRef] [PubMed]
  7. Wang, Q.; Chen, B.; Chen, X.; Mao, X.; Fu, X. Squalene epoxidase (SE) gene related to triterpenoid biosynthesis assists to select elite genotypes in medicinal plant: Cyclocarya paliurus (Batal.) Iljinskaja. Plant Physiol. Biochem. 2023, 199, 107726. [Google Scholar] [CrossRef] [PubMed]
  8. Zhang, L.; Liu, Y.; Zhang, Z.; Fang, S.Z. Physiological response and molecular regulatory mechanism reveal a positive role of nitric oxide and hydrogen sulfide applications in salt tolerance of Cyclocarya paliurus. Front. Plant Sci. 2023, 14, 1211162. [Google Scholar] [CrossRef]
  9. Deng, B.; Li, Y.Y.; Xu, D.D.; Ye, Q.Q.; Liu, G.H. Nitrogen availability alters flavonoid accumulation in Cyclocarya paliurus via the effects on the internal carbon/nitrogen balance. Sci. Rep. 2019, 9, 2370. [Google Scholar] [CrossRef]
  10. Qin, J.; Yue, X.L.; Fang, S.Z.; Qian, M.Y.; Zhou, S.T.; Shang, X.L.; Yang, W.X. Nitrogen addition modifies the relative gene expression level and accumulation of carbon-based bioactive substances in Cyclocarya paliurus. Plant Physiol. Biochem. 2022, 188, 70–80. [Google Scholar] [CrossRef]
  11. Sun, C.; Shang, X.; Ding, H.; Cao, Y.; Fang, S. Natural variations in flavonoids and triterpenoids of Cyclocarya paliurus leaves. J. For Res. 2020, 32, 805–814. [Google Scholar] [CrossRef]
  12. Sun, C.; Shang, X.; Fang, S.; Yang, W.; Cao, Y.; Ding, H.; Li, X. Association Analysis between Genotype and Environment: Differentiation between Cyclocarya paliurus Resources That Accumulate Triterpenoids. Front. Plant Sci. 2022, 13, 945897. [Google Scholar] [CrossRef]
  13. Ruan, J.; Haerdter, R.; Gerendás, J. Impact of nitrogen supply on carbon/nitrogen allocation: A case study on amino acids and catechins in green tea [Camellia sinensis (L.) O. Kuntze] plants. J. Plant Biol. 2010, 12, 724–734. [Google Scholar] [CrossRef] [PubMed]
  14. Zeng, C.; Lin, H.; Liu, Z.; Liu, Z. Metabolomics analysis of C. sinensis with respect to harvesting time. Food Res. Int. 2020, 128, 108814. [Google Scholar] [CrossRef] [PubMed]
  15. Liu, J.; Liu, M.; Fang, H.; Zhang, Q.; Ruan, J. Accumulation of Amino Acids and Flavonoids in Young Tea Shoots Is Highly Correlated With Carbon and Nitrogen Metabolism in Roots and Mature Leaves. Front. Plant Sci. 2021, 12, 756433. [Google Scholar] [CrossRef] [PubMed]
  16. Zhou, W.; Liang, X.; Li, K.; Dai, P.; Li, J.; Liang, B.; Sun, C.; Lin, X. Metabolomics analysis reveals potential mechanisms of phenolic accumulation in lettuce (Lactuca sativa L.) induced by low nitrogen supply. Plant Physiol. Biochem. 2021, 158, 446–451. [Google Scholar] [CrossRef] [PubMed]
  17. Zhao, L.; Zhang, B.; Huang, H.J.; Huang, W.J.; Zhang, Z.R.; Wang, Q.N.; Luo, H.L.; An, B. Metabolomic and transcriptomic analyses provide insights into metabolic networks during cashew fruit development and ripening. Food Chem. 2022, 404, 134765. [Google Scholar] [CrossRef] [PubMed]
  18. Boex-Fontvieille, E.R.A.; Gauthier, P.P.G.; Gilard, F.; Hodges, M.; Tcherkez, G.G.B. A new anaplerotic respiratory pathway involving lysine biosynthesis in isocitrate dehydrogenase-deficient Arabidopsis mutants. New Phytol. 2013, 199, 673–682. [Google Scholar] [CrossRef]
  19. Sun, C.; Fang, S.; Shang, X. Triterpenoids biosynthesis regulation for leaf coloring of wheel wingnut (Cyclocarya paliurus). Forests 2021, 12, 1733. [Google Scholar] [CrossRef]
  20. Sun, C.; Fang, S.; Shang, X. Flavonoid biosynthesis regulation for leaf coloring of Cyclocarya paliurus. Acta Physiol. Plant. Vol. 2023, 45, 91. [Google Scholar] [CrossRef]
  21. Lyubetskaya, A.V.; Rubanov, L.I.; Gelfand, M.S. Use of the flux model of amino acid metabolism of Escherichia coli. Biochemistry 2006, 71, 1256–1260. [Google Scholar] [CrossRef] [PubMed]
  22. Sheng, X.; Chen, H.; Wang, J.; Zheng, Y.; Li, J. Joint transcriptomic and metabolic analysis of flavonoids in Cyclocarya paliurus leaves. ACS Omega 2021, 6, 9028–9038. [Google Scholar] [CrossRef] [PubMed]
  23. Du, Z.K.; Lin, W.D.; Zhu, J.X.; Li, J.M. Amino acids profiling and transcriptomic data integration demonstrates the dynamic regulation of amino acids synthesis in the leaves of Cyclocarya paliurus. PeerJ 2022, 10, e13689. [Google Scholar] [CrossRef] [PubMed]
  24. Yue, X.L.; Liu, X.F.; Fang, S.Z. Influence of nitrogen and phosphorus additions on parameters of photosynthesis and chlorophyll fluorescence in Cyclocarya paliurus seedlings. Photosynthetica 2023, 61, 318–327. [Google Scholar] [CrossRef]
  25. Qin, J.; Yue, X.L.; Ling, Y.; Zhou, Y.S.; Li, N.; Shang, X.L.; Fang, S.Z. Nitrogen form and ratio impact phenolic accumulation and related gene expression in Cyclocarya paliurus. Trees 2021, 35, 685–696. [Google Scholar] [CrossRef]
  26. Lian, D.H.; Li, L.; Liu, X.; Zhong, X.; Wang, H.Z.; Zhou, S.; Gu, L. Time-scale dynamics of proteome predicts the central carbon metabolism involved in triterpenoid accumulation responsive to nitrogen limitation in Ganoderma lucidum. Fungal Biol. 2021, 125, 294–304. [Google Scholar] [CrossRef]
Figure 1. Different stages of leaf growth in clonal C. paliurus saplings with red leaves. (A) = mature green-leaf stage; (B) = intermediate stage; (C) = young red-leaf stage; (D) = C. paliurus saplings with leaves at different stages of growth.
Forests 14 01948 g001
Figure 2. Metabolism analysis on C. paliurus (Batalin) Iljinsk. leaves at different growth stages. Note: (A), PCA plots showing metabolite accumulation patterns in C. paliurus leaves at different growth stages. A = mature green-leaf stage; B = intermediate stage; C = young red-leaf stage; (B), Heatmap clustering of three replicates of C. paliurus leaf samples at different stages based on metabolite profiles. Red indicates upregulated metabolites and green indicates downregulated metabolites. A = mature green-leaf stage; B = intermediate stage; C = young red-leaf stage.
Forests 14 01948 g002
Figure 3. Metabolism and transcriptome association analysis in different growth stages of C. paliurus leaves. Note: (A) KEGG enrichment bar chart comparing mature green-leaf stage and young red-leaf stage. Horizontal coordinate represents the number of differential metabolites and differentially expressed genes enriched in the pathway, vertical coordinate shows KEGG pathway name. Red and green bars represent metabolome and transcriptome data, respectively; (B) Results of OPLS-DA analysis, showing metabolites most strongly correlated with DEGs.
Forests 14 01948 g003aForests 14 01948 g003b
Figure 4. Correlation network diagram of nitrogen metabolism pathway. Green square indicates metabolite, red circles indicate genes. Solid lines indicate positive correlations and dashed lines indicate negative correlations.
Forests 14 01948 g004
Figure 5. Modulation of genes related to nitrogen assimilation during leaf growth of C. paliurus. Histograms show FPKM values of genes and relative contents of metabolites. Charts in green and red represent down- and upregulated genes, respectively; graphs in blue and yellow represent down- and upregulated metabolites, respectively.
Forests 14 01948 g005
Figure 6. CCA of DEGs and differential metabolites in the KEGG enrichment pathways. Note: Metabolites are labeled in purple circles and genes in red circles. (A) CCA of DEGs and differential metabolites in the carbon fixation pathway; (B) CCA of DEGs and differential metabolites in the pentose phosphate pathway; (C) CCA of DEGs and differential metabolites in phenylalanine, tyrosine and tryptophan biosynthesis; (D) CCA of DEGs and differential metabolites in phenylpropanoid biosynthesis; (E) CCA of DEGs and differential metabolites in flavonoid biosynthesis; (F) CCA of DEGs and differential metabolites in flavone and flavonol biosynthesis.
Forests 14 01948 g006
Table 1. Differentially accumulated metabolites during C. paliurus (Batalin) Iljinsk. leaf growth and their related biosynthetic pathways.
MetaboliteStageClass
ABC
L-Glutamine3.05 × 106 ± 1.45 × 10⁵ b3.17 × 106 ± 2.03 × 10⁵ b4.94 × 106 ± 6.38 × 10⁵ aAmino acids and derivatives
N-Acetyl-L-Glutamine3.05 × 106 ± 1.45 × 10⁵ a3.17 × 106 ± 2.03 × 10⁵ a4.94 × 106 ± 6.38 × 10⁵ bAmino acids and derivatives
L-Phenylalanine1.15 × 107 ± 7.09 × 10⁵ a8.26 × 106 ± 5.12 × 10⁵ a2.43 × 107 ± 4.36 × 10⁶ bAmino acids and derivatives
L-Aspartic Acid3.13 × 105 ± 1.55 × 10⁴ a3.79 × 105 ± 3.03 × 10⁴ a1.14 × 106 ± 2.67 × 10⁵ bAmino acids and derivatives
L-Lysine3.32 × 105 ± 1.00 × 10⁴ b2.95 × 105 ± 8.33 × 10³ b2.08 × 105 ± 1.82 × 10⁴ aAmino acids and derivatives
L-Histidine4.14 × 104 ± 2.10 × 10³ b2.68 × 104 ± 2.65 × 10² a2.69 × 104 ± 3.61 × 10³ aAmino acids and derivatives
L-Arginine9.39 × 104 ± 3.73 × 10³ a1.13 × 105 ± 5.69 × 10³ a1.59 × 106 ± 5.41 × 10⁵ bAmino acids and derivatives
N-Acetyl-L-glutamic acid7.48 × 104 ± 9.68 × 10² c4.60 × 104 ± 2.67 × 10³ b3.48 × 104 ± 4.51 × 10³ aAmino acids and derivatives
L-Tryptophan7.91 × 105 ± 1.08 × 10⁵ b2.87 × 105 ± 2.29 × 10⁴ a1.15 × 105 ± 2.60 × 10⁴ aAmino acids and derivatives
Syringin2.21 × 105 ± 2.19 × 10³ b2.76 × 105 ± 8.62 × 10³ c1.45 × 105 ± 1.15 × 10⁴ aPhenolic acids
Coniferaldehyde4.18 × 104 ± 3.20 × 10³ b3.70 × 104 ± 3.70 × 10³ b2.56 × 104 ± 9.81 × 10² aPhenolic acids
Coniferyl alcohol3.44 × 105 ± 6.41 × 10⁴ b3.33 × 105 ± 1.88 × 10⁴ b1.33 × 105 ± 4.04 × 10³ aPhenolic acids
Cyanidin-3-O-glucoside2.87 × 105 ± 7.56 × 10⁴ a3.08 × 106 ± 2.48 × 10⁵ b8.07 × 106 ± 6.13 × 10⁵ cAnthocyanins
Delphinidin-3-O-glucoside2.11 × 106 ± 5.92 × 10⁵ a1.87 × 107 ± 2.81 × 10⁶ b8.85 × 107 ± 6.02 × 10⁶ cAnthocyanins
Luteolin9.30 × 103 ± 2.48 × 10³ a1.24 × 104 ± 1.86 × 10² a6.54 × 104 ± 1.51 × 10⁴ bFlavonoid
Kaempferol-3-O-rutinoside1.20 × 105 ± 3.51 × 10³ c7.18 × 104 ± 1.61 × 10⁴ b4.28 × 103 ± 4.77 × 10² aFlavonoid
Quercetin3.31 × 105 ± 4.80 × 10⁴ a5.06 × 105 ± 2.80 × 10⁴ a9.68 × 105 ± 1.37 × 10⁵ bFlavonols
Quercetin-3-O-xyloside (Reynoutrin)3.70 × 10⁶ ± 1.76 × 10⁵ a9.12 × 106 ± 5.47 × 10⁵ b1.27 × 107 ± 1.56 × 10⁶ cFlavonols
Quercetin-3-O-glucoside (Isoquercitrin)7.87 × 10⁶ ± 5.29 × 10⁵ a9.95 × 106 ± 6.76 × 10⁵ a b1.20 × 107 ± 7.75 × 10⁵ bFlavonols
Quercetin-3-O-rutinoside (Rutin)2.62 × 10⁴ ± 5.27 × 10³ a3.44 × 104 ± 4.00 × 10³ a1.70 × 105 ± 5.18 × 10⁴ bFlavonols
Kaempferol-3,7-O-dirhamnoside (Kaempferitrin)1.71 × 10⁵ ± 3.60 × 10⁴ a1.58 × 105 ± 4.98 × 10³ a1.98 × 105 ± 6.18 × 10⁴ aFlavonols
Apigenin-6-C-glucoside (Isovitexin)4.88 × 10⁵ ± 9.50 × 10³ b1.69 × 105 ± 4.53 × 10⁴ a1.30 × 105 ± 3.20 × 10⁴ aFlavonoid carbonoside
D-Erythrose-4-phosphate2.71 × 104 ± 2.11 × 10³ a2.67 × 104 ± 2.43 × 10³ a5.10 × 104 ± 8.61 × 10³ bSaccharides and Alcohols
Ribulose-5-phosphate3.20 × 104 ± 4.16 × 10² b1.38 × 104 ± 1.18 × 10³ a1.89 × 104 ± 3.21 × 10³ aSaccharides and Alcohols
Shikimic acid1.06 × 105 ± 5.09 × 10³ a1.01 × 105 ± 1.43 × 10⁴ a2.21 × 105 ± 2.14 × 10⁴ bOrganic acids
Significant differences among the leaf growth stages are indicated by different lowercase letters (p < 0.05).
Disclaimer/Publisher’s Note: The statements, opinions and data contained in all publications are solely those of the individual author(s) and contributor(s) and not of MDPI and/or the editor(s). MDPI and/or the editor(s) disclaim responsibility for any injury to people or property resulting from any ideas, methods, instructions or products referred to in the content.

