Abstract
The massive amounts of dust formed during bamboo CNC milling presents serious risks to human health and equipment. The present study aimed to determine the particle size distribution (PSD) and shape characteristics of bamboo milling dust derived from different average chip thicknesses. Spindle speed and feed rate were varied in combination, in setting up two experimental groups having the same average chip thicknesses. Sieving and flatbed scanning image analyses were collectively utilized for the morphological analysis of bamboo dust. The results showed that less than 5% of the particles were below 100 μm in terms of mass, but represented more than 83% in number. Average chip thickness was positively correlated with a mass proportion of bamboo dust with large size, which was preferably generated when reducing spindle speed instead of increasing feed rate. Spindle speed and feed rate individually affected the particle size and particle size distribution instead of average chip thickness. The aspect ratio, roundness and convexity of bamboo milling dust were augmented with a reduction in particle size, indicating that bamboo milling dust with smaller size had more a regular shape, a smoother profile and fewer corners. These findings provide a theoretical basis for better understanding bamboo milling dust and its related control in the bamboo processing industry.
1. Introduction
Bamboo, as a renewable and eco-friendly natural biomass material, has a wide range of engineering application potential in civil construction, furniture and decoration, due to its rapid growth, short renovation and excellent mechanical properties, including high strength, good toughness and good wear resistance [1]. Normally, it takes three to five years for new bamboo to grow till-forming bamboo-based panels with straight grain and original color [2]. Bamboo material accounts for approximately 20% to 25% of total biomass in the tropics and sub-tropical areas [3]. Several studies have shown that the development of typical unidirectional fiber-reinforced composites alleviated the shortage of wood supplies to broaden market prospects in composite materials to some extent [4]. There are more than 800 species of bamboo in China alone, which has the highest abundance of bamboo resources in the world [5]. However, at least 60% of bamboo is wasted in the form of dust or debris during processing; namely, about 50 million tons of bamboo processing residues are inevitably produced each year in China [6]. Substantial amounts of bamboo dust in workshops increase safety risks such as fire, explosions, etc. [7], and more seriously, pose health hazards for workers [8] if it is not removed in time with suction. Various respiratory diseases such as asthma, chronic bronchitis, symptoms [9], nasal impairment [10] and other chronic impairments in lung function [11], have been demonstrated to be closely associated with excessive exposure to bamboo milling dust. As early as 1995, wood dust was classified by the International Agency for Research on Cancer (IARC) as one of the human carcinogens (group I) that induces nasal and paranasal sinus malignancies [12]. The dust also adversely affects computerized numerical control (CNC) machining process stability as it accumulates in the machine, resulting in operational disorders, abnormal wear and short circuits of electronic components, resulting in excessive maintenance expenditures, shorter life spans of devices and low product qualification rates as well [13,14].
CNC machines that are mainly used for wood milling always exhibit deficient performance in terms of dust extraction, especially for fine dust. In large furniture factories, CNC processing workshops can be enclosed to ensure that operators are less exposed to the dust. However, in small factories and individual workshops, it is difficult to make dust exposure as a primary consideration for technical difficulties and cost control [15,16], where the usual practice for the operator is to clean workpiece surfaces and clamping beams using compressed air following completion of all technological operations. Consequently, the dust that falls on and around work pieces and devices can rise again into the air of the entire workshop after losing kinetic energy [17]; this is tantamount to an increment in the airborne dust concentration, resulting in more grievous occupational health hazards for operators. Hence, it is particularly necessary to explore the morphological characteristics of bamboo dust produced during milling, in order to optimize and design proper handling and dust removal systems.
Typically, dust characteristics depend on three primary factors, including the processing method and machinery, the species of raw material and the machining parameters used during milling [17,18]. Among them, the processing method and wood species are decided by market demand, implying that the most effective way to minimize dust emission is by optimizing cutting parameters to reduce dust generation, especially in milling operations that are not suitable for the installation of dust-collecting hoods [14,19]. After setting various cutting parameters based on tool geometry and cutter movement, the dust generated during milling can be collected to accurately define its shape and size. Correspondingly, morphological characteristics of the dust can be analyzed using kinematics parameters [20]. A study found that average chip thickness determined by multi-cutting parameters and tool geometric variations exerted a significant effect on the amount of dust produced [21,22], of which spindle speed and feed rate were considered the decisive factors determining average chip thickness when the physical conditions remained unchanged. Under similar conditions, the relation between different average chip thicknesses and MDF dust size spatial distribution was analyzed in our previous report [14]. The dust characteristics of some other machined natural woods and wood-based materials was also reported recently [23,24]. Wood species also influence dust production. MDF creates up to six times as much dust as pine [22], and the mass concentration of sawdust of tropical hardwood plywood is 2.1 times and 7.3 times that of softwood plywood and sugi lumber, respectively [25]. However, few studies focused on bamboo dust in processing. Bamboo is obviously different in structure and fiber length from wood, although it has similar components such as cellulose (55%), hemicelluloses (20%), lignin (25%) and small amounts of extractives and ash [26]. It was found that a higher air-borne dust concentration occurred during bamboo processing than for wood furniture manufacturing [27]. The granularity and morphology of bamboo dust have rarely been studied, much less the relation between bamboo dust’s characteristics and milling parameters.
In this study, the effect of average chip thickness on the morphology of bamboo dust during milling was studied by setting a series of average chip thicknesses, through varying the feed rate while fixing spindle speed or changing the spindle speed while fixing feed rate. A combination of sieving and flatbed scanning image analyses were utilized to define particle size and shape by collecting particle size distribution (PSD), aspect ratio, roundness and convexity data of the dust. The results showed that the morphological characteristics of bamboo dust were different from those of wood-based dust. Average chip thickness was relevant to particle size distribution of bamboo milling dust, while it had little effect on specific morphology. Spindle speed and feed rate were both associated with particle size and particle size distribution. These findings can provide a theoretical basis for improvements in bamboo dust removal systems.
2. Materials and Methods
2.1. Materials
Bamboo panels, as shown in Figure 1, purchased from Aiwei Industrial Development Co., Ltd., Shanghai, China, were prepared with dimensions of 600 mm length × 300 mm width × 18 mm depth. Moso bamboo (Phyllostachys edulis) sheet composite board has become one of the most common materials in the decoration market, with high-pressure carbonization treatment used at present. The panels were made of multiple longitudinal bamboo strips glued with urea-formaldehyde resin, and their composite structure can be seen from the cross section. Tested according to GB/T 17657-2013, the modulus of rupture (MOR) and modulus of elasticity (MOE) of the workpieces were 46.8 ± 5.6 MPa and 4185 ± 223 MPa, respectively. The moisture content was between 7.9% and 10.1%, and the average density was 695.8 kg/m3. Experiments were conducted on a standard CNC machine (SYNTEC GMB-E, Weigete CNC Technology Co., Ltd., Jinan, China). Bamboo milling was performed with an initial temperature of 15 ± 2 °C and relative humidity (RH) of 52 ± 5%, using a straight-shank solid carbide milling tool with a diameter of 8 mm and edges number of 3 (Huhao Technology Co., Ltd., Hangzhou, China).
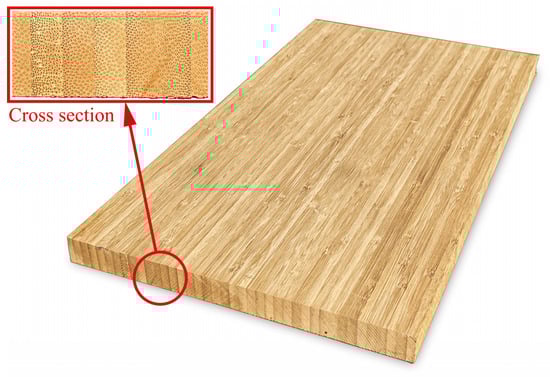
Figure 1.
Photograph of a bamboo panel and an enlarged view of its cross section.
2.2. Milling Methods
Figure 2a displays up-milling, i.e., the work piece was fed against the direction of milling speed, which is commonly used for better surface quality. When such an operation was applied to mill the entire outer layer with a thickness of 4 mm on the surfaces of bamboo panel test specimens, each specimen showed similar removal volume. There was obvious anisotropy in long bamboo fiber, and different milling directions had a great impact on the failure form of bamboo; this could lead to more complex differences in dust morphology. We focused on the dust under longitudinal milling, which meant that the direction of the cutting speed was parallel to the bamboo fiber. A vacuum dust removal system (FS-80, 3 m3/min, Nanjing, China) was running throughout the milling process, and a dust removal brush was firmly pressed down onto the workpiece, creating a negative pressure environment around the working tool so that as much dust as possible could be sucked into the collector. The bamboo dust inside the collector was taken as the object of this study.
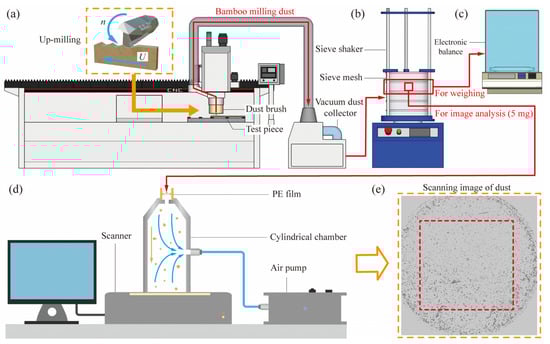
Figure 2.
(a) Diagrammatic sketch of the CNC milling machine and vacuum dust collector; (b) sieve shaker; (c) electronic balance; (d) flatbed scanning image analyses; (e) scanning image of bamboo dust.
When milling, there are many variables that influence the formation and movement of the dust. Figure 3 displays the cutting amount produced by each tooth of the tool, which was calculated on the bases of feed rate, spindle speed, the number of teeth on the tool, the depth of cut and the diameter of the tool, according to Equations (1) and (2):
where Uz is the feed rate per tooth (mm/t), U is the feed rate (m/min), n is the spindle speed (r/min), z is the number of teeth on the tool (z = 3). Equation (2) is as follows:
where aav is the average chip thickness (mm/t), θav is the angle of motion when milling speed direction at the midpoint of the contact arc is used as a calculation basis (°), φ0 is the contact angle (°), h is the milling depth (mm) and D is the diameter of the tool (mm).
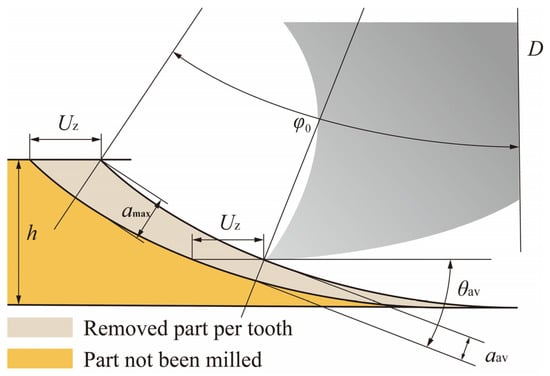
Figure 3.
Diagrammatic sketch of average chip thickness.
As shown in the cutting parameters in Table 1, the average chip thickness was set to increase monotonically with an interval of 0.03 mm, from 0.05 mm to 0.20 mm. In group I, the spindle speed was set very high (n = 16,000 r/min), and the average chip thickness was increased corresponding to variations in the feed rate. In group II, the feed rate was set low (U = 4 m/min), and the average chip thickness was varied with decreases in spindle speed. Cutting depths and widths were kept consistent. The total volume removed by each milling was 4 mm × 600 mm × 300 mm.

Table 1.
Milling parameters used in the two experimental groups.
2.3. Sieving and Image Scanning Analysis
Sieving analysis has become the most commonly used and cost-effective method to determine the PSD of some biomass particles [28]. Briefly, all milling dust in the collector was sieved using a sieve shaker (A3, Fritsch GmbH, Idar-Oberstein, Germany) with a 3-millimeter amplitude for 20 min, as shown in Figure 2b. A sieve stack with 4 sieves and 1 collecting pan at the bottom divided the dust into five sections, from top to bottom, according to the following inner diameters: larger than 1000 μm, 500–1000 μm, 200–500 μm, 100–200 μm and 0–100 μm, respectively. The sieving of each group of dust was carried out more than 5 times to make the particles fall as much as possible during vibration, due to the massive amount of dust produced. An electronic balance (BS2202S, Sartorius AG, Goettingen, Germany), as shown in Figure 2c, was employed to weigh the dust that remained on the sieves and collecting pan for particle size mass distribution.
Meanwhile, image scanning has been suggested as an alternative method for analyzing particle morphology, as it can handle massive particles and quantitatively present the shape information of dust [29,30]. Flatbed scanning was utilized to analyze specific particle morphological characteristics in each sieving grade, since it could present the real sizes of needle-shaped particles such as bamboo bust. As shown in Figure 2d, 5 mg of bamboo dust sample needed to be placed on the PE film covering the small hole at the top of the closed cylindrical chamber for each image analysis. The vacuum dispersion pump (VDD270, Occhio s.a., Angleur, Belgium) removed air until the pressure inside the chamber was lower than the critical point that the PE film could bear. After the film cracked, dust naturally fell through the chamber and became evenly distributed on the glass plate of the image scanner (scan600, Occhio s.a., Angleur, Belgium) at the bottom. Image analysis was instantaneously performed by the software CallistoEXPERT to calculate the morphological characteristics of dust plane projection (Figure 2e). The particles on each sieve were sampled and scanned 3 times in order to calculate the arithmetic mean.
2.4. Dust Morphological Characterization
PSD and particle shape are morphologically fundamental factors that influence dust flowability, adhesion and cohesion, and had a significant impact on the movement state of airborne dust [31]. They were also employed in describing the particle granularity related to the sanding and sawing dust of wood and wood-based materials, as was particle diameter [20,32,33]. Bamboo particle size was assessed using inner diameter (din) and area-equivalent diameter (dae). The din, the second smallest dimension, represented the largest circle in the projection area of a particle; however, it did not accurately present the real size of bamboo dust with anisotropic structure, although it was more suitable for sieving analysis [30,34]. The dae was the diameter of a circle that had the same area as the projection area of the particle, and was used to evaluate particle sizes with the projection area of a non-spherical particle. The flatness ratio of all particles was assumed to be identical. The area-equivalent diameter was calculated by measuring the projected area of particles on the scanning plate, according to Equation (3):
where Ap is the projected area of particles on the scanning plane (μm2). In the wood industry, PSD by number reflects dust granularity more directly and precisely, although PSD by mass is often used in describing the working environment. Hence, PSD by number, as well as average and median value of din and dae in each sieving grade, were all applied in the trials.
It is difficult to clearly characterize anisotropic particles with irregular shapes using particle size only. Elongation, circularity, convexity and compactness were utilized in a study to characterize the shape of wheat grinding powder. [35]. Aspect ratio was reported to have a greater influence on the flowability of ribbed particles than that of circular particles [36]. The morphological features, including aspect ratio (AR), roundness and convexity of bamboo dust were measured according to the two-dimensional projection of the shape of particles on the scanning plane. Shape factors are defined in comparison with referential shapes, as illustrated in Figure 4. AR, as a macro descriptor, is the indication for the elongation of a particle, which can be calculated by Equation (4) to reflect overall geometric proportions of particles:
where AR is the aspect ratio; XFeret,min is the minimum frete diameter (μm), i.e., the minimum distance between parallel tangents of the particle profile; and XFeret,max is the maximum frete diameter (μm), i.e., the maximum distance between parallel tangents of the particle profile. The smaller the AR, the narrower the shape of particle.
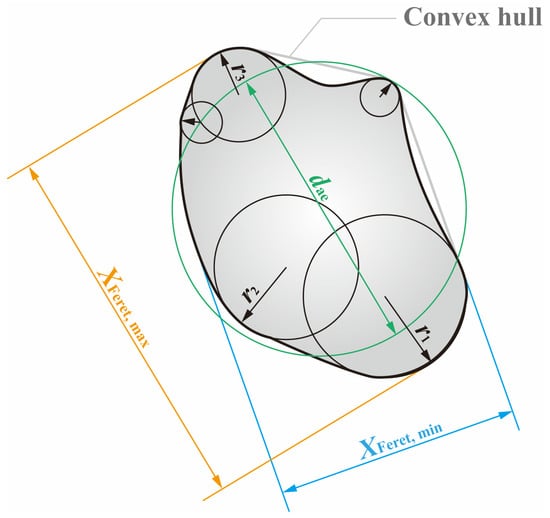
Figure 4.
Illustration of particle, showing the area-equivalent diameter, aspect ratio, roundness and convexity.
As mesoscopic descriptors, roundness and convexity not only provide information regarding particle shape but also surface texture. Roundness can be calculated to be the ratio of the averaged radius of curvature of all convex regions to a circumscribed circle of the particle, which is equal to XFeret,max/2, displaying the sharpness and dullness of particle edges and corners according to Equation (5):
where R is roundness, and ri is the radius of the inscribed circle at convex corner i. Particles with a roundness close to 1 had a smooth profile similar to that of a circle, which leads to better flowability than particles with sharp edges and corners [37].
Convexity can be used to describe the compactness of a particle as an important shape parameter, reflecting the surface structure of dust particles. Figure 4 shows that there was an open depression in the projection area of outer contours of the particle. Convexity is calculated by Equation (6):
where C is convexity, and Ap is the ratio of the projection area and the convex hull area (Ac). The maximum theoretical convexity is 1 when there are no concave regions. Conversely, a low convexity is due to uneven surfaces of the detected particle [38]. Unlike metal materials and coal, bamboo fiber is between 1.5 to 4.5 mm in length and 11 to 19 μm in diameter.
3. Results and Discussion
3.1. PSD
Figure 5 shows that the mass proportion of dust of a din larger than 100 μm was more than 95%, and the dust of din larger than 1000 μm had the largest mass proportion, regardless of any average chip thickness, which differs from sanding dust [30,32,39]. The ascending average chip thickness led to the increase in mass proportion of dust larger than 1000 μm, and to the decrease in mass proportion of three sieving grades ≤ 500 μm. There was no obvious relation between mass proportion of dust ranging from 500 μm to 1000 μm and average chip thickness. These results suggest that average chip thickness affected the particle mass size distribution of bamboo milling dust, especially, since it had a positive correlation with mass proportion of larger bamboo particle dust and a negative correlation with that of finer dust.
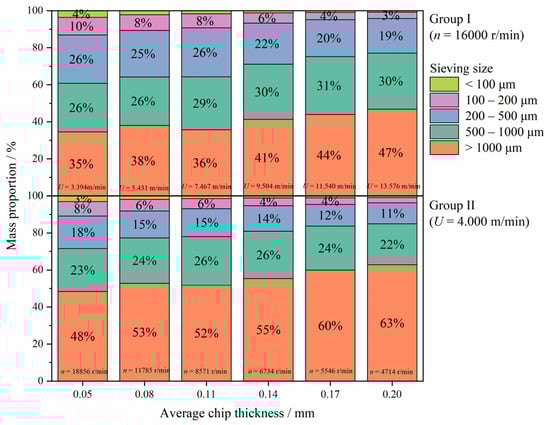
Figure 5.
The mass distributions of bamboo milling dust under different average chip thicknesses.
It was also observed that the mass proportion of dust larger than 1000 μm in group I was less than that of group II under the same average chip thickness. On the contrary, mass proportions for the other dust particles in group I were higher compared to those in group II, indicating that it was easier to generate large particle dust by reducing spindle speed rather than by increasing feed rate when average chip thickness was fixed. This may be attributed to spindle speed that exerted a comparative impact on milling speed, which played a decisive role in the damage to materials in the cutting layer.
Usually, small particles presented relatively low mass proportions [40], which have large specific surface areas and strong cohesion with each other, leading to a more stable structure and lower flowability. However, the quantity of large particle dust was not on the same order of magnitude as that of small particle dust, and mass distribution could not completely reflect the proportion of the actual quantity of dust particles. A large quantity of fine particles causes occupational hazards to workers and reduces the precision of equipment. The cumulative curve for PSD and number percentage in Figure 6 indicates that more than 83% of bamboo particles (≤ 100 μm) are classifiable as inhalable fraction, according to the American Conference of Governmental Industrial Hygienists (ACGIH) [41]. Thus, it was essential to independently analyze morphological characteristics of bamboo dust below 100 μm.
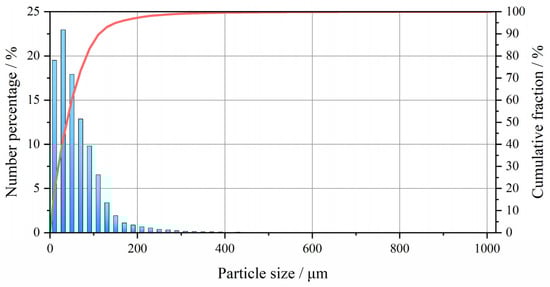
Figure 6.
The PSD of all bamboo dust generated during milling.
Dust with a wide particle size distribution was reported to have high unconstrained yield strength [42]. Dust particles within 100 μm can easily form a relatively stable structure with each other, leading to low flowability, since they have large specific surface areas and stronger cohesive forces [43]. Figure 7 displays the PSD of particles within 100 μm. In group I, the largest number part was the particles in a range of 10–20 μm, accounting for 13.4%–16.6%, while it was between 20–30 μm for 13.9%–16.4% in group II. It was inferred that the smallest visible debris generated on the bamboo surface after being cut and destroyed by the milling tool was concentrated between 10–50 μm. In general, PSD tends to be discrete with an increase in feed rate, but it changes in the opposite manner with a decrease in spindle speed. These results suggest that an increase in feed rate reduced the ability of bamboo fragments to split into smaller debris. Seemingly, a reduction in spindle speed made the finest dust more concentrated. While based on the fact that the proportion of dust within 100 μm in group II was lower than that in group I, it is reasonable to suggest that decreasing spindle speed transferred particles originally located at 50–100 μm to the components above 100 μm. This also explained the abnormal opposite trend in group I when average chip thickness was 0.20 mm, and When the average chip thickness was 0.05 mm; these thicknesses may be attributed to the extremely high feed rate and spindle speed used, respectively.
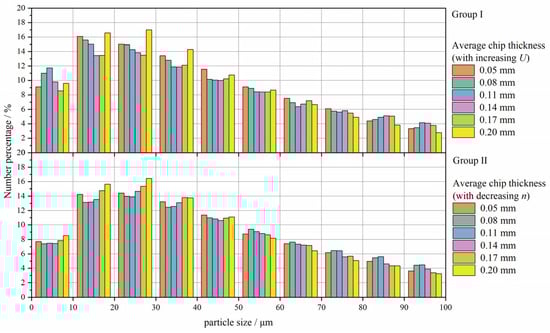
Figure 7.
The PSDs of dust with particle sizes of 0–100 μm under different average chip thicknesses.
3.2. Inner Diameter and Area-Equivalent Diameter
During the process of sieving vibration, large needle-shaped dust particles can pass through the mesh if their din was smaller than sieving hole. As a result, the median and average values of the dae of bamboo milling dust on each sieving mesh was generally larger than the din, which is confirmed in Figure 8, where the box in each line displays the size distribution of the middle 50% of particles (i.e., the range between the 25th and 75th percentiles) in different sieving ranges. The din/dae of median value increased from around 1.3 to 2.0, with sieving size ascending from 0–100 μm to above 1000 μm. This revealed that larger particles were differential in length and width. Moreover, the distribution of dae was more discrete, which also confirmed the irregularity of bamboo dust particles.
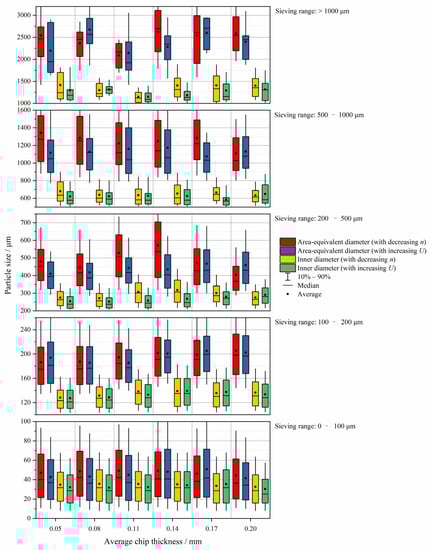
Figure 8.
The inner diameters and area equivalent diameters of bamboo dust in different sieving ranges.
There seemed to be no linear correlation between average chip thickness and din or dae within the sieving range, suggesting that average chip thickness had little effect on the size of single particles; this may be attributed to the generation of a large amount of fine fiber fragments (size within 200 μm) that resulted from transwall failure in single bamboo fibers in the case of longitudinal milling with an average chip thickness of 0.05–0.20 mm (50–200 μm). Cell wall failure due to the tool blade directly caused the rapid decline in binding force within fiber fragments, leading to unpredictable sizes and shapes through the secondary split. For particles of sizes larger than average chip thickness, the projected size was more closely relevant to the direction of milling width (the depth of tool embedded in panel). Compared to the PSD, average chip thickness was positively correlated with the proportion of large size particles, although it had a more complicated association with the specific sizes of the particles.
However, except for some errors caused by outliers, the median value of din obtained by continuously reducing spindle speed at a low feed rate (in group II) was generally larger than that obtained by increasing the feed speed at a high spindle speed (in group I) under the same average chip thickness. This suggested that the size of particles generated by a high spindle speed was lower than that produced by a low feed rate. This means that in practical production, particle size can be optimized by appropriately controlling spindle speed and feed rate. Meanwhile, the instability of dae was more closely related to specific morphologies of the particles.
3.3. Aspect Ratio
The AR of bamboo milling dust, ranging from 42.3% to 68.2% in median value, was gradually decreased with an increase in particle size, as shown in Figure 9. This indicated a tendency to stretch and lengthen the particle, which was consistent with the results of dust from pine, bean stalk, rice straw and reed [28]. The AR distribution varied with size range, and larger particles presented a relatively wider AR distribution similar to that of MDF sawdust [14,30]. The anomaly in the AR distribution of particles larger than 500 μm may be due to a small quantity of large particles available for scanning. However, for smaller particles, less AR variation was found. The median ARs of particles less than 100 μm were concentrated between 62.8% and 65.4%, indicating that size reduction gradually narrowed shape variation, and made the dust more homogeneous. Many studies have also reported this trend for biomass particles [28,35].
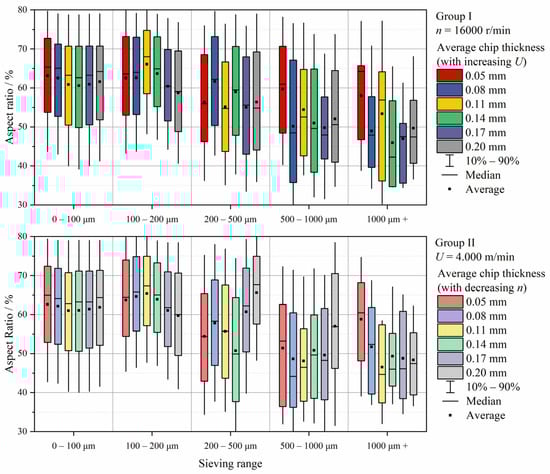
Figure 9.
The aspect ratios of bamboo dust in different sieving ranges.
Average chip thickness showed a relation with particle size similarly to AR. Mesoscopic fine particles smaller than average chip thickness always formed a relatively stable shape with a high AR after failure, regardless of a change in average chip thickness. Large particles had nothing to do with the AR, since they were the chips that were basically composed of fibers with multiple shapes that interlocked with each other to form mechanical bridges. In summation, these irregular particles were still slenderer than small particles.
The results of the double independent samples t-test of the AR between group I and group II under the same average chip thickness are shown in Table S1 from the Supplementary Materials. The significance values of the Levene’s test for equality of variances under six average chip thicknesses were all greater than the given significance level α = 0.05, indicating homogeneity of variance. Likewise, the significance values of the t-test for equality of means were all greater than 0.05, indicating that there was no significant statistical difference in the AR of dust obtained by group I and group II. Similar results also emerged in the t-tests for roundness and convexity, as shown in Tables S2 and S3. These results illustrated that under the same average chip thickness, the combination of cutting parameters had a sight correlation with the shape of bamboo milling dust.
The AR and number proportion of the dust with particle sizes of 0–100 μm are shown in Figure 10, where the size of bubbles indicate the fraction of dust number. Under different chip thicknesses, the AR decreased continuously with increases in particle size, and the relation between the AR and average chip thickness became more unstable. The AR for the smallest visible debris (10–50 μm) was about 59.4%–66.2%, and it was higher for the dust that was less than 10 μm, although the proportion was relatively small; this may have resulted from limitations in scanner resolution. The smaller the difference between the shape of dust particles and a standard sphere, the higher the flowability [38]; small regular particles did not reduce their diffusion ability in air. Considering the range of dust pollution, particles with large ARs produced during bamboo milling were conducive to reducing the diffusion of dust.
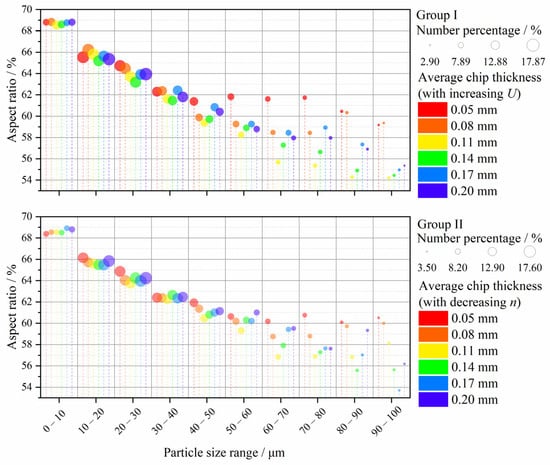
Figure 10.
The aspect ratios and number proportions of dust particles between 0–100 μm.
3.4. Roundness
Figure 11 shows that the roundness of bamboo milling dust shared similar tendencies with the AR. The maximum median roundness decreased from 55.5% to 29.0% with an increase in particle size, which demonstrated that larger particles had more corners and irregular edges. The roundness of bamboo milling dust was lower than that of particleboard drilling dust, which may have resulted from the rake angle of tool used, and material characteristics [44]. The roundness distribution of bamboo particles gradually centralized with an increase in particle size, indicating that many large particles became similar, morphologically. Moreover, the influence of average chip thickness on roundness was almost the same as that on the AR. In other words, the change in average chip thickness had a limited effect on the roundness of bamboo particles.
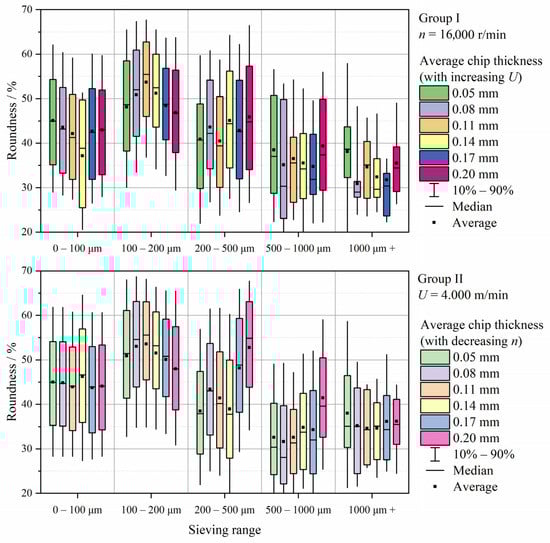
Figure 11.
The roundnesses of bamboo dust in different sieving ranges.
Roundness and quantity proportion for dust particles of 0–100 μm are shown in Figure 12, where positive correlations between roundness dispersion and average chip thicknesses appear in particles between 20 μm and 100 μm. However, there was no obvious correlation found between roundness and particle size. The Particles that were less than 20 μm with abnormally small roundness were seen as outliers that may have resulted from a low scanning resolution of about 7 microns/pixel so that the edges of small particles were replaced by sawtooth edges of the pixel lattice. Most of the roundness values for the smallest visible debris (10–50 μm) were below 48.0%.
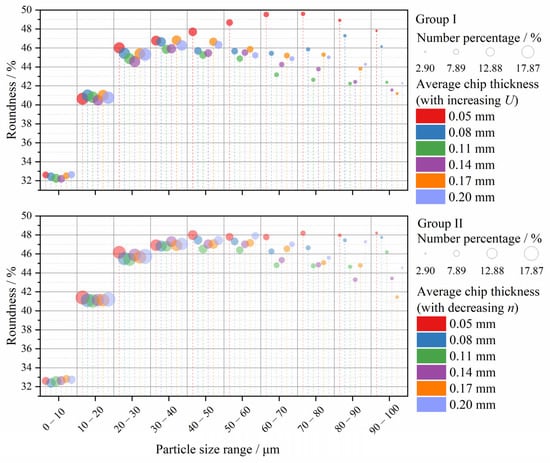
Figure 12.
The roundnesses and number proportions of dust particles between 0–100 μm.
Bamboo milling dust was derived from slender fiber fragments formed by the plastic deformation and brittle fracture of bamboo panel under the action of tool toughness, which also suggested that the dust particles had low ARs, small roundness, and sharp edges and corners on the separation surface. Some reports found that the angle of repose increased with a decrease in roundness, i.e., the particles with larger roundness had better flow performance [38]. The roundness rapidly decreased with increases in particle size, suggesting that large particles had more edges and corners. The particle shape changed from regular to irregular multi-edges and corners, which increased contact points among the particles and made their removal more difficult by dust collection systems [45].
3.5. Convexity
Figure 13 showed that the convexity of bamboo milling dust showed similar and more obvious trends with AR and roundness. Nevertheless, the convexity of bamboo dust larger than 200 μm seemed to be positively correlated with average chip thickness. The median convexity of particles decreased from 93.3% to 62.3% with an increase in particle size, which demonstrated that large particles had more hollows and defects. Contrary to MDF sanding dust, a wider distribution was revealed in the convexity analysis of bamboo milling dust [30]. Bamboo fibers were broken, with irregular erosion surfaces after interacting with the tool blade, the panel surface and with other particles, resulting in small, short and smooth particles. High convexity indicated fewer concave positions on particle surfaces, which can thereby be characterized as flat or smooth surfaces, whereas low AR and convexity values show the occurrence of full breakage and surface erosion of wood fibers during the milling. Still, the influence of average chip thickness on convexity was almost the same as that on the AR.
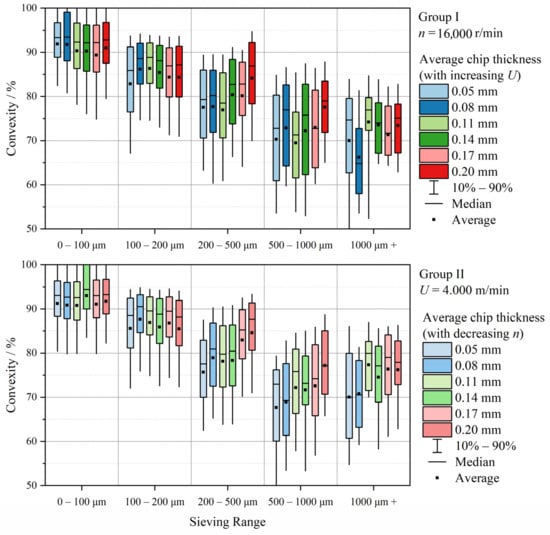
Figure 13.
The convexities of bamboo dust in different sieving ranges.
The convexities and number proportions of 0–100 μm dust particles are shown in Figure 14, where the convexity was negatively, linearly correlated with a particle size below 100 μm. Most of the convexities for the smallest visible debris (10–50 μm) were between 88.9%–99.6%. The convexity of the particles between 0–10 μm was close to 1, suggesting that these particles had almost no concave parts, which may be related to the regular shape of the smallest particles. On the other hand, it may also be related to low resolution of the equipment. Average chip thickness had less effect on the convexity instability of larger particles within 100 μm compared to the AR and roundness. These results suggest that the overall volatility in the convexity of bamboo dust was smaller than AR and roundness, and that the particles with low convexity had more complex flowability, making it difficult for them form a stable motion state in air.
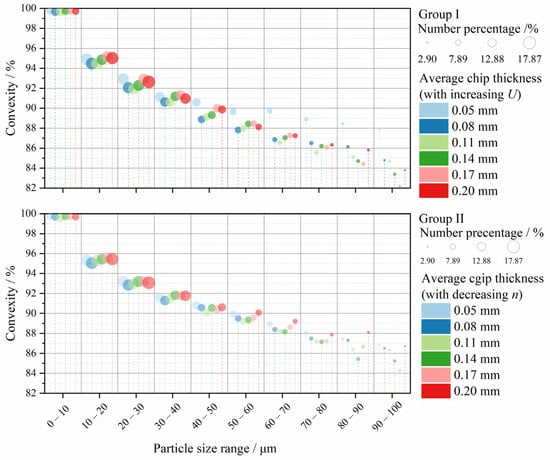
Figure 14.
The convexities and number proportions of dust particles between 0–100 μm.
4. Conclusions
In this study, the granularity and morphology of bamboo milling dust under different average chip thicknesses were explored using a combination of sieving and flatbed image scanning analyses. We found that 95% of the mass for bamboo milling dust that was greater than 100 μm covered less than 17%, numerically. Average chip thickness was positively correlated with the mass proportion of large bamboo particle dust, and decreasing spindle speed was preferred to generate dust particles with large size than increasing the feed rate, when the average chip thickness was fixed. Average chip thickness and its different combinations of cutting parameters had little effect on the specific morphology of the dust; however, feed rate reduced the ability of bamboo fragments to split into smaller debris. The median and average values of the dae on each sieving mesh were generally larger than the din, indicating that the larger the particles were, the bigger the differences between their lengths and widths. The aspect ratio, roundness and convexity of bamboo milling dust were approximately 42.3% to 68.2%, 55.5% to 29.0% and 93.3% to 62.3%, respectively, which increased with a decrease in particle size, indicating that bamboo milling dust had more a regular shape, smoother profile and fewer corners with a decrease in size. The smallest visible debris was concentrated between 10–50 μm, with an AR between 59.4%–66.2%, roundness below 48.0% and convexity between 88.9%–99.6%. The quantitative relationship between cutting parameters, especially the average chip thickness, and the morphology of bamboo milling dust, was revealed in this study. Particles of different sizes and shapes affected the flowability of dust. Therefore, the theoretical basis for controlling the flow of bamboo dust in the working environment is that by adjusting the cutting parameters, dust flow can be further improved. Our findings may be used to enhance understanding of the characteristics of bamboo milling dust, and improve dust control in the bamboo processing industry.
Supplementary Materials
The following supporting information can be downloaded at: https://www.mdpi.com/article/10.3390/f13091510/s1, Table S1: Independent sample t-tests of the AR for Group I and Group II under the same average chip thickness; Table S2: Independent sample t-tests of roundness for Group I and Group II under the same average chip thickness; Table S3: Independent sample t-tests of convexity for Group I and Group II under the same average chip thickness.
Author Contributions
Conceptualization, Y.C. (Yunqi Cui) and N.Z.; methodology, Y.C. (Yunqi Cui), T.D. and N.Z.; software, Y.C. (Yunqi Cui) and J.Y; validation, J.Y.; formal analysis, Y.C. (Yunqi Cui), J.Y., Y.C. (Yitong Cai) and H.W.; resources, N.Z.; data curation, Y.C. (Yitong Cai) and H.W.; writing—original draft preparation, Y.C. (Yunqi Cui); writing—review and editing, N.Z. and T.D; visualization, Y.C. (Yunqi Cui) and J.Y. All authors have read and agreed to the published version of the manuscript.
Funding
This research was funded by the National Key R&D Program of China, Grant No. 2016YFD0600703.
Institutional Review Board Statement
Not applicable.
Informed Consent Statement
Not applicable.
Data Availability Statement
Data is contained within the article and Supplementary Materials.
Acknowledgments
The authors acknowledge the help of the Advanced Analysis and Testing Center of Nanjing Forestry University.
Conflicts of Interest
The authors declare no conflict of interest.
References
- Tan, T.; Rahbar, N.; Allameh, S.; Kwofie, S.; Dissmore, D.; Ghavami, K.; Soboyejo, W. Mechanical properties of functionally graded hierarchical bamboo structures. Acta Biomater. 2011, 7, 3796–3803. [Google Scholar] [CrossRef] [PubMed]
- Li, X.G.; Hu, N.; Wu, Y.Q. Study on the Processing Technology of Bamboo Mat/Bamboo Particle Composite Board. In Advanced Materials Research; Trans Tech Publications Ltd.: Bäch, Switzerland, 2010; Volume 150–151, pp. 1433–1437. [Google Scholar]
- Feng, Q.; Bu, X.; Wan, Z.; Feng, K.; Deng, Q.; Chen, C.; Li, D. An efficient torrefaction Bamboo-based evaporator in interfacial solar steam generation. Sol. Energy 2021, 230, 1095–1105. [Google Scholar] [CrossRef]
- Li, X.; Liu, R.; Long, L.; Liu, B.; Xu, J. Tensile behavior and water absorption of innovative composites from natural cork granules and bamboo particles. Compos. Struct. 2021, 258, 113376. [Google Scholar] [CrossRef]
- Vorontsova, M.S.; Clark, L.G.; Dransfield, J.; Govaerts, R.; Baker, J.W. World Checklist of Bamboos and Rattans; Technical Reports; International Network of Bamboo and Rattan: Beijing, China, 2016. [Google Scholar]
- Tan, W.; Hao, X.; Fan, Q.; Sun, L.; Xu, J.; Wang, Q.; Ou, R. Bamboo particle reinforced polypropylene composites made from different fractions of bamboo culm: Fiber characterization and analysis of composite properties. Polym. Compos. 2019, 40, 4619–4628. [Google Scholar] [CrossRef]
- Pang, Z.; Zhu, N.; Cui, Y.; Li, W.; Xu, C. Experimental investigation on explosion flame propagation of wood dust in a semi-closed tube. J. Loss Prev. Process Ind. 2020, 63, 104028. [Google Scholar] [CrossRef]
- Gu, J.; Kirsch, I.; Schripp, T.; Froning-Ponndorf, F.; Berthold, D.; Salthammer, T. Human exposure to airborne particles during wood processing. Atmos. Environ. 2018, 193, 101–108. [Google Scholar] [CrossRef]
- Jacobsen, G.; Schlünssen, V.; Schaumburg, I.; Sigsgaard, T. Increased incidence of respiratory symptoms among female woodworkers exposed to dry wood. Eur. Respir. J. 2009, 33, 1268–1276. [Google Scholar] [CrossRef] [PubMed]
- Schlünssen, V.; Schaumburg, I.; Andersen, N.T.; Sigsgaard, T.; Pedersen, O.F. Nasal patency is related to dust exposure in woodworkers. Occup. Environ. Med. 2002, 59, 23–29. [Google Scholar] [CrossRef]
- Jacobsen, G.; Schlunssen, V.; Schaumburg, I.; Taudorf, E.; Sigsgaard, T. Longitudinal lung function decline and wood dust exposure in the furniture industry. Eur. Respir. J. 2008, 31, 334–342. [Google Scholar] [CrossRef]
- Mez Yepes, M.E.; Cremades, L.V. Characterization of Wood Dust from Furniture by Scanning Electron Microscopy and Energy-dispersive X-ray Analysis. Ind. Health 2011, 49, 492–500. [Google Scholar] [CrossRef]
- Zhu, Z.; Buck, D.; Ekevad, M.; Marklund, B.; Guo, X.; Cao, P.; Zhu, N. Cutting forces and chip formation revisited based on orthogonal cutting of Scots pine. Holzforschung 2019, 73, 131–138. [Google Scholar] [CrossRef]
- Cui, Y.; Yin, J.; Cai, Y.; Wang, H.; Zhu, N.; Ding, T. Spatial distribution characteristics of the dust emitted at different cutting speeds during MDF milling by image analysis. J. Wood Sci. 2022, 68, 17. [Google Scholar] [CrossRef]
- Rogoziński, T.; Wilkowski, J.; Górski, J.; Czarniak, P.; Podziewski, P.; Szymanowski, K. Dust Creation in CNC Drilling of Wood Composites. BioResources 2015, 10, 3657–3665. [Google Scholar] [CrossRef]
- Piernik, M.; Rogoziński, T.; Krauss, A.; Pinkowski, G. The influence of the thermal modification of pine (Pinus sylvestris L.) wood on the creation of fine dust particles in plane milling: Fine dust creation in the plane milling of thermally modified pine wood. J. Occup. Health 2019, 61, 481–488. [Google Scholar] [CrossRef]
- Kminiak, R.; Kučerka, M.; Kristak, L.; Reh, R.; Antov, P.; Očkajová, A.; Rogoziński, T.; Pędzik, M. Granulometric Characterization of Wood Dust Emission from CNC Machining of Natural Wood and Medium Density Fiberboard. Forests 2021, 12, 1039. [Google Scholar] [CrossRef]
- Rogoziński, T.; Chuchala, D.; Pędzik, M.; Orlowski, K.A.; Dzurenda, L.; Muzinski, T. Influence of drying mode and feed per tooth rate on the fine dust creation in pine and beech sawing on a mini sash gang saw. Eur. J. Wood Wood Prod. 2020, 79, 91–99. [Google Scholar] [CrossRef]
- Pędzik, M.; Stuper-Szablewska, K.; Sydor, M.; Rogoziński, T. Influence of Grit Size and Wood Species on the Granularity of Dust Particles during Sanding. Appl. Sci. 2020, 10, 8165. [Google Scholar] [CrossRef]
- Okajová, A.; Kučerka, M.; Banski, A.; Rogoziński, T. Factors affecting the granularity of wood dust particles. Chip Chipless Woodwork. Processes 2016, 10, 137–144. [Google Scholar]
- Palmqvist, J.; Gustafsson, S.I. Emission of dust in planing and milling of wood. Holz Als Roh Und Werkst. 1999, 57, 164–170. [Google Scholar] [CrossRef]
- Rautio, S.; Hynynen, P.; Welling, I.; Hemmilä, P.; Usenius, A.; Närhi, P. Modelling of airborne dust emissions in CNC MDF milling. Holz Als Roh-Und Werkst. 2007, 65, 335–341. [Google Scholar] [CrossRef]
- Sinn, G.; Chuchała, D.; Orlowski, K.A.; Taube, P. Cutting model parameters from frame sawing of natural and impregnated Scots pine (Pinus sylvestris L.). Eur. J. Wood Wood Prod. 2020, 78, 777–784. [Google Scholar] [CrossRef]
- Ockajova, A.; Kučerka, M.; Kminiak, R.; Krišťák, Ľ.; Igaz, R.; Réh, R. Occupational Exposure to Dust Produced when Milling Thermally Modified Wood. Int. J. Environ. Res. Public Health 2020, 17, 1478. [Google Scholar] [CrossRef] [PubMed]
- Fujimoto, K.; Takano, T.; Okumura, S. Difference in mass concentration of airborne dust during circular sawing of five wood-based materials. J. Wood Sci. 2010, 57, 149–154. [Google Scholar] [CrossRef]
- Harries, K.A.; Bumstead, J.; Richard, M.; Trujillo, D. Geometric and material effects on bamboo buckling behaviour. Proc. Inst. Civ. Eng.-Struct. Build. 2017, 170, 236–249. [Google Scholar] [CrossRef]
- Ratnasingam, J.; Scholz, F. Dust emission characteristics in the bamboo and rattan furniture manufacturing industries. Eur. J. Wood Wood Prod. 2015, 73, 561–562. [Google Scholar] [CrossRef]
- Guo, Q.; Chen, X.; Liu, H. Experimental research on shape and size distribution of biomass particle. Fuel 2012, 94, 551–555. [Google Scholar] [CrossRef]
- Benthien, J.T.; Heldner, S.; Ohlmeyer, M. Size distribution of wood particles for extruded particleboard production determined by sieve analysis and image analysis-based particle size measurement. Eur. J. Wood Wood Prod. 2017, 76, 375–379. [Google Scholar] [CrossRef]
- Ding, T.; Zhao, J.; Zhu, N.; Wang, C. A comparative study of morphological characteristics of medium-density fiberboard dust by sieve and image analyses. J. Wood Sci. 2020, 66, 55. [Google Scholar] [CrossRef]
- Fu, X.; Huck, D.; Makein, L.; Armstrong, B.; Willen, U.; Freeman, T. Effect of particle shape and size on flow properties of lactose powders. Particuology 2012, 10, 203–208. [Google Scholar] [CrossRef]
- Očkajová, A.; Kučerka, M.; Krišťák, L.; Igaz, R. Granulometric Analysis of Sanding Dust from Selected Wood Species. BioResources 2018, 13, 7481–7495. [Google Scholar] [CrossRef]
- Palubicki, B.; Hlásková, L.; Frömel-Frybort, S.; Rogoziński, T. Feed Force and Sawdust Geometry in Particleboard Sawing. Materials 2021, 14, 945. [Google Scholar] [CrossRef] [PubMed]
- Igathinathane, C.; Pordesimo, L.; Columbus, E.; Batchelor, W.; Sokhansanj, S. Sieveless particle size distribution analysis of particulate materials through computer vision. Comput. Electron. Agric. 2009, 66, 147–158. [Google Scholar] [CrossRef]
- Saad, M.; Sadoudi, A.; Rondet, E.; Cuq, B. Morphological characterization of wheat powders, how to characterize the shape of particles? J. Food Eng. 2011, 102, 293–301. [Google Scholar] [CrossRef]
- Fitzpatrick, J.J.; Barringer, S.A.; Iqbal, T. Flow property measurement of food powders and sensitivity of Jenike’s hopper design methodology to the measured values. J. Food Eng. 2004, 61, 399–405. [Google Scholar] [CrossRef]
- Souza, D.O.C.; Menegalli, F.C. Image analysis: Statistical study of particle size distribution and shape characterization. Powder Technol. 2011, 214, 57–63. [Google Scholar] [CrossRef]
- Robinson, D.A.; Friedman, S.P. Observations of the effects of particle shape and particle size distribution on avalanching of granular media. Phys. A Stat. Mech. Its Appl. 2002, 311, 97–110. [Google Scholar] [CrossRef]
- Pędzik, M.; Rogoziński, T.; Majka, J.; Stuper-Szablewska, K.; Antov, P.; Kristak, L.; Kminiak, R.; Kučerka, M. Fine Dust Creation during Hardwood Machine Sanding. Appl. Sci. 2021, 11, 6602. [Google Scholar] [CrossRef]
- Chung, K.Y.K.; Cuthbert, R.J.; Revell, G.S.; Wassel, S.G.; Summers, N. A study on dust emission, particle size distribution and formaldehyde concentration during machining of medium density fibreboard. Ann. Occup. Hyg. 2000, 44, 455–466. [Google Scholar] [CrossRef]
- American Conference of Governmental Industrial Hygienists (ACGIH). 2015 TLVs and BEIs (Threshold Limit Values for Chemical Substances and Physical Agents & Biological Exposure Indices); ACGIH: Cincinnati, OH, USA, 2015; ISBN 978-1-607260-77-6. [Google Scholar]
- Mattsson, J.E.; Kofman, P.D. Influence of particle size and moisture content on tendency to bridge in biofuels made from willow shoots. Biomass Bioenergy 2003, 24, 429–435. [Google Scholar] [CrossRef]
- Lee, Y.J.; Yoon, W.B. Flow behavior and hopper design for black soybean powders by particle size. J. Food Eng. 2015, 144, 10–19. [Google Scholar] [CrossRef]
- Cheng, X.; Tao, D.; Zhi, L.; YiJun, G.; Liang, W.; Chen, Z. Size and shape distribution of particles from particleboard drilling based on image analysis. J. For. Eng. 2018, 3, 21–25. [Google Scholar]
- Gil, M.; Teruel, E.; Arauzo, I. Analysis of standard sieving method for milled biomass through image processing. Effects of particle shape and size for poplar and corn stover. Fuel 2014, 116, 328–340. [Google Scholar] [CrossRef]
Publisher’s Note: MDPI stays neutral with regard to jurisdictional claims in published maps and institutional affiliations. |
© 2022 by the authors. Licensee MDPI, Basel, Switzerland. This article is an open access article distributed under the terms and conditions of the Creative Commons Attribution (CC BY) license (https://creativecommons.org/licenses/by/4.0/).