Abstract
Forest ecosystems are some of the largest carbon (C) reservoirs on earth. Pinus halepensis Mill., Quercus ilex L. and Quercus pubescens Willd. represent the dominant tree cover in the Mediterranean forests of southern France. However, their contributions to the French and global forest C and nitrogen (N) stocks are frequently overlooked and inaccurately quantified and little is known about to what extent the ongoing climate change can alter these stocks. We quantified the soil organic C (SOC) and N (SN) stocks in Mediterranean forests dominated by these tree species and evaluated to what extent an experimental precipitation reduction (about −30% yearly) affects these stocks and the litter decomposition efficiency. Litter mass losses were 55.7, 49.8 and 45.7% after 24 months of decomposition in Q. ilex, Q. pubescens and P. halepensis forests, respectively, and were 19% lower under drier climatic conditions. The SOC stocks were 14.0, 16.7 and 18.5 Mg ha−1 and the SN stocks were 0.70, 0.93 and 0.88 Mg ha−1 in Q. ilex, Q. pubescens and P. halepensis forests, respectively. The shallowness and stoniness of these Mediterranean forests could explain these limited stocks. By distinguishing the organic from the organo–mineral layer, we showed 74% less SOC in the organic layer of the P. halepensis forest under drier conditions, while no difference was detected in the organo–mineral layer or in the two oak forests. This last finding deserves further investigation and points out the necessity to distinguish the organic from the organo–mineral layer to detect the first impacts of climate change on SOC stocks.
1. Introduction
Globally, soils store about three to four times more organic carbon (C) (1500–2400 Gt) than vegetation (450–650 Gt) and almost twice as much as is present in the atmosphere (860 Gt) [1]. As the C residence time is longer in soils than in the vegetation biomass [2,3], the stable incorporation of C in soils is of great interest to reduce atmospheric CO2 concentration in order to contribute to climate change mitigation [4,5,6]. Covering about 31% of the world’s land surface, forest ecosystems play a crucial role in the global C stock [7,8,9]. Indeed, C sequestration in forests, which performs a key role as CO2 sinks, can help mitigate the effects of climate change [4,5,10]. During 2004–2013, the world’s forests sequestrated between 2.5 and 3.9 Gt of C per year, which represents nearly 30% of global fossil fuel emissions [9]. Pan et al. [7] reported that the C sinks in temperate forests increased by 17% from 2000 to 2007 compared with the period 1990 to 1999. The global C stock of forests is estimated at 662 Gt [11], with almost half stored in the soil [7], making soil C sequestration a powerful strategy for mitigating climate change [4,5,10]. However, strong concerns in this climate change mitigation potential persist due to uncertainties in forest soil C stock responses to future climatic conditions, as relatively small changes in soil C stocks can have large effects on the forest greenhouse gas balance [4,5,12].
Plant litter, microorganisms and roots are the major input sources of soil organic carbon (SOC) in forests [13,14,15], while heterotrophic respiration by litter decomposers, leaching and erosion account for the main SOC loss processes [16]. Climate has been identified as one of the main factors influencing SOC [17]. Indeed, many studies of the spatial distribution of C stocks under natural vegetation have revealed positive correlations with precipitation and negative correlations with temperature, either on the global scale [17,18] or in more restricted territories, such as in France [19,20]. With the ongoing climate change, drier conditions have become more frequent and severe in many terrestrial ecosystems [21,22]. Over the past decades, there has been a growing interest in predicting the impact of climate change on forested ecosystems as they play a major role in C sequestration and climate regulation [23,24,25,26].
Although Mediterranean forests represent only 1.8% (80 Mha) of the world’s forest cover, they are an important niche for biodiversity [27,28] and they provide a wide array of essential ecosystem services to society [28,29,30]. Compared with temperate and tropical forests, C assessments in Mediterranean ecosystems remain scarce [31,32,33], arguing that Mediterranean ecosystems (i) have a low productivity (and therefore are of low economic value) and (ii) are characterized by heterogeneous historical land-use practices and soil characteristics (e.g., shallow, high rock content) that hamper the reliable and accurate estimation of C pools [28,32,34]. Mediterranean ecosystems are among the most sensitive terrestrial biomes to climate change [28,35]. Regional climate models for the Mediterranean basin predict for 2100 a warming of 3.4 °C of the annual average temperature and a decrease of annual precipitations by 30–40%, which will result in an intensification of severe droughts (according to the RCP 8.5 scenario) [36,37,38]. Drier conditions will severely impact biological processes that are already limited by water availability in Mediterranean forests [30,39], with cascading effects on litter decomposition efficiency and C dynamics [40,41] and consequently on the ability of Mediterranean forests to sequester C.
In France, Mediterranean forests represent about 8% of the total forest cover (1.4 over 16.9 Mha) [42], with almost 80% dominated by Pinus halepensis Mill. (0.21 Mha), Quercus ilex L. (0.38 Mha) and Quercus pubescens Willd. (0.33 Mha) [43]. These three tree species also structure the three main forests of the northern part of the Mediterranean basin [27]. As French forest cover has been increasing by 0.8% per year since 1985 mainly due to the cessation of traditional farming [28,42], the Mediterranean forests dominated by these three trees species may constitute an important C sink for the future. However, to date, little is known about their C stocks that remain to be accurately quantified.
In order to improve our knowledge on their contribution to the global C and N stocks, the present study aimed (i) at quantifying the soil organic C and N concentrations and stocks in the three dominant Mediterranean forests (i.e., P. halepensis, Q. ilex and Q. pubescens) at three long-term study sites located in southern France and (ii) at evaluating whether an experimental precipitation reduction (about −30% yearly) affects the efficiency of the litter decomposition process and the SOC and SN concentrations and stocks in these forests. We hypothesized a negative effect of an experimental precipitation reduction on litter decomposition efficiency and on SOC and SN concentrations and stocks, as water availability is the most important environmental constraint for soil microbial and faunal activities in Mediterranean ecosystems [39,41,44,45,46].
2. Material and Methods
2.1. Study Sites
The study was conducted in the three dominant forests north of the Mediterranean basin. The P. halepensis forest was represented by the experimental site of Font-Blanche (hereafter, FB; 43°14′27″ N, 5°40′45″ E), the Q. ilex forest was represented by the experimental site of Puéchabon (hereafter, PC; 43°44′29″ N, 3°35′46″ E) and the Q. pubescens forest was represented by the experimental site of Oak Observatory at the Observatoire de Haute Provence (hereafter, O3HP; 43°56′16″ N, 5°42′64″ E) (Table 1). Each study site included a control plot (natural drought ND) and a rain exclusion plot (amplified drought AD) to mimic the future precipitation reduction predicted by the climatic model for the Mediterranean region (about −30% yearly) [36,37,38]. In the Q. pubescens forest, the rain exclusion started in 2012 with the implementation of a 15 m × 20 m rainout shelter above the canopy that dynamically excluded precipitations by deploying automated shutters during rainfall events of the vegetation period (i.e., from spring to autumn). In the P. halepensis and Q. ilex forests, the rain exclusion is performed by using fixed PVC gutters (in an area of 25 m × 25 m) installed below the forest canopy, excluding about 30% at each rainfall event throughout the year. Control plots had the same system, but the PVC gutters were fixed upside down and did not exclude rainfall. The corresponding rain exclusion plots were settled in 2003 and 2008 in the Q. ilex and P. halepensis forests, respectively. The three study sites are part of the research infrastructure AnaEE-France (https://www.anaee-france.fr/en/; accessed on 11 August 2022) and offer experimental facilities, including a set of sensors for long-term monitoring of environmental data. The study site characteristics are detailed in Table 1.

Table 1.
Main characteristics of the three studied forests. Mean annual temperature (MAT) and precipitation (MAP) correspond, respectively, to the annual mean values of temperature and precipitation between 2008 and 2019 in natural precipitation (ND) and amplified drought (AD) plots.
2.2. Litter Decomposition Experiment
Senescent leaves and needles were collected in the three studied forests during the abscission period that occurred from April to May 2014 for Q. ilex leaves, from June to September 2014 for P. halepensis needles and from October to November 2014 for Q. pubescens leaves, using litter traps suspended under the concerned trees. Immediately after collection, the leaves were air dried at room temperature and stored until the beginning of the experiment.
Leaf litter decomposition was studied over 24 months using the litterbag method [47]. Ten grams of dry leaf litter were placed in a 4 mm mesh litterbag (20 cm × 20 cm), with the mesh size designed to allow colonization by microbes, soil mesofauna and some soil macrofauna [41]. A total of 84 litterbags (3 forest types × 2 precipitation treatments × 2 sampling times × 7 replicates) were thus used during the experiment. Litterbags were placed perpendicularly to the gutter systems in the P. halepensis and Q. ilex forests and under the rain exclusion device in the Q. pubescens forest in December 2014. They were placed on the ground after the removal of the litter layer and fixed to the soil with galvanized nails to prevent movement by animals or wind. A litter layer was then replaced over the litter bags.
The litter mass loss was measured after 12 and 24 months of decomposition, i.e., in December 2015 and 2016, respectively. At each sampling date, 14 litter bags were retrieved from each forest. When taken off, the litterbags were immediately sealed in plastic bags to prevent litter material loss and transported to the laboratory. In the laboratory, the litter contained in the litter bags was cleaned of soil and other plant detritus and stored at −18 °C. All the samples were freeze dried (Lyovac GT2) and weighted.
2.3. Soil Sampling and Carbon and Nitrogen Measurements
At each forest site, fifteen soil cores were randomly collected up to 10 cm depth in both ND and AD plots in 2016. Soil layers were identified and mechanically separated according to the World Reference Base for Soil Resources system [48] in order to distinguish the organic (O) from the organo–mineral (A) layer. In total, 180 soil samples (3 forest types × 2 precipitation treatments × 2 soil layers × 15 replicates) were collected and transported to the laboratory in plastic bags prior to further analysis.
In the laboratory, each soil sample was sieved at 2 mm mesh prior to being oven dried at 65 °C for 48 h. Stones and other litter detritus (>2 mm) were retrieved and only fine soil fraction (<2 mm) was used for soil C and N measurements.
Total carbon (TC) and nitrogen (N) concentrations of the 180 soil samples were determined by thermal combustion on a Flash EA 1112 series C/N elemental analyzer (Thermo Scientific®, Waltham, MA, USA). As the bedrock of our study sites is limestone (Table 1), C can also be present as calcium carbonate (CaCO3) in the soil, necessitating that this inorganic form of C in our soil analysis is taken into account. SIC concentrations were estimated using the loss-on-ignition (LOI) procedure followed by Wang et al. [49]:
Soil organic C (SOC) was calculated by the differences between TC and soil inorganic C (SIC). SOC and SN stock (Mg ha−1) were estimated for both organic and organo–mineral layers and scaled to ha by taking into consideration the rock surface estimations (Table 1).
2.4. Statistical Analysis
All statistical analyses were performed with the R software (version 3.1.3, R Development Core Team, 2017). Data were log-transformed when necessary to meet the assumption of normality and homoscedasticity.
A three-way analysis of variance (ANOVA), followed by post hoc Tukey tests, were used to compare litter mass loss during the decomposition process according to forest type, precipitation treatment, time of decomposition and their interactions.
A linear mixed effects model (‘‘nlme’’ package), followed by Tukey HSD tests for post hoc comparisons, were used to test the effects of forest type (P. halepensis, Q. ilex or Q. pubescens), precipitation treatment (natural or amplified drought), soil layers (organic or organo–mineral) and their interactions on SOC and SN concentrations and stocks. To consider the fact that the two soil layers within a soil core were not independent, the random part of the model indicated that the soil layers were nested soil cores.
A two-way analysis of variance (ANOVA), followed by post hoc Tukey tests, were used to compare total SOC and SN stocks up to 10 cm depth according to forest type, precipitation treatment and their interactions.
3. Results
3.1. Litter Mass Loss during the Decomposition Process
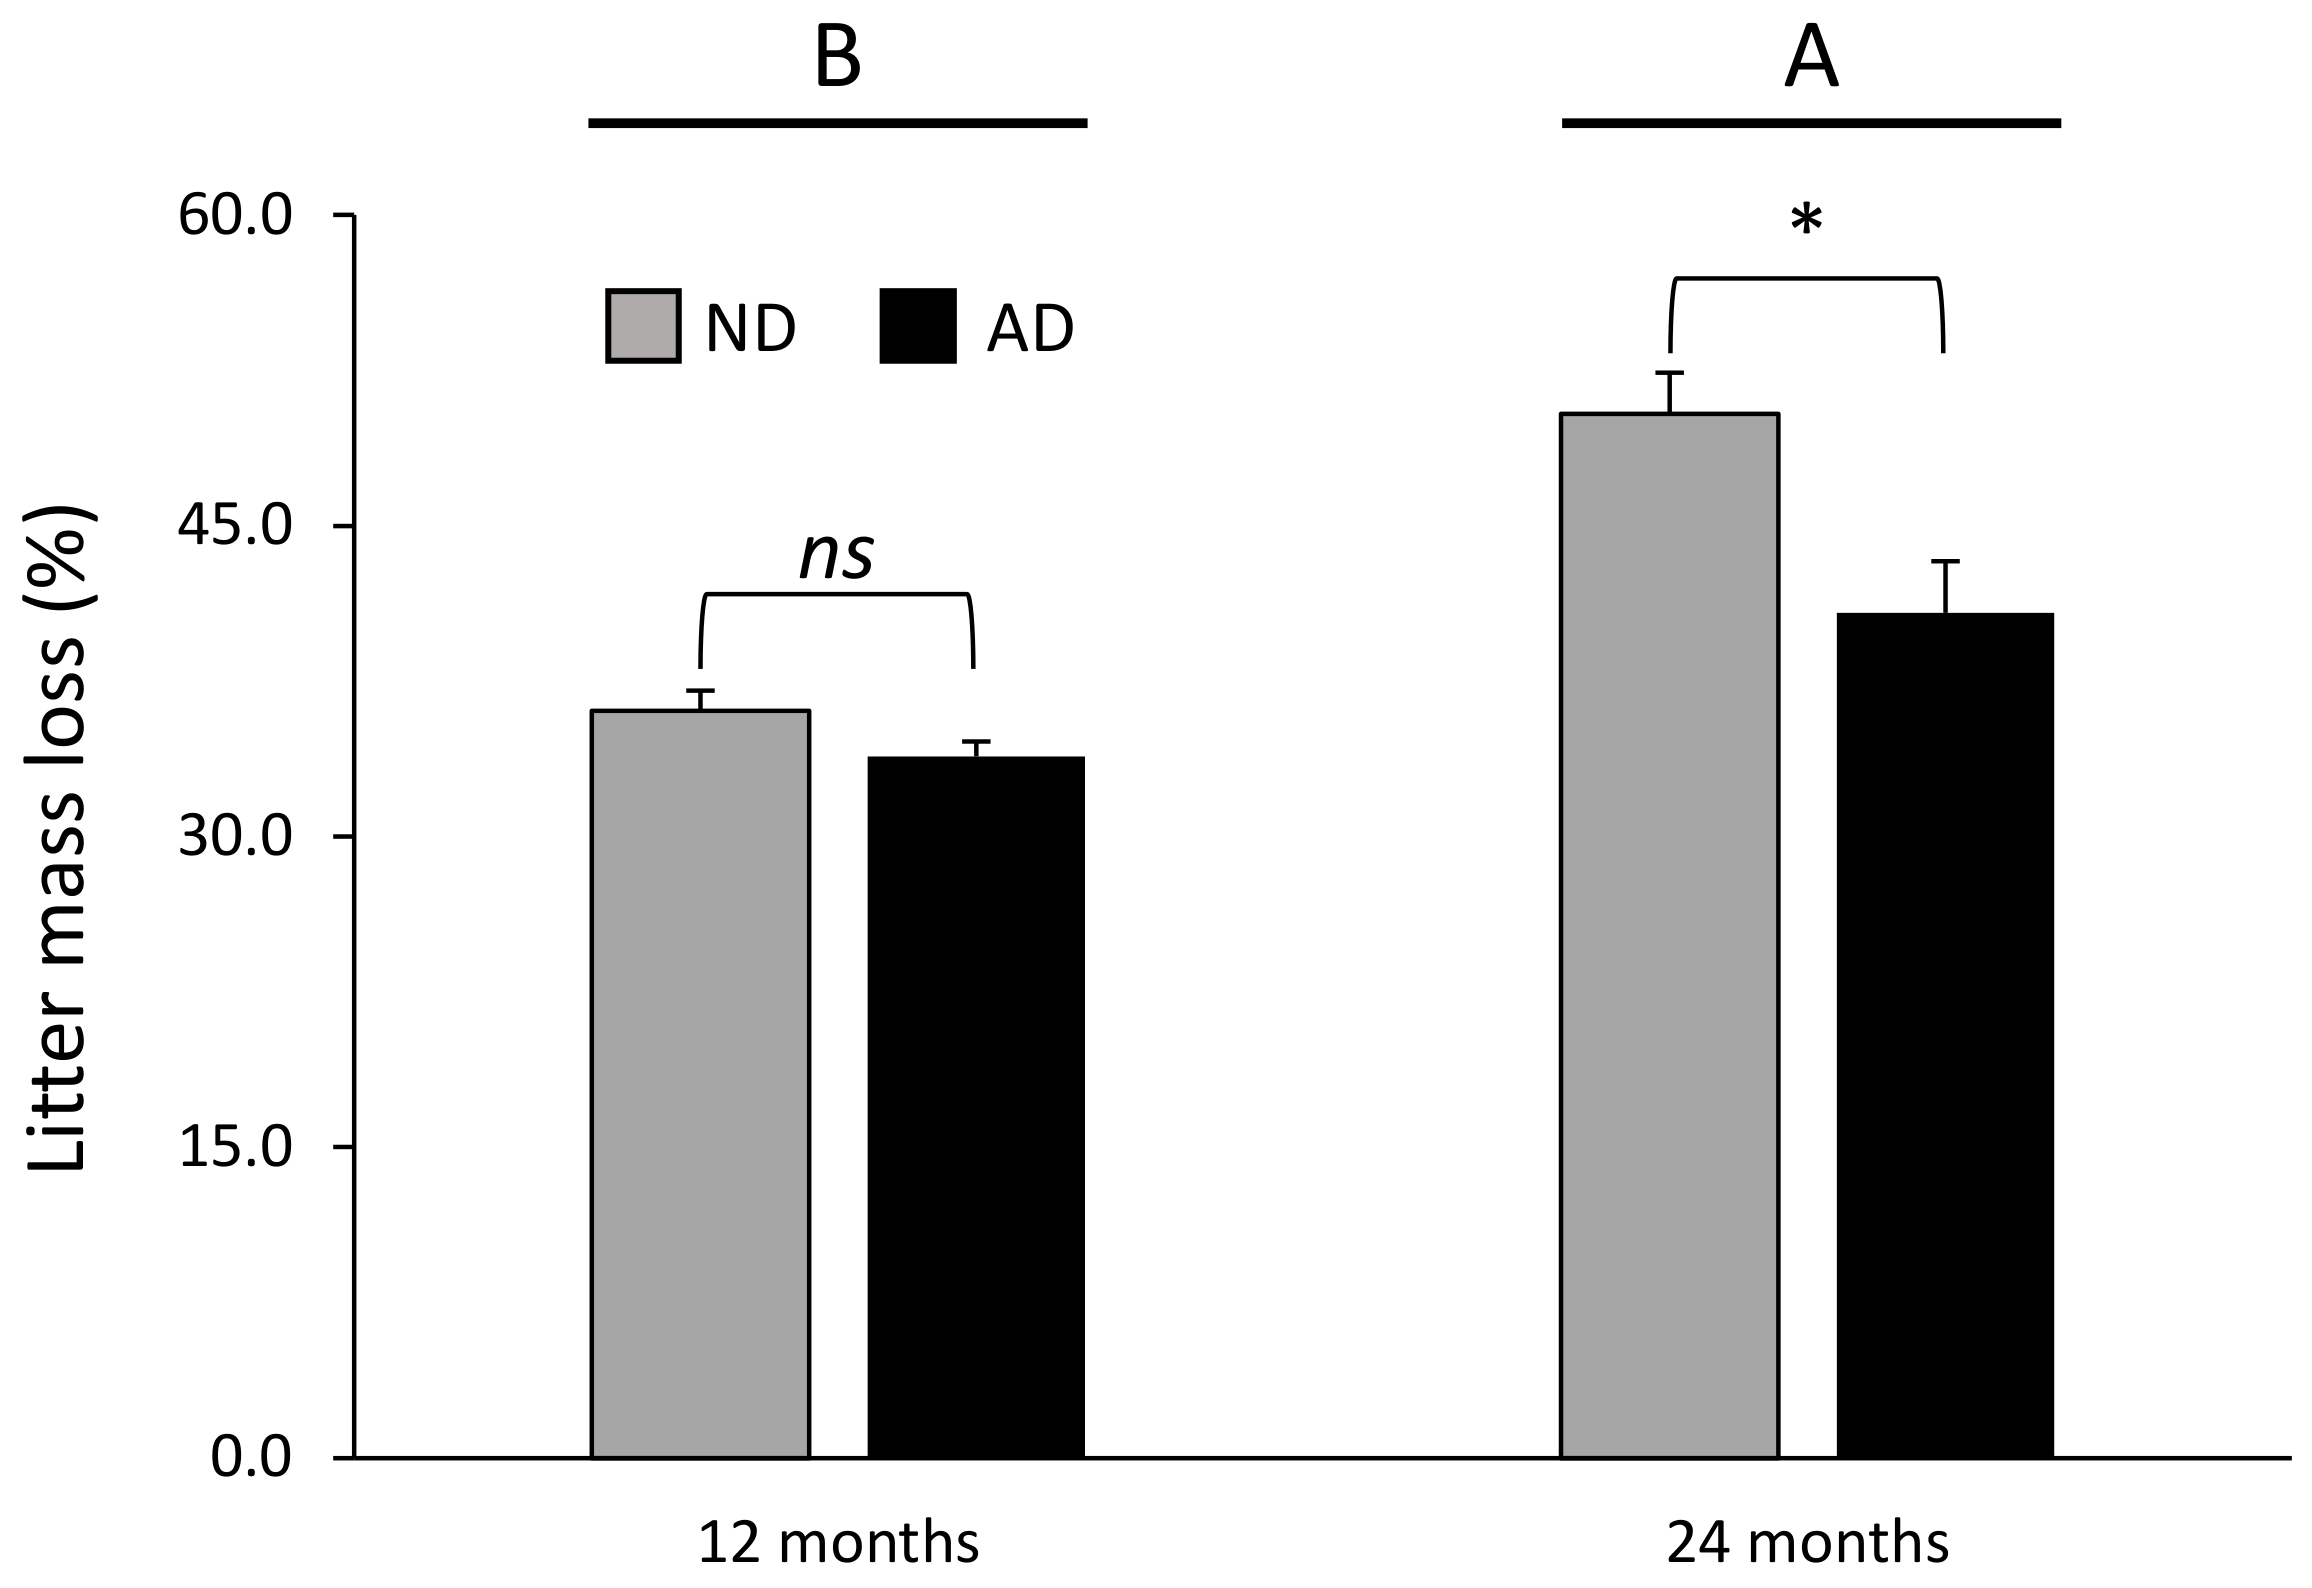
During the whole experiment, we found that the average litter mass loss was 35.0% and 45.6% after 12 and 24 months of decomposition, respectively (Table 2, Figure 1).
Table 2.
Effects of forest type (P. halepensis, Q. ilex and Q. pubescens), precipitation treatment (natural or amplified drought), time (12 or 24 months) and their interactions on litter mass loss. F-values and associated P-values (* for P < 0.05 and *** for P < 0.001) are indicated. Significant values are indicated in bold.
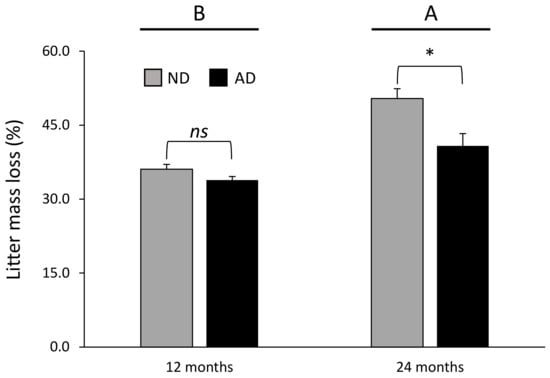
Figure 1.
Litter mass loss according to the significant precipitation treatment × time of decomposition interaction (Table 2). Data are mean values ± SE and expressed as % of mass loss; n = 21. Different capital letters denote significant differences between time of decomposition with A > B (post hoc Tukey tests results). Stars indicate significant differences between precipitation treatments (* for P < 0.05). ND—natural drought, AD—amplified drought, ns—non significant.
The differences in litter mass loss according to precipitation treatment were dependent on the time of decomposition (significant precipitation treatment × time of decomposition interaction, Table 2). Litter mass loss was not affected by the precipitation treatment after 12 months of decomposition (Figure 1); on the contrary, litter mass loss was 19% lower under amplified drought compared with natural drought treatment after 24 months of decomposition (Figure 1).
The differences in litter mass loss according to forest type were also dependent on the time of decomposition (significant forest type × time of decomposition interaction, Table 2). Pinus halepensis litter mass loss was higher (37.0%), compared with the two oak species after 12 months of decomposition (Figure 2). Quercus ilex showed higher litter mass loss (51.5%) compared with P. halepensis (41.7%) and Q. pubescens (43.6%) after 24 months of decomposition (Figure 2).
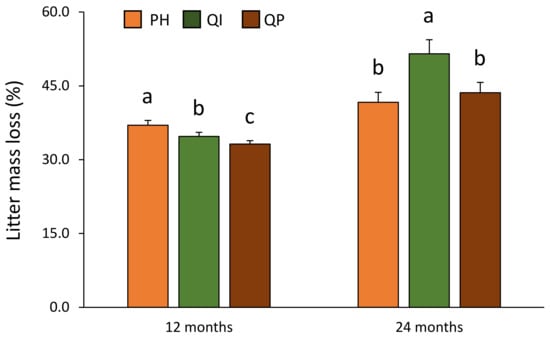
Figure 2.
Litter mass loss according to the significant forest type × time of decomposition interaction (Table 2). Data are mean values ± SE and expressed as % of mass loss; n = 14. Different lowercase letters denote significant differences between forest types with a > b > c (post hoc Tukey tests results). PH—Pinus halepensis, QI—Quercus ilex, QP—Quercus pubescens.
3.2. SOC and SN Concentrations
SOC and SN concentrations differed according to forest type and soil layer but were not affected by precipitation treatment (Table 3; Supplementary Table S1).
Table 3.
Effects of forest type (P. halepensis, Q. ilex and Q. pubescens), precipitation treatment (natural or amplified drought), soil layer (organic or organo–mineral) and their interactions on SOC and SN concentrations and stocks. Chi-square values and associated P-values (* for P < 0.05 and *** for P < 0.001) are indicated. Significant values are indicated in bold.
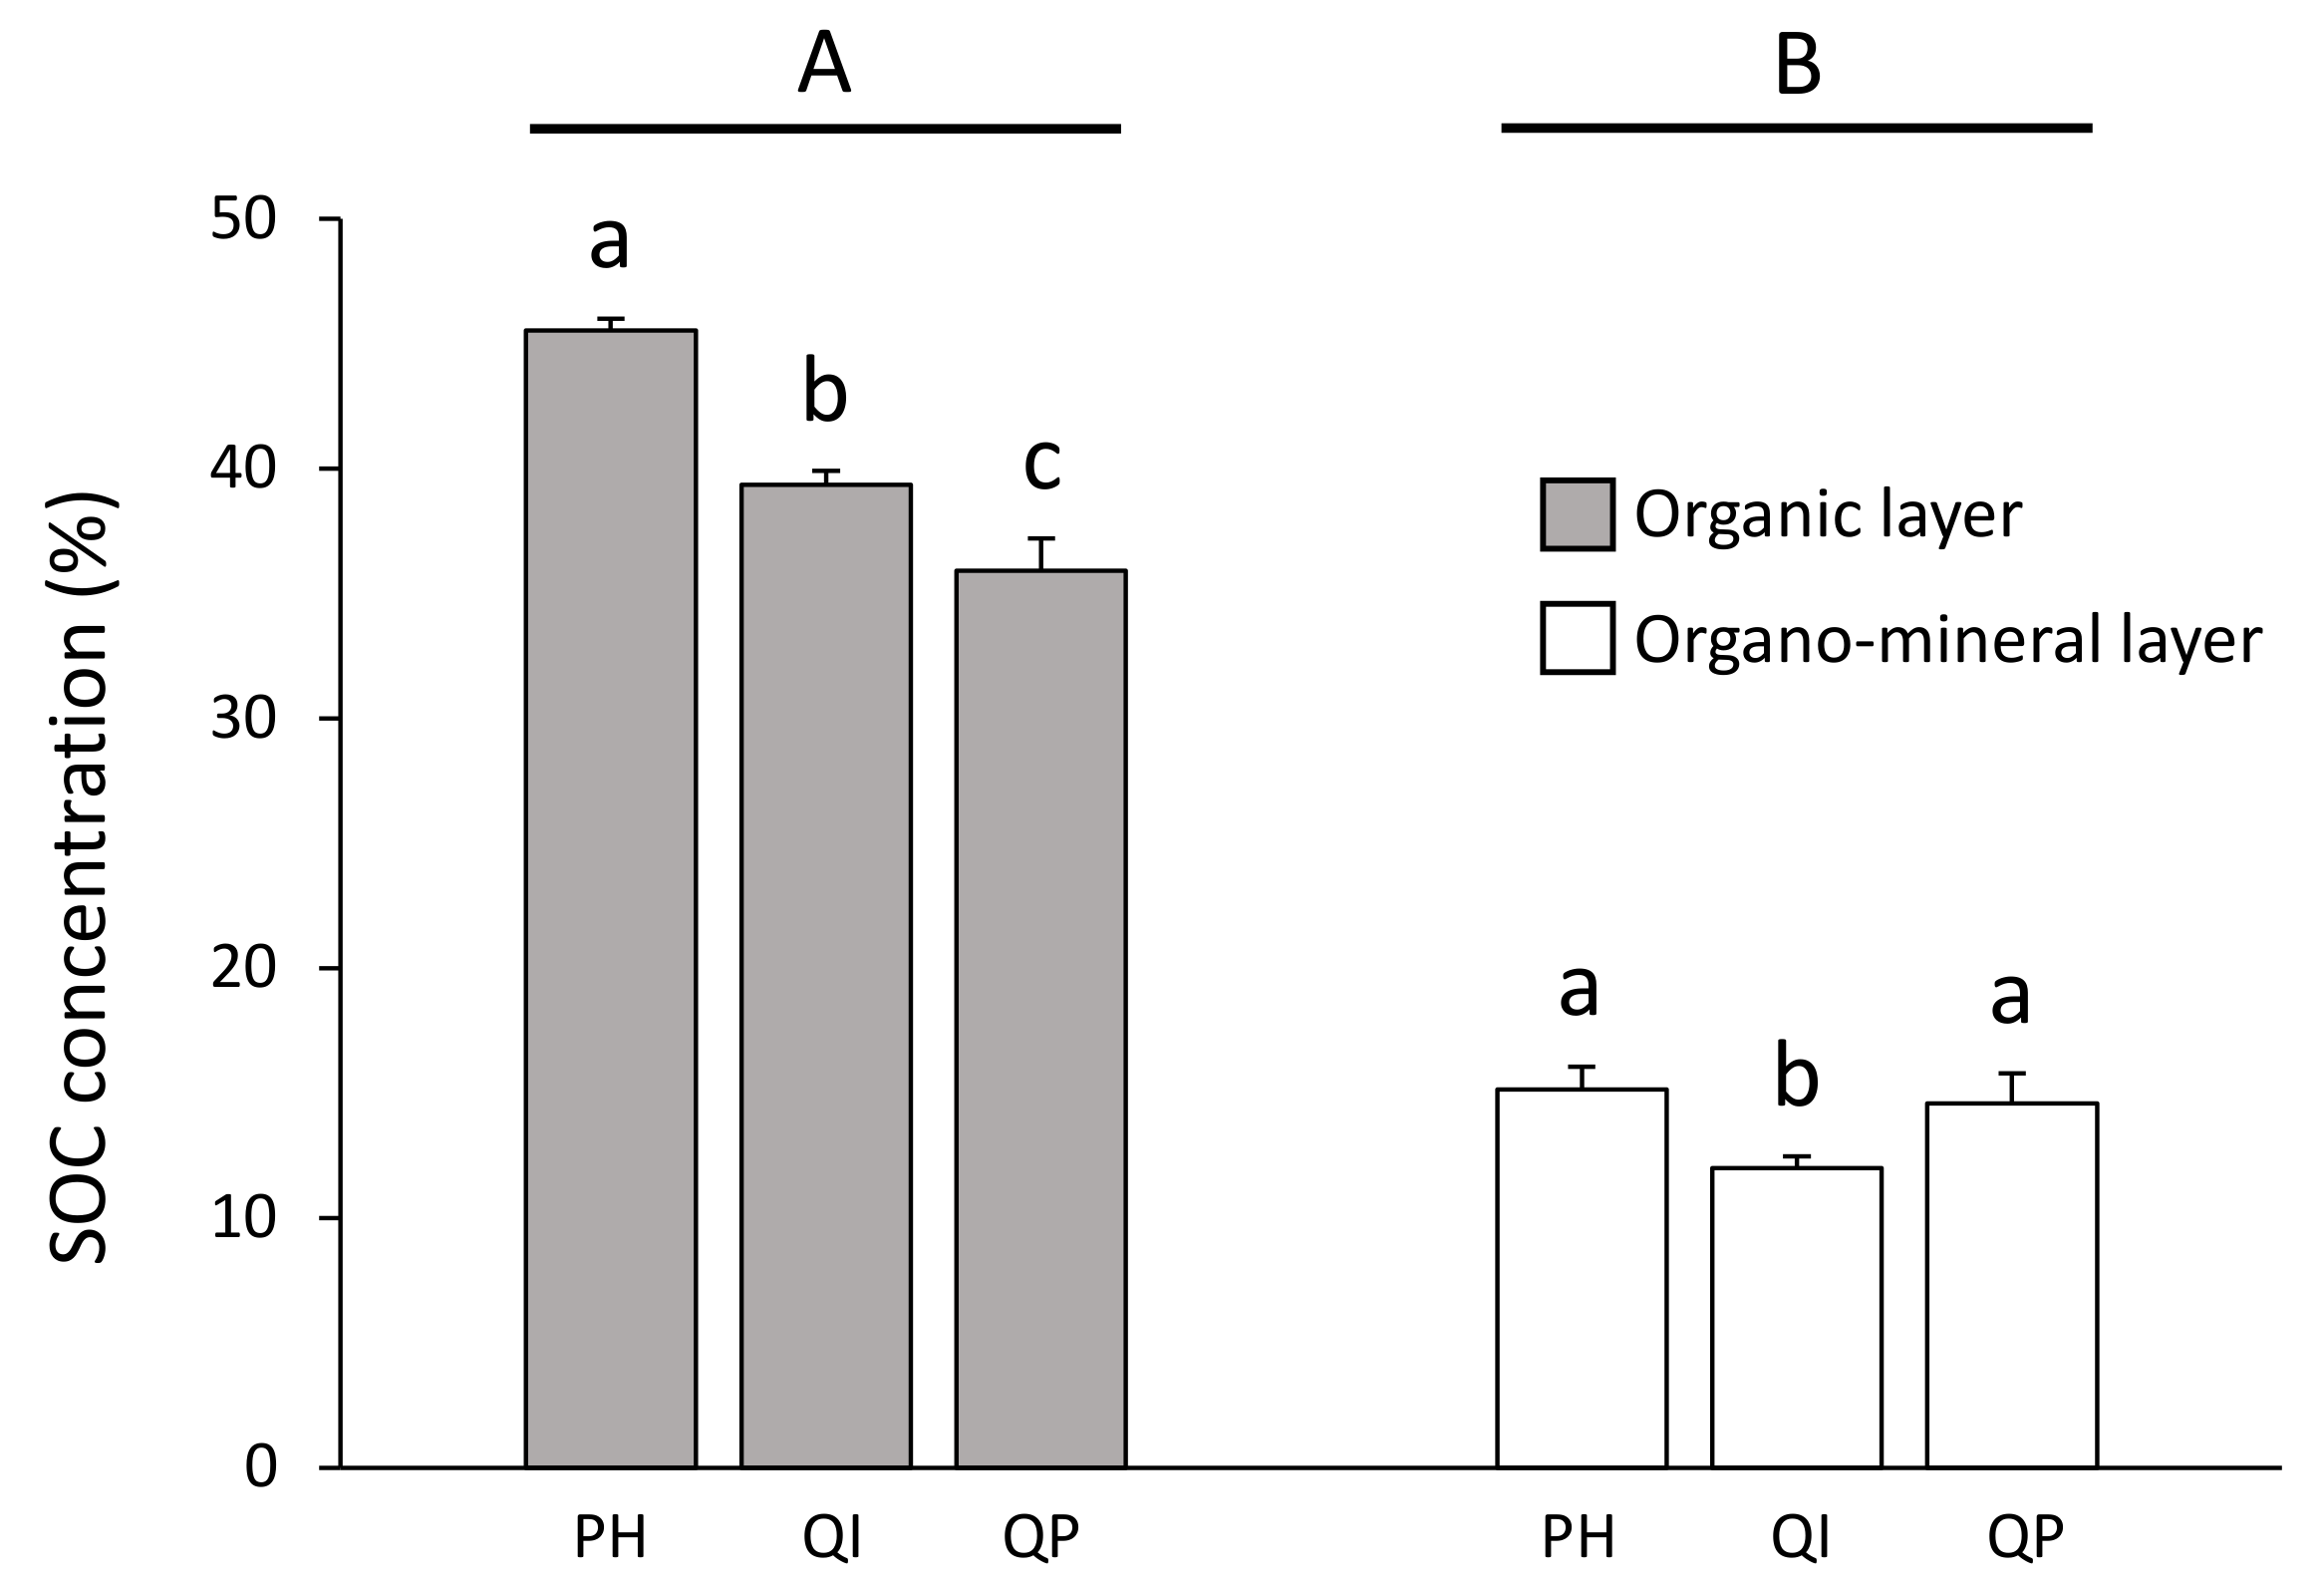
SOC concentration was three times higher in the organic layer (from 35.9 to 45.5%) compared with the organo–mineral layer (from 12.0 to 15.2%) (Table 3; Figure 3). Differences in SOC concentration between forest types were dependent on the soil layer considered (significant forest type × soil layer interaction, Table 3). SOC concentration in the organic layer decreased according to the gradient P. halepensis > Q. ilex > Q. pubescens forests, and was, respectively, 14% and 21% higher in the P. halepensis forest compared with the Q. ilex and Q. pubescens forests (Figure 3). Concerning the organo–mineral layer, the SOC concentration was 19% lower in the Q. ilex forest compared with the P. halepensis and Q. pubescens forests (Figure 3).

Figure 3.
Soil organic carbon concentration according to the significant forest type × soil layer interaction (Table 3). Data are mean values ± SE and expressed as % per g of DW soil; n = 30. Different capital letters denote significant differences between soil layers with A > B (post hoc Tukey tests results). Different lowercase letters denote significant differences between forest types for each soil layer with a > b > c (post hoc Tukey tests results). SOC—soil organic carbon, PH—Pinus halepensis, QI—Quercus ilex, QP—Quercus pubescens.
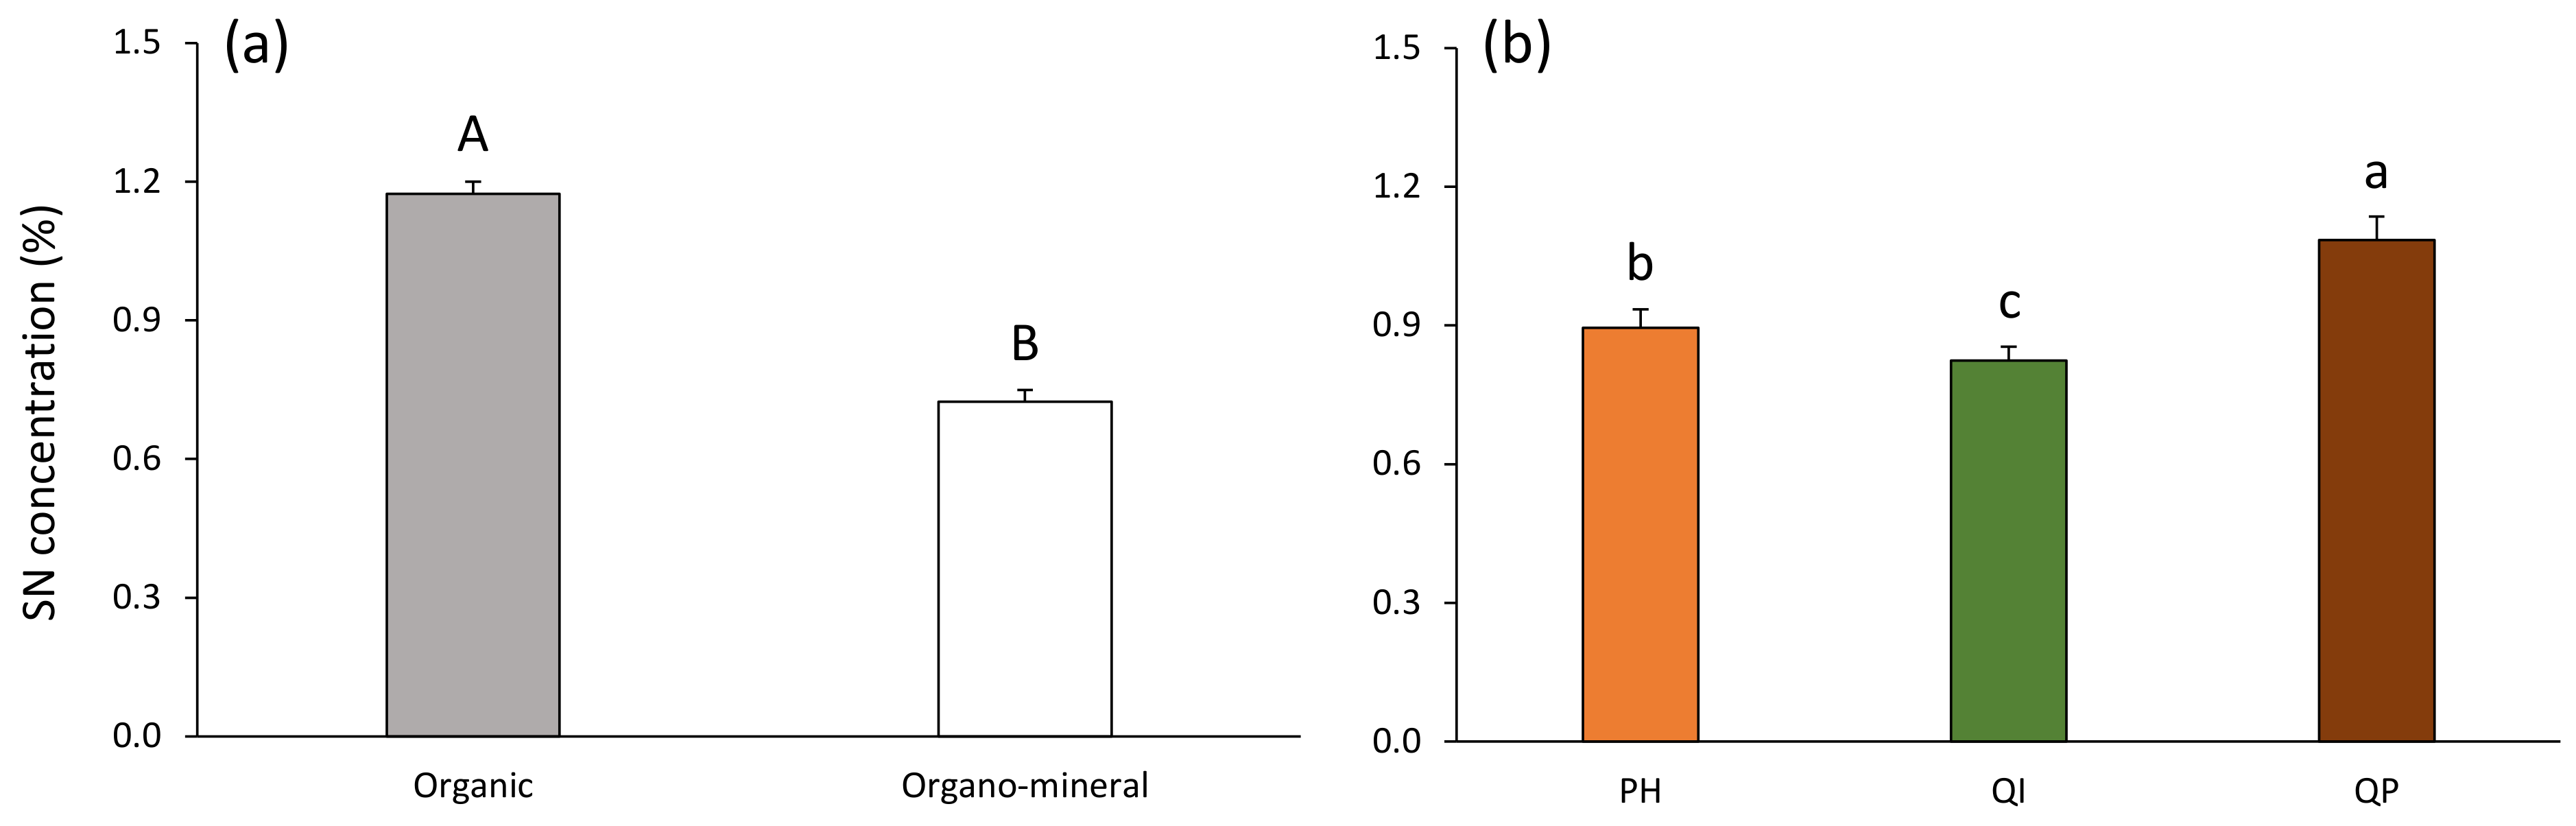
SN concentration was 38% higher in the organic compared with the organo–mineral layer (Table 3; Figure 4a). SN concentration decreased according to the gradient Q. pubescens > P. halepensis > Q. ilex forests, and was, respectively, 18% and 24% higher in the Q. pubescens forest compared with the P. halepensis and Q. ilex forests (Table 3; Figure 4b).

Figure 4.
Soil nitrogen concentration according to (a) soil layer and (b) forest type (Table 2). Data are mean values ± SE and expressed as % per g of DW soil; n = 30. Different capital letters denote significant differences between soil layers with A > B (post hoc Tukey tests results). Different lowercase letters denote significant differences between forest types with a > b > c (post hoc Tukey tests results). SN—soil nitrogen, PH—Pinus halepensis, QI—Quercus ilex, QP—Quercus pubescens.
3.3. SOC and SN Stocks
SOC and SN stocks differed according to forest type and soil layer (significant forest type × soil layer interaction) and only SOC stock was affected by a shift in precipitation (significant forest type × precipitation treatment × soil layer interaction, Table 3; Supplementary Table S1).
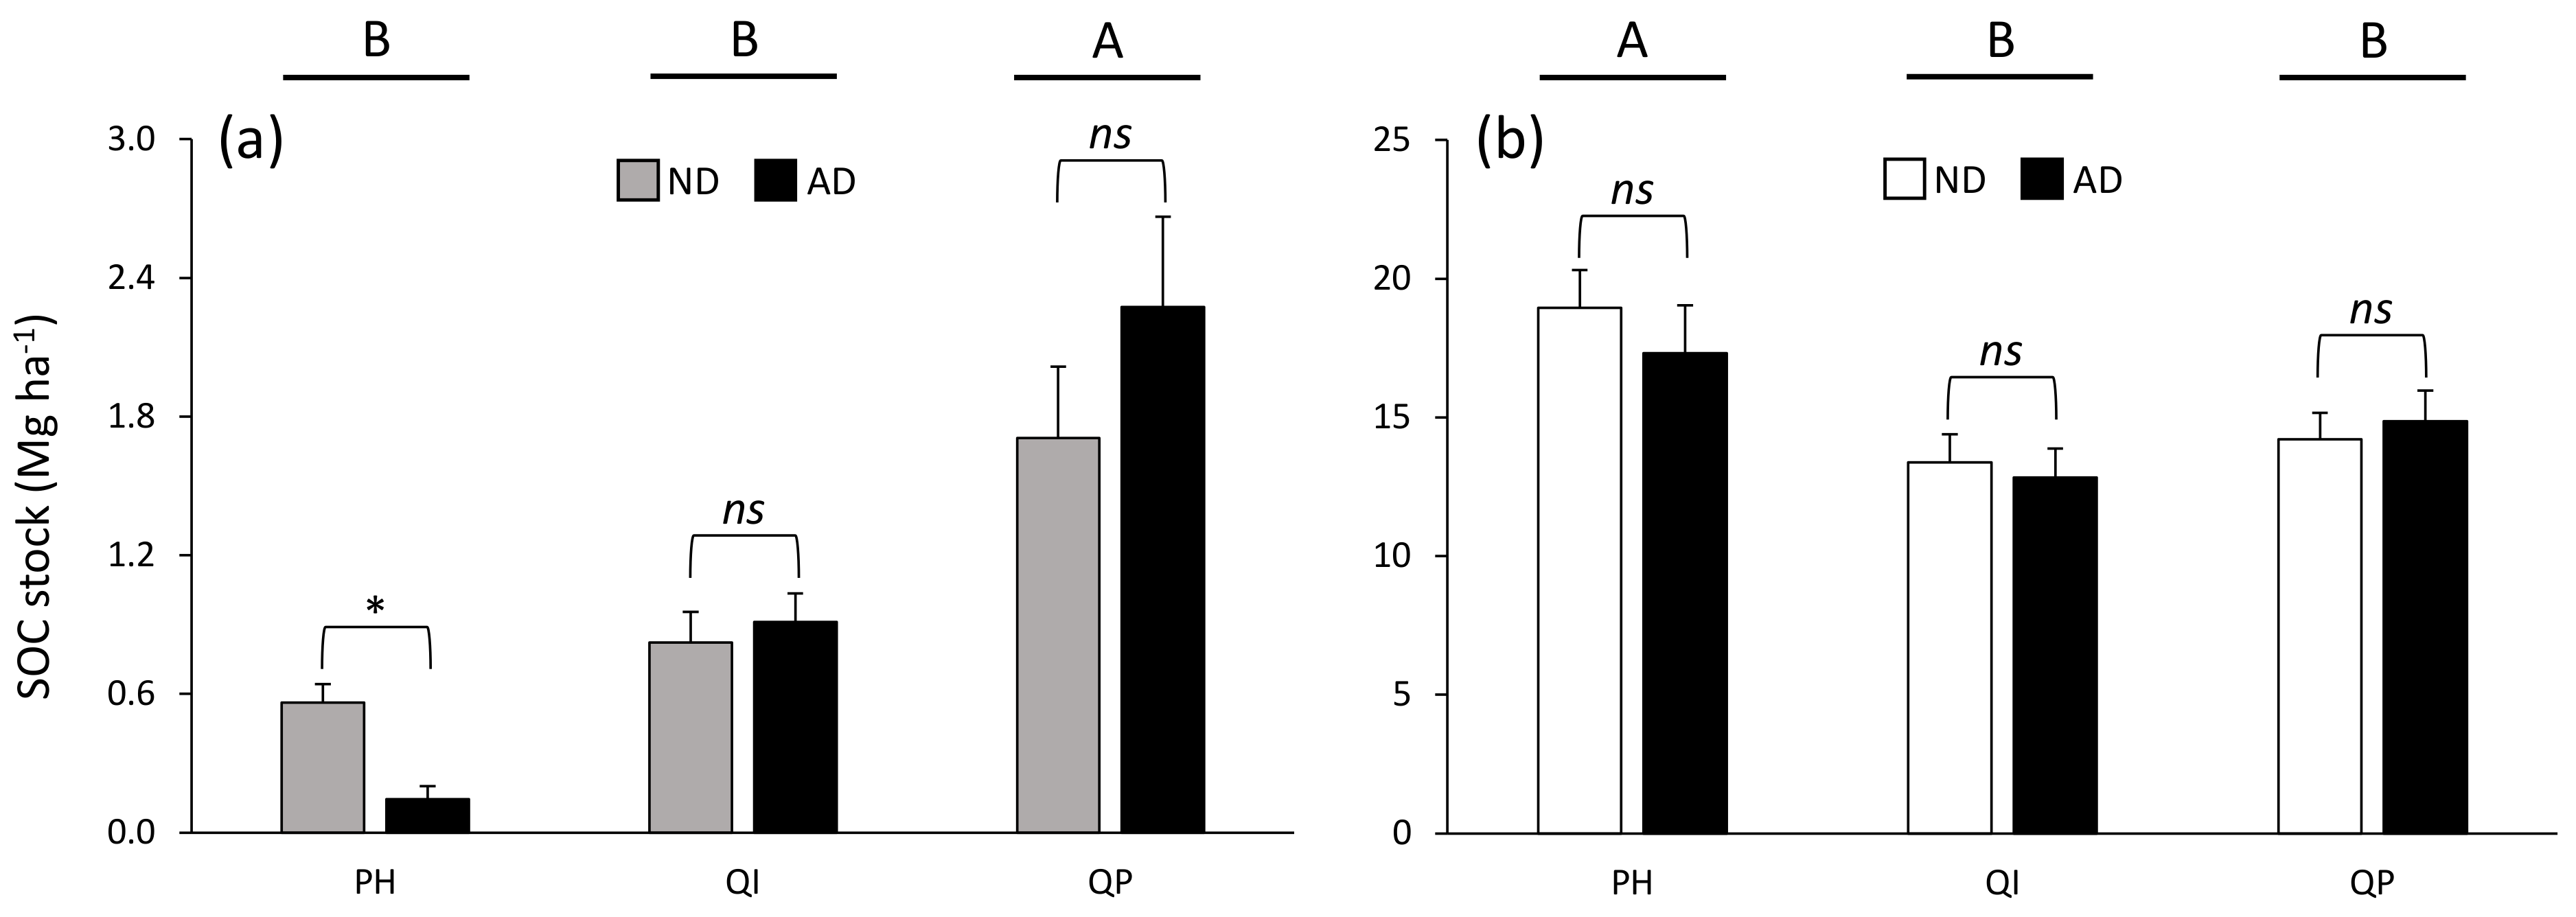
While SOC stock was higher in the organo–mineral layer (from 13.1 to 18.1 Mg ha−1) compared with the organic layer (from 0.4 to 2.0 Mg ha−1) (Table 3), the differences between forest types were dependent on the soil layer considered (significant forest type × soil layer interaction, Table 3) and the differences between precipitation treatments were dependent on both the soil layer and the forest type considered (significant forest type × soil layer × precipitation treatment interaction, Table 3). SOC stock in the organic layer was 69% higher in the Q. pubescens forest compared with the P. halepensis and Q. ilex forests (Figure 5a), while SOC stock in the organo–mineral layer was 24% higher in the P. halepensis forest compared with the two oak forests (Figure 5b). Only the SOC stock in the organic layer of the P. halepensis forest was affected by a shift in precipitation, with 74% less SOC in amplified drought compared with natural drought conditions (Figure 5a).
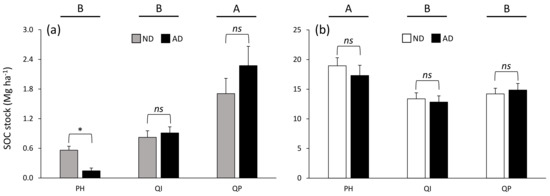
Figure 5.
Soil organic carbon stock in soil (a) organic and (b) organo–mineral layer according to the significant forest type × precipitation treatment × soil layer interaction (Table 3). Data are mean values ± SE and expressed as Mg per ha; n = 15. Different capital letters denote significant differences between forest types for each soil layer with A > B (post hoc Tukey tests results). Stars indicate significant differences between precipitation treatments (* for P < 0.05). SOC—soil organic carbon, ND—natural drought, AD—amplified drought, PH—Pinus halepensis, QI—Quercus ilex, QP—Quercus pubescens.
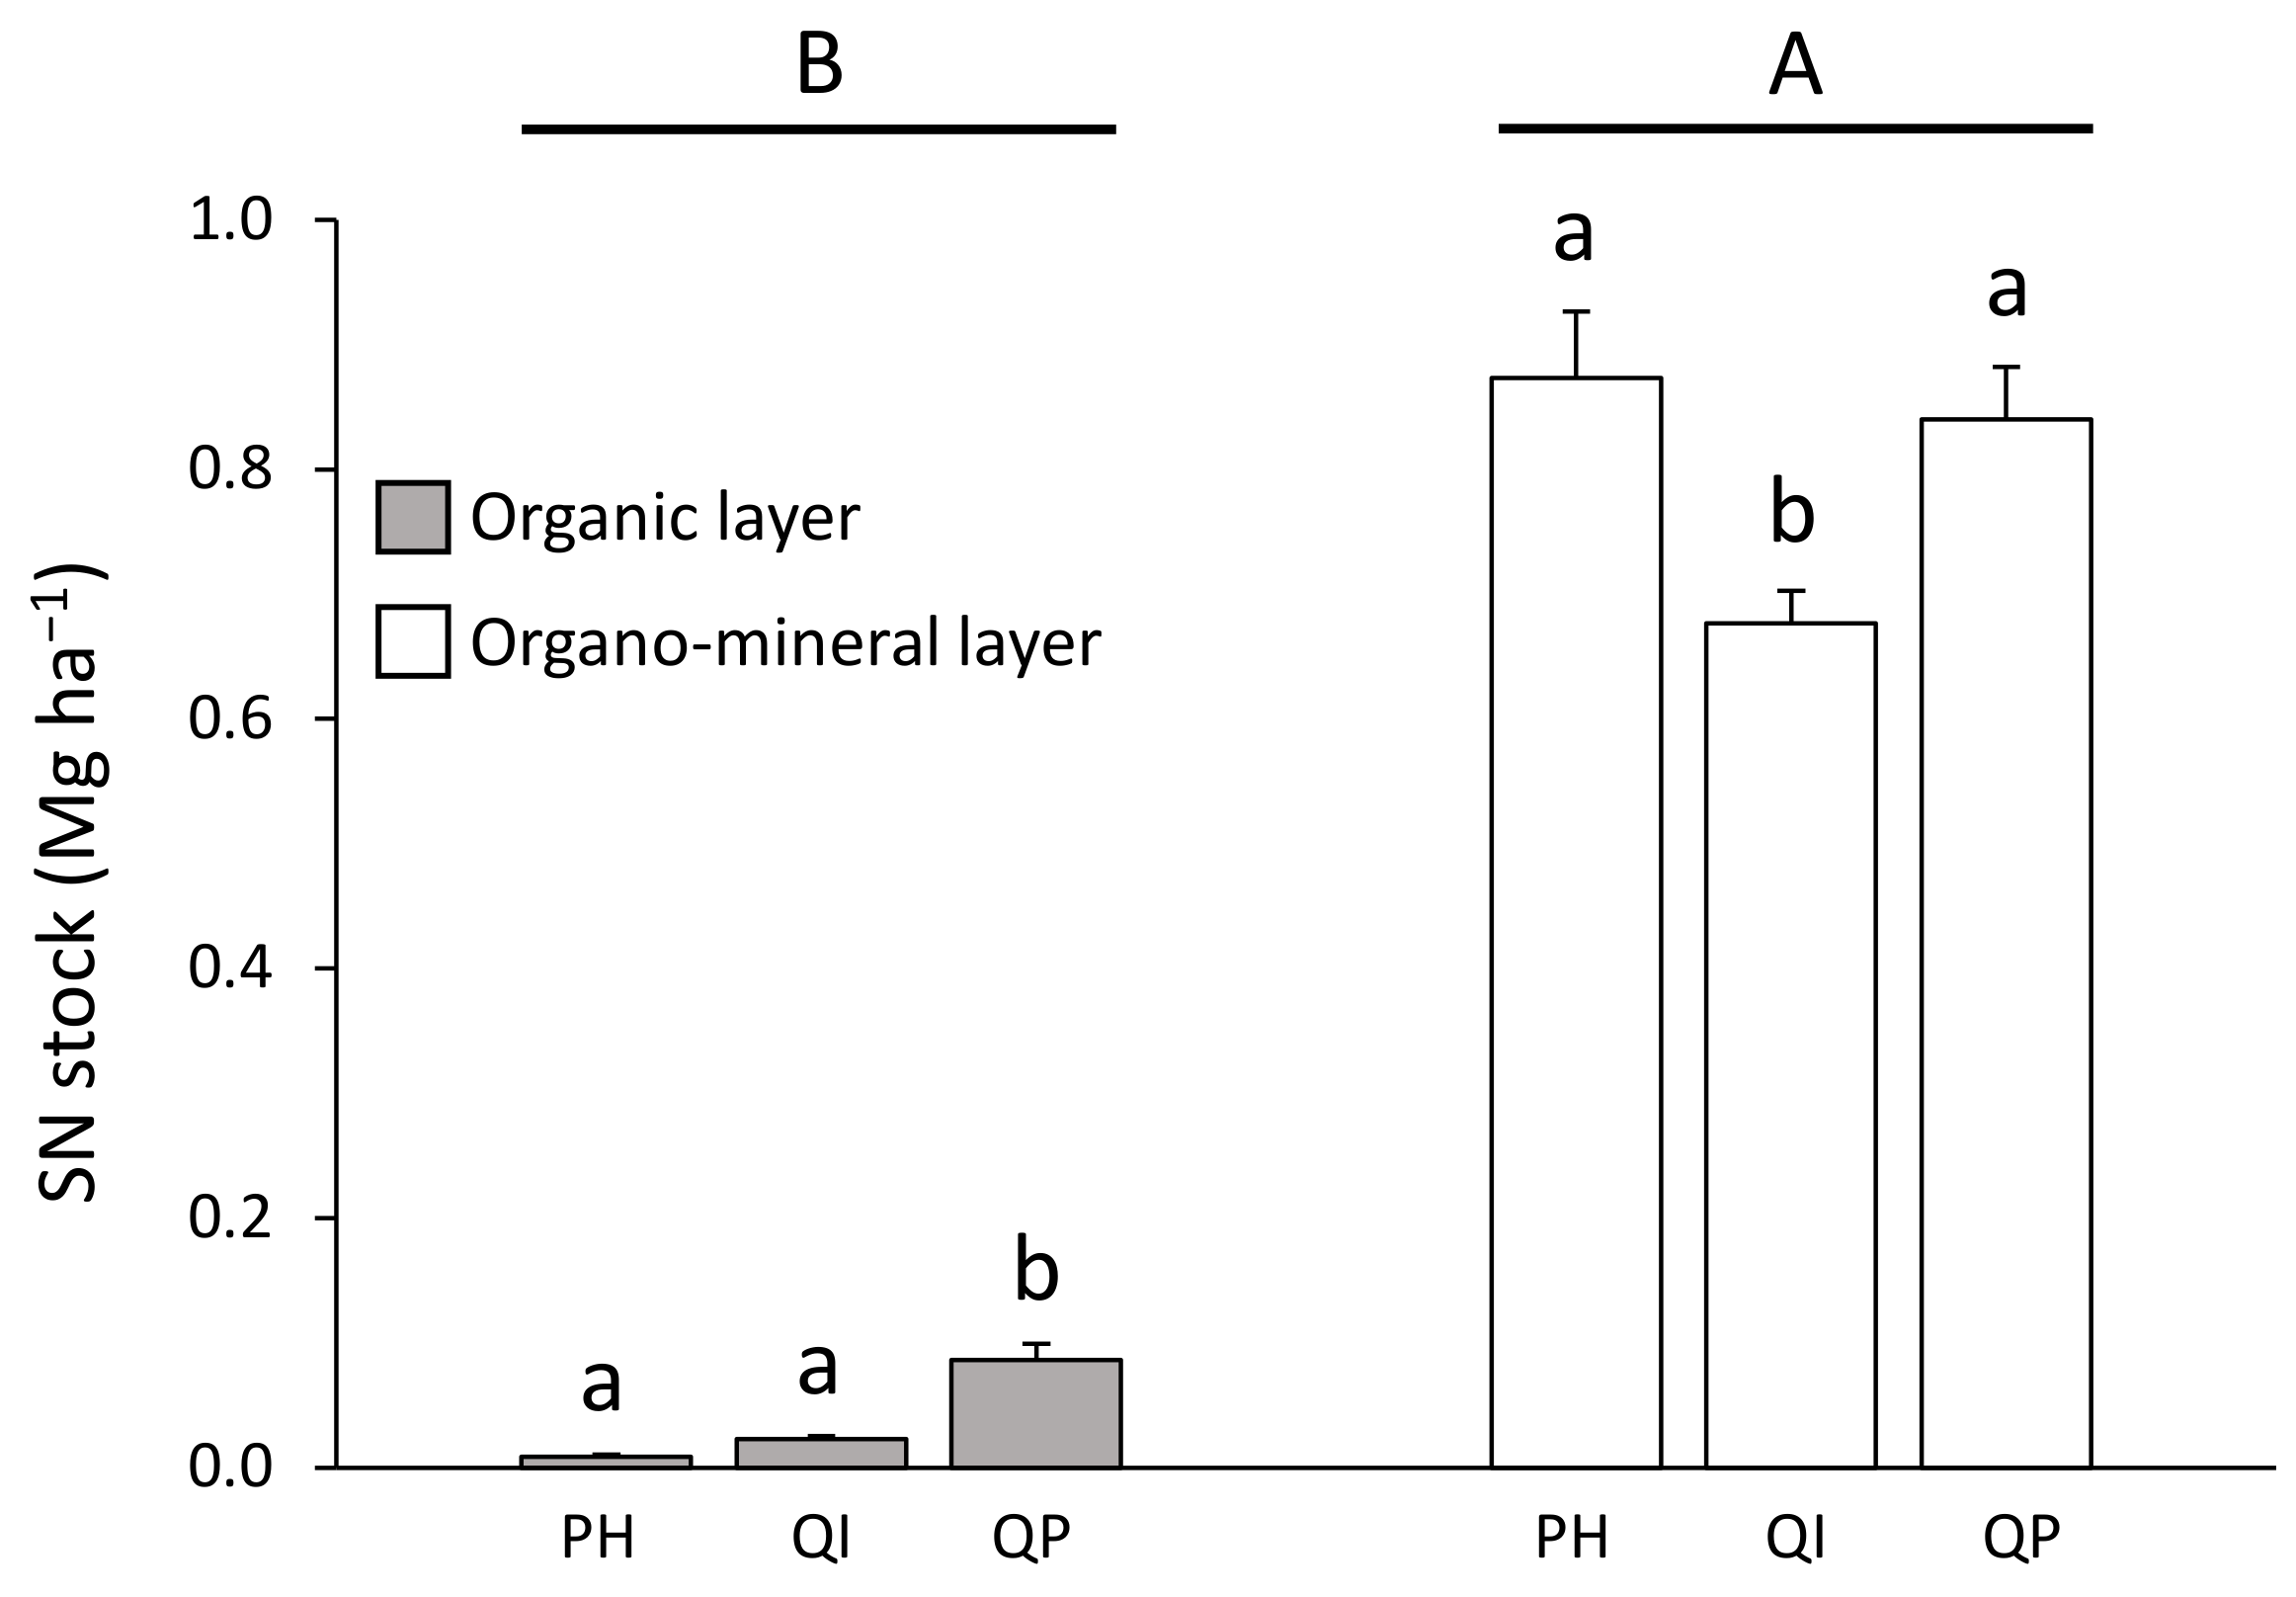
SN stock concentration was lower in the organic layer (from 0.01 to 0.09 Mg ha−1) compared with the organo–mineral layer (from 0.66 to 0.87 Mg ha−1) (Table 3; Figure 6). Differences in SN stock between forest types were dependent on the soil layer considered (significant forest type × soil layer interaction, Table 3). SN stock in the organic layer was five times higher in the Q. pubescens forest compared with the P. halepensis and Q. ilex forests (Figure 6). Concerning the organo–mineral layer, SN stock was 21% lower in the Q. ilex forest compared with the P. halepensis and Q. pubescens forests (Figure 6).

Figure 6.
Soil nitrogen stock according to the significant forest type × soil layer interaction (Table 2). Data are mean values ± SE and expressed as Mg per ha; n = 30. Different capital letters denote significant differences between soil layers with A > B (post hoc Tukey tests results). Different lowercase letters denote significant differences between forest types for each soil layer with a > b > c (post hoc Tukey tests results). SN—soil nitrogen, PH—Pinus halepensis, QI—Quercus ilex, QP—Quercus pubescens.
3.4. Total SOC and SN Stocks in the First 10 cm Soil Depth
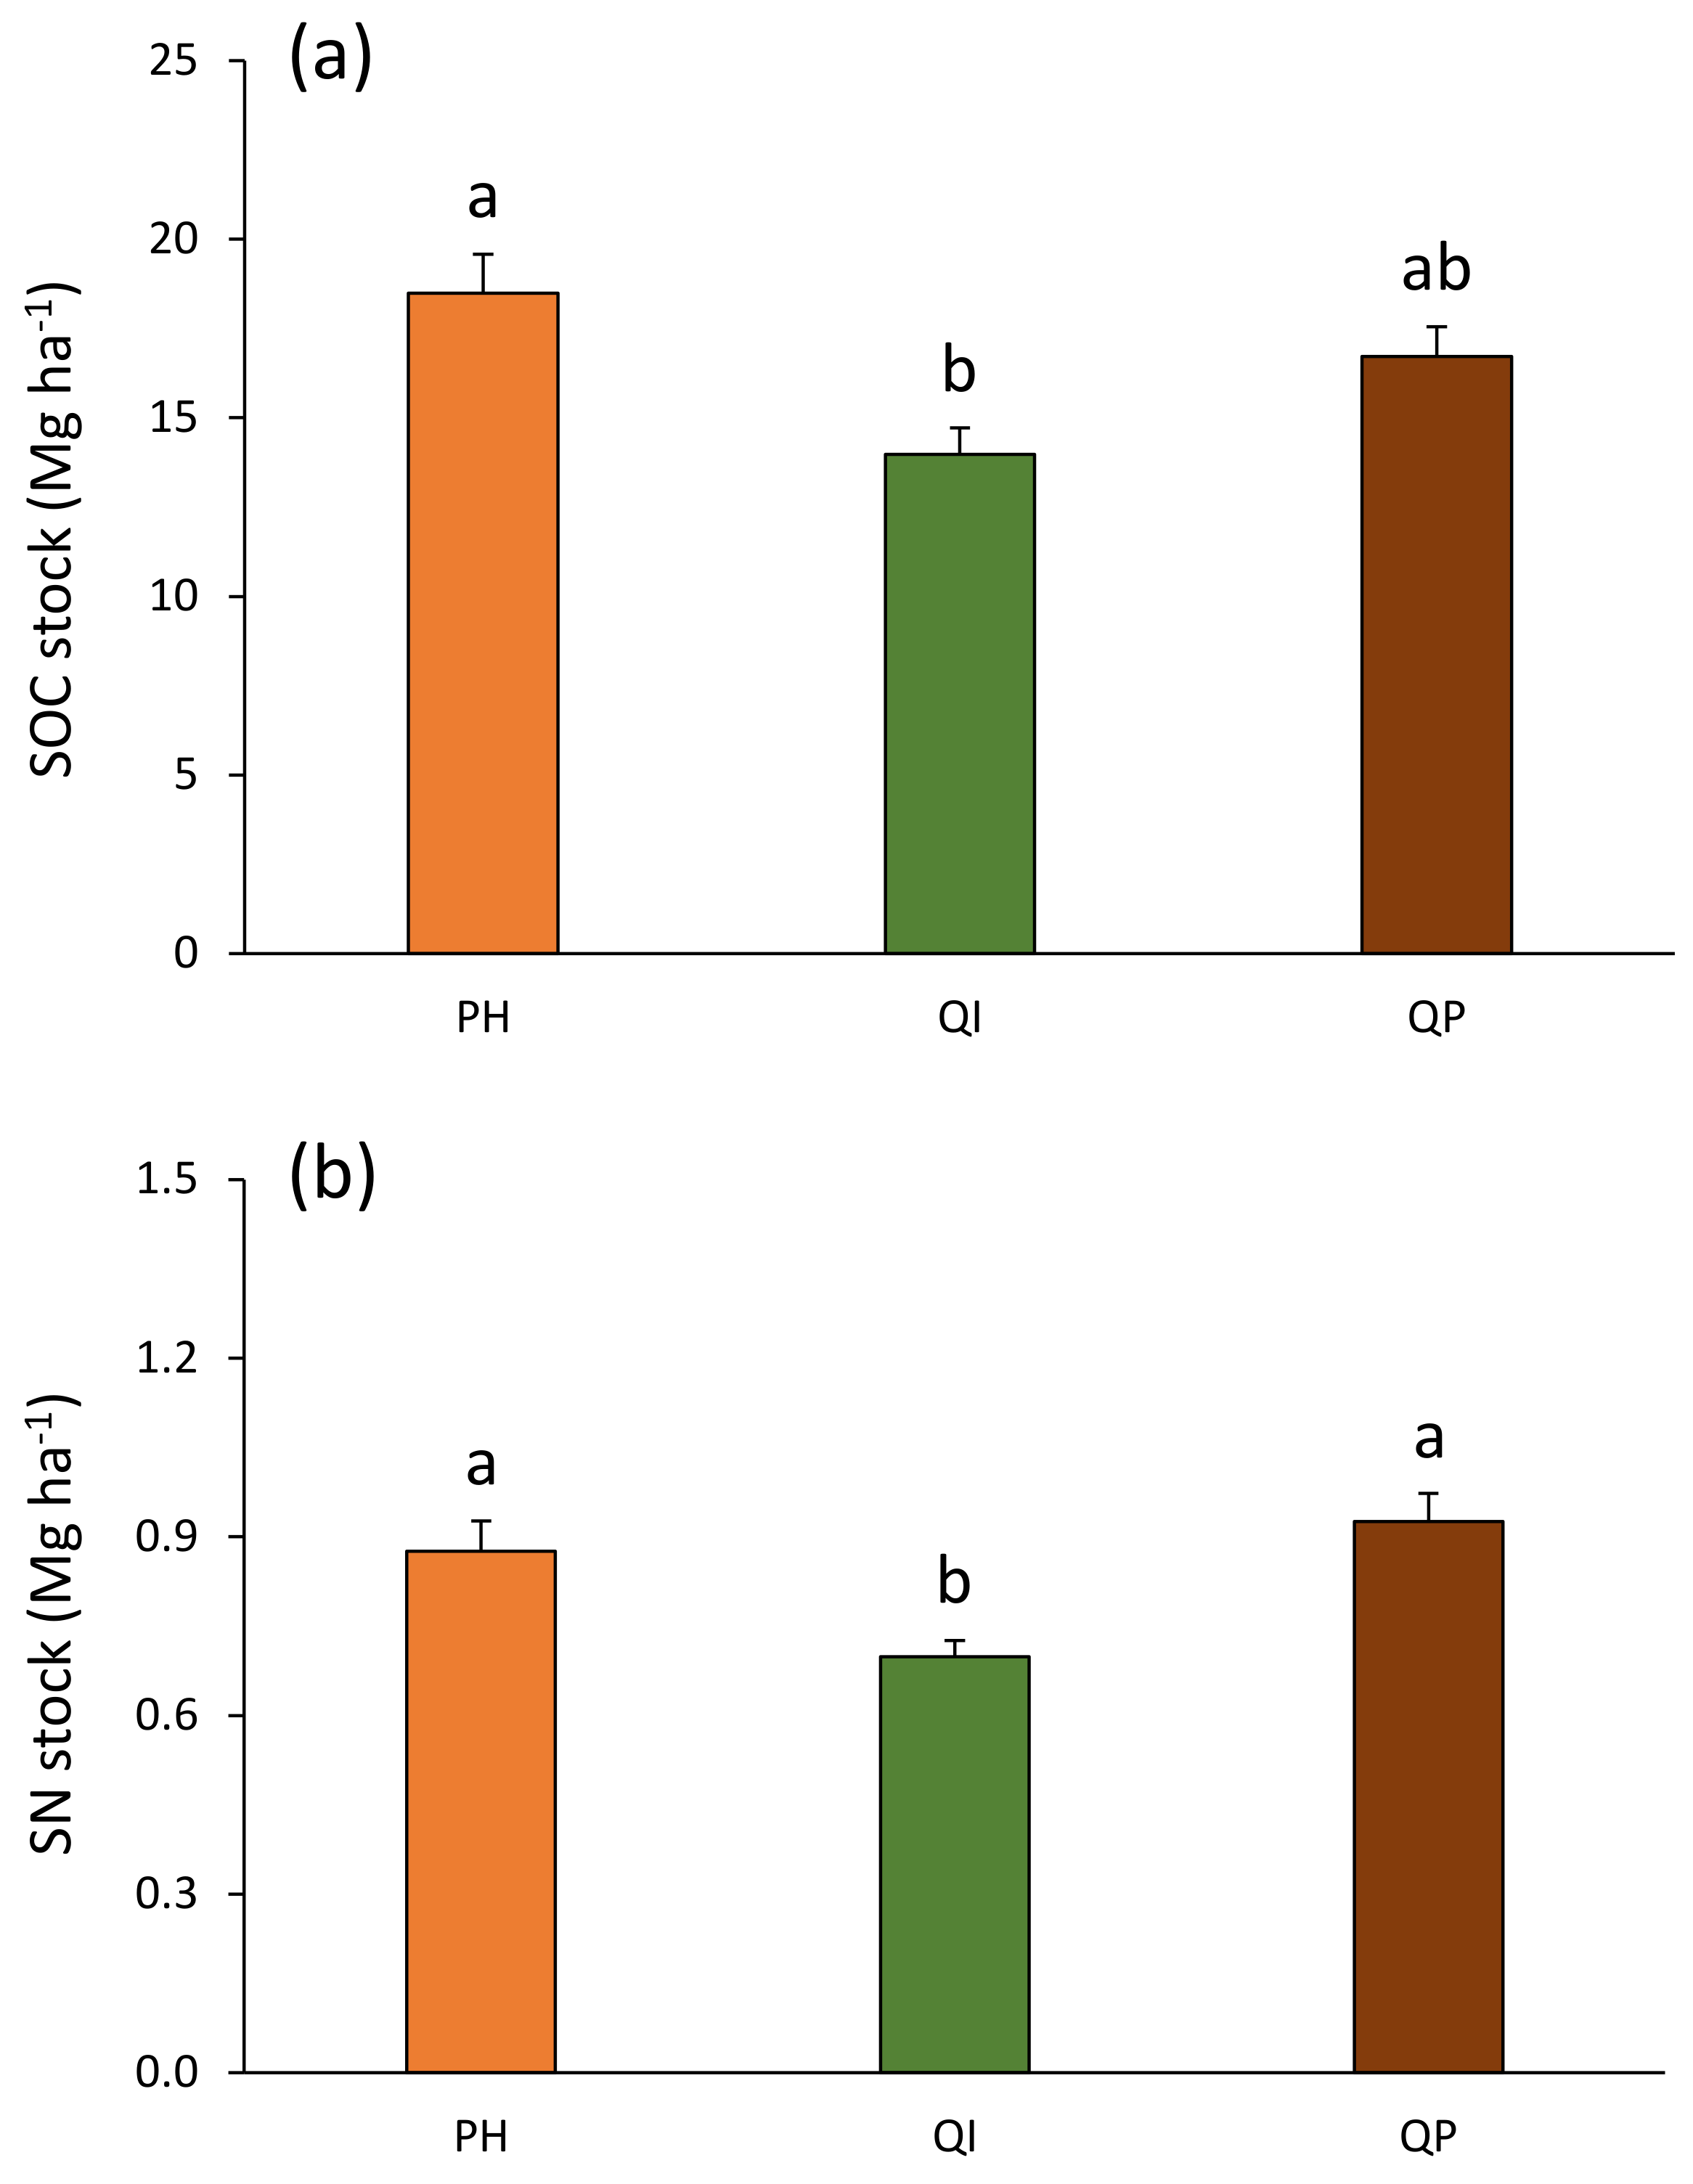
The total SOC stocks ranged from 14.0 Mg ha−1 in the Q. ilex forest to 18.5 Mg ha−1 in the P. halepensis forest (Figure 7a). This total SOC stock was 24% higher in the P. halepensis forest compared with the Q. ilex forest (Table 4; Figure 7a). When pooling both soil layers to estimate these SOC stocks in the first 10 cm soil depth, the precipitation treatment effect previously observed in the P. halepensis forest (Figure 6) disappeared as the forest type × precipitation treatment interaction was non-significant (Table 4). The total SN stocks ranged from 0.70 Mg ha−1 in the Q. ilex forest to 0.93 Mg ha−1 in the Q. pubescens forest (Figure 7b). This total SN stock was 22% lower in the Q. ilex forest compared with the P. halepensis and Q. pubescens forests (Table 4; Figure 7b).

Figure 7.
(a) Soil organic carbon and (b) soil nitrogen stocks according to forest type (Table 2). Data are mean values ± SE and expressed as Mg per ha; n = 30. Different lowercase letters denote significant differences between forest types with a > b (post hoc Tukey tests results). SOC—soil organic carbon, SN—soil nitrogen, PH—Pinus halepensis, QI—Quercus ilex, QP—Quercus pubescens.
Table 4.
Effects of forest type (P. halepensis, Q. ilex and Q. pubescens), precipitation treatment (natural or amplified drought) and their interactions on total SOC and SN stocks within the first 10 cm soil depth. F-values values and associated P-values (** for P < 0.01 and *** for P < 0.001) are indicated. Significant values are indicated in bold.
4. Discussion
We assessed with common methods the litter decomposition efficiency and the soil organic carbon (SOC) and soil nitrogen (SN) stocks up to 10 cm depth in the three dominant Mediterranean forest stands in southern France. After 24 months of the experiment, P. halepensis showed a lower litter decomposition rate compared with the two oak species. The lower litter quality of pine needles compared with oak leaves can explain this difference in decomposition rates [50,51,52,53]. Indeed, P. halepensis needle litter exhibits higher C:N and C:P ratios and lower water-holding capacity (WHC) than Q. ilex and Q. pubescens leaf litters [53]. These three litter traits control the decomposition process [50,51,54,55], as higher high C:N and C:P ratios make the organic matter more recalcitrant to decomposition, while WHC is directly linked to the ability of the litter to keep the humidity necessary for decomposer and detritivore activities. Quercus ilex showed the highest litter decomposition rate after 24 months of the experiment, probably due to the higher N and P concentrations [53] that made the litter more palatable [56,57].
As expected, we observed a negative effect of reduced precipitation on litter decomposition efficiency, but only after 24 months of the experiment. A recent study performed by Pereira et al. [53] reported no significant effect of amplified drought conditions on the litter decomposition process in 2015 in the same AnaEE-France experimental sites as the present study. Pereira et al. [53] explained this lack of effect by the extremely dry year during which their study was performed. Indeed, other studies performed in the same AnaEE-France experimental sites in 2012 and 2013 reported lower Q. pubescens and P. halepensis litter decomposition rates under amplified drought conditions [41,51]. Previous litter decomposition studies conducted in other Mediterranean ecosystems also reported a significant reduction in litter decomposition rates with reduced water availability [58,59,60]. These reduced litter decomposition rates can be explained by the negative effect of a decrease in water availability on soil microbial and faunal abundances and diversities and activities, as soil biodiversity drives the litter decomposition process [41,61,62]. For example, Curiel Yuste et al. [63] and Santonja et al. [41] reported lower soil microbial biomass, Sardans and Peñuelas [64] and Hueso et al. [65] reported a reduction in soil enzyme activities and Santonja et al. [41] and Aupic-Samain et al. [66] reported a lower Collembola abundance under drier climatic conditions in Mediterranean ecosystems.
SOC concentrations measured in the organic and organo–mineral layers were high and typical of Mediterranean forest calcareous soils, where the decomposition of the organic matter is slow compared with temperate forests [67,68,69] and leads to an accumulation of organic carbon in soils [70]. The Pinus halepensis forest showed higher SOC concentrations in the organic layer compared with the two oaks forests. This finding is consistent with the lower litter quality of pine needles compared with oak leaves [50,51,52,53], leading to a slower litter decomposition rate (Figure 3 of the present study) [50,51,71] and consequently to a higher accumulation of organic matter at the soil surface [70]. Regarding the SOC stocks in the three studied forests, our estimations ranging from 14.0 to 18.5 Mg C ha−1 are lower than those previously reported in other Mediterranean forests (from 33.6 to 120.5 Mg C ha−1) [72,73,74,75,76,77]. Our estimations of SOC stocks are also lower than the values reported for other French forests generally developing in deeper soils (from 65.0 to 94.1 Mg C ha−1 considering a 30 cm soil depth) [78,79,80]. In addition to the differences in the protocols used to estimate SOC stocks in the present study compared with the previous ones, two main reasons could explain the strong differences reported: (i) the soils of our three studied Mediterranean forests are extremely shallow (from 10.0 to 13.2 cm depth until bedrock); (ii) they are developed on extremely stony limestone (from 23 to 75% percent surface cover of rocks, Table 1; Figure 8). Stoniness is one of the key variables affecting C stock estimation; however, this soil parameter is rarely measured [81], thus SOC stocks are often overestimated [82].
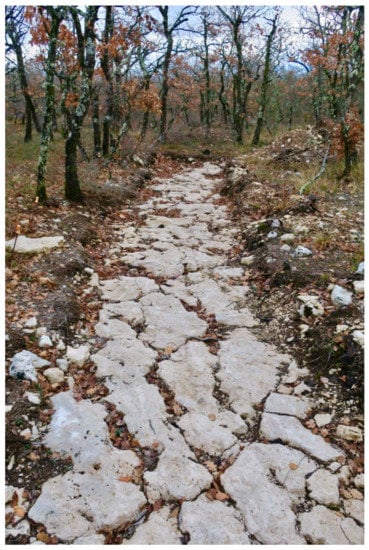
Figure 8.
Trench opened in the Q. pubescens forest highlighting the shallow soil developed directly on limestone slab (credit: T. Gauquelin).
Surprisingly, while we observed lower litter decomposition rates in amplified drought compared with natural drought conditions in the three studied forests, total SOC concentrations and stocks up to 10 cm depth were not affected by a shift in precipitation conditions. However, by distinguishing the organic layer from the organo–mineral layer, we showed that the SOC stock in the organic layer of the P. halepensis forest was affected by a shift in precipitation, with 74% less SOC in amplified drought compared with natural drought conditions. This important finding points out the necessity to distinguish both soil layers to detect the first impact of climate change on SOC stocks. A lower litter decomposition rate under drier conditions cannot explain this strong decrease. We can speculate that a decrease in pine needle litter production is linked to this decrease in SOC stocks, but further investigation will be mandatory to support this statement. Finally, despite a 30% annual experimental precipitation reduction occurring between 4 and 13 years in the Q. ilex and Q. pubescens forests, respectively, and lower leaf litter decomposition rates, SOC concentrations and stocks evaluated are not affected in these two Mediterranean oak forests.
5. Conclusions
For the first time, we performed a quantification of the SOC and SN stocks of the three dominant forest stands of southern France. The SOC stocks were 14.0, 16.7 and 18.5 Mg ha−1 and the SN stocks were 0.70, 0.93 and 0.88 Mg ha−1 in the Q. ilex, Q. pubescens and P. halepensis forests, respectively. The shallowness (from 10.0 to 13.2 cm depth until bedrock) and stoniness (from 23 to 75% percent surface cover of rocks) of these Mediterranean forests could explain the limited SOC and SN stocks. By distinguishing the organic layer from the organo–mineral layer, we showed 74% less SOC in the organic layer of the P. halepensis forest in amplified drought compared with natural drought conditions, while the SOC stocks of the two oak forests were not affected. Further investigation will be necessary to explain why amplified drought affected the pine forest and not the oak forests, which appeared better adapted to future environmental conditions. As French forest cover has been increasing by 0.8% per year since 1985, we can speculate that the Mediterranean forests dominated by Q. ilex and Q. pubescens constitute an important SOC sink for the future.
Supplementary Materials
The following supporting information can be downloaded at: https://www.mdpi.com/article/10.3390/f13091485/s1, Table S1: Soil organic carbon (SOC) and nitrogen (SN) concentrations and stocks according to forest type, soil layer and precipitation condition. Data are mean values ± SE; n = 15. Concentrations are expressed as % per g of DW. Stocks are expressed as Mg per ha. PH = Pinus halepensis, QI = Quercus ilex, QP = Quercus pubescens, O = organic, OM = organo-mineral, ND = natural drought, AD = amplified drought.
Author Contributions
T.G. and V.B. conceived the experiment. S.P., T.G., C.F. and V.B. performed the experiment. S.P., M.S. and T.G. analyzed the data and led the writing of the manuscript with contributions by E.Q., G.S., J.-M.L., J.-M.O., I.M.R., C.F. and V.B. All authors have read and agreed to the published version of the manuscript.
Funding
This project was funded by the Agence Nationale pour la Recherche (ANR) through the project SecPrime2 (ANR-12-BSV7-0016-01). It was a contribution to Labex OT-Med (n°ANR-11-LABX-0061) and has received funding from the Excellence Initiative of Aix-Marseille University—A*MIDEX, a French “Investissements d’Avenir” programme” and the BioDivMeX Mistrals program. Finally, we also thank French Region PACA and European funds for the PhD grant attributed to Susana Pereira. The three experimental sites of O3HP, Font-Blanche and Puéchabon are annually supported by the research infrastructure AnaEE-France (ANR-11-INBS-0001).
Data Availability Statement
The data presented in this study are archived in SEDOO database from BioDivMex Mistrals program (https://mistrals.sedoo.fr/BioDivMex/; accessed on 11 August 2022).
Acknowledgments
We thank Jean-Phillipe Orts and Sylvie Dupouyet for their invaluable help during the field work campaigns.
Conflicts of Interest
The authors declare no conflict of interest.
References
- Friedlingstein, P.; O’Sullivan, M.; Jones, M.W.; Andrew, R.M.; Hauck, J.; Olsen, A.; Peters, G.P.; Peters, W.; Pongratz, J.; Sitch, S.; et al. Global carbon budget 2020. Earth Syst. Sci. Data 2020, 12, 3269–3340. [Google Scholar] [CrossRef]
- Zhang, L.; Luo, Y.; Yu, G.; Zhang, L. Estimated carbon residence times in three forest ecosystems of eastern China: Applications of probabilistic inversion. J. Geophys. Res. Biogeosci. 2010, 115, G1. [Google Scholar] [CrossRef]
- Bloom, A.A.; Exbrayat, J.F.; Van Der Velde, I.R.; Feng, L.; Williams, M. The decadal state of the terrestrial carbon cycle: Global retrievals of terrestrial carbon allocation, pools, and residence times. Proc. Natl. Acad. Sci. USA 2016, 113, 1285–1290. [Google Scholar] [CrossRef] [PubMed]
- Lal, R. Soil carbon sequestration to mitigate climate change. Geoderma 2004, 123, 1–22. [Google Scholar] [CrossRef]
- Lal, R. Forest soils and carbon sequestration. For. Ecol. Manag. 2005, 220, 242–258. [Google Scholar] [CrossRef]
- Poeplau, C.; Don, A.; Schneider, F. Roots are key to increasing the mean residence time of organic carbon entering temperate agricultural soils. Glob. Chang. Biol. 2021, 27, 4921–4934. [Google Scholar] [CrossRef]
- Pan, Y.; Birdsey, R.A.; Fang, J.; Houghton, R.; Kauppi, P.E.; Kurz, W.A.; Phillips, O.L.; Shvidenko, A.; Lewis, S.L.; Canadell, J.G.; et al. A large and persistent carbon sink in the world’s forests. Science 2011, 333, 988–993. [Google Scholar] [CrossRef]
- Keenan, R.J.; Reams, G.A.; Achard, F.; de Freitas, J.V.; Grainger, A.; Lindquist, E. Dynamics of global forest area: Results from the FAO Global Forest Resources Assessment 2015. For. Ecol. Manag. 2015, 352, 9–20. [Google Scholar] [CrossRef]
- Le Quéré, C.; Andrew, R.M.; Friedlingstein, P.; Sitch, S.; Hauck, J.; Pongratz, J.; Pickers, P.A.; Korsbakken, J.I.; Peters, G.P.; Canadell, J.G.; et al. Global carbon budget 2018. Earth Syst. Sci. Data 2018, 10, 2141–2194. [Google Scholar] [CrossRef]
- Berthelin, J.; Laba, M.; Lemaire, G.; Powlson, D.; Tessier, D.; Wander, M.; Baveye, P.C. Soil carbon sequestration for climate change mitigation: Mineralization kinetics of organic inputs as an overlooked limitation. Eur. J. Soil Sci. 2022, 73, e13221. [Google Scholar] [CrossRef]
- FAO. Global Forest Resources Assessment 2020: Main Report; FAO: Rome, Italy, 2020. [Google Scholar] [CrossRef]
- De Vos, B.; Cools, N.; Ilvesniemi, H.; Vesterdal, L.; Vanguelova, E.; Carnicelli, S. Benchmark values for forest soil carbon stocks in Europe: Results from a large scale forest soil survey. Geoderma 2015, 251–252, 33–46. [Google Scholar] [CrossRef]
- Lange, M.; Eisenhauer, N.; Sierra, C.A.; Bessler, H.; Engels, C.; Griffiths, R.; Mellado-Vázquez, P.G.; Malik, A.A.; Roy, J.; Scheu, S.; et al. Plant diversity increases soil microbial activity and soil carbon storage. Nat. Commun. 2015, 6, 6707. [Google Scholar] [CrossRef]
- Pausch, J.; Kuzyakov, Y. Carbon input by roots into the soil: Quantification of rhizodeposition from root to ecosystem scale. Glob. Chang. Biol. 2018, 24, 1–12. [Google Scholar] [CrossRef]
- Huang, J.; Liu, W.; Yang, S.; Yang, L.; Peng, Z.; Deng, M.; Xu, S.; Zhang, B.; Ahirwal, J.; Liu, L. Plant carbon inputs through shoot, root, and mycorrhizal pathways affect soil organic carbon turnover differently. Soil Biol. Biochem. 2021, 160, 108322. [Google Scholar] [CrossRef]
- Liu, T.; Wang, L.; Feng, X.; Zhang, J.; Ma, T.; Wang, X.; Liu, Z. Comparing soil carbon loss through respiration and leaching under extreme precipitation events in arid and semiarid grasslands. Biogeosciences 2018, 15, 1627–1641. [Google Scholar] [CrossRef]
- Jobbágy, E.G.; Jackson, R.B. The vertical distribution of soil organic carbon and its relation to climate and vegetation. Ecol. Appl. 2000, 10, 423–436. [Google Scholar] [CrossRef]
- Zhang, K.; Dang, H.; Zhang, Q.; Cheng, X. Soil carbon dynamics following land-use change varied with temperature and precipitation gradients: Evidence from stable isotopes. Glob. Chang. Biol. 2015, 21, 2762–2772. [Google Scholar] [CrossRef]
- Martin, M.P.; Wattenbach, M.; Smith, P.; Meersmans, J.; Jolivet, C.; Boulonne, L.; Arrouays, D. Spatial distribution of soil organic carbon stocks in France. Biogeosciences 2011, 8, 1053–1065. [Google Scholar] [CrossRef]
- Meersmans, J.; Martin, M.P.; Lacarce, E.; De Baets, S.; Jolivet, C.; Boulonne, L.; Lehmann, S.; Saby, N.; Bispo, A.; Arrouays, D. A high resolution map of French soil organic carbon. Agron. Sustain. Dev. 2012, 32, 841–851. [Google Scholar] [CrossRef]
- Mbow, H.O.P.; Reisinger, A.; Canadell, J.; O’Brien, P. Special Report on Climate Change, Desertification, Land Degradation, Sustainable Land Management, Food Security, and Greenhouse Gas Fluxes in Terrestrial Ecosystems (SR2); IPCC: Geneva, Switzerland, 2017; Volume 650. [Google Scholar]
- Pörtner, H.O.; Roberts, D.C.; Adams, H.; Adler, C.; Aldunce, P.; Ali, E.; Fischlin, A. Climate Change 2022: Impacts, Adaptation and Vulnerability; IPCC Sixth Assessment Report. Available online: https://www.ipcc.ch/report/ar6/wg2/ (accessed on 11 August 2022).
- Liski, J.; Karjalainen, T.; Pussinen, A.; Nabuurs, G.J.; Kauppi, P. Trees as carbon sinks and sources in the European Union. Environ. Sci. Policy 2000, 3, 91–97. [Google Scholar] [CrossRef]
- Liski, J.; Perruchoud, D.; Karjalainen, T. Increasing carbon stocks in the forest soils of western Europe. For. Ecol. Manag. 2002, 169, 159–175. [Google Scholar] [CrossRef]
- Bonan, G.B. Forests and climate change: Forcings, feedbacks, and the climate benefits of forests. Science 2008, 320, 1444–1449. [Google Scholar] [CrossRef] [PubMed]
- Richter, D., Jr.; Houghton, R.A. Gross CO2 fluxes from land-use change: Implications for reducing global emissions and increasing sinks. Carbon Manag. 2011, 2, 41–47. [Google Scholar] [CrossRef]
- Médail, F.; Quézel, P. Biodiversity hotspots in the Mediterranean Basin: Setting global conservation priorities. Conserv. Biol. 1999, 13, 1510–1513. [Google Scholar] [CrossRef]
- Gauquelin, T.; Michon, G.; Joffre, R.; Duponnois, R.; Génin, D.; Fady, B.; Dagher-Kharrat, M.B.; Derridj, A.; Slimani, S.; Badri, W.; et al. Mediterranean forests, land use and climate change: A social-ecological perspective. Reg. Environ. Chang. 2018, 18, 623–636. [Google Scholar] [CrossRef]
- Croitoru, L. How much are Mediterranean forests worth? For. Policy Econ. 2007, 9, 536–545. [Google Scholar] [CrossRef]
- Sardans, J.; Peñuelas, J. Plant-soil interactions in Mediterranean forest and shrublands: Impacts of climatic change. Plant Soil 2013, 365, 1–33. [Google Scholar] [CrossRef]
- Gratani, L.; Varone, L.; Ricotta, C.; Catoni, R. Mediterranean shrublands carbon sequestration: Environmental and economic benefits. Mitig. Adapt. Strateg. Glob. Chang. 2013, 18, 1167–1182. [Google Scholar] [CrossRef]
- Ruiz-Peinado, R.; Oviedo, J.A.B.; Senespleda, E.L.; Oviedo, F.B.; del Río Gaztelurrutia, M. Forest management and carbon sequestration in the Mediterranean region: A review. For. Syst. 2017, 26, 10. [Google Scholar] [CrossRef]
- Duarte-Guardia, S.; Peri, P.L.; Amelung, W.; Sheil, D.; Laffan, S.W.; Borchard, N.; Bird, M.I.; Dieleman, W.; Pepper, D.A.; Zutta, B.; et al. Better estimates of soil carbon from geographical data: A revised global approach. Mitig. Adapt. Strateg. Glob. Chang. 2019, 24, 355–372. [Google Scholar] [CrossRef]
- M’Hirit, O. Mediterranean forests: Ecological space and economic and community wealth. Unasylva 1999, 50, 3–15. [Google Scholar]
- Schroeter, D.; Cramer, W.; Leemans, R.; Prentice, I.C.; Araújo, M.B.; Arnell, N.W.; Bondeau, A.; Bugmann, H.; Carter, T.R.; Gracia, C.A.; et al. Ecosystem service supply and vulnerability to global change in Europe. Science 2005, 310, 1333–1337. [Google Scholar] [CrossRef]
- Giorgi, F.; Lionello, P. Climate change projections for the Mediterranean region. Glob. Planet. Chang. 2008, 63, 90–104. [Google Scholar] [CrossRef]
- Polade, S.D.; Pierce, D.W.; Cayan, D.R.; Gershunov, A.; Dettinger, M.D. The key role of dry days in changing regional climate and precipitation regimes. Sci. Rep. 2014, 4, 4364. [Google Scholar] [CrossRef]
- Tuel, A.; Eltahir, E.A. Why is the Mediterranean a climate change hot spot? J. Clim. 2020, 33, 5829–5843. [Google Scholar] [CrossRef]
- Tsiafouli, M.A.; Kallimanis, A.S.; Katana, E.; Stamou, G.P.; Sgardelis, S.P. Responses of soil microarthropods to experimental short-term manipulations of soil moisture. Appl. Soil Ecol. 2005, 29, 17–26. [Google Scholar] [CrossRef]
- García-Palacios, P.; Maestre, F.T.; Kattge, J.; Wall, D.H. Climate and litter quality differently modulate the effects of soil fauna on litter decomposition across biomes. Ecol. Lett. 2013, 16, 1045–1053. [Google Scholar] [CrossRef]
- Santonja, M.; Fernandez, C.; Proffit, M.; Gers, C.; Gauquelin, T.; Reiter, I.M.; Cramer, W.; Baldy, V. Plant litter mixture partly mitigates the negative effects of extended drought on soil biota and litter decomposition in a Mediterranean oak forest. J. Ecol. 2017, 105, 801–815. [Google Scholar] [CrossRef]
- Evolution of the French forest surface area since 1985. Available online: https://inventaire-forestier.ign.fr/spip.php?article875 (accessed on 11 August 2022).
- IGN. Résultats D’inventaire Forestier: Les Résultats des Campagnes D’inventaire 2009 à 2013 en Méditerranée. 2013. Available online: https://inventaire-forestier.ign.fr/IMG/pdf/RES-GRECO-2013/RS_0913_GRECO_J.pdf (accessed on 11 August 2022).
- Moron-Rios, A.; Rodriguez, M.A.; Perez-Camacho, L.; Rebollo, S. Effects of seasonal grazing and precipitation regime on the soil macroinvertebrates of a Mediterranean old-field. Eur. J. Soil Biol. 2010, 46, 91–96. [Google Scholar] [CrossRef]
- Kardol, P.; Reynolds, W.N.; Norby, R.J.; Classen, A.T. Climate change effects on soil microarthropod abundance and community structure. Appl. Soil Ecol. 2011, 47, 37–44. [Google Scholar] [CrossRef]
- Aupic-Samain, A.; Baldy, V.; Delcourt, N.; Krogh, P.H.; Gauquelin, T.; Fernandez, C.; Santonja, M. Water availability rather than temperature control soil fauna community structure and prey-predator interactions. Funct. Ecol. 2021, 35, 1550–1559. [Google Scholar] [CrossRef]
- Swift, M.J.; Heal, O.W.; Anderson, J.M. Decomposition in Terrestrial Ecosystems; University of California Press: Berkeley, CA, USA, 1979. [Google Scholar]
- IUSS Working Group WRB. World Reference Base for Soil Resources 2006; World Soil Resources Reports; FAO: Rome, Italy, 2006; No. 103. [Google Scholar]
- Wang, X.; Wang, J.; Zhang, J. Comparisons of three methods for organic and inorganic carbon in calcareous soils of northwestern China. PLoS ONE 2012, 7, e44334. [Google Scholar] [CrossRef]
- Santonja, M.; Baldy, V.; Fernandez, C.; Balesdent, J.; Gauquelin, T. Potential shift in plant communities with climate change: Outcome on litter decomposition and nutrient release in a Mediterranean oak forest. Ecosystems 2015, 18, 1253–1268. [Google Scholar] [CrossRef]
- Santonja, M.; Fernandez, C.; Gauquelin, T.; Baldy, V. Climate change effects on litter decomposition: Intensive drought leads to a strong decrease of litter mixture interactions. Plant Soil 2015, 393, 69–82. [Google Scholar] [CrossRef]
- Aupic-Samain, A.; Baldy, V.; Lecareux, C.; Fernandez, C.; Santonja, M. Tree litter identity and predator density control prey and predator demographic parameters in a Mediterranean litter-based multi-trophic system. Pedobiologia 2019, 73, 1–9. [Google Scholar] [CrossRef]
- Pereira, S.; Burešová, A.; Kopecky, J.; Mádrová, P.; Aupic-Samain, A.; Fernandez, C.; Baldy, V.; Sagova-Mareckova, M. Litter traits and rainfall reduction alter microbial litter decomposers: The evidence from three Mediterranean forests. FEMS Microbiol. Ecol. 2019, 95, fiz168. [Google Scholar] [CrossRef]
- Hättenschwiler, S.; Coq, S.; Barantal, S.; Handa, I.T. Leaf traits and decomposition in tropical rainforests: Revisiting some commonly held views and towards a new hypothesis. New Phytol. 2011, 189, 950–965. [Google Scholar] [CrossRef]
- Makkonen, M.; Berg, M.P.; van Logtestijn, R.S.P.; van Hal, J.R.; Aerts, R. Do physical plant litter traits explain non-additivity in litter mixtures? A test of the improved microenvironmental conditions theory. Oikos 2013, 122, 987–997. [Google Scholar] [CrossRef]
- Garcia-Palacios, P.; McKie, B.G.; Handa, I.T.; Frainer, A.; Hättenschwiler, S. The importance of litter traits and decomposers for litter decomposition: A comparison of aquatic and terrestrial ecosystems within and across biomes. Funct. Ecol. 2016, 30, 819–829. [Google Scholar] [CrossRef]
- Santonja, M.; Pellan, L.; Piscart, C. Macroinvertebrate identity mediates the effects of litter quality and microbial conditioning on leaf litter recycling in temperate streams. Ecol. Evol. 2018, 8, 2542–2553. [Google Scholar] [CrossRef] [PubMed] [Green Version]
- Martin, A.; Gallardo, J.F.; Santa Regina, I. Long-term decomposition process of leaf litter from Quercus pyrenaica forests across a rainfall gradient (Spanish central system). Ann. For. Sci. 1997, 54, 191–202. [Google Scholar] [CrossRef]
- Saura-Mas, S.; Estiarte, M.; Peñuelas, J.; Lloret, F. Effects of climate change on leaf litter decomposition across post-fire plant regenerative groups. Environ. Exp. Bot. 2012, 77, 274–282. [Google Scholar] [CrossRef]
- Almagro, M.; Maestre, F.T.; Martínez-López, J.; Valencia, E.; Rey, A. Climate change may reduce litter decomposition while enhancing the contribution of photodegradation in dry perennial Mediterranean grasslands. Soil Biol. Biochem. 2015, 90, 214–223. [Google Scholar] [CrossRef]
- Hättenschwiler, S.; Tiunov, A.V.; Scheu, S. Biodiversity and litter decomposition in terrestrial ecosystems. Annu. Rev. Ecol. Evol. Syst. 2005, 36, 191–218. [Google Scholar] [CrossRef]
- Gessner, M.O.; Swan, C.M.; Dang, C.K.; McKie, B.G.; Bardgett, R.D.; Wall, D.H.; Hättenschwiler, S. Diversity meets decomposition. Trends Ecol. Evol. 2010, 25, 372–380. [Google Scholar] [CrossRef]
- Curiel Yuste, J.C.; Peñuelas, J.; Estiarte, M.; Garcia-Mas, J.; Mattana, S.; Ogaya, R.; Pujol, M.; Sardans, J. Drought-resistant fungi control soil organic matter decomposition and its response to temperature. Glob. Change Biol. 2011, 17, 1475–1486. [Google Scholar] [CrossRef]
- Sardans, J.; Peñuelas, J. Drought decreases soil enzyme activity in a Mediterranean holm oak forest. Soil Biol. Biochem. 2005, 37, 455–461. [Google Scholar] [CrossRef]
- Hueso, S.; Hernandez, T.; Garcia, C. Resistance and resilence of the soil microbial biomass to severe drought in semiarid soils: The importance of organic amendments. Appl. Soil Ecol. 2011, 50, 27–36. [Google Scholar] [CrossRef]
- Aupic-Samain, A.; Santonja, M.; Chomel, M.; Pereira, S.; Quer, E.; Lecareux, C.; Limousin, J.M.; Ourcival, J.M.; Simioni, G.; Gauquelin, T.; et al. Soil biota response to experimental rainfall reduction depends on the dominant tree species in mature Northern Mediterranean forests. Soil Biol. Biochem. 2021, 154, 108122. [Google Scholar] [CrossRef]
- Makkonen, M.; Berg, M.P.; Handa, I.T.; Hättenschwiler, S.; van Ruijven, J.; van Bodegom, P.M.; Aerts, R. Highly consistent effects of plant litter identity and functional traits on decomposition across a gradient. Ecol. Lett. 2012, 15, 1033–1041. [Google Scholar] [CrossRef]
- Djukic, I.; Kepfer-Rojas, S.; Schmidt, I.K.; Larsen, K.S.; Beier, C.; Berg, B.; Verheyen, K.; Caliman, A.; Paquette, A.; Gutiérrez-Girón, A.; et al. Early stage litter decomposition across biomes. Sci. Total Environ. 2018, 628, 1369–1394. [Google Scholar] [CrossRef]
- Zhou, S.; Butenschoen, O.; Barantal, S.; Handa, I.T.; Makkonen, M.; Vos, V.; Aerts, R.; Berg, M.P.; McKie, B.; Van Ruijven, J.; et al. Decomposition of leaf litter mixtures across biomes: The role of litter identity, diversity and soil fauna. J. Ecol. 2020, 108, 2283–2297. [Google Scholar] [CrossRef]
- Baritz, R.; Seufert, G.; Montanarella, L.; Van Ranst, E. Carbon concentrations and stocks in forest soils of Europe. For. Ecol. Manag. 2010, 260, 262–277. [Google Scholar] [CrossRef]
- Chomel, M.; Fernandez, C.; Bousquet-Mélou, A.; Gers, C.; Monnier, Y.; Santonja, M.; Gauquelin, T.; Gros, R.; Lecareux, C.; Baldy, V. Secondary metabolites of Pinus halepensis alter decomposer organisms and litter decomposition during afforestation of abandoned agricultural zones. J. Ecol. 2014, 102, 411–424. [Google Scholar] [CrossRef]
- Muñoz Rojas, M.; Jordán, A.; Martínez Zavala, L.; Rosa, D.D.L.; Abd-Elmabod, S.K.; Anaya Romero, M. Organic carbon stocks in Mediterranean soil types under different land uses (Southern Spain). Solid Earth 2012, 3, 375–386. [Google Scholar] [CrossRef]
- Oubrahim, H.; Boulmane, M.; Bakker, M.R.; Augusto, L.; Halim, M. Carbon storage in degraded cork oak (Quercus suber) forests on flat lowlands in Morocco. Iforest-Biogeosci. For. 2015, 9, 125. [Google Scholar] [CrossRef]
- Brahim, N.; Ibrahim, H.; Hatira, A. Tunisian Soil Organic Carbon Stock-Spatial and Vertical Variation. Procedia Eng. 2014, 69, 1549–1555. [Google Scholar] [CrossRef]
- Ruiz-Peinado, R.; Bravo-Oviedo, A.; López-Senespleda, E.; Montero, G.; Río, M. Do thinnings influence biomass and soil carbon stocks in Mediterranean maritime pinewoods? Eur. J. For. Res. 2013, 132, 253–262. [Google Scholar] [CrossRef]
- Parras-Alcántara, L.; Lozano-García, B.; Brevik, E.C.; Cerdá, A. Soil organic carbon stocks assessment in Mediterranean natural areas: A comparison of entire soil profiles and soil control sections. J. Environ. Manag. 2015, 155, 219–228. [Google Scholar] [CrossRef]
- Sferlazza, S.; Maetzke, F.G.; Iovino, M.; Baiamonte, G.; Palmeri, V.; La Mela Veca, D.S. Effects of traditional forest management on carbon storage in a Mediterranean holm oak (Quercus ilex L.) coppice. Iforest-Biogeosci. For. 2018, 11, 344–351. [Google Scholar] [CrossRef] [Green Version]
- Dupouey, J.; Pignard, G.; Badeau, V.; Thimonier, A.; Dhôte, J.; Nepveu, G.; Bergès, L.; Augusto, L.; Belkacem, S.; Nys, C. Stocks et flux de carbone dans les forêts françaises. Comptes Rendus L’académie D’agriculture Fr. 1999, 85, 293–310. [Google Scholar] [CrossRef]
- Arrouays, D.; Deslais, W.; Badeau, V. The carbon content of topsoil and its geographical distribution in France. Soil Use Manag. 2001, 17, 7–11. [Google Scholar] [CrossRef]
- Vallet, P.; Meredieu, C.; Seynave, I.; Belouard, T.; Dhôte, J.F. Species substitution for carbon storage: Sessile oak versus Corsican pine in France as a case study. For. Ecol. Manag. 2009, 257, 1314–1323. [Google Scholar] [CrossRef]
- Román-Sánchez, A.; Vanwalleghem, T.; Peña, A.; Laguna, A.; Giráldez, J.V. Controls on soil carbon storage from topography and vegetation in a rocky, semi-arid landscapes. Geoderma 2018, 311, 159–166. [Google Scholar] [CrossRef]
- Poeplau, C.; Vos, C.; Don, A. Soil organic carbon stocks are systematically overestimated by misuse of the parameters bulk density and rock fragment content. Soil 2017, 3, 61–66. [Google Scholar] [CrossRef] [Green Version]


Publisher’s Note: MDPI stays neutral with regard to jurisdictional claims in published maps and institutional affiliations. |
© 2022 by the authors. Licensee MDPI, Basel, Switzerland. This article is an open access article distributed under the terms and conditions of the Creative Commons Attribution (CC BY) license (https://creativecommons.org/licenses/by/4.0/).