Article

Knowledge about Plant Coexistence during Vegetation Succession for Forest Management on the Loess Plateau, China

1
The Research Center of Soil and Water Conservation and Ecological Environment, Chinese Academy of Sciences and Ministry of Education, Xianyang 712100, China
2
Institute of Soil and Water Conservation, Chinese Academy of Sciences and Ministry of Water Resources, Xianyang 712100, China
3
University of Chinese Academy of Sciences, Beijing 100049, China
4
Institute of Soil and Water Conservation, Northwest A & F University, Xianyang 712100, China
*
Author to whom correspondence should be addressed.
Forests 2022, 13(9), 1456; https://doi.org/10.3390/f13091456
Submission received: 12 August 2022 / Revised: 8 September 2022 / Accepted: 8 September 2022 / Published: 10 September 2022
(This article belongs to the Topic Nature-Based Solutions)

Abstract

:
Coexistence between species within plant communities is a key issue in the practice of revegetation, forest management, and biodiversity conservation. Vegetation restoration is critical to control soil erosion and improve the ecological environment on the Loess Plateau. Here, we investigate the interspecific relationships of dominant plants during natural vegetation succession on the Loess Plateau. The results suggest that, under the ecological process of environmental filtering, species within communities can reduce interspecific competition and promote species coexistence via spatial heterogeneity and temporal asynchronous differences. The ecological niche overlap index (Oik) significantly and positively correlated with the strength of interspecific associations. Most species pairs had weak competition and more stable interspecific relationships. The results of the χ2 test showed that 317 species pairs were positively associated and 118 were negatively associated. The community is in a positive succession process, and the interaction relationship between species tends to be neutral. We should enhance the protection of positively associated species and pay attention to negatively associated species during forest management. Results revealed that Carex lanceolata Boott and Lespedeza bicolor Turcz coexisted easily with other species for mutual benefit, which could help build artificial forestland of native species to improve the ecological function.

1. Introduction

Coexistence between species has long been a central question in community ecology research [1,2]. Investigating coexistence relationships can objectively reflect species distribution in a community and the degree of species adaptation to the environment, reveal community structure, type, and plant substitution mechanisms, and predict population extinction [3,4,5]. Modern coexistence theory suggests that the causes of species coexistence in communities depend on the balance of niche overlap and competitive asymmetry [6]. Therefore, such interspecific relationships are often quantified by species’ ecological niches and interspecific association characteristics [7]. Ecological niches are the sum of all resources available to various organisms in a community and their functional relationships with related populations, describing the role played by organisms in the community [8]. Under the pressure of ecological processes, species change their characteristics through trait evolution, and this may lead to changes in species interactions and their “ecological niche” in the community. This affects species coexistence and changes in community stability [9]. Interspecific associations represent the interconnectedness of the spatial distribution of different species, reflecting the differences in adaptation to different habitats among species in the community [10]. Analysis of interspecific relationships can provide insight into the competitive exclusionary effects between species. In general, positive interspecific correlations indicate similarity in resource use by species; negative correlations indicate disadvantages for one or both parties, such as interspecific competition and disturbance [11]. This is essential to reveal the formation and evolution of communities [12]. Ultimately, this may help us control interspecies relationships and maintain the stability of ecosystem biodiversity [13,14].
The Loess Plateau of China is a global hotspot of land degradation with a fragile ecological environment and extremely serious soil erosion [15,16]. To change this situation, the Chinese government implemented the Grain for Green (GFG) Project in 1999, in which artificial planting was the main practice [17]. Nowadays, the GFG project area has reached 3.33 × 10⁵ km2, and the vegetation cover of the Loess Plateau has increased from about 49% in 1998 to 63% in 2018 [18,19]. The ecological environment has been greatly improved. Soil erosion decreased to 595 t/km2/year during 2011–2015, and the amount of sediment entering the sea from the Loess Plateau between 2005–2015 was only 8.9% of that in the 1950s [20,21]. Vegetation restoration is regarded as a fundamental measure to combat soil erosion [22]. However, in the processes, irrational plantation and monoculture planting presented negative impacts, such as vegetation degradation, soil dryness, groundwater drought, and more than a 50% reduction in runoff, posing a serious challenge to the sustainability of vegetation growth and the stability of ecological functions [23,24,25,26,27]. Thus, it is important to figure out how native species can live together and work together, because mixed forests of native species can make a region more resistant to drought, help plants survive, and keep ecosystem functions stable [28,29].
Ziwuling is located in the Loess Plateau’s hinterland after a 150-year natural restoration period, making it an ideal site for researching the Loess Plateau’s vegetation succession law [30,31,32]. Vegetation succession refers to the process by which a plant community evolves when one type of vegetation is replaced by another, and qualitative changes occur [33,34]. It is demonstrated through the interdependence and competition of coexisting species within the community, as well as through the interaction and influence of habitats [12]. This provides an excellent natural template to reveal plant coexistence relationships; however, reports related to the coexistence of species in the local area are rare. The research objectives of this study were to (1) identify the dominant species of herbs and woody plants in the process; (2) analyze the ecological niche and interspecific association characteristics of dominant species; (3) determine reliable species coexistence relationships and mechanisms through holistic analysis. Answers to these questions might help build local plantation forests, protect biodiversity, manage forests, conservation of rare species, the control of biological invasions, the forecasting of climate change impacts, and improve the ecosystem [14].

2. Materials and Methods
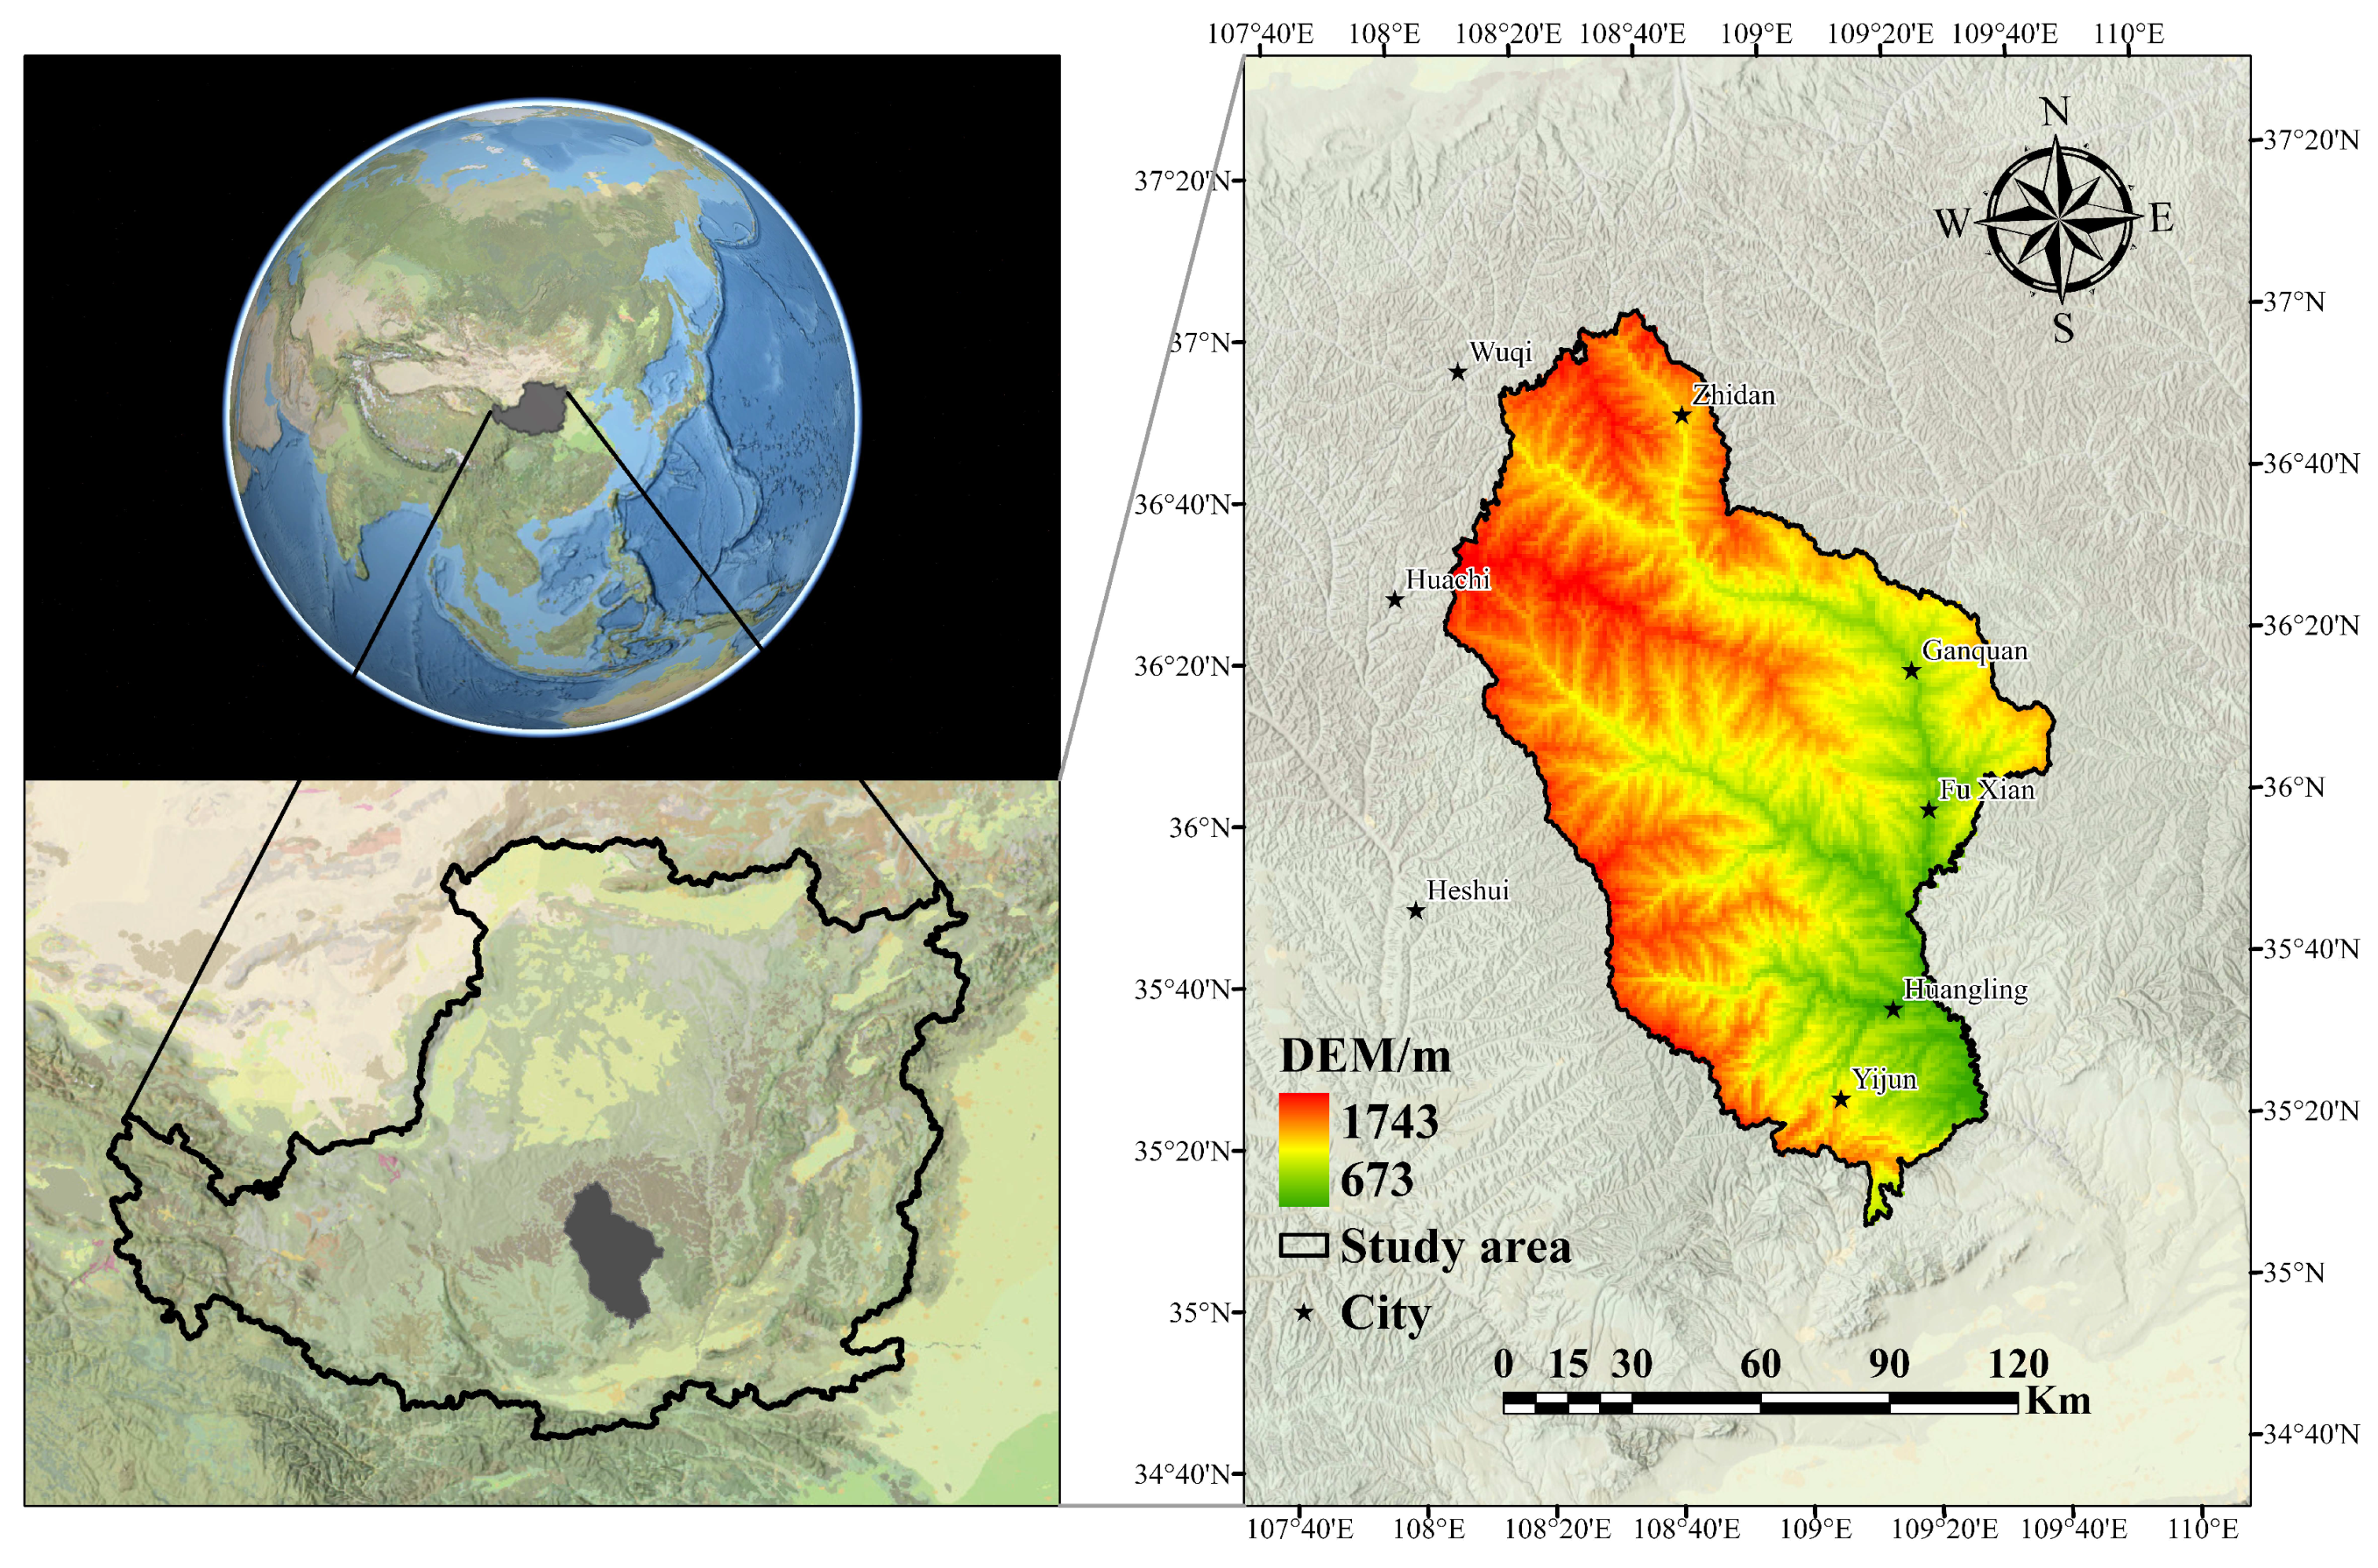
2.1. Study Area

Ziwuling Nature Reserve is located in the temperate zone of the Loess Plateau, China (34°50′–36°50′ N, 107°30′–109°40′ E) (Figure 1). The study area is approximately 200 km long from north to south and 95 km wide from east to west, covering a total area of approximately 3.79 × 10⁴ km2. Its altitude range is 553–1856 m above sea level, with a relative height difference of 400 m. It has an East Asian monsoon climate with an average annual precipitation of 588 mm, which is unevenly distributed throughout the year, and 70% of precipitation occurs from July to September. The average annual temperature of the area is 7.4–8.5 °C, with a minimum recorded temperature of −27.7 °C and a maximum recorded temperature of 36.7 °C [35]. The soil layer in the mountains is shallow, bedrock is exposed in some areas, and zonal soil is grayish brown with a pH value of 7.5–8.2. The soil is primary or secondary loess, loose and easy to wet, and sinks because of its poor erosion resistance [36]. The ground zone vegetation is a warm temperate deciduous broad-leaved forest with Quercus mongolica Fisch. Ex Ledeb as the dominant species and a temperate coniferous forest with Pinus tabuliformis Carrière as the dominant species [37].

2.2. Experimental Design and Investigation

Since 1899, ecologists have commonly used a “space-for-time” substitution method for vegetative succession studies to predict vegetation chronosequence change [38,39]. This study adopted a “space for time” approach to select 48 sites. Then, based on the results of the relevant forestry department and a comprehensive analysis based on related reports by Zou et al. [35], Fan et al. [36], Deng et al. [40], Zhao et al. [41], and Liu et al. [42], standard sample plots of typical vegetation types in eight different restoration periods, with six sites for each period, were set up from 2020 to 2021 with essentially identical environmental conditions and similar soil texture. Standard sample plots of 20 × 20 m (trees), 10 × 10 m (shrubs), and 1 × 1 m (grasses) were established, and the names and numbers of species occurring in each sample plot were recorded. The Latin names of the species were cross-checked using The Plant List (http://www.theplantlist.org, accessed on: 20 December 2021) with reference to the Flora of China [43]. A total of 128 species of seed plants, 79 herbs, and 49 woody species were found during this process. The specific information is shown in Table 1.

2.3. Statistical Analyses

Competition theory suggests that interspecific associations can change depending on external conditions and that different environments may exhibit different associations [44]. To ensure the reliability of the results, this research combined data from eight major successional stages during 150 years of natural vegetation restoration for the overall analysis.

2.3.1. Species Selection

The plants identified in the vegetation survey were classified as herbaceous or woody plants. The top 15 plants of each category were ranked according to importance value (IV) and identified as the dominant plants [45].
I V = ( a i i = 1 S a i + f i i = 1 S f i ) 2
where ai is the number of individuals in population i, fi is the number of quadrats in which the population i appears, and S is the total number of species.

2.3.2. Ecological Niche Features

To calculate ecological niche breadth (Bi), the weighted modified Levins index method described by Colwell and Futuyma [46] was used
B i = 1 r j = 1 r P i j 2
where Pij is the ratio of the number of individuals of species i at resource site j to the total number of individuals of species i at all resource sites; r is the total number of sample squares, and each sample square represents one resource site.
To determine the ecological niche overlap index (Oik), the Pianka index was used [47]
O i k = j = 1 N ( P i j · P k j ) j = 1 N P i j 2 · j = 1 N P k j 2
where Oik is the ecological niche overlap value of species i and species k, where Pij and Pkj are the importance value shares of species i and species k, respectively, in resource niche j, and the value range is [0, 1]; the larger the value, the higher the ecological niche overlap degree.

2.3.3. Overall Association

The variance ratio method (VR) was used, and the statistic W was calculated to test the significance level of the overall association [48]
V R = s T 2 δ T 2 = 1 N j = 1 N ( T j t ) 2 l = 1 S P i ( 1 P i ) .
W = V R × N
where Pi is the frequency of species i, N is the total number of samples, S is the total number of species, Ti is the total number of species occurring in sample j, and t is the average number of species in the sample. When VR > 1, the overall species are positively associated, and when VR < 1, the overall species are negatively associated. The interspecific association is significant if χ2(0.95, N) < W < χ2(0.05, N); otherwise, the association is not significant.

2.3.4. Interspecific Association

Based on a 2 × 2 column table [49], the χ2 statistic was used for qualitative analysis. The continuous correction factor of Yates was used to correct for the sampling discontinuities, which can cause biased underestimation, with the formula [50]
χ 2 = N [ | a d b c | 0.5 N ] 2 ( a + b ) ( a + c ) ( c + d ) ( b + d )
V = [ ( a + d ) ( b + c ) ] a + b + c + d
where a indicates the number of samples in which both species occur, b indicates the number of samples in which species B occurs, but species A does not, c indicates the number of samples in which species A occurs but species B does not, and d indicates the number of samples in which neither species occurs. Generally, interspecific associations were considered highly significant when χ2 > 6.635, i.e., p < 0.01; significant when 3.841 ≤ χ2 < 6.635, i.e., 0.01 < p < 0.05; and insignificant when χ2 < 3.841, i.e., p > 0.05. The indicator of V was constructed to show the interspecific association. V < 0 indicated negative associations, and V > 0 indicated positive associations [51].

2.3.5. Strength of Associations

The χ2 statistic can only qualitatively describe whether the association between species is significant, but it cannot determine the strength of interspecific associations. Therefore, the association coefficient (AC) and percentage co-occurrence (PC) are commonly used to express the strength of association [52]. PC is more accurate than AC for reflecting the positive association strength and avoiding the effects of high AC due to high d values or low AC due to low a values. Therefore, PC and AC are usually analyzed together to improve the accuracy of the results.
The AC calculation formula is as follows
A C = a d b c ( a + b ) ( b + d ) ( a d     b c )
A C = a d b c ( a + b ) ( a + c ) ( a d < b c , d     a )
A C = a d b c ( b + d ) ( d + c ) ( a d < b c , d < a )
The value of AC is in the range of [−1, 1]: the closer AC is to 1, the stronger the positive association of interspecific association; the closer AC is to −1, the stronger the negative association of interspecific association; when AC = 0, each species is completely independent.
The PC calculation formula is as follows
P C = a a + b + c
The PC value is [0, 1]. The closer the PC value is to 1, the stronger the degree of interspecies association, and a PC value of 0 indicates that interspecies association does not exist.
This research used Excel 2019 for data preparation (Microsoft Corp., Redmond, WA, USA) and R 4.0.4 (R Foundation for Statistical Computing, Vienna, Austria; program packagesspaa and corrplot) for statistical analysis [53,54]. Mapping was done by ArcGIS 10.5 (Esri, Redlands, CA, USA) and Origin 2021b (OriginLab, Northampton, MA, USA).

3. Results and Analysis

3.1. Importance Values and Ecological Niche Breadth of Dominant Plants
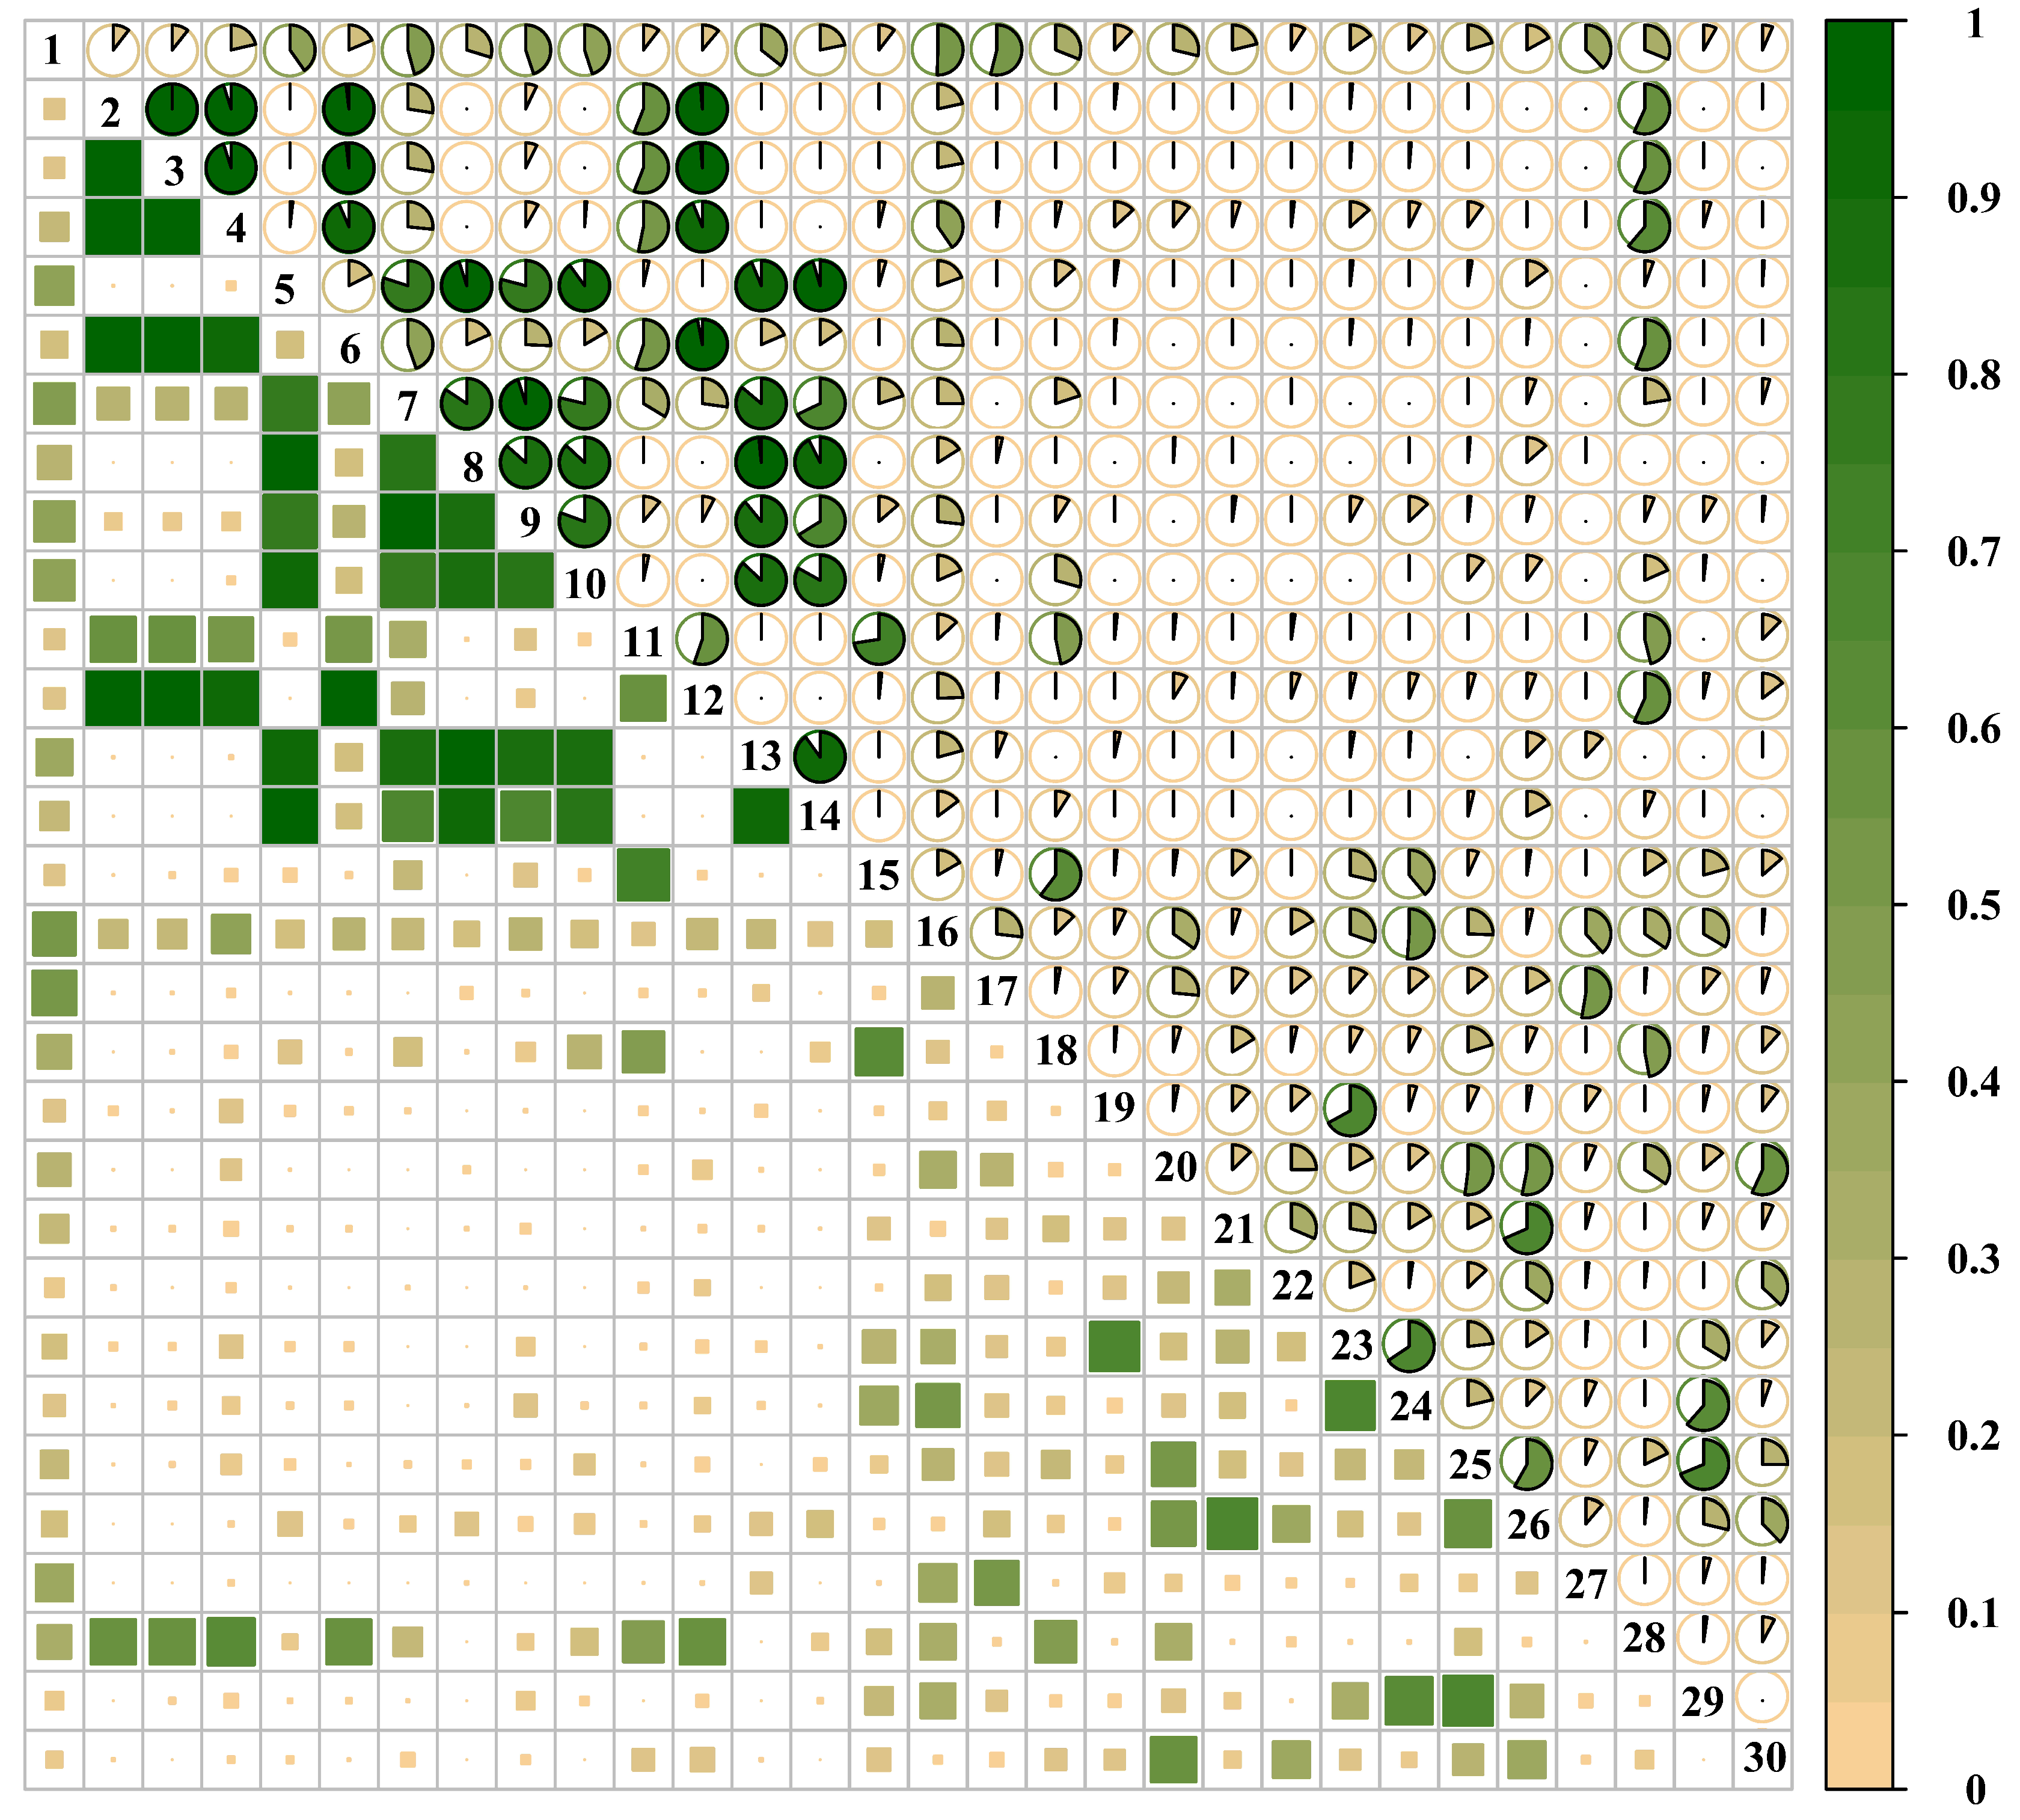
A total of 128 species in 99 genera and 39 families of seed plants, 79 species of herbaceous plants, and 49 species of woody plants were identified during the vegetation succession in our survey. The sum of the importance values of the top 15 herbaceous species accounted for 65.85% of all herbaceous plants, and the sum of the importance values of the top 15 woody species accounted for 79.56% of all woody plants (Table 2). Therefore, these 30 species were suitable as the main plants for researching species interrelationships in this process. The ecological niche breadth ranged from [1.07, 12.8] for herbaceous plants to [1.43, 9.42] for woody plants. Among herbaceous plants, C. lanceolata had the highest importance value at 14.43%, while among the woody plants, L. bicolor had the highest importance value at 20.98%. These two plants also had the largest ecological niche breadth values (Table 1). The order of the dominant species importance values and the sizes of their ecological niches were not always the same.

3.2. Niche Overlap

The Oik ranged from 0 to 0.9996. In general, 56 pairs (12.87% of the total) had Oik ≥ 0.5, and these pairs were subject to intense competition when environmental resources were limited. Another 127 pairs (29.2% of the total) had Oik between 0.1 and 0.5, and these pairs were subject to a certain degree of competition but could still coexist when resources were sufficient. The remaining 252 pairs (57.93% of the total) had Oik < 0.1, and competition among these pairs was weak (Figure 2).
Sorted by life form, 37 pairs of herbs had Oik ≥ 0.5, accounting for 35.24% of the total number of pairs of herbs; 29 pairs of herbs had Oik between 0.1 and 0.5, accounting for 27.62% of the total; and 39 pairs of herbs had Oik < 0.1, accounting for 37.14% of the total. A. pilosa and A. argyi had the largest Oik value at 0.9996. Among the woody plants, 11 species pairs had Oik ≥ 0.5, accounting for 10.47% of the total; 49 pairs had Oik between 0.1 and 0.5, accounting for 46.67% of the total; and 45 pairs had Oik < 0.1, accounting for 42.86% of the total. L. japonica and R. parvifolius had the largest Oik value at 0.6875 (Figure 2).

3.3. Overall Association Analysis

As shown in Table 3, the VR of herbaceous and woody plants as a whole, herbaceous and woody plants during vegetation succession were 1.20, 2.40, and 2.49, respectively. The VRs of all three scenarios vegetation is greater than 1, indicating a positive association among the dominant species in general. The χ2 table was checked according to the degrees of freedom, and the test statistics (W) did not fall under χ2 critical values, indicating that the interspecies association was significant (p < 0.05). Therefore, the overall association between the dominant species in this succession was significantly positive.

3.4. Species Association Analysis

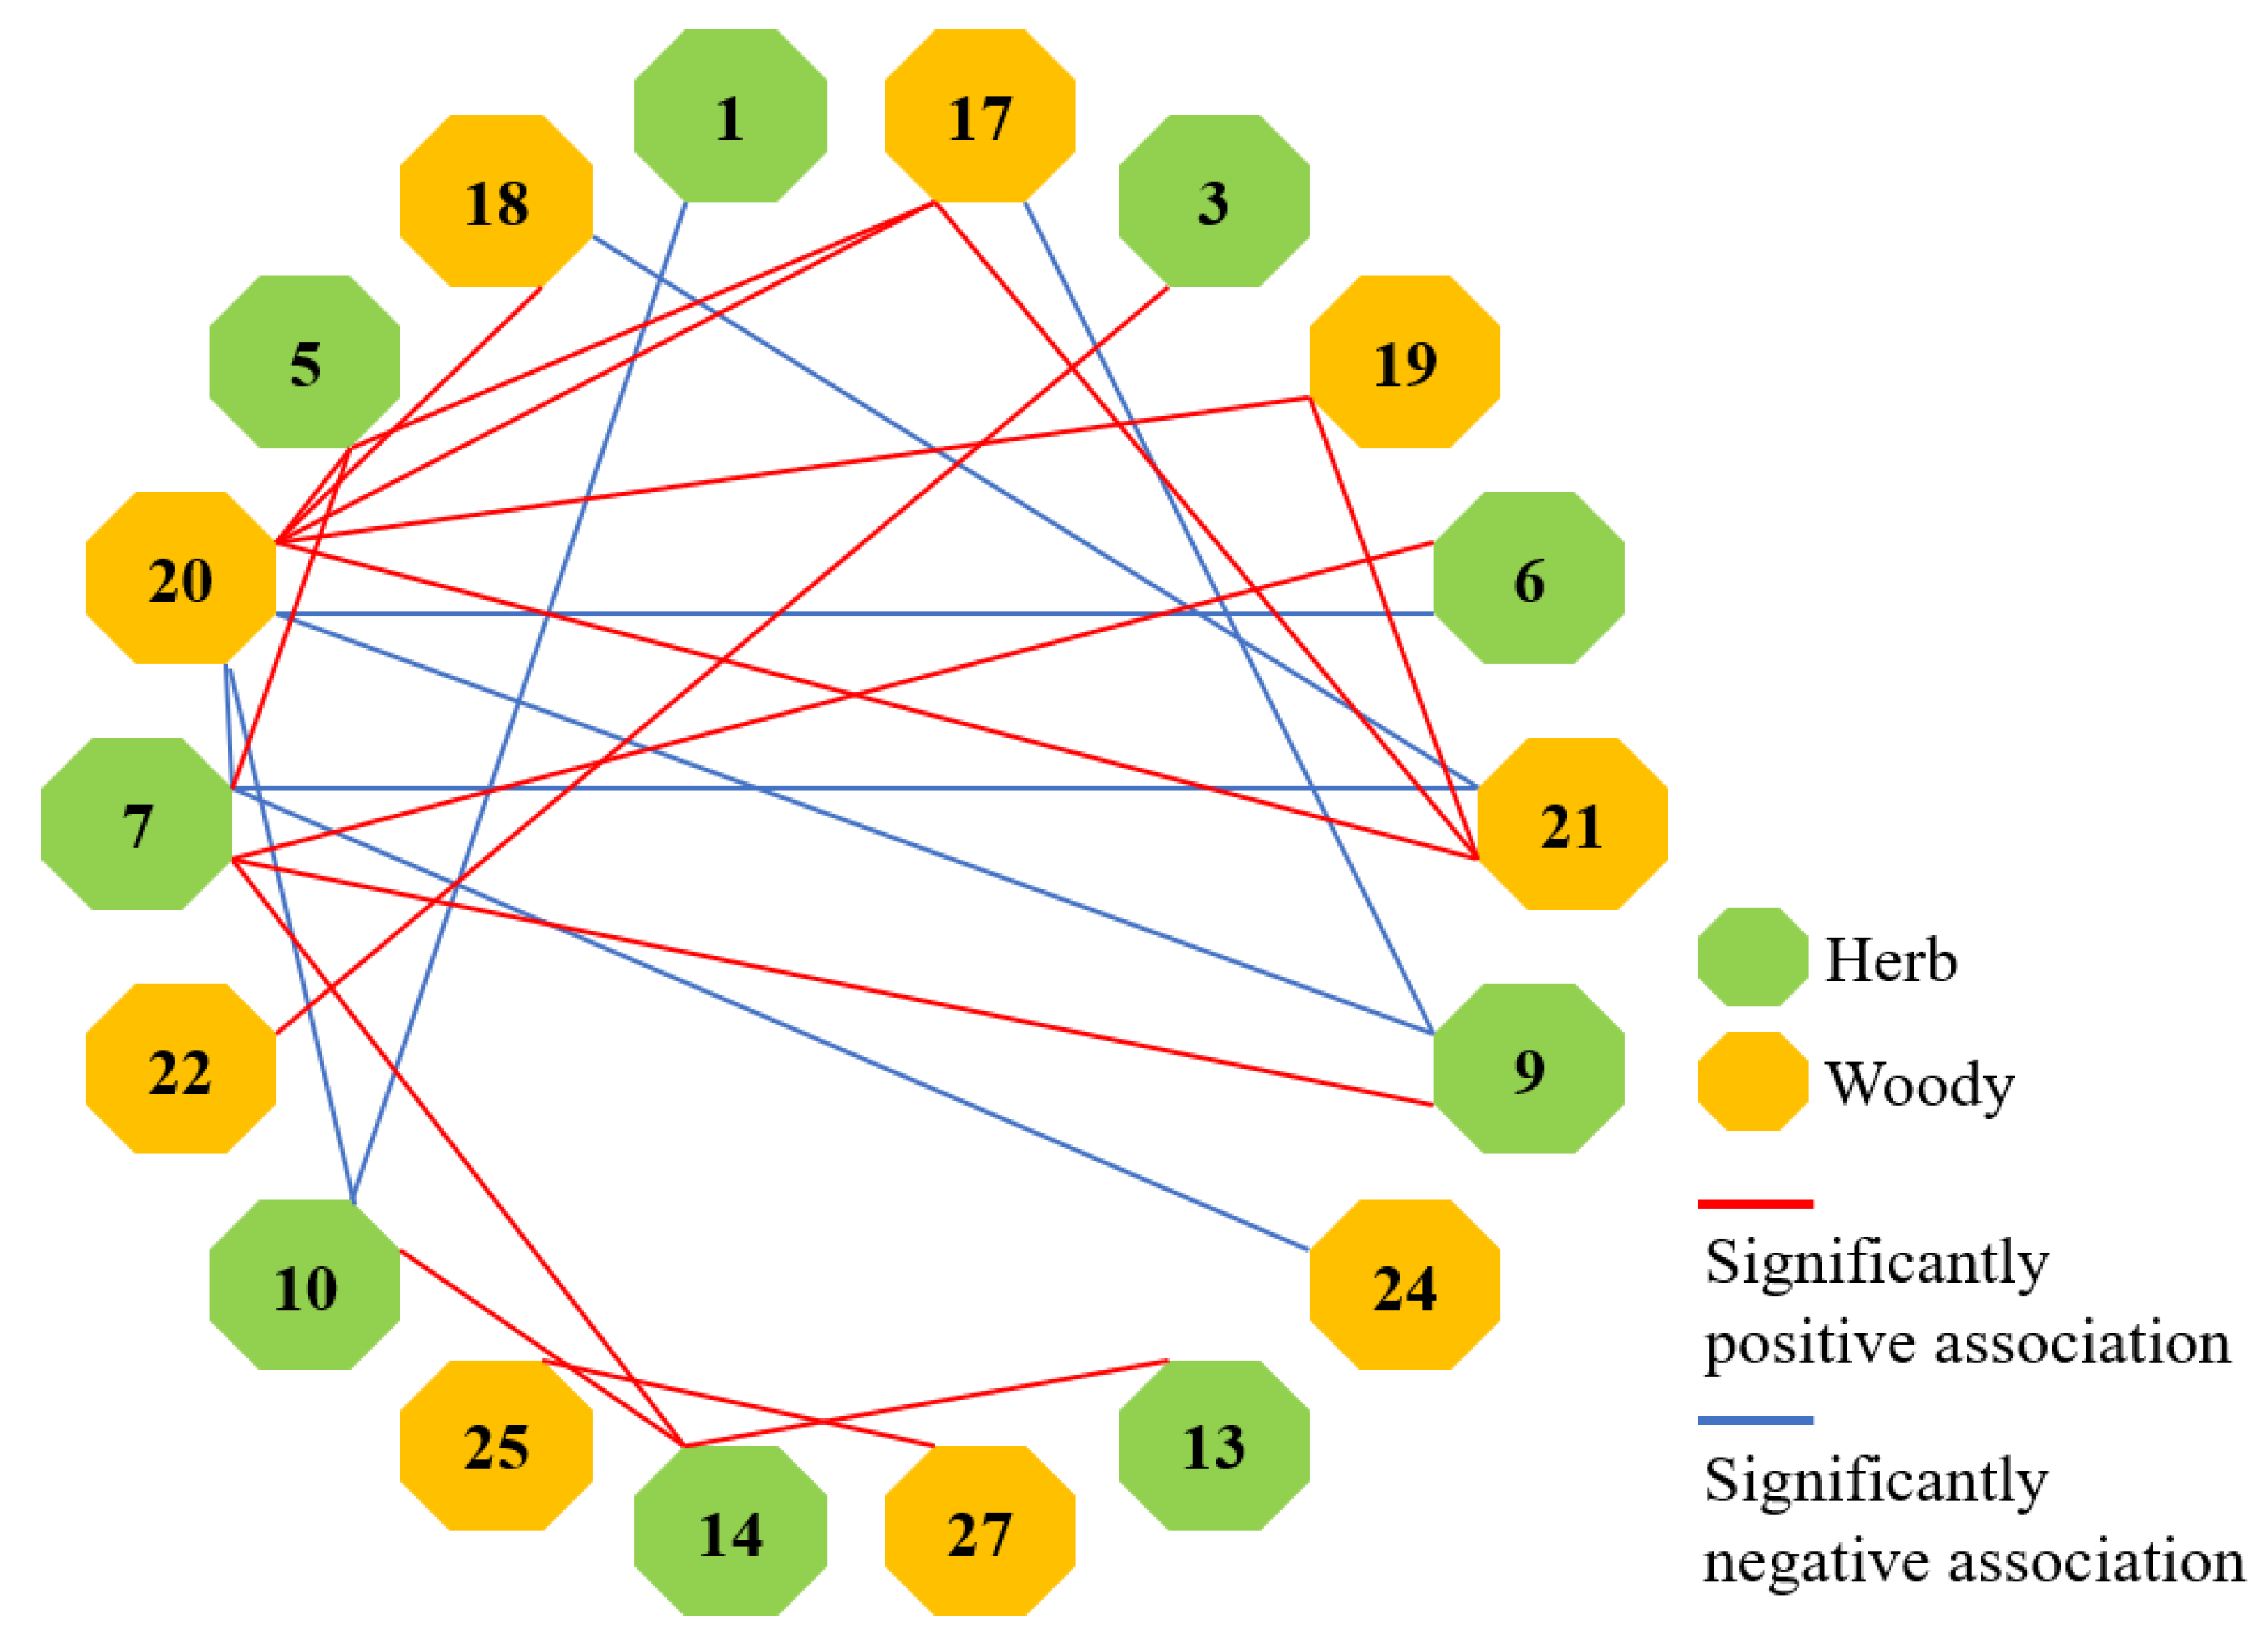
3.4.1. Test of Species Associations

The results of the χ2 tests (Figure 3, Supplementary Materials) showed that, the χ2 statistic was less than 3.841 for more than 90% of the species pairs in all three scenarios. There were 25 significantly associated species pairs. Meanwhile, Table 4 shows that the strongest positive linkage among herbaceous species pairs, followed by woody plants, and the weakest herb + woody in the three scenarios. There were 16 pairs of significantly positively associated species pairs and 9 pairs of significantly negatively associated species pairs.

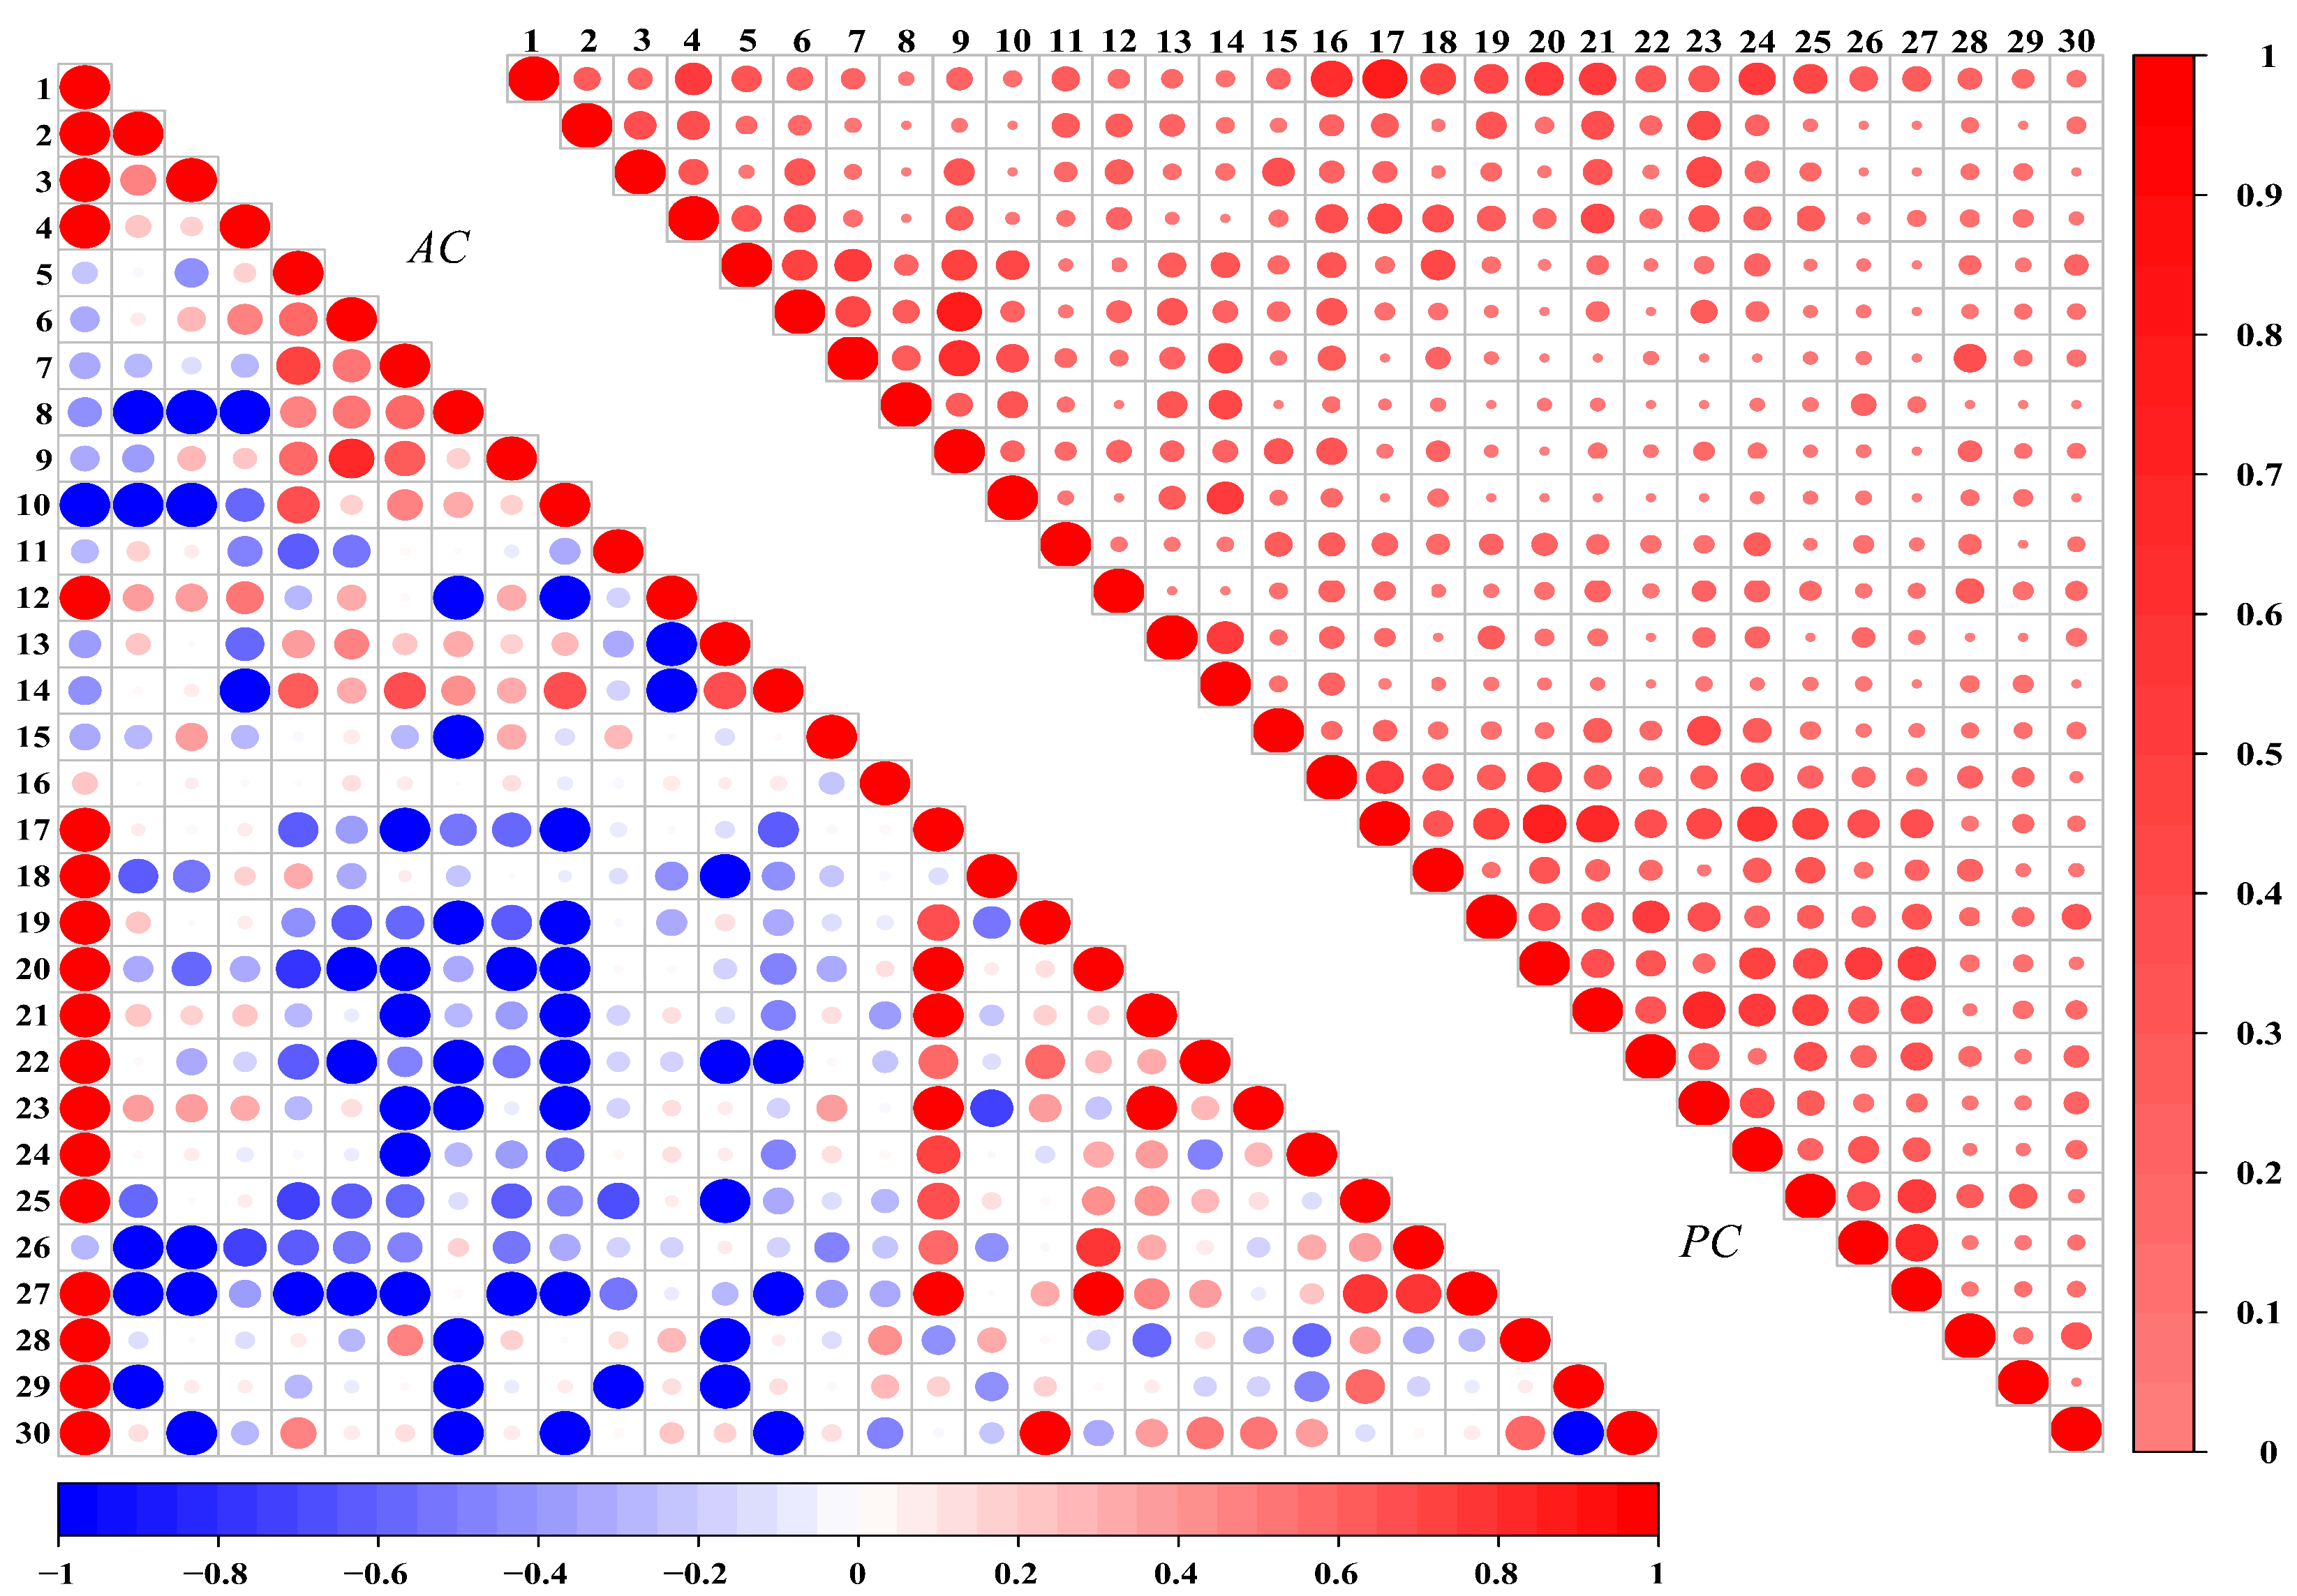
3.4.2. Strength of Species Associations

The results of the association coefficient (AC) and percentage co-occurrence (PC) of dominant species demonstrate the strength of association between species (Figure 4 and Table 5). The number of positive association species pairs was 61, 63, and 211, with corresponding positive and negative species pair association ratio values of 1.39, 1.54, and 0.95 in the Herb, Woody, and Herb + Woody Scenarios, respectively, based on the AC results (Table 5).
Among the three scenarios, the woody scenario had the largest proportion of species pairs with a high degree of positive interspecific association (AC ≥ 0.6) at 12.38%; the Herb + Woody scenario had the largest proportion of species pairs with a high degree of negative interspecific association (AC ≥ 0.6) at 15.86%; the degree of association coefficient was average (0.2 ≤ AC < 0.6 and −0.6 ≤ AC < −0.2) and tended to be independent (0 < AC < 0.2 and −0.2 ≤ AC < 0) ranged from about 30% to 50% and 25% to 35%, respectively; there were three and one pair of species pairs with Herb + Woody and Woody scenarios with complete independence (AC = 0). The number of species pairs with weak connectivity (0 < PC < 0.5) for all three scenarios exceeded 80%. The largest percentage of species pairs with a high degree of linkage (0.5 ≤ PC < 1) was 10.48% for the Woody scenario. The number of species pairs with no association (PC = 0) between Herb, Woody, and Herb + Woody scenarios was 11, 1 and 53, respectively (Table 5).

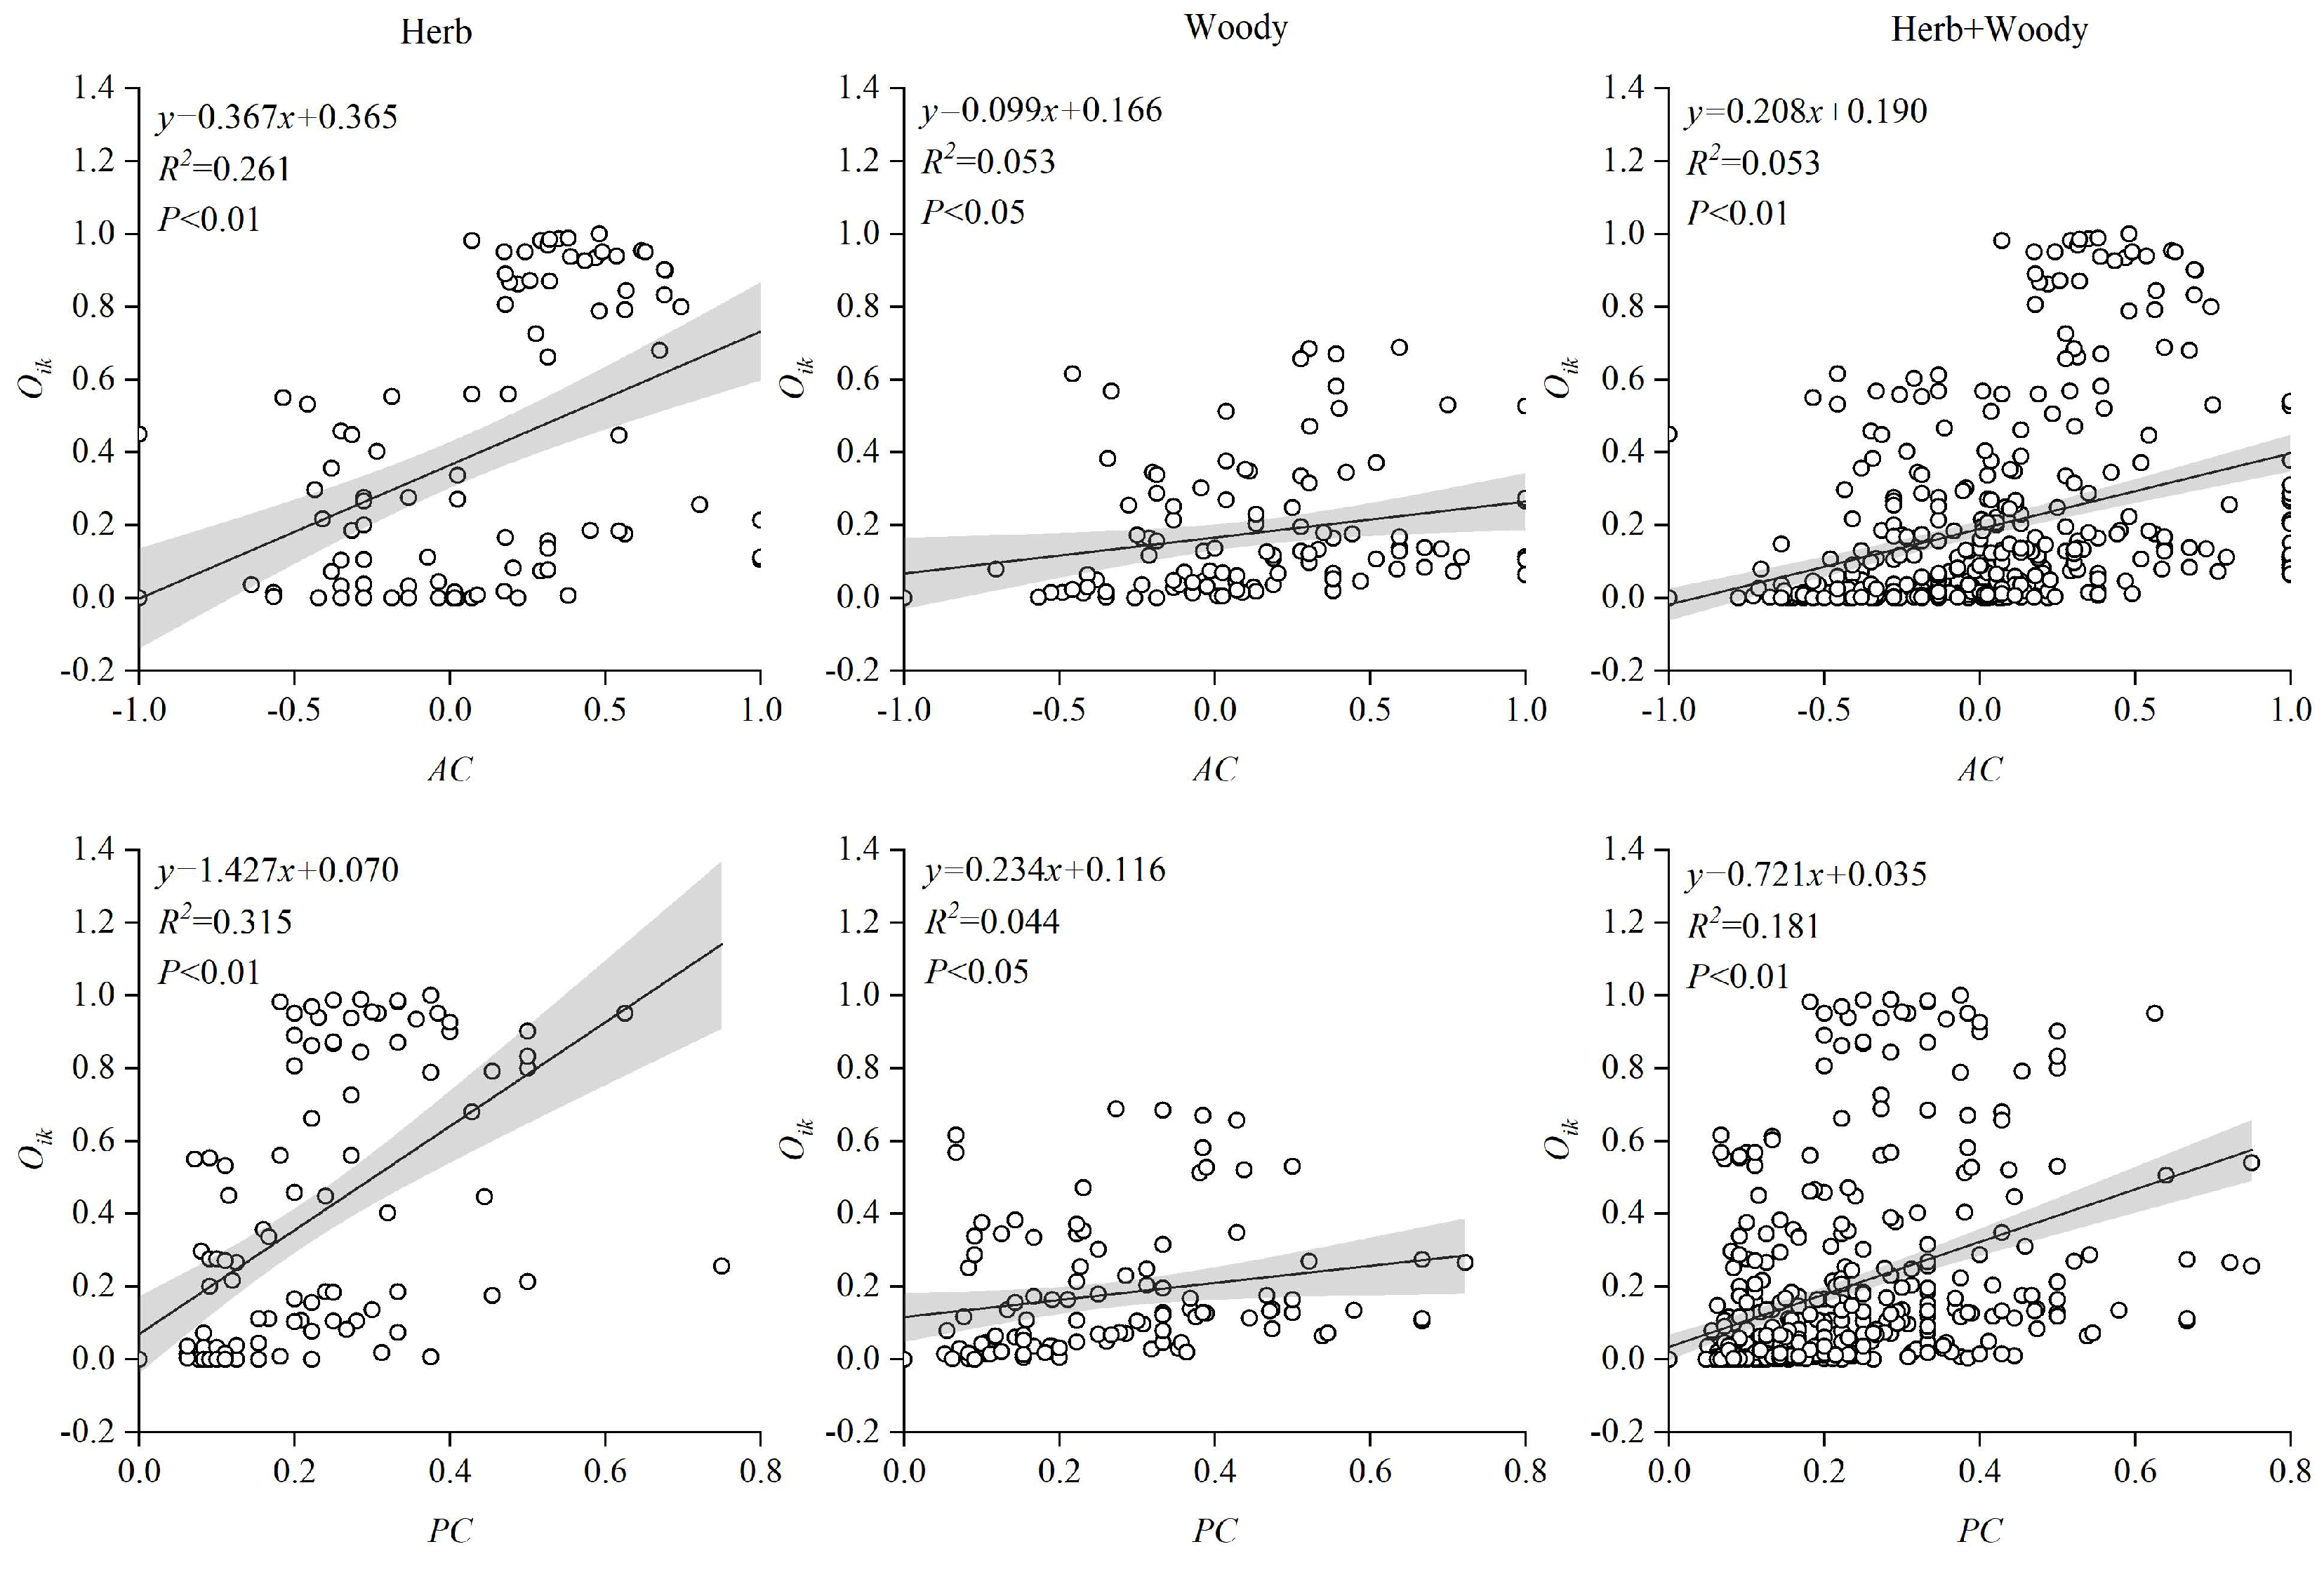
3.5. Regression Analysis between Association Strength and Niche Overlap

The regression analyses of interspecific association coefficients and ecological niche overlap index during vegetation succession in this research are shown in Figure 5. The p-values were less than 0.05 for interspecific association coefficients and Oik of the dominant species in the three scenarios. Also, the slopes of the plots were all greater than 0, indicating that a significant linear positive correlation existed between them. Thus, the stronger the positive interspecific association is, the more likely it is for interspecific pairs to live together and the larger the Oik. Conversely, the stronger the negative interspecific association is, the more independent the pairs are and the smaller the Oik.

4. Discussion

4.1. Importance Values and Ecological Niches of Dominant Plants

C. lanceolata and L. bicolor were the most important species in the process and had a highly functional position in the community. They are strongly competitive, use resources efficiently, adapt to a wide ecological range, and have a strong storage effect on generalized species [55]. This may be because both species are temperate and fit the local climatic characteristics [43]. In addition, they are positively associated with each other, are engaged in symbiosis and synergistic evolution, and serve as a basis for community construction, playing important roles in promoting positive succession and maintaining community stability [56]. However, other plants with high importance values and relatively narrow ecological niche breadth indicate that they are sensitive to environmental changes, have a poor adaptive capacity, play important roles in only a few stages of succession, are more likely to be specialized (for a particular habitat), and are vulnerable to elimination and replacement during the development of the community [57].
Ecological niche overlap is an important indicator of differences in the ability of species to use environmental resources and engage in competitive relationships. A relatively large overlap of ecological niches indicates that two species have similar life forms and ecological needs for environmental resources and that there may be fierce competition between them. At the same time, species can also adjust their resource use and competitive ability to cope with different ecological and evolutionary pressures through adaptive changes in traits [9,58,59]. Species exhibit feedback effects between ecological processes and evolution to drive community succession development [9]. The degree of overlap of ecological niches among dominant species was found to be generally low in this research, which indicates that there is strong competition among a few species pairs and weak competition among most species pairs and that interspecific relationships are stable. The degree of ecological niche overlap for herbaceous plants was greater than that for woody plants, indicating a greater similarity in environmental resource requirements among dominant herbaceous plant species. Meanwhile, A. Pilosa—A. argyi, and L. japonica—R. parvifolius interspecies pairs showed non-significant positive associations. These species have the potential to co-occur in the community as companion species, thus enhancing the utilization of resources.

4.2. Interspecific Association Strength and Niche Overlap Relationships

Interspecific associations reflect species interactions and community dynamics. A positive correlation means that they have the same or similar needs for environmental resources, strong complementarity between species, fuller use of resources, and an ecological compensation effect [12,60]. Contrary of that, negative correlations indicate an adaptation of species pairs to environmental heterogeneity due to large differences in biological characteristics, leading to exclusion and ecological niche separation [9]. The results of the overall association analysis and the results of χ2 test in this research were consistent, showing that most species pairs were positively associated in all three scenarios. This suggests that dominant species in the community weaken interspecific competition and help each other during this process. The community structure stabilizes and adapts to the environment, with the community moving toward top succession [61,62].
However, the overall non-significant positive associations between herbaceous and woody plants suggest that species pairing between different life forms may still enhance. This effect is in line with the forest secondary succession pattern, developing from a single herbaceous community with simple structural functions to an advanced multifunctional community with multiple life forms that coexist to maximize resource environment utilization [63,64]. This finding suggests that vertical spatial complementation of plants with different functional traits is an important mechanism for species coexistence [65].
χ2 tests showed that the dominant species pairs were mostly non-significantly associated in all three scenarios, with weak interspecific associations and relatively strong independence. This is mainly because the environment experienced by plants during the 150-year natural restoration period was highly heterogeneous, and habitat filtering may still be an important ecological process for species to achieve coexistence patterns at each stage. This finding supports those of Tilman [66], Pedersen et al. [67], and Wu et al. [68] that, when vegetation is restored, competition tends to decrease, and interactions between species tend to be neutral.
In this research, the significant positive correlations were found between the interspecific association coefficients (AC and PC), and Oik among dominant species, which showed that the degree of Oik is greater among positively associated species pairs. This reflects the consistency of habitat requirements for these species. By comparing Table 2 and Table 4, we also found that the species pairs are negatively associated, but their Oik values are not necessarily small (e.g., C. lanceolataA. lancea). The causes of negative associations are complex. The associativity between species pairs correlates with the species’ ecological niches and with the frequency of distribution, habitat, and resource utilization capacity of the species pairs, which may explain these findings. This conclusion has also been confirmed in many studies on ecological niches and interspecific associations [69,70].

4.3. Inspirations and Prospects

Past two decades, the introduced species black locust (Robinia pseudoacacia L.) is widely monocultured on the Loess Plateau due to its rapid growth and high tolerance to drought and poor soils [71,72]. Nevertheless, its high-water consumption makes it difficult for native plantations to survive, with an unbalanced community structure and lower plant diversity than natural secondary forests [73,74,75,76]. As future droughts intensify [77,78], the rising risk of decline and mortality of R. pseudoacacia stands could severely impact sustainability of ecological functions [72,76,79].
As shown in Table 1 and Supplementary Materials, our findings provide a good template for plantation forest construction and theoretical support for local ecosystem function restoration. This research demonstrates that, under the ecological process of environmental filtering, species within communities can ultimately reduce interspecific competition and promote species coexistence through storage effects via the use of spatial heterogeneity and temporal asynchronous differences. This is consistent with the findings of Usinowicz et al. [80] and Levine et al. [2]. We also find weak associations among dominant species during the 150 years of natural vegetation restoration succession. The communities were all in a positive and healthy development period. So, we should continue to protect the native environment, prevent anthropogenic disturbance, and enhance the protection of not significantly positively associated species, such as A. chamaemelifolia and A. tataricum subsp. ginnala. Among herbaceous plants, P. chinensis, A. hispidus, and A. lancea formed the most significant negative associations with woody plant species in pairs, suggesting that they are susceptible to replacement by woody plant influences on the microenvironment, such as light resources, during community formation. The status of these negatively associated species should be given attention when the plantation forest is constructed.
Meanwhile, we can consider adding C. lanceolata and L. bicolor, two plants that generally coexist easily with other species for mutual benefit, to enhance the community function and stability of the plantation forest. Thus, in the reconstruction and restoration of a community, it is important to fully understand the ecological and biological traits of each tree species, take into account how different habitats affect the relationships between species at different times, and choose tree species that can adapt well to their environment and coexist well with other species for collocation planting, which will prevent extreme interspecific competitive exclusion.

5. Conclusions

During 150 years of natural vegetation restoration succession, species within the community reduced interspecific competition and promoted coexistence through spatial heterogeneity and temporal asynchronous differences with storage effects. The ranges of ecological niche breadth variation in this research are [1.07, 12.80] for herbaceous plants and [1.43, 9.42] for woody plants. C. lanceolata and L. bicolor are the most important species in this process. Local plantation forest construction can consider adding these two plants to enhance ecological functions, maintain community stability, and promote the healthy development of the community. Overall, 379 pairs of ecological niche overlap index Oik < 0.5 were identified, accounting for 87.13% of the total, and most of the pairs had weak interspecific competition and stable interspecific relationships. The similarity in environmental resource requirements among dominant species of herbaceous plants is greater than that of woody plants. The overall positive association among the 30 dominant plants indicates that the community is in a positive succession process. Plant coexistence relationships in Supplementary Materials can provide a reference for plantation forest construction. The results of the AC, PC, and χ2 tests were essentially consistent, all showing that the dominant species pairs were mostly insignificantly associated. The degree of association between species pairs was weak, while independence was relatively strong. Meanwhile, a significant positive correlation was found between AC, PC, and Oik.
Habitat filtering is an important ecological process for species at each stage to achieve coexistence patterns. With vegetation restoration, competition tends to lessen in intensity, and interactions between species tend to be neutral. In the future, we should enhance the protection of positively associated species and pay attention to negatively associated species during forest management. Then, to get more complete analysis results, the soil, topography, climate, and vertical structure of the forest should be considered.

Supplementary Materials

The following supporting information can be downloaded at: https://www.mdpi.com/article/10.3390/f13091456/s1, Figure S1. Half matrix graph of the interspecific association χ2 test among the 30 plant species at the Ziwuling study area on the Chinese Loess Plateau.

Author Contributions

Conceptualization, Q.T. and X.Z.; methodology, Q.T. and X.Z.; software, Q.T.; formal analysis, Q.T.; investigation, Q.T., X.Z., X.X., H.Y., J.H., L.H. and W.S.; data curation, Q.T. and X.X.; writing—original draft preparation, Q.T.; writing—review and editing, Q.T. and X.Z.; visualization, Q.T.; project administration and funding acquisition, X.Z. All authors have read and agreed to the published version of the manuscript.

Funding

This research was funded by the National Key R & D Program of China (2022YFE0115300) and National Natural Science Foundation of China, grant number 41877083, 41440012 and 41230852.

Data Availability Statement

Data is contained within the article or supplementary material.

Acknowledgments

We would like to thank Haojia Wang, Miaoqian Wang, Yujie Zhang, Fan Xue, Yadong Zou for help with data processing and discussion for this article.

Conflicts of Interest

The authors declare no conflict of interest.

References

  1. Tilman, D. Resource Competition and Community Structure. (MPB-17), Volume 17. In Resource Competition and Community Structure. (MPB-17); Princeton University Press: Princeton, NJ, USA, 2020; Volume 17. [Google Scholar] [CrossRef]
  2. Levine, J.M.; Bascompte, J.; Adler, P.B.; Allesina, S. Beyond pairwise mechanisms of species coexistence in complex communities. Nature 2017, 546, 56–64. [Google Scholar] [CrossRef] [PubMed]
  3. Callaway, R.M.; Brooker, R.W.; Choler, P.; Kikvidze, Z.; Lortie, C.; Michalet, R.; Paolini, L.; Pugnaire, F.I.; Newingham, B.; Aschehoug, E.T.; et al. Positive interactions among alpine plants increase with stress. Nature 2002, 417, 844–848. [Google Scholar] [CrossRef] [PubMed]
  4. Jia, S.; Wang, X.; Yuan, Z.; Lin, F.; Ye, J.; Lin, G.; Hao, Z.; Bagchi, R. Tree species traits affect which natural enemies drive the Janzen-Connell effect in a temperate forest. Nat. Commun. 2020, 11, 286–289. [Google Scholar] [CrossRef] [PubMed]
  5. Zhang, H.; Bearup, D.; Nijs, I.; Wang, S.; Barabás, G.; Tao, Y.; Liao, J. Dispersal network heterogeneity promotes species coexistence in hierarchical competitive communities. Ecol. Lett. 2021, 24, 50–59. [Google Scholar] [CrossRef] [PubMed]
  6. Yang, Y.; Hui, C. How competitive intransitivity and niche overlap affect spatial coexistence. Oikos 2021, 130, 260–273. [Google Scholar] [CrossRef]
  7. Brooker, R.W.; Maestre, F.T.; Callaway, R.M.; Lortie, C.L.; Cavieres, L.A.; Kunstler, G.; Liancourt, P.; Tielbörger, K.; Travis, J.; Anthelme, F.; et al. Facilitation in plant communities: The past, the present, and the future. J. Ecol. 2008, 96, 18–34. [Google Scholar] [CrossRef]
  8. Pocheville, A. The ecological niche: History and recent controversies. In Handbook of Evolutionary Thinking in the Sciences; Springer: Dordrecht, The Netherlands, 2015; pp. 547–586. [Google Scholar] [CrossRef]
  9. Pastore, A.I.; Barabás, G.; Bimler, M.D.; Mayfield, M.M.; Miller, T.E. The evolution of niche overlap and competitive differences. Nat. Ecol. Evol. 2021, 5, 330–337. [Google Scholar] [CrossRef]
  10. Liu, J.H.; Wang, Z.W.; Han, G.D. Effects of heavy grazing on the interspecific relationship of main plant species and community stability in a desert steppe. Chin. J. Ecol. 2019, 38, 2595–2602. (In Chinese) [Google Scholar]
  11. Gao, W.; Huang, Y.; Lin, J.; Huang, M.; Wu, X.; Lin, W.; Huang, S. Interspecific Correlations among Dominant Populations of Natural Forest of Endangered Species Betula fujianensis. Sci. Silvae Sin. 2021, 57, 1–14. [Google Scholar] [CrossRef]
  12. Jin, S.S.; Zhang, Y.Y.; Zhou, M.L.; Dong, X.M.; Chang, C.H.; Wang, T.; Yan, D.F. Interspecific Association and Community Stability of Tree Species in Natural Secondary Forests at Different Altitude Gradients in the Southern Taihang Mountains. Forests 2022, 13, 373. [Google Scholar] [CrossRef]
  13. Tokeshi, M. Species Coexistence: Ecological and Evolutionary Perspectives; John Wiley & Sons: Hoboken, NJ, USA, 2009. [Google Scholar]
  14. Adler, P.B.; Smull, D.; Beard, K.; Choi, R.T.; Furniss, T.; Kulmatiski, A.; Meiners, J.M.; Tredennick, A.T.; Veblen, K.E. Competition and coexistence in plant communities: Intraspecific competition is stronger than interspecific competition. Ecol. Lett. 2018, 21, 1319–1329. [Google Scholar] [CrossRef] [PubMed]
  15. Ren, Y.; Lü, Y.; Fu, B.; Comber, A.; Li, T.; Hu, J. Driving factors of land change in china’s loess plateau: Quantification using geographically weighted regression and management implications. Remote Sens. 2020, 12, 453. [Google Scholar] [CrossRef]
  16. Xie, H.; Zhang, Y.; Wu, Z.; Lv, T. A bibliometric analysis on land degradation: Current status, development, and future directions. Land 2020, 9, 28. [Google Scholar] [CrossRef]
  17. Hua, F.; Wang, X.; Zheng, X.; Fisher, B.; Wang, L.; Zhu, J.; Tang, Y.; Yu, D.W.; Wilcove, D.S. Opportunities for biodiversity gains under the world’s largest reforestation programme. Nat. Commun. 2016, 7, 12717. [Google Scholar] [CrossRef] [PubMed]
  18. Shan, L.; Xu, B.C. Discussion on some issues about returning Farmland to Forest or Grassland on Loess Plateau in new era. Bull. Soil Water Conserv. 2019, 39, 3. (In Chinese) [Google Scholar]
  19. Kou, P.; Xu, Q.; Jin, Z.; Yunus, A.P.; Luo, X.; Liu, M. Complex anthropogenic interaction on vegetation greening in the Chinese Loess Plateau. Sci. Total Environ. 2021, 778, 146065. [Google Scholar] [CrossRef] [PubMed]
  20. Li, J.; Liu, Q.; Feng, X.; Shi, W.; Fu, B.; Lü, Y.; Liu, Y. The synergistic effects of afforestation and the construction of check-dams on sediment trapping: Four decades of evolution on the Loess Plateau, China. Land Degrad. Dev. 2019, 30, 622–635. [Google Scholar] [CrossRef]
  21. Jin, F.; Yang, W.; Fu, J.; Li, Z. Effects of vegetation and climate on the changes of soil erosion in the Loess Plateau of China. Sci. Total Environ. 2021, 773, 145514. [Google Scholar] [CrossRef]
  22. Wang, Y.H.; Bonell, M.; Feger, K.H.; Yu, P.; Xiong, W.; Xu, L. Changing forestry policy by integrating water aspects into forest/vegetation restoration in dryland areas in China. Bull. Chin. Acad. Sci. 2012, 26, 59–67. [Google Scholar] [CrossRef]
  23. Sun, G.; Zhou, G.; Zhang, Z.; Wei, X.; McNulty, S.G.; Vose, J.M. Potential water yield reduction due to forestation across China. J. Hydrol. 2006, 328, 548–558. [Google Scholar] [CrossRef]
  24. Wang, X.; Chen, F.; Hasi, E.; Li, J. Desertification in China: An assessment. Earth-Sci. Rev. 2008, 88, 188–206. [Google Scholar] [CrossRef]
  25. Li, S.; Liang, W.; Fu, B.; Lü, Y.; Fu, S.; Wang, S.; Su, H. Vegetation changes in recent large-scale ecological restoration projects and subsequent impact on water resources in China’s Loess Plateau. Sci. Total Environ. 2016, 569, 1032–1039. [Google Scholar] [CrossRef] [PubMed]
  26. Shao, M.A.; Wang, Y.; Xia, Y.; Jia, X. Soil drought and water carrying capacity for vegetation in the critical zone of the Loess Plateau: A review. Vadose Zone J. 2018, 17, 170077. [Google Scholar] [CrossRef]
  27. Wang, C.; Wang, S.; Fu, B.; Lü, Y.; Liu, Y.; Wu, X. Integrating vegetation suitability in sustainable revegetation for the Loess Plateau, China. Sci. Total Environ. 2021, 759, 143572. [Google Scholar] [CrossRef]
  28. Huang, Y.; Chen, Y.; Castro-Izaguirre, N.; Baruffol, M.; Brezzi, M.; Lang, A.; Li, Y.; Härdtle, W.; Von Oheimb, G.; Yang, X.; et al. Impacts of species richness on productivity in a large-scale subtropical forest experiment. Science 2018, 362, 80–83. [Google Scholar] [CrossRef]
  29. Gong, C.; Tan, Q.; Xu, M.; Liu, G. Mixed-species plantations can alleviate water stress on the Loess Plateau. For. Ecol. 2020, 458, 117767. [Google Scholar] [CrossRef]
  30. Wang, K.B.; Ren, Z.P.; Deng, L.; Zhou, Z.C.; Shangguan, Z.P.; Shi, W.Y.; Chen, Y.P. Profile distributions and controls of soil inorganic carbon along a 150-year natural vegetation restoration chronosequence. Soil Sci. Soc. Am. J. 2016, 80, 193–202. [Google Scholar] [CrossRef]
  31. Deng, L.; Wang, K.; Zhu, G.; Liu, Y.; Chen, L.; Shangguan, Z.P. Changes of soil carbon in five land use stages following 10 years of vegetation succession on the Loess Plateau, China. Catena 2018, 171, 185–192. [Google Scholar] [CrossRef]
  32. Deng, L.; Kim, D.G.; Peng, C.; Shangguan, Z.P. Controls of soil and aggregate-associated organic carbon variations following natural vegetation restoration on the Loess Plateau in China. Land Degrad. Dev. 2018, 29, 3974–3984. [Google Scholar] [CrossRef]
  33. Grime, J.P. Plant Strategies, Vegetation Processes, and Ecosystem Properties; John Wiley and Sons: Hoboken, NJ, USA, 2006. [Google Scholar]
  34. West, D.C.; Shugart, H.H.; Botkin, D.F. (Eds.) Forest Succession: Concepts and Application; Springer Science and Business Media: Berlin, Germany, 2012. [Google Scholar]
  35. Zou, H.Y.; Liu, G.B.; Wang, H.S. The vegetation development in North Ziwuling forest region in last fifty years. Acta Botan. Boreali-Occiden. Sin. 2002, 22, 1–8. (In Chinese) [Google Scholar]
  36. Fan, W.Y.; Wang, X.A.; Guo, H. Analysis of plant community successional series in the Ziwuling area on the Loess Plateau. Acta Ecol. Sin. 2006, 26, 706–714. (In Chinese) [Google Scholar]
  37. Cheng, J.; Cheng, J.; Shao, H.; Zhao, L.; Yang, X. Soil seed banks and forest succession direction reflect soil quality in Ziwuling Mountain, Loess Plateau, China. Clean–Soil Air Water 2012, 40, 140–147. [Google Scholar] [CrossRef] [Green Version]
  38. Cowles, H.C. The Ecological Relations of the Vegetation on the Sand Dunes of Lake Michigan. Part I.-Geographical Relations of the Dune Floras. Bot. Gaz. 1899, 27, 95–117. [Google Scholar] [CrossRef]
  39. Blois, J.L.; Williams, J.W.; Fitzpatrick, M.C.; Jackson, S.T.; Ferrier, S. Space can substitute for time in predicting climate-change effects on biodiversity. Proc. Natl. Acad. Sci. USA 2013, 110, 9374–9379. [Google Scholar] [CrossRef] [PubMed]
  40. Deng, L.; Wang, K.B.; Chen, M.L.; Shangguan, Z.P.; Sweeney, S. Soil organic carbon storage capacity positively related to forest succession on the Loess Plateau, China. Catena 2013, 110, 1–7. [Google Scholar] [CrossRef]
  41. Zhao, Y.G.; Liu, X.F.; Wang, Z.L.; Zhao, S.W. Soil organic carbon fractions and sequestration across a 150-yr secondary forest chronosequence on the Loess Plateau, China. Catena 2015, 133, 303–308. [Google Scholar] [CrossRef]
  42. Liu, Y.; Zhu, G.; Hai, X.; Li, J.; Shangguan, Z.P.; Peng, C.; Deng, L. Long-term forest succession improves plant diversity and soil quality but not significantly increase soil microbial diversity: Evidence from the Loess Plateau. Ecol. Eng. 2020, 142, 105631. [Google Scholar] [CrossRef]
  43. Li, J. Flora of China. Harv. Pap. Bot. 2007, 13, 301–302. [Google Scholar] [CrossRef]
  44. Schoener, T.W. Resource Partitioning in Ecological Communities: Research on how similar species divide resources helps reveal the natural regulation of species diversity. Science 1974, 185, 27–39. [Google Scholar] [CrossRef]
  45. Song, Y.C. Vegetation Ecology; East China Normal University Press: Shanghai, China, 2001. (In Chinese) [Google Scholar]
  46. Colwell, R.K.; Futuyma, D.J. On the measurement of niche breadth and overlap. Ecology 1971, 52, 567–576. [Google Scholar] [CrossRef]
  47. Pianka, E.R. The structure of lizard communities. Annu. Rev. Ecol. Syst. 1973, 4, 53–74. [Google Scholar] [CrossRef]
  48. Schluter, D. A variance test for detecting species associations, with some example applications. Ecology 1984, 65, 998–1005. [Google Scholar] [CrossRef]
  49. Dice, L.R. Measures of the amount of ecologic association between species. Ecology 1945, 26, 297–302. [Google Scholar] [CrossRef]
  50. Dai, J.; Liu, H.; Xu, C.; Qi, Y.; Zhu, X.; Zhou, M.; Liu, B.; Wu, Y. Divergent hydraulic strategies explain the interspecific associations of co-occurring trees in forest–steppe ecotone. Forests 2020, 11, 942. [Google Scholar] [CrossRef]
  51. Grieg-Smith, P. Quantitative Plant Ecology (Studies in Ecology); Blackwell Science Ltd: Hoboken, NJ, USA, 1983. [Google Scholar]
  52. Zhang, J.T. Quantitative Ecology; Science Press: Beijing, China, 2004. (In Chinese) [Google Scholar]
  53. Zhang, J.L. Spaa: Species Association Analysis, R Package Version 0.2.2; R Foundation for Statistical Computing: Vienna, Austria, 2016. [Google Scholar]
  54. Wei, T.; Simko, V.R. Package “Corrplot”: Visualization of a Correlation Matrix (Version 0.84). 2021. Available online: https://github.com/taiyun/corrplot (accessed on 20 August 2022).
  55. Chesson, P. Mechanisms of maintenance of species diversity. Annu. Rev. Ecol. Syst. 2000, 31, 343–366. [Google Scholar] [CrossRef]
  56. Álvarez-Yépiz, J.C.; Búrquez, A.; Dovčiak, M. Ontogenetic shifts in plant–plant interactions in a rare cycad within angiosperm communities. Oecologia 2014, 175, 725–735. [Google Scholar] [CrossRef] [PubMed]
  57. Gu, L.; O’Hara, K.L.; Li, W.Z.; Gong, Z.W. Spatial patterns and interspecific associations among trees at different stand development stages in the natural secondary forests on the Loess Plateau, China. Ecol. Evol. 2019, 9, 6410–6421. [Google Scholar] [CrossRef]
  58. Fielding, A.P.; Pantel, J.H. Eco-evolutionary feedbacks and the maintenance of metacommunity diversity in a changing environment. Genes 2020, 11, 1433. [Google Scholar] [CrossRef]
  59. Tsafack, N.; Wang, X.; Xie, Y.; Fattorini, S. Niche overlap and species co-occurrence patterns in carabid communities of the northern Chinese steppes. ZooKeys 2021, 1044, 929–949. [Google Scholar] [CrossRef]
  60. Yuan, Z.; Wei, B.; Chen, Y.; Jia, H.; Wei, Q.; Ye, Y. How do similarities in spatial distributions and interspecific associations affect the coexistence of Quercus species in the Baotianman National Nature Reserve, Henan, China. Ecol. Evol. 2018, 8, 2580–2593. [Google Scholar] [CrossRef]
  61. Stubbs, W.J.; Bastow, W.J. Evidence for limiting similarity in a sand dune community. J. Ecol. 2004, 92, 557–567. [Google Scholar] [CrossRef]
  62. Nathan, R. Long-distance dispersal of plants. Science 2006, 313, 786–788. [Google Scholar] [CrossRef] [PubMed] [Green Version]
  63. Petritan, I.C.; Marzano, R.; Petritan, A.M.; Lingua, E. Overstory succession in a mixed Quercus petraea–Fagus sylvatica old growth forest revealed through the spatial pattern of competition and mortality. For. Ecol. Manag. 2014, 326, 9–17. [Google Scholar] [CrossRef]
  64. Ma, F.; Pan, G.; Li, X.; Han, Y. Interspecific relationship and canonical correspondence analysis within woody plant communities in the karst mountains of Southwest Guangxi, southern China. J. Beijing For. Univ. 2017, 39, 32–44. [Google Scholar] [CrossRef]
  65. Kikuzawa, K.; Onoda, Y.; Wright, I.J.; Reich, P.B. Mechanisms underlying global temperature-related patterns in leaf longevity. Glob. Ecol. Biogeogr. 2013, 22, 982–993. [Google Scholar] [CrossRef]
  66. Tilman, D. Competition and biodiversity in spatially structured habitats. Ecology 1994, 75, 2–16. [Google Scholar] [CrossRef]
  67. Pedersen, R.Ø.; Bollandsås, O.M.; Gobakken, T.; Næsset, E. Deriving individual tree competition indices from airborne laser scanning. For. Ecol. Manag. 2012, 280, 150–165. [Google Scholar] [CrossRef]
  68. Wu, S.; Wen, L.; Dong, S.; Gao, X.; Xu, Y.; Li, S.; Dong, Q.; Wessell, K. The Plant Interspecific Association in the Revegetated Alpine Grasslands Determines the Productivity Stability of Plant Community Across Restoration Time on Qinghai-Tibetan Plateau. Front. Plant Sci. 2022, 13, 850854. [Google Scholar] [CrossRef]
  69. Shao, L.Y.; Zhang, G.F. Niche and interspecific association of dominant tree populations of Zelkova schneideriana communities in eastern China. Bot. Sci. 2021, 99, 823–833. [Google Scholar] [CrossRef]
  70. Gu, L.; Gong, Z.W.; Li, W.Z. Niches and interspecific associations of dominant populations in three changed stages of natural secondary forests on Loess Plateau, PR China. Sci. Rep. 2017, 7, 6604. [Google Scholar] [CrossRef]
  71. Fu, B.; Wang, S.; Liu, Y.; Liu, J.; Liang, W.; Miao, C. Hydrogeomorphic ecosystem responses to natural and anthropogenic changes in the Loess Plateau of China. Annu. Rev. Earth Planet. Sci. 2017, 45, 223–243. [Google Scholar] [CrossRef]
  72. Li, G.; Zhang, X.; Huang, J.; Wen, Z.; Du, S. Afforestation and climatic niche dynamics of black locust (Robinia pseu-doacacia). For. Ecol. Manag. 2018, 407, 184–190. [Google Scholar] [CrossRef]
  73. Du, S.; Wang, Y.L.; Kume, T.; Zhang, J.G.; Otsuki, K.; Yamanaka, N.; Liu, G.B. Sapflow characteristics and climatic responses in three forest species in the semiarid Loess Plateau region of China. Agric. For. Meteorol. 2011, 151, 1–10. [Google Scholar] [CrossRef]
  74. Cao, S.; Sun, G.; Zhang, Z.; Chen, L.; Feng, Q.; Fu, B.; McNulty, S.; Shankman, D.; Tang, J.; Wang, Y.; et al. Greening china naturally. Ambio 2011, 40, 828–831. [Google Scholar] [CrossRef] [PubMed]
  75. Jiao, L.; Lu, N.; Fu, B.; Wang, J.; Li, Z.; Fang, W.; Liu, J.; Wang, C.; Zhang, L. Evapotranspiration partitioning and its implications for plant water use strategy: Evidence from a black locust plantation in the semi-arid Loess Plateau, China. For. Ecol. Manag. 2018, 424, 428–438. [Google Scholar] [CrossRef]
  76. Wei, J.S.; Li, Z.S.; Feng, X.Y.; Zhang, Y.; Chen, W.L.; Xing, W.U.; Jiao, L.; Wang, X.C. Ecological and physiological mecha-nisms of growth decline of Robinia pseudoacacia plantations in the Loess Plateau of China: A review. Chin. J. Appl. Ecology 2018, 29, 2433–2444. [Google Scholar] [CrossRef]
  77. Yan, W.; Zhong, Y.; Shangguan, Z. Responses of different physiological parameter thresholds to soil water availability in four plant species during prolonged drought. Agric. For. Meteorol. 2017, 247, 311–319. [Google Scholar] [CrossRef]
  78. Peng, S.; Ding, Y.; Wen, Z.; Chen, Y.; Cao, Y.; Ren, J. Spatiotemporal change and trend analysis of potential evapo-transpiration over the Loess Plateau of China during 2011–2100. Agric. For. Meteorol. 2017, 233, 183–194. [Google Scholar] [CrossRef]
  79. Zhang, Z.; Huang, M.; Yang, Y.; Zhao, X. Evaluating drought-induced mortality risk for Robinia pseudoacacia planta-tions along the precipitation gradient on the Chinese Loess Plateau. Agric. For. Meteorol. 2020, 284, 107897. [Google Scholar] [CrossRef]
  80. Usinowicz, J.; Chang-Yang, C.-H.; Chen, Y.-Y.; Clark, J.S.; Fletcher, C.; Garwood, N.C.; Chia-Hao, C.-Y.; Johnstone, J.; Lin, Y.; Metz, M.; et al. Temporal coexistence mechanisms contribute to the latitudinal gradient in forest diversity. Nature 2017, 550, 105–108. [Google Scholar] [CrossRef]
Figure 1. Ziwuling study area on the Chinese Loess Plateau.
Forests 13 01456 g001
Figure 2. The ecological niche overlap index. The numbers represent the plants in Table 1. The numbers of 1 to 15 represent herbaceous plants, and 16 to 30 indicate woody plants. The larger the square or sector, the darker the color, the larger the Oik.
Forests 13 01456 g002
Figure 3. Results of χ2 test of significantly association. The numbers represent the plants in Table 1.
Forests 13 01456 g003
Figure 4. Interspecific associations strength. Lower is AC values, upper is PC values. The numbers represent the plants in Table 1. The larger the circle, the redder the color and the larger the value; the smaller the circle, the bluer the color and the smaller the value.
Forests 13 01456 g004
Figure 5. Regression analyses between the interspecific association coefficients (AC and PC) and Oik for herbs, woody plants and, herbs + woody plants. The dark color lines indicate the fits of the linear model, while the ribbon are the 95% confidence intervals of these linear models.
Forests 13 01456 g005
Table 1. Vegetation survey sample site information at the Ziwuling study area on the Chinese Loess Plateau.
Restoration
Age (Year)
Succession
Stage
Numbers
of Sites
Representative
Plants
0Agricultural land6Viola collina Besser; Agropyron cristatum (L.) Gaertn.
10Natural restoration of 10 years of grass6Bothriochloa ischaemum (L.) Keng; Artemisia chamaemelifolia Vill; Lespedeza bicolor Turcz.
20Natural restoration of 20 years of grass6Artemisia codonocephala Diels; Agrimonia pilosa Ledeb; Lespedeza bicolor Turcz.
40Shrub stage6Sophora davidii (Franch.) Pavol; Lespedeza bicolor Turcz; Agropyron cristatum (L.) Gaertn; Anemone chinensis Bunge.
70Pioneer arbor stage6Betula platyphylla Sukaczev; Spiraea salicifolia L.; Lespedeza bicolor Turcz; Carex lanceolata Boott.
120Sub-top stage6Pinus tabuliformis Carrière; Lespedeza bicolor Turcz; Carex lanceolata Boott.
135Sub-top to top transition stage6Pinus tabuliformis Carrière; Quercus mongolica Fisch. Ex Ledeb; Lespedeza bicolor Turcz; Carex lanceolata Boott.
150Top Stage6Quercus mongolica Fisch. Ex Ledeb; Lespedeza bicolor Turcz; Carex lanceolata Boott.
Table 2. Importance value and ecological niche breadth of selected 30 species at the Ziwuling study area on the Chinese Loess Plateau. Abbreviations: IV—importance value; Bi—ecological niche breadth.
No.HerbIV/%BiNo.WoodyIV/%Bi
1Carex lanceolata Boott14.4312.8016Lespedeza bicolor Turcz20.989.42
2Artemisia argyi H.Lév. & Vaniot8.71.0717Quercus mongolica Fisch. Ex Ledeb11.415.25
3Agrimonia pilosa Ledeb7.531.0718Sophora davidii (Franch.) Pavol5.674.36
4Miscanthus sinensis Andersson5.773.0119Spiraea salicifolia L.5.552.11
5Artemisia chamaemelifolia Vill.5.173.4920Pinus tabuliformis Carrière5.377.61
6Viola philippica Cav4.411.7021Acer tataricum subsp. ginnala (Maxim.) Wesm4.343.68
7Potentilla chinensis Ser3.13.4822Ostryopsis davidiana Decne4.322.67
8Bothriochloa ischaemum (L.) Keng2.672.2723Betula platyphylla Sukaczev45.96
9Aster hispidus Thunb2.542.6924Cotoneaster multiflorus Bunge3.633.34
10Artemisia lancea Vaniot2.213.8125Lonicera japonica Thunb3.236.21
11Viola collina Besser2.183.3826Campylotropis macrocarpa (Bunge) Rehder2.975.48
12Cyperus compressus L.1.841.4527Koelreuteria paniculata Laxm2.751.43
13Sophora flavescens Aiton1.832.4528Periploca sepium Bunge1.983.73
14Anemone chinensis Bunge1.762.2329Rubus parvifolius L.1.842.29
15Agropyron cristatum (L.) Gaertn1.713.7730Rhamnus utilis Decne1.521.54
Table 3. Overall association of the 30 dominant species at the Ziwuling study area on the Chinese Loess Plateau.
Life FormVariance Ratio (VR)Test Statistics (W) χ2(0.95,N), χ2(0.05,N)Test Results
Herb2.40 115.20 33.10, 65.17Significant association
Woody2.49 119.52 33.10, 65.17Significant association
Herb + Woody1.20 57.82 33.10, 65.17Not a significant association
Note: Herb + Woody denotes all associations formed by herbaceous and woody plants in this study.
Table 4. V values of interspecific association among the 30 species at the Ziwuling study area on the Chinese Loess Plateau.
Life FormPositive Association (p)Negative Association (N)p/N
Herb85204.25
Woody78272.89
Herb + Woody3171182.69
Table 5. Interspecific associations strength analysis among the 30 species at the Ziwuling study area on the Chinese Loess Plateau.
IndexTypeStrength of AssociationHerbWoodyHerb + Woody
Species Pair
Number
%Species Pair
Number
%Species Pair
Number
%
ACPositive associationAC ≥ 0.61211.431312.38388.74
0.2 ≤ AC < 0.63129.523028.577417.01
0 < AC < 0.21817.142019.059922.76
No associationAC = 000.0010.9530.69
Negative association−0.2 ≤ AC < 087.621817.145913.56
−0.6 ≤ AC < −0.22321.912120.009321.38
AC < −0.61312.3821.916915.86
PC 0.5 ≤ PC < 165.711110.48225.06
0 < PC < 0.58883.819388.5736082.76
PC = 01110.4810.955312.18
Publisher’s Note: MDPI stays neutral with regard to jurisdictional claims in published maps and institutional affiliations.

