1. Introduction
Solid wood is an important engineering material, and how to detect the material has long been the focus of research [
1]. The color of a solid wood floor is an important index used to evaluate a solid wood floor surface [
2,
3]. In the production of floors, it is important to consider whether there is a problem in terms of product quality caused by a large color change on the same floor. When laying a solid wood floor, it is also necessary to fully consider the color coordination and consistency of the solid wood floor in the laying area. Traditional color sorting methods mostly rely on manual identification, and in manual color sorting it is difficult to achieve long-term continuous sorting, and the method becomes prone to confusion with an increase in working time. At present, the color sorting of solid wood floors is still based on categories, to divide batches of solid wood panels into specific classes.
As an important feature of vision, color has always been a focus of machine vision research. The question of how to extract and express color features and then classify images according to the obtained color features is a hot topic in machine vision research. Bechar [
4] et al. calculated the color mean, first-order statistics, contrast and Hu Moments, along with intensity, in different color spaces, and used supervised learning to classify pixels and to realize cytological image segmentation and automatic leukocyte identification. Benco [
5] et al. compared the texture feature extraction results of the 1D GLCM approach, using SVM classification and deep learning methods on color images from two different datasets (the Outex and Vistex datasets). They proved that through the use of convolutional neural network classification on the large dataset, Outex, they were able to obtain results as high as 93.97%. Tan [
6] proposed an automatic extraction method of landscape image color features. Firstly, the image was enhanced, and the low-level color features were extracted from the landscape image library. Then, the support vector machine (SVM) and fuzzy c-means (FCM) were combined to extract the high-level color features to express the color of the landscape image.
The color of the board of the same tree species does not vary much, which brings a challenge to the color distinction of the solid wood board. The color of wood as an evaluation index has been studied for a long time; Kamperidou [
7] examined color change to draw some conclusions about chemical degradation of wood owing to heat treatment. For wood color feature extraction, Meints [
8] selected solid wood panel images to be analyzed using the CIELAB-color system, and proposed a light-reflection-depth (LRD) feature to describe the light transmittance of wood, thus helping to understand the wood color. Zhu [
9] et al. used the mean and variance of HSV space and Lab color space as features, used a genetic algorithm to select features and then used an extreme learning machine as a classifier to classify the selected feature vectors, so as to realize the classification of solid wood floors, and obtained 97.78% accuracy.
Deep learning has become a popular technique for image processing in recent years, enabling users to automatically extract the features of images and classify them [
10,
11,
12,
13]. With the development of deep learning, the Transformer method, referring to a deep neural network mainly based on a self-attention mechanism, has demonstrated a strong representation ability. This model was first applied to the field of natural language processing [
14], and it attracted the attention of researchers because it was not limited by the spatial induction bias of convolution neural networks [
15]. Researchers gradually applied it to the field of images [
16], using the Transformer model to analyze images after coding, developing a technique known as a Vision Transformer and obtaining good results in multiple image processing tasks.
The color index for a solid wood floor lacks clear quantitative indicators, so the color sorting of a solid wood floor is usually divided into limited classes. After manually extracting color features, the solid wood floor is classified via a machine learning method or deep learning method. However, since the solid wood floor images are used to divide the data set with classification as the goal, it is necessary when establishing the dataset to clearly divide the color types of the solid wood floors. However, it is common to encounter fuzzy zones between classes, and it is difficult to obtain a certain sequence of color depth and a shallow order within one class, which means there is not a clear solution to the problems related to the color index of solid wood floors.
In previous works [
17,
18], the xgboost classification model has been used to classify the colors of solid wood floors, and three color eigenvalues, namely the first moment of the L channel, the first moment of the b channel and the pixel value corresponding to the peak color histogram of the b channel, were used to realize the threefold classification of solid wood floors with 97% accuracy. However, in order to achieve greater freedom in the color classification of solid wood floors, the direct relationship between the color depth of a solid wood floor and human sensory perception must be examined in greater detail. In this study, we built upon the previous research through the establishment of a solid wood floor color depth sequence, corrected the color space used at present and sought a color index that was better suited to the human sensory perception of solid wood floor color depth, with the aim of providing a more convenient tool for the sorting of solid wood floor colors. The innovations of this paper are as follows. (a) A fast color sorting algorithm is used to realize the color sorting of solid wood floors; (b) an adaptive module is introduced to allow the neural network to adapt to all size images; (c) LightGBM, a convolutional neural network and a Vision Transformer are used to carry out color depth regression according to the sorted solid wood floor color depth dataset, and the color depth sorting is realized according to the regression value.
2. Materials and Methods
2.1. Data Collection
The solid wood floor image acquisition system was built as shown in
Figure 1, including a linear array color camera, two linear light sources and a conveyor belt. The specific parameters and models are shown in
Table 1.
In total, 108 pieces of 900 × 135 mm solid wood floors, made from pinnate pometia, provided by Company Dehua Tubao in China, passed through a set of radio switches on the conveyor belt to generate trigger signals. A linear array scanning camera, DALSA LA-GC-02K05B-00-R, was triggered for image acquisition. RGB images of solid wood floors of 18,000 × 2048 pixels in size were collected. The collected RGB images were preprocessed, and the edge detection of the solid wood floors was carried out. Four corners of the edges were extracted by a Harris corner detector, and then rectangular correction was carried out according to the corners to remove the background in the image and reduce the skew problem caused by the placement of the solid wood floors. Finally, complete background-free images of solid wood floors were obtained as shown in
Figure 2b, which shows 36 preprocessed images.
2.2. Color Representation of Solid Wood Floors
RGB is not a very suitable color space for human visual perception. There is a non-linear relationship between R, G and B channels and human visual perception. Therefore, the color space conversion of each collected solid wood floor image should be carried out, and the solid wood floor image should be converted from the RGB color space to the Lab color space and the HSV color space.
Color moments are good measures of color representation. First-order moments and second-order moments are calculated for each color channel. From the perspective of the calculation method, the first-order moment is the mean of the channel, and the second-order moment is the variance of the channel:
The color of the largest portion of the area in the solid wood floor often determines the color depth of the solid wood floor. Therefore, the pixel value corresponding to the peak value in the color histogram of the solid wood floor was taken as the index of the background color of the solid wood floor.
Given the nine channels L, a, b, H, S, V, R, G and B, and in each channel three color features fused into a 1 × 27 vector, they then performed the reduction of the dimensions of the solid wood floor image information.
2.3. Establishment of Datasets
Although the color space used was more suitable for human visual perception, in judgments about the color of solid wood floors, because the color can be warm or cold, there was still texture interference, which has an impact on people’s color depth perceptions. It is impossible to judge the color depth of a solid wood floor directly using a feature from only one channel.
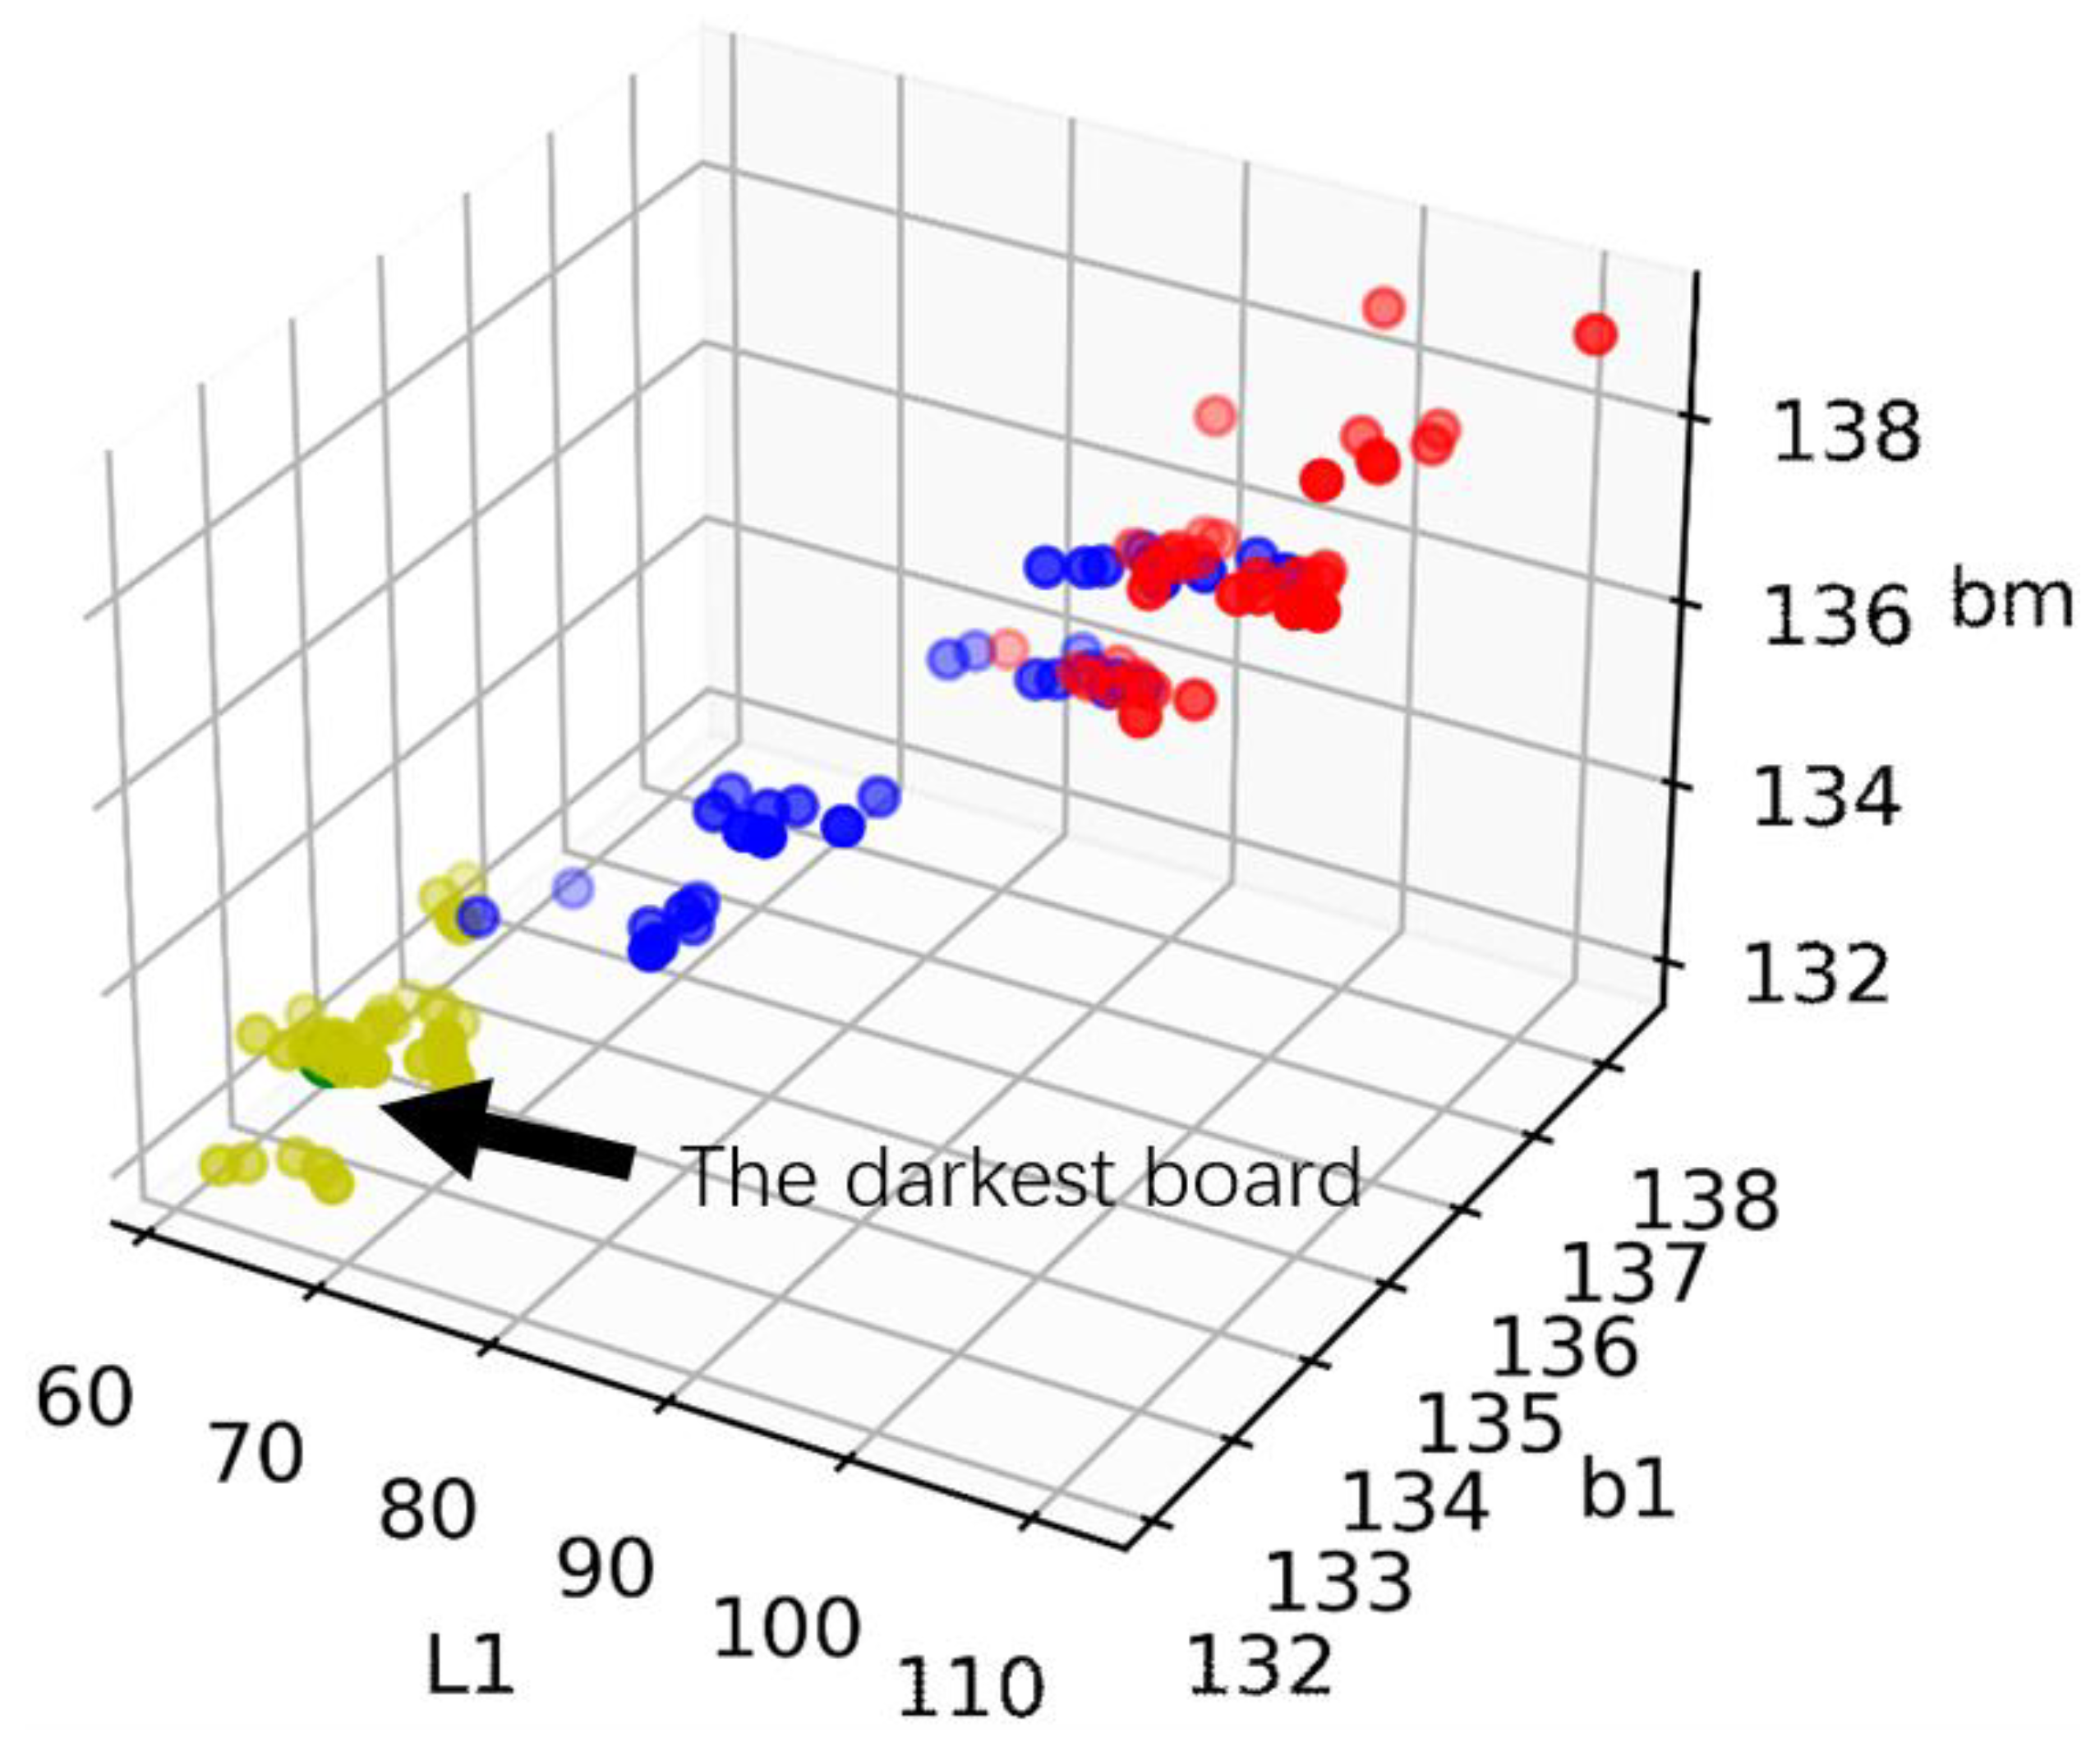
Figure 3 shows the distribution of three types of solid wood floors in Lab space, provided by solid wood floor manufacturers, where L1 represents the first moment of the L channel, b1 represents the first moment of the b channel, bm represents the pixel value corresponding to the peak color histogram of the b channel, and where yellow represents a dark solid wood floor, blue represents a medium-colored solid wood floor and red represents a light-colored solid wood floor.
When sorting the colors of artificial solid wood floors, in order to avoid confusion in color depth comparisons caused by the colors of multiple solid wood floors, in our method only two solid wood floors were compared in terms of their color depth each time, in order to achieve accurate color depth judgment. The color depth comparison software platform shown in the following figure was built to compare the colors of solid wood floors. All the image file names of solid wood floors to be compared were displayed on the rightmost side of the interface. The specific dataset production process is shown in
Figure 4b.
The time-complexity of the artificial color sorting algorithm used was O (nlogn), which means it is a fast-sorting algorithm and this reduces the work of artificial sorting. At the same time, since the company provided the color categories of the solid wood floors, the algorithm can sort according to the color category first, and then sort within the given color category, which further reduces the work involved in artificial sorting. In order to verify the robustness of the algorithm, 98 solid wood floor images were randomly selected for sorting, and the remaining 10 images were used as the test set to verify the effect of the algorithm.
Figure 5 shows the solid wood floor images with good color depth and complete mosaics.
If there are non-uniform solid wood floor sequence samples, as shown in
Figure 6a, labels can be set by using non-uniform interpolation methods, as shown in
Figure 6b, where the boundary point is the boundary point of the large color class of a solid wood floor, the shallowest solid wood floor color in relation to the boundary point is uniformly interpolated in 0–0.33 according to the number of solid wood floor samples, the boundary point 1 to the boundary point 2 is uniformly interpolated in 0.33–0.67 according to the number of solid wood floor samples and the boundary point 2 to the deepest solid wood floor color is uniformly interpolated in 0.67–1 according to the number of solid wood floor samples.
Because the numbers of the three kinds of solid wood floor color provided by solid wood floor manufacturers were equivalent, and the distribution was relatively uniform in the dark and shallow areas of color, the uniform value could thus be assigned directly in the order of arrangement, so that the shallowest color depth was zero, the deepest color depth was one and the uniform interpolation was between zero and one. The color depth value of each image was set to the value obtained via interpolation.
We randomly selected 80 images as the training set, 18 images as the validation set and 10 images previously designated as the test set, as shown in
Figure 7.
Since convolutional neural networks and Vision Transformers are data-hungry types of algorithms, the above dataset needs to be expanded. Considering that the aim of this work is to sort the color depth, the image should not be revised to expand the dataset when the dataset is expanded. Therefore, the images in the existing training set were rotated, mirrored and Gaussian noise and salt and pepper noise were added to realize the expansion of the image dataset of the solid wood floor surface. Finally, the image dataset of the solid wood floor surfaces was expanded to 13 times the size of the original.
2.4. Color Depth Regression Model of GBDT Solid Wood Floors Based on the LightGBM Framework
LightGBM is a gradient boosting framework, using a decision tree based on a learning algorithm, which has faster training efficiency, better accuracy and lower memory usage [
19]. LightGBM mainly uses the decision tree algorithm based on histograms to discretize the continuous floating-point eigenvalue into k integers. At the same time, a histogram with width k is constructed. When traversing the data, the histogram is used for statistical accumulation. Then, according to the discrete value of the histogram, the optimal segmentation point of the tree is found. The histogram is used for the acceleration of difference, and then sparse feature optimization can be carried out [
20].
The training dataset is expressed as follows:
where
is the color feature vector of the
ith solid wood floor image and
is the color depth value of the
ith solid wood floor image.
The space composed of solid wood floor feature vectors is divided into K disjoint color space regions
, and there is a certain constant
in each region. Thus, the regression tree can be established as follows:
We establish a boosting tree model:
Solving
by means of the forward distribution algorithm
The root mean square error is used as the loss function of the model.
The residual
is used for fitting of the data from the current model. The above formula can be written as:
Given the current model
at the
mth step of the forward distribution algorithm, the
of the
mth tree is calculated using the following formula:
We then calculate the residuals for each feature vector:
By fitting the regression tree with , the leaf node region of the mth tree is obtained.
We calculate
for
:
We can then update the regression tree model
and thus obtain the lifting tree model
after M iterations: [
21]
The color feature values of the collected images are extracted and input into the model. After training the LGBM model, the color depth index regression of solid wood floors is realized.
2.5. Color Depth Regression Model of Solid Wood Floors Based on Deep Learning
Deep learning can automatically extract the features of images by means of a convolutional neural network and back-propagation, so as to realize the classification of images. However, convolutional neural networks often require a specific size of the input image due to the presence of the full connection layer.
2.5.1. Size-Adaptive Convolutional Neural Network Densenet
Densenet is a structure that has been successfully used in deep learning [
22]. In order to solve the problem of the vanishing gradient caused by the deepening of network layers in deep learning, it connects each convolution block by means of tight connections, strengthens the transmission of features, makes more effective use of features and reduces the number of parameters.
The full connection layer in Densenet121 needs to input images of specific sizes, and the convolution operation often uses the symmetric convolution of the square, whereas solid wood floors are often rectangular with an unequal length and width. The direct scaling of the image to a square will greatly affect the information in the original image, and the information in the long direction will be compressed compared with that in the short direction, resulting in a lack of information. Therefore, on the basis of Densenet121, an adaptive pooling layer is added to the output layer, and the feature pool obtained by means of the final convolution is transformed into 1024 features, and then the color depth value is output by the full connection layer. Thus, the full-scale solid wood floor image input and the regression of the color depth of solid wood floors are realized. The improved Densenet121 network structure is shown in
Figure 8.
2.5.2. Size-Adaptive Vision Transformer
A Vision Transformer, as an alternative to convolutional neural networks, is widely used in visual tasks, and generally divides images into many small blocks as the patch input, which also means that the size of the input image must be specified. In order to solve this problem, it is also necessary to use convolutional neural networks and pooling operations to unify the size of the input image, and then to use the transformer structure to predict the color depth of the solid wood floor image after packaging. The network structure is shown in
Figure 9.
3. Results
Using HuberLoss [
23] as the loss function and SGD as the optimizer, the image is input into the neural network for training. When the loss function converges, the training is completed. The training loss curve is shown in
Figure 10. The prediction results obtained using the training set are shown in
Figure 11. The
y-axis is the predicted value of the color depths of the solid wood floors, and the x-axis is the color depth value obtained via interpolation in the production of the dataset.
When training on the training set, Densenet121 converged much faster than the Vision Transformer, but the final minimum loss of the Vision Transformer was smaller than that of Densenet121. When training to 39 steps, the loss value of Densenet121 reached a minimum of 0.02, whereas the loss of the Vision Transformer reached a minimum of 0.01 at 856. Under the same loss function and optimizer, the Vision Transformer showed a better color feature extraction ability than Densenet121.
The prediction results obtained using the validation set are shown in
Figure 12. The
x-axis is the predicted value of the color depths of the solid wood floors, and the
y-axis is the color depth value obtained via interpolation in the production of the dataset. Using the verification set, LGBM and the Vision Transformer model showed good prediction results. Some of the prediction results of Densenet121 were biased, but the overall prediction results were concentrated around the regression line. The MAE (mean absolute error), RMSE (root mean square error), R2 and MSE (mean squared error) values of the true and predicted values in the validation set are shown in
Table 2, LGBM’s statistical magnitude performed significantly better than other algorithms, with Densenet121 slightly inferior to Vision Transformer.
According to the color depth values of the solid wood floors, the sorting results of solid wood floors in the validation set are shown in
Figure 13. Corresponding to the prediction results shown in
Figure 12, all the three algorithms were able to identify the solid wood floors with the deepest sensory color according to human perception. However, some light colors were predicted to be deep in the Densenet121 sorting process, which eventually led to unsatisfactory sorting results (marked by red lines).
The images of the test set were input into the trained model, and the color depth values were sorted according to the obtained color depth values. As shown in
Figure 14, the color depth sorting accomplished using LGBM was the most consistent with human perception, and the performance of the Vision Transformer was in line with human perception as a whole. However, there was a color sorting error in relation to solid wood floors (marked by red lines), whereas the performance of Densent121 was more chaotic, and the robustness of the algorithm exhibited some problems.
All the images of solid wood floors (a total of 108) were regressed according to their color depth values, and then sorted according to their color depth values. The sorting results are shown in
Figure 15. The sorting effect of LGBM was the most accurate, and there were some misjudgments in the Vision Transformer and Densener121 models, resulting in a sense of disharmony that was contrary to human perception in the sorting results. In general, the Vision Transformer performed better than Densenet121.
4. Discussion and Conclusions
As a product used in interior decoration, the aesthetic value of solid wood floors is likely to be affected by the subjective feelings of customers, and different people have different subjective visual standards. In particular, color, as a feature that is difficult to describe, is likely to be affected by external conditions. Different visual feelings will be produced under different lighting conditions. Decoration using solid wood floors often requires input from professional designers. Based on the combination of traditional machine vision color features and machine learning technologies, as well as deep learning technology, in this paper we established a color knowledge base of solid wood floor images, and used different inference engines to describe the color characteristics of solid wood floors, so as to realize the color sorting of these solid wood floors.
From the perspective of the human senses, the binary method was used to make the dataset. The time complexity of this method was O (nlogn), and the group sorting was carried out, which greatly reduced the work involved in putting together the dataset of solid wood floor color depth values. Then, the color depth mapping was carried out according to the color change density, and a more objective color depth index of solid wood floors was established, which laid a reliable foundation for the subsequent regression task. The method proposed in this paper can grade the solid wood floor according to the color more flexibly, and use the unified color depth value to sort the color of the solid wood floor, thus breaking the indirectness of the original classification methods that requires multiple eigenvalues, which can be directly used to characterize the color depth of the solid wood floor. Through machine vision technology, the color depth regression of wood flooring of the same tree species is realized, and the demand of floor manufacturers for the color consistency of solid wood flooring is realized. There is a practical value for solid wood furniture, which can achieve the color harmony of the overall decoration environment.
It is worth noting that the performance of the deep learning algorithm used in this paper was not as good as that of the machine learning method in the case of the final test set. The reason for this is that the original dataset was not sufficient, and the color distribution intervals were not adequate, meaning that the color depth values obtained via interpolation were not accurate, and the accuracy could not be further improved when the direction propagation calculation losses of the model were analyzed. The deep learning algorithm obtained relatively excellent color sorting results on the verification set, which proves that this method has certain applicability in the color sorting of solid wood floor images.


