Article

Audio-Visual Analysis of Visitors’ Landscape Preference for City Parks: A Case Study from Zhangzhou, China

School of Biological Science and Biotechnology, Minnan Normal University, Zhangzhou 363000, China
*
Author to whom correspondence should be addressed.
Forests 2022, 13(9), 1376; https://doi.org/10.3390/f13091376
Submission received: 4 August 2022 / Revised: 19 August 2022 / Accepted: 25 August 2022 / Published: 28 August 2022
(This article belongs to the Special Issue Soundscape in Urban Forests)

Abstract

:
Soundscape perception is increasingly recognized as an important part of landscape preference and environmental experience. However, few studies have juxtaposed visual landscape preference and soundscape preference to compare their contributions to overall landscape preference. This paper aims to quantify and compare the contribution of audiovisual perception to visitors’ overall park landscape preference. The landscape preferences of visitors at seven sample sites in a city park were investigated through field questionnaires in three dimensions: visual landscape, acoustic landscape, and audiovisual landscape. The results showed that visitors’ visual landscape preference (VLP = 7.53) was generally higher than soundscape preference (SP = 7.08), while the influence of auditory preference (57%) on overall landscape preference (OLP) was found to be greater than that of visual preference (43%). The ratio of audio/visual contribution to the overall landscape preference decreased as the average sound level of the sample sites increased. Of all the population characteristics, only the educational level (sig = 0.034) could be used as an effective predictor of OLP (Impact coefficient = −0.103). In addition, older visitors rated OLP lower than young visitors, and females rated OLP lower than males. It was found that visual harmony, color richness, color contrast, plant coverage, and plant diversity were the main visual landscape attributes that influenced visitors’ visual preferences, while acoustic harmony, quietness, sound vitality, and acoustic richness were the main soundscape attributes that impacts visitors’ auditory preference. The results of this study may be useful for park landscape design and regeneration.

1. Introduction

Studies have shown that urban forest parks are effective in reducing stress [1,2,3], restoring attention [4], and improving physical and mental health [5,6,7,8] through the process of sensory interaction between visitors and nature in the city. Therefore, the planning and design of urban forest parks are generally valued by policy makers and have been built in large numbers in the context of ecological civilization and sustainable development. However, it is worth noting that the health performance of the park is influenced by visitation frequency, which in turn depends on the impact of visitors’ sensory experience and satisfaction with urban forest parks [9,10].
Visitors’ landscape experience is a multisensory and comprehensive experience [11]. However, visual perception has long been considered to dominate all other human sensory perceptions [12,13], particularly in the field of urban landscape planning and design practices as well as related scientific research. By contrast, nonvisual design elements have been largely overlooked due to their intangible nature [11,14]. Traditionally, the main consideration of auditory perception and sound has been limited to measures to reduce, control and manage noise [15,16,17,18]. In this context, the rich information and specific implications of sound [19] and their important impact on human perception and experience [16,20,21] have been mostly ignored. This continued until the late 1960s when the soundscape concept was introduced by R. Murray Schafer [22]. Based on the concept of “soundscape”, the acoustic environment can be treated as a kind of resource [23] and the acoustic aspects of urban green space can be regarded as similar to the visual aspects of design [24].
In fact, in terms of visual aspects alone, visual preference research has undergone a paradigm shift from single-attribute to multiple-attribute interaction. Most landscape preference studies in the past have only analyzed the effect of a single visual landscape attribute on landscape preference, and it is often difficult to obtain consistent results between different studies using this research paradigm [25,26,27], sometimes even obtaining completely opposite results [28,29]. With updated research tools, especially the introduction of psychological research methods, including EEG techniques [30,31] and eye-tracking [32,33,34], researchers have been able to gain a deeper and more comprehensive understanding of the relationship between visual landscape attributes and landscape preferences. For example, Liu et al. used eye-tracking technology to study the effect of landscape complexity on landscape preferences in different types of environments [34]. Zhang et al. explored the effects of the interaction of multiple visual attributes, including openness, richness, order, and depth on landscape preferences [35].
Following this diversified and integrated research direction, the interactive, multisensory, and holistic nature of landscape perception has begun to receive more attention in recent years [16,36,37,38,39,40]. Some attention has been paid to the effects of audio-visual interaction on landscape perception, including the influence of visual information on auditory perception [15,41,42] and the impact of sound elements on visual perception [20,39,43]. However, most audio-visual interaction studies do not give equal importance to visual and auditory perception, treating visual perception as the main object of study and auditory perception as one of its influencing factors [20,21,43,44]. One of the most important reasons for this approach is that vision is the most important sensory channel through which humans obtain most of their environmental information (approximately 80% of total information) [45,46]. In any case, does this emphasis necessarily imply that visual perception also has an overwhelming advantage over other human sensory perception in people’s perception of landscape and experience of the environment?
In response to the above question, an indoor landscape preference experiment with 63 students as subjects was conducted in a previous study [47]. Participants were asked to rate their preference for six visual-only, six audio-only, and thirty-six combined audio-visual recordings of six different types of landscapes, respectively. That research concluded that “under certain conditions, the contribution of auditory preferences to landscape preferences can largely exceed visual preferences”. However, the conclusions drawn under laboratory conditions must be verified in real-world scenarios, and the conditions of their application and scope of application should be further clarified. In this context, this paper aims to (1) compare and validate the contributions of visitors’ visual and auditory preferences to overall landscape preferences (validating previous research findings), (2) analyze the main influencing factors of visitors’ visual and auditory preferences, and (3) establish a model for predicting landscape preferences in urban parks that considers both visual and audio perception. To achieve this goal, an on-site questionnaire survey was performed in a city park with 210 visitors. The relationship between visual preference and overall landscape preference, as well as the relationship between audio preference and overall landscape preference, was first examined. Their respective contributions to landscape preference were then measured, and the main influencing factors of visitors’ visual preference and audio preference were analyzed.

2. Method

2.1. Study Area and Sample Sites

Zhongshan Park, formerly known as the 1st Park of Zhangzhou City, covers an area of about 45,000 square meters and is situated at the intersection of Xinhua West Road and Yan’an South Road, Zhangzhou City, Fujian Province. The park is adjacent to the ancient city of Zhangzhou (an important part of the Minnan Cultural and Ecological Reserve, one of the first national Cultural and Ecological Reserve in China). It is an urban park with both historical and cultural heritage and contemporary atmosphere. The landscape around the park consists of residential, commercial neighborhoods, cultural and tourist areas, and the related soundscape elements mainly include the sound of traffic, conversation, and footsteps. The park has a rich variety of visual landscape types with different types of sound elements. To improve the relevance of the research results and to take into account the heterogeneity of the park’s internal environment, we chose specific sample sites rather than the whole park as the objects of landscape evaluation. The functional division of the park, the composition of the visual and auditory landscapes, and the distribution of pedestrian flow and the main attractions were all considered when setting up the sample sites. Seven sample sites (SS1–SS7) were set up in this study: the Zhangzhou Liberation Memorial Pavilion, the Raining Corridor, the Promenade, the Dragon Column Pavilion, the Zhongshan Square, the Seven Star Pool, and the Senior Activity Room (Figure 1). Among them, the Liberation Memorial Pavilion and the Zhongshan Square are representatives of the historical and cultural landscape. The Raining corridor, the Promenade, and the Senior Activity Room are the main places for leisure activities. The Dragon Column Pavilion is a place for sports and fitness, and the Seven Star pool is the only water feature in the park.

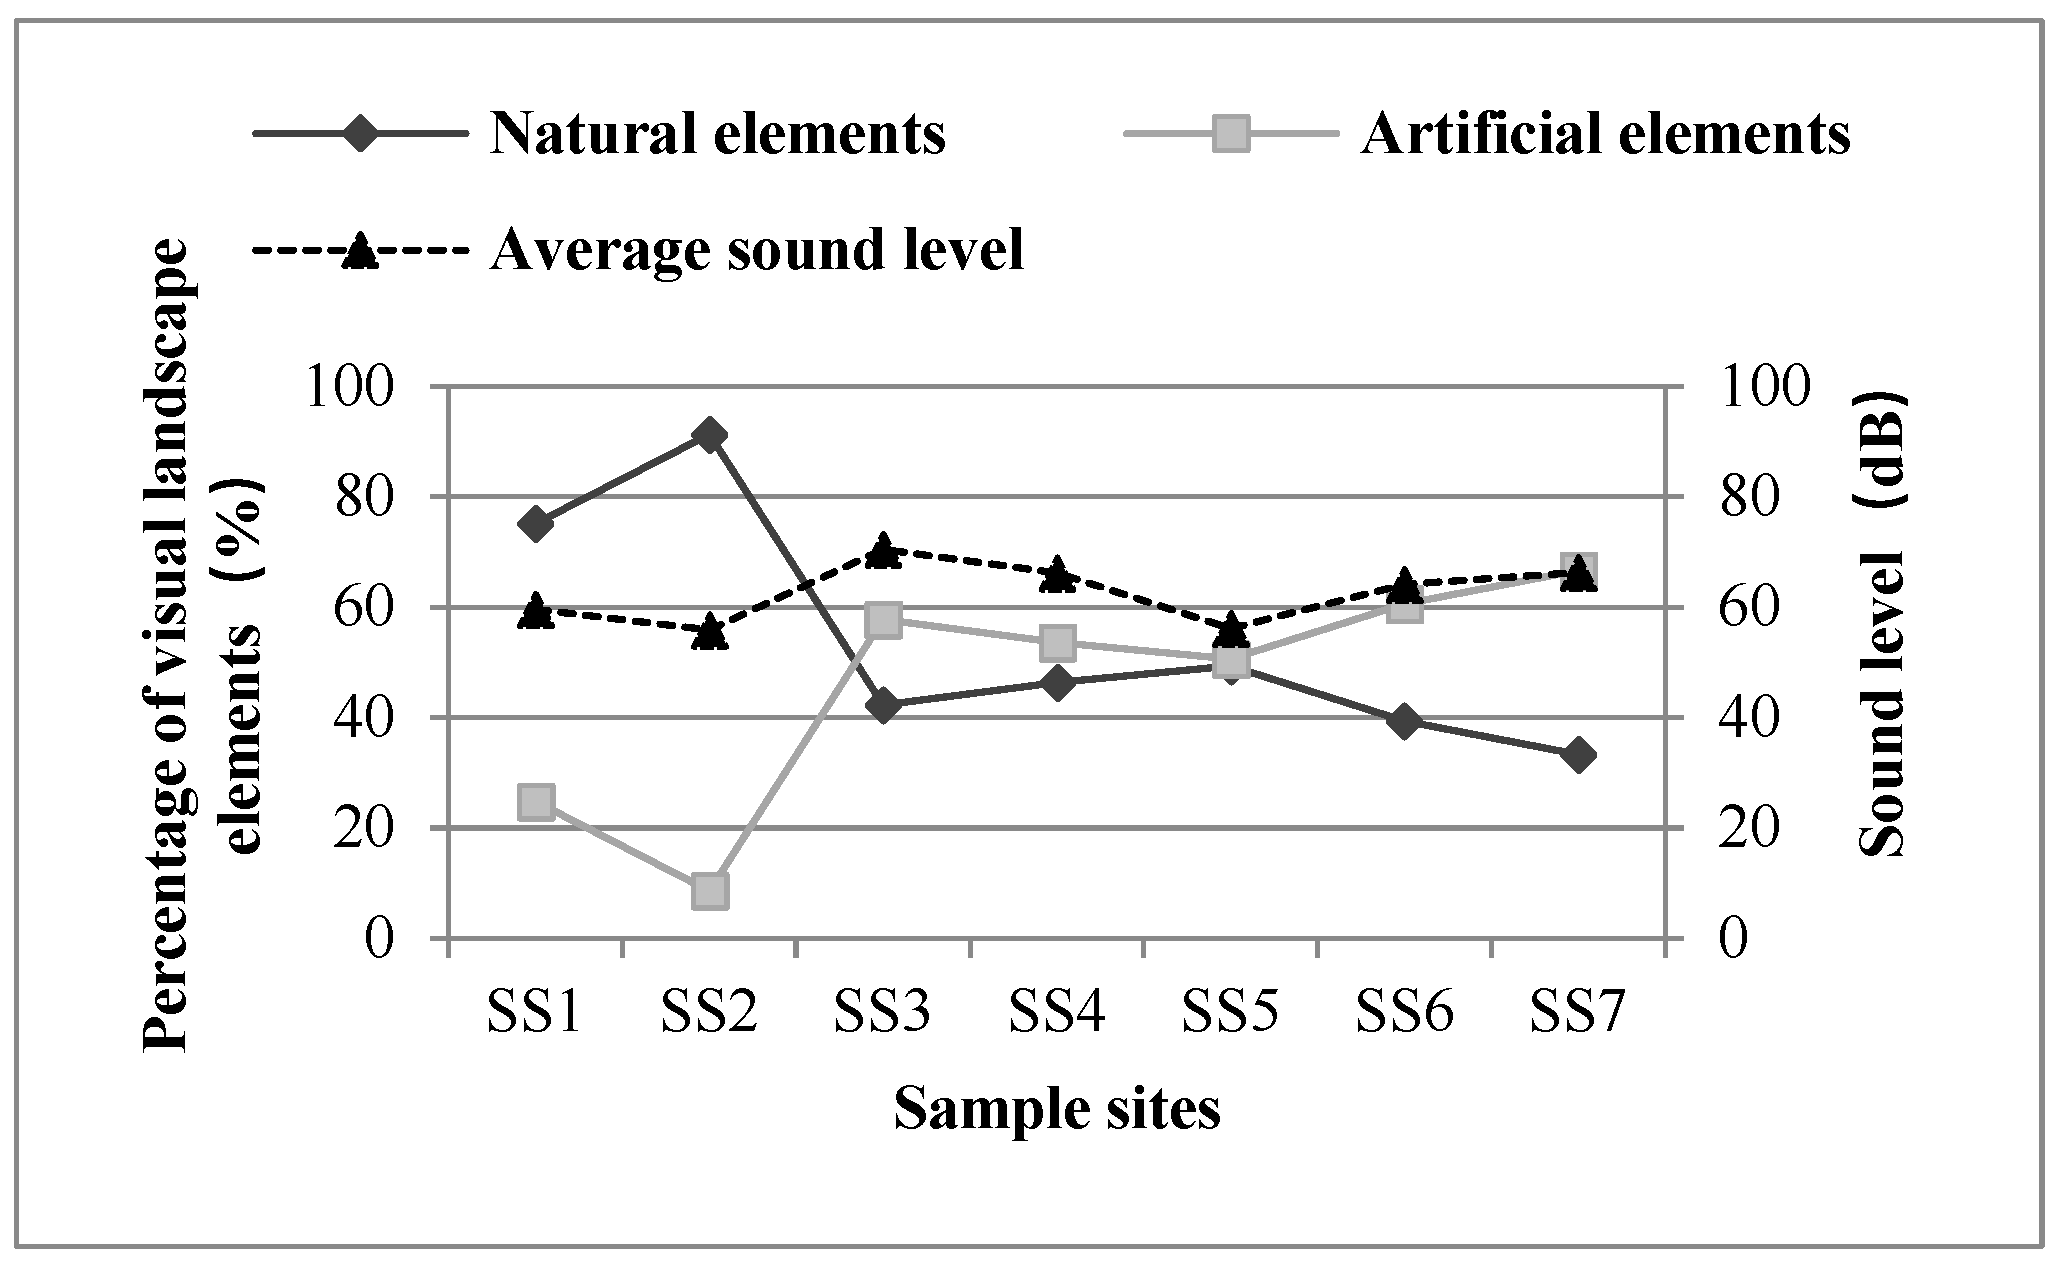
2.2. Survey of the Composition of Visual Landscape and Soundscape

Survey of the visual landscape included the recording and classification of visual landscape elements and the taking of 360-degree panoramic photos (Figure 1B). Visual landscape elements of the park can be classified into two types: natural landscape elements and artificial landscape elements [20,48]. Specifically, natural landscape elements include lakes, lawns, trees, and rocks, while artificial landscape elements cover sculptures, children’s play facilities, trash cans, buildings, and pavilions. On the basis of determining the visual landscape elements of the 360-degree panoramic photos, a 10 mm × 10 mm grid was superimposed on the panoramic photos, and the proportion of the visual landscape elements (excluding the sky) was calculated. The results showed that, except for SS1 and SS2, the proportion of natural elements was lower than 50% in all other five sample sites, indicating that the naturalness of the park was relatively low (Figure 2).
While carrying out the questionnaire survey, the investigators recorded the frequencies of the soundscape elements over a five-minute period and synchronously used the AWA6218A noise meter (1.5 m above the ground) to collect the sound level data at the sample sites. In the survey of soundscape elements, three types of sounds can be distinguished, namely natural sounds, living (man-made) sounds, and artificial sounds. Among them, natural sounds include wind, water and bird songs, living sounds include singing, talking, and playful sounds, and artificial sounds involve broadcasting and music. In general, the soundscape of the park is mainly composed of artificial sounds and living sounds. Specifically, music has the highest frequency among the artificial sounds, while singing and talking dominate the living sounds. In addition, the natural sounds are mainly birdsongs (Figure 3). Since the survey was conducted on a weekend with many visitors in the park, the average sound level in the park was also relatively high (55.9 dB–70.5 dB). By comparison, it was found that the average sound level at the sample sites was positively correlated with the proportion of artificial landscape elements. That is, the larger the proportion of artificial landscape elements, the higher the average sound level.

2.3. Questionnaire Design and Data Collection

The questionnaire consists of two parts: the collection of background information of visitors and the evaluation of park landscape perception (the main part of the questionnaire). The first part includes visitors’ gender, age, educational background and occupation, and the second part includes two parts: evaluation of perceived attributes of the audio-visual landscape and evaluation of visitors’ landscape preference.
Research had shown that people’s subjective evaluation had a certain “objectivity”, and the overall visual evaluation of landscape (visual landscape preference) was based on cognitive judgment of certain visual landscape attributes (visual perceptual attribute evaluation) [49]. Based on this, it can be reasonably inferred that the soundscape preference is a comprehensive evaluation based on the evaluation of certain soundscape perceptual attributes. It can be further inferred that the overall audiovisual landscape preference is a comprehensive evaluation based on the judgment of visual landscape preference and soundscape preference. Therefore, the main parts of the questionnaire were specifically designed as follows: (1) Perceived Visual Landscape Attributes (PVLA) and Perceived Soundscape Attributes (PSA); (2) Visual Landscape Preference (VLP) and Soundscape Preference (SP); and (3) Audiovisual Overall Landscape Preference (OLP). VLP refers to the visitor’s preference rating of the visual landscape, SP is related to the visitor’s preference of the soundscape, and OLP is the visitor’s overall rating of the landscape from both visual and audio aspects. In this questionnaire, participants were first asked to evaluate the PVLA and PSA of the sample sites, then to assign values to the VLP and SP of the sample sites respectively, and finally to evaluate the OLP for each sample site. Based on the systematic review of literature [19,34,35,49,50,51,52,53] and the actual situation of Zhongshan Park, a total of 16 audiovisual landscape perception attribute indicators were selected (11 visual landscape perception attribute indicators and five soundscape perception attribute indicators) (Table 1).
To quantify participants’ perception of the audiovisual landscape, a semantic differential method was used, in which the participants were asked to rate landscape and soundscape attributes using a set of opposite adjective pairs on a scale of 5 (1–5). Taking the naturalness indicator as an example, 1 = highly artificial, 2 = artificial, 3 = neither artificial nor natural, 4 = natural, and 5 = highly natural. The higher the score, the closer the rating is to the meaning of the adjective on the right. In addition, Visual Landscape Preference (VLP), Soundscape Preference (SP), and Overall Audio-visual Landscape Preference (OLP) were assigned on a 10-point scale (1 = least preferred, 10 = most preferred) based on the visitor’s sensory experience.
The questionnaire survey was conducted simultaneously at seven sample sites on Sunday, 26 March 2017, from 2:30–5:30 pm, during good weather (breeze). Thirty questionnaires were randomly distributed to park visitors at each sample site, and a total of 210 questionnaires were distributed (all returned), of which 203 were valid questionnaires (85 males and 118 females) (Table 2). Most participants had visited the park several times in a year and were familiar with the visual and acoustic landscape of the park. No sensory-related problems were reported by any of the respondents. Before completing the questionnaires, the researchers emphasized to the participants the importance of distinguishing between visual landscape, soundscape and overall audiovisual landscape when evaluating visitors’ landscape preferences.

2.4. Statistical Analysis

Statistical analysis was performed using IBM SPSS 20.0 software. First, the reliability and validity of the questionnaire data were tested. Second, correlation analysis was conducted to compare the relationship between VLP, SP and OLP, and stepwise multiple linear regression analysis was conducted to further compare the contribution of VLP and SP to OLP. Finally, correlation analysis was performed to further explore the relationships between VLP and PVLA as well as between SP and PSA.

3. Results

3.1. Reliability and Validity Test

First, the reliability of the questionnaire data was tested by the Cronbach’s alpha coefficient. The Cronbach’s alpha value was 0.873 (>0.7), indicating high reliability of the data. Then, the Kaiser–Meyer–Olkin (KMO) test was used to test the validity of the questionnaire data. The KMO measure of sampling adequacy was 0.712 (>0.7), so the validity test was acceptable.

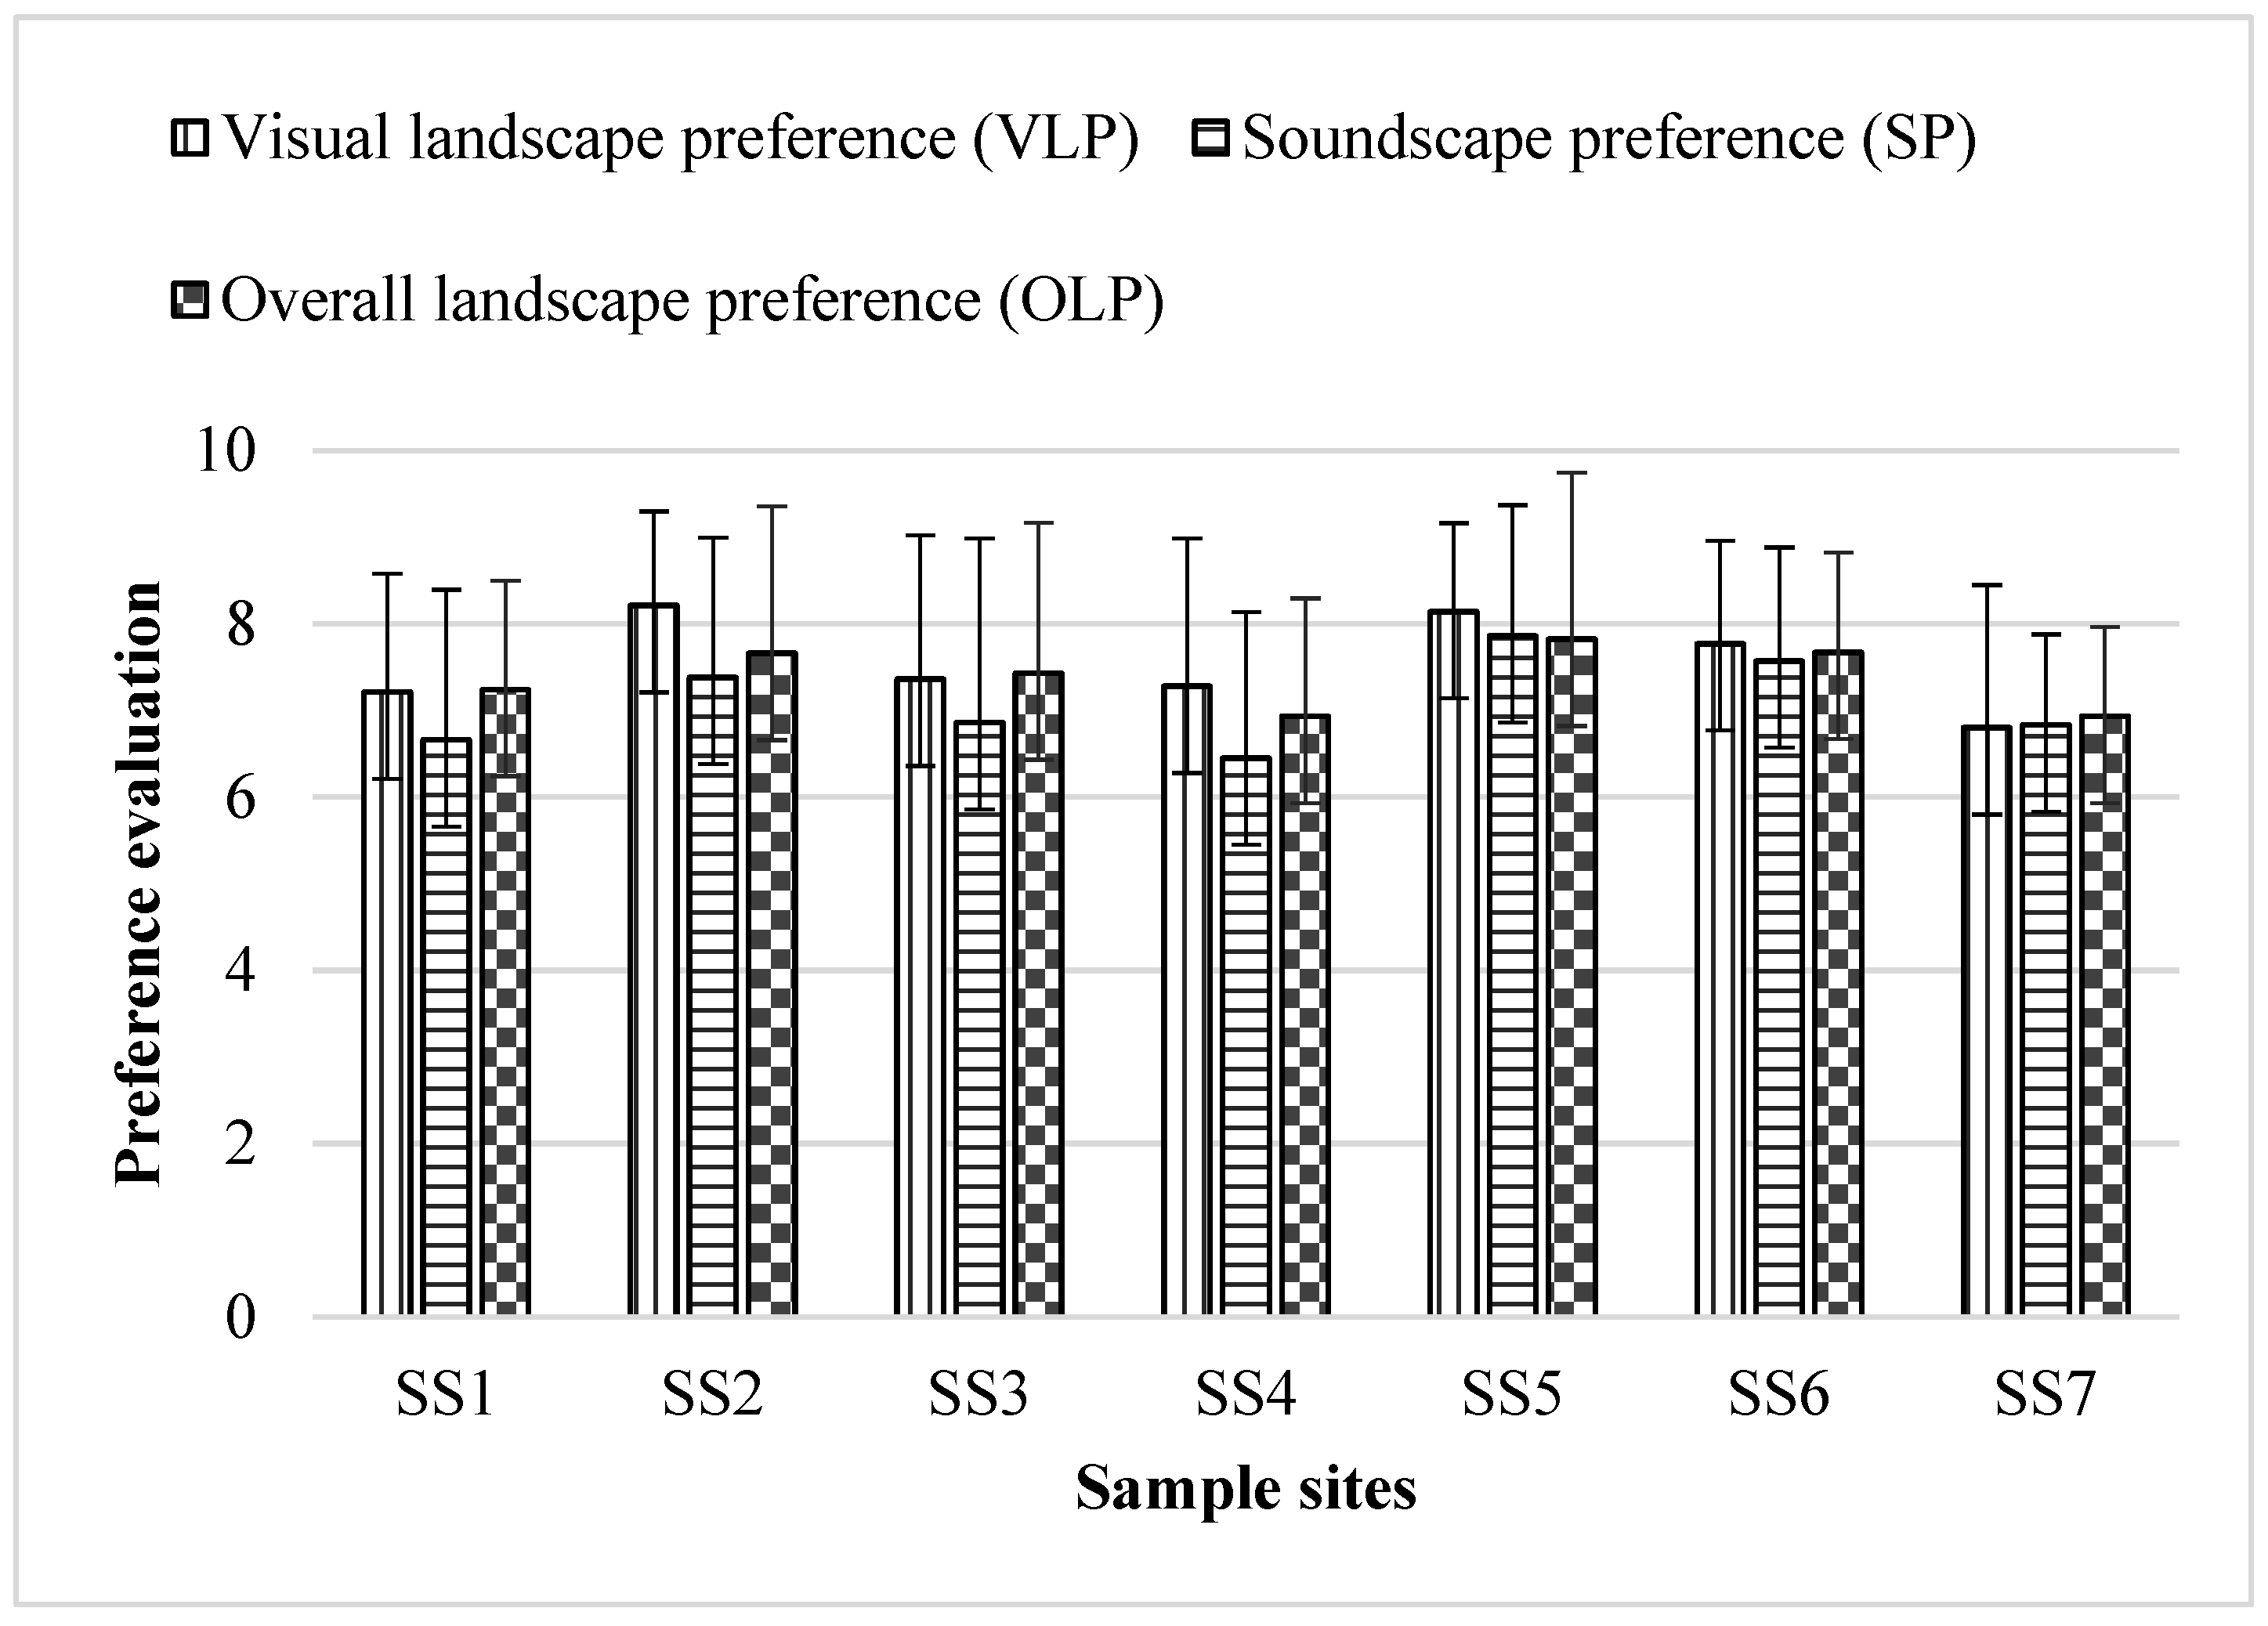
3.2. Visitors’ Evaluation of VLP, SP, and OLP

There was a large consistency among visitors’ visual landscape preference (VLP), soundscape preference (SP) and audiovisual overall landscape preference (OLP) for Zhongshan Park, with a mean value of about 7.0, indicating that visitors were not very satisfied with the sensory environment of the park (Figure 4). Most of the sample sites showed the following evaluation results: visual landscape preference (VLP = 7.53) > audio-visual overall landscape preference (OLP = 7.38) > soundscape preference (SP = 7.08), which indicated that the auditory experience was relatively weak in visitors’ park landscape experience. This result may be related to the fact that the current soundscape environmental design in parks has not received sufficient attention.

3.3. Relationship between VLP, SP, and OLP

The KS (Kolmogorov–Smirnov) test for the normality of the data distribution showed that the two-tailed asymptotic probability of the landscape preference data for most sample sites was p < 0.05, so the following correlation analysis was performed using Spearman correlation analysis. The Spearman correlation analysis of VLP, SP, and OLP (Table 3) revealed that the relationships of VLP-SP, VLP-OLP, and SP-OLP were significantly and positively correlated in all sample sites except VLP-SP in SS6, indicating that there was a significant intrinsic correlation between them, especially the correlation of VLP-OLP and SP-OLP. By further comparison, it was found that all sample sites (including the combination of all sample sites) except SS3 showed SP—OLP > VLP—OLP > VLP—SP, indicating that soundscape preference was generally higher than visual landscape preference in terms of correlation with audiovisual overall landscape preference.
To further quantify and compare the effects of VLP and SP on OLP, a stepwise multiple linear regression analysis was performed with VLP and SP as independent variables and OLP as the dependent variable. As showed in Table 4, VLP together with SP could effectively predict the value of OLP, and the fitness of the regression equations was higher than 60% for most sample sites (5 out of 7 sample sites, except for SS5 and SS7). When all sample sites (Total SS) were included, the predictive power of SP was higher than that of VLP, as 55.6% variance of OLP could be explained by SP compared to 44.4% by VLP, implying that the former contribution was about 1.25 times (0.486/0.388) higher than the latter. When examined separately, SP was still more effective than VLP in predicting OLP value. As in all seven linear regression equations, only one predictor of OLP was VLP (SS3), two predictors were SP (SS2 and SS7), and the remaining four predictors were VP together with SP (SS1, SS4, SS5, and SS6). Since three sample sites, SS2, SS3, and SS7, were all single predictors and could not be compared for predictive power of SP and VLP, these three sample sites were excluded. In the remaining four sample sites with VLP and SP as common predictors, the predictive power of SP for OLP was higher than that of VLP to varying degrees, especially the predictive power of SP for SS4 was about 3.1 times that of VLP (0.763/0.246). By comparing the audio/visual contribution ratio with sound level, and the audio/visual contribution ratio with the audio/visual preference ratio at the four remaining sample sites, it could be found that the trend of the audio/visual contribution ratio at each sample site was opposite to the direction of the average sound level (Figure 5) and was opposite to the direction of the audio/visual preference ratio (except for SS1) (Figure 6). In other words, the higher the average sound level or the audio/visual preference ratio, the smaller the audio/visual contribution ratio.

3.4. Effect of Visitor’s Individual Characteristics on OLP

To analyze the effects of visitor’s individual characteristics on OLP, using the whole dataset (total sample sites), a backward multiple linear regression analysis was performed with VLP, SP, gender (G), age (A), educational background (E), occupation (O), visit frequency (F), and length of stay (L) as independent variables and OLP as the dependent variable. As showed in Table 5, when the adjusted R2 reached its maximum value (0.593), only three individual characteristics, educational background (E), age (A), and gender (G), entered the multiple linear regression analysis, while occupation (O), visit frequency (F) and length of stay (L) were excluded. Educational background (E), age (A), and gender (G) showed negative correlation with OLP. Among them, only educational background (E) (sig = 0.034) could be used as an effective predictor of OLP (Impact coefficient = −0.103), while age (A) (sig = 0.059) and gender (G) (sig = 0.253) had no significant correlation with OLP.
Since the main task of this paper is to determine and compare the effects of VLP and SP on OLP, and the results of the regression analysis also show that the effects of population characteristics on OLP are small, the effects of population characteristics on VLP and SP, respectively, will not be analyzed in detail subsequently.

3.5. Influencing Factors of VLP and SP

To further analyze the main influencing factors of visitors’ visual preference and auditory preference, Spearman correlation analysis was conducted between VLP and PVLA as well as between SP and PSA. As showed in Table 6, all 11 PVLA indicators had significant positive correlations with visual landscape preference at the 0.01 level, with visual harmony having the most important influence on VLP, color composition of landscape elements (color richness and color contrast), vegetation status (plant coverage and plant diversity), openness, relief, and naturalness occupying intermediate position, while the number of landscape buildings, plant level change, and neatness had the least impact on VLP. In this regard, Tveit et al. identified nine key visual concepts in affecting visual landscape quality: stewardship, coherence, disturbance, historicity, visual scale, imageability, complexity, naturalness, and ephemera [50]. Among these concepts, coherence (visual harmony), visual scale (openness), and naturalness were validated by this study. Another important concept validated was complexity, which in the present study can be referred to as color richness, color contrast, plant coverage, and plant diversity. A possible difference between the findings of Tveit et al. [50] and the present study concerns the indicator of stewardship (neatness), as neatness had the least impact on VLP among all visual perception attributes in the present study. For the indicator of neatness, participants may have integrated aesthetic values with the ecological values of the visual landscape [54], and different groups may have completely different opinions [55].
Spearman correlation analysis between SP and PSA showed that all perceived attributes except acoustic interference were significantly correlated with SP at the level of 0.01, and the correlation coefficients were ranked as follows: acoustic harmony, quietness, sound vitality, and acoustic richness (Table 7). Therefore, for the soundscape of urban parks, acoustic harmony and quietness are the most important concerns of visitors. Interestingly, no negative correlation was found between acoustic interference and SP, which is different from the results of Sevenant and Antrop [56]. A possible explanation is that traffic noise did not have a significant negative impact on park visitors because human sounds from leisure activities play an important role in constructing the relevant soundscape in urban recreation areas [57].

4. Discussion

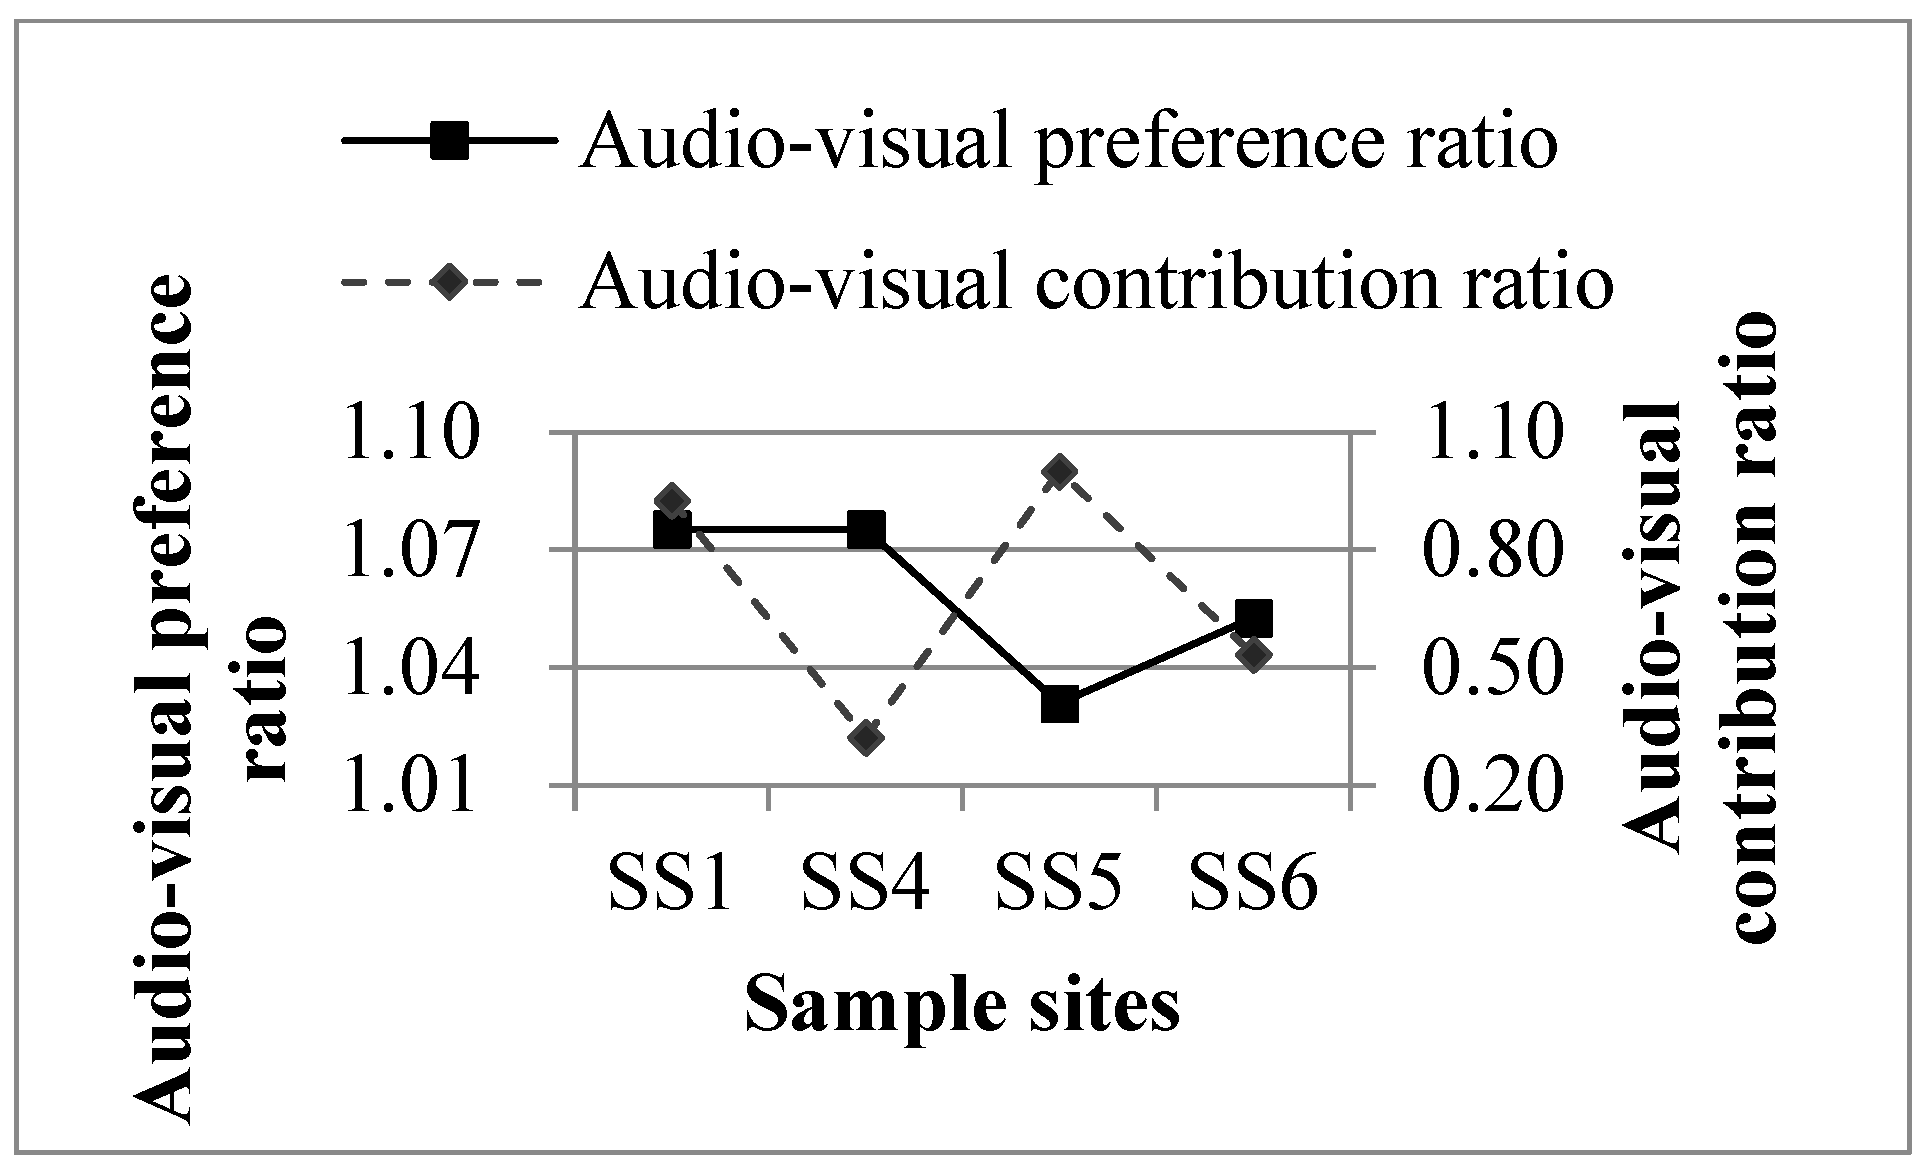
4.1. Comparison of the Contribution of Visual Landscape Preference and Soundscape Preference to Audiovisual Overall Landscape Preference

Most previous studies on landscape preference have focused on visual landscape preference or only explored the impact of soundscape perception on landscape preference [20,21,44,58], and few studies have juxtaposed visual landscape preference and soundscape preference to compare their contributions to audiovisual overall landscape preference. In terms of comparative research of audio-visual contribution, apart from the above-mentioned tests of landscape perception in laboratory settings [47], no relevant studies in field conditions have been reported to our knowledge. One of the main contents of this paper is to examine the findings of previous study under laboratory conditions that auditory preferences have a greater impact on landscape preference than visual preferences under certain conditions. The results of regression analysis showed the average contribution of the soundscape preference to audiovisual overall preference was about 1.25 times greater than that of visual landscape preference when differences between sample sites were not considered (data from seven sample sites were combined). Although this auditory/visual contribution ratio was not as high as that of the laboratory (4.5 times), it served as a valid support for the conclusion of the indoor study that “auditory preference has a greater impact on landscape preference than visual preference”. Furthermore, this result reaffirmed the important influence of soundscape perception on landscape experience [21,39,59,60,61].
In addition, this study found that the audio/visual contribution ratio decreased as the average sound level or the audio/visual preference ratio increased. It can be inferred that the research conclusion of this paper that “soundscape preference has a higher impact on audiovisual overall landscape preference than visual landscape preference” applies mainly to park objects with high sound level or low soundscape quality. Whether this conclusion applies to park objects with higher soundscape quality needs to be explored in further studies.
It should be noted that although the researchers repeatedly reminded respondents to distinguish between visual, auditory and audio-visual integrated scenes before and during questionnaire implementation, respondents may not be able to completely separate visual scenes from auditory scenes under field environmental conditions. That is, the influence of auditory scenes cannot be completely shielded when evaluating visual scenes and vice versa. This may imply that there is some degree of crossover and mutual interference between visual landscape preferences, soundscape preferences, and audiovisual overall landscape preferences. To what extent such interference affects visitors’ perceived landscape experience requires more in-depth research to evaluate.

4.2. Effect of Visitor’s Individual Characteristics on OLP

The effect of individual characteristics on OLP was extremely limited compared to SP and VLP. Among all the population characteristics, only educational background was an important factor influencing OLP scores, and there was a significant negative correlation between educational background and OLP. This result was somewhat in line with Wang and Zhao’s study [62], which found that education level and gender of respondents have a significant influence on preference assessment. In another study by Xu et al. [63], it was found that age and gender had an important impact on soundscape preference. However, this research found that age and gender had little important impact on OLP and were negatively correlated with OLP. It was revealed that the higher the education and the older the age, the lower the OLP value. Moreover, the value of OLP was lower for females than for males.
However, in any case, previous studies analyzing the influence of population characteristics on landscape preferences have focused on VLP and SP rather than OLP. Therefore, further research is needed to investigate the main population characteristics influencing OLP.

4.3. Main Influencing Factors of Visual Landscape Preference

4.3.1. Visual Harmony

The results of this study revealed that visual harmony had the strongest association with visual landscape preference among all the influencing factors of visual landscape preference. Visual harmony is mainly concerned with the harmony of the collocation (proportion) between different visual elements, and is an evaluation indicator that focuses more on the overall and comprehensive aesthetic perception [64], which may make visual harmony the closest to visual landscape preference to some extent and ultimately lead to the strongest correlation with visual landscape preference.

4.3.2. Neatness

Neatness is an indicator of the level of park management and maintenance. The results of Tveit et al. showed that maintenance management is one of the most important indicators of visual landscape evaluation [50]. A study by Zheng et al. showed that different groups had completely different opinions on neatness, with people from ecological backgrounds preferring wild natural landscapes and the general population preferring clean landscapes [55]. The respondents in this study mainly involved the general population, so neatness was second only to visual coordination in the ranking related to visual preference.

4.3.3. Color Composition

Color composition mainly refers to color richness and color contrast. This study found that, among these evaluation indicators affecting visual preference, the correlation between color composition and visual preference followed visual coordination and cleanliness as one of the most important indicators affecting visual landscape preference. Among them, color richness and color contrast ranked third and fifth, respectively (individual indicator ranking). The result is generally consistent with the findings of similar green spaces. In a study of Beijing Country Parks, Wang Ya-Juan found that the influence of color richness on landscape quality ranked second among seven landscape features [65]. In addition, the contribution of color contrast and color quantity ranked third and fourth, respectively, in the model for evaluating the aesthetic quality of rural green space landscape constructed by Shi Jiu-Xi et al. [66].

4.3.4. Naturalness

Most studies have shown that naturalness is one of the most important indicators of landscape preference [67], but some studies have also shown that the impact of naturalness on landscape preference is not always positive [68] and the relationship between the two is not always linearly positive [50]. In addition, the study of Sevenant and Antrop even stated that the degree of naturalness was not significantly indicative of overall preference for the landscape [56]. The present study has confirmed a significant influence on visual landscape preference, with perceived naturalness ranking fourth in affecting visual landscape preference.

4.3.5. Plant Diversity

Plant diversity is an important component of landscape diversity and is considered to be an important factor affecting landscape preference [69]. In this study, the impact of plant diversity ranked fifth in terms of its effect on visual landscape preference and was an important factor influencing visitors’ visual landscape preference.

4.4. Main Influencing Factors of Soundscape Preference

4.4.1. Sound Comfort

To some extent, sound comfort is also a relatively holistic and integrated feeling, closer in meaning to soundscape satisfaction. Studies have shown that sound comfort is not only highly correlated with soundscape preference [70], but also has a significant positive correlation with landscape evaluation [71]. This study also proved that sound comfort played an important role in soundscape preference evaluation, and it was the primary factor affecting soundscape preference.

4.4.2. Quietness

Quietness and acoustic vitality are considered to be the two main dimensions that elicit emotional responses in soundscapes [72]. Quiet environment plays an important role in people’s physical and mental recovery [73], so it is favored by people [74]. In addition, some studies have shown that quietness was closely related to landscape scenic beauty and recreational satisfaction [75], so quietness had an important impact on landscape perception. This study showed that the influence of quietness on soundscape preference was second only to sound comfort.

4.4.3. Acoustic Vitality

In this study, the effect of acoustic vitality ranked third after quietness as one of the two dimensions that evoke emotional responses to soundscapes. Acoustic vitality involves both sound organization (composition) and changes over time [72]. Several studies have shown a V-shaped distribution relationship between acoustic vitality and acoustic pleasantness, meaning that objects with high levels of acoustic vitality may be extremely pleasant or extremely unpleasant [76]. In other words, there is no simple linear relationship between acoustic vitality and acoustic pleasantness. However, this study showed a significant positive correlation between acoustic vitality and soundscape preference, which may be related to the fact that the park did not reach a high level of acoustic vitality.

4.4.4. Sound Richness

Sound richness and acoustic vitality are somewhat congruent in that both represent change, and sound richness will affect acoustic vitality to some extent. From the perspective of cognitive psychology, rich changes can provide possibilities for exploration, but richness also implies complexity, especially disorderly variation can increase cognitive difficulty, so moderate richness is preferred. However, it has also been shown that the higher the soundscape richness, the higher the soundscape pleasantness [77]. The present study showed a positive correlation between sound richness and soundscape preference, but the correlation between the two was relatively weak and ranked fourth.

4.4.5. Acoustic Interference

Interference was always seen as a negative indicator affecting the evaluation of landscape preference [43]. Interestingly, the acoustic interference in this study did not show a significant negative correlation with soundscape preference. A possible explanation is that the surrounding artificial noise, especially traffic noise, does not have a significant negative impact on visitors.

4.5. Inspiration for Park Landscape Planning and Design

Early park landscape planning and design generally focused on the design of visual elements and gave less consideration to visitors’ soundscape experience. As a result, the overall satisfaction of the park is not very high. In view of how to improve visitors’ satisfaction with park landscape, efforts can be made in the following aspects:
  • The quality of the acoustic environment should be regarded as an important design consideration and evaluation criterion. In the case of this study, soundscape preference had a greater impact on overall landscape preference than visual landscape preference in most sample sites. However, compared to the quality of the visual environment, the quality of soundscape environment was often in a relatively weak position, resulting in low visitor satisfaction with the overall landscape of the park. Therefore, the current soundscape environmental quality of parks needs to be optimized and improved.
  • The soundscape experience of visitors can be improved in four aspects: sound comfort, quietness, sound vitality, and sound richness. Priority should be given to enhancing the artistry and harmony of the combination of different soundscape elements to improve the acoustic comfort of the park (e.g., the promenade); optimizing the functional zoning of the park, making full use of topographic undulations and greenery isolation to improve the quietness of the overall park environment (e.g., the raining corridor and the elderly activity room); and, last but not least, introducing more waterscape sounds (fountains, water flow), birdsong and music that visitors love to enhance the sound vitality and soundscape richness of the park (e.g., the Longzhu Pavilion and the Zhongshan Square).
  • Further enhancing the visual experience of visitors. Specifically, it refers to increasing the coordination of visual elements (such as the isolation and coordination between the Seven Star Pool and the surrounding buildings of the park), improving the management and maintenance of the park (e.g., the elderly activity room), and optimizing the color design (improving color richness and color contrast, especially enriching the color of plants) (e.g., the Liberation Memorial Pavilion), enhancing the naturalness of the plant landscape, and increasing the diversity of plants (e.g., the promenade and the raining corridor).

5. Limitations and Future Work

This paper analyzed and quantitatively compared the influence of VLP and SP on OLP using seven sample sites of an urban forest park, and revealed the relationship pattern between audio/visual contribution ratio and sound level. However, this study only involved a single park with a relatively high degree of artificiality and a limited number of sample sites, so the subsequent study intends to include different types (different degrees of naturalization) of urban parks and more sample sites in order to investigate in depth the changes of the audio/visual contribution ratio and its relationship with different sound levels in different environments and scenes.

6. Conclusions

Landscape preference research has witnessed somewhat of a shift from a visual orientation to a more holistic and multisensory perspective. As part of the research effort towards multi-sensory landscape assessment, audio-visual interaction has received much research attention and has yielded fruitful results. However, the contribution of visitors’ audiovisual perception to the overall landscape preference under on-site conditions has not been clarified. Therefore, with Zhongshan Park as an example, this paper investigated visitors’ visual landscape preference, soundscape preference, and audiovisual overall landscape preference by using an on-site questionnaire survey. The main research findings were as follows: (1) Soundscape perception has an important impact on visitors’ park landscape experience, and acoustic environment quality should be taken as an important design consideration and evaluation criterion. In the evaluation of most sample sites, the contribution of visitors’ soundscape preference to the audiovisual overall preference was greater than that of visual preference (audio/visual contribution ratio < 1), and the audio/visual contribution ratio decreased as the average sound level of the sample sites increased. (2) Of all the population characteristics, only the educational background factor had a significant (negative) correlation with OLP. In addition, older visitors rated OLP lower than young visitors, and female visitors rated OLP lower than male visitors. (3) The main factors influencing visual landscape preference in parks are visual harmony, neatness, color composition, naturalness, and plant diversity, while the main factors affecting soundscape preference are acoustic comfort, quietness, acoustic vitality, and harmonic richness. (4) The improvement of Zhongshan Park’s visitor satisfaction should start from making up the “short board” of soundscape environment quality, while further optimizing and improving the quality of the parks’ visual landscape environment. (5) This paper only focuses on a single type of park research object, and future research will include different types of parks and more survey sample sites to explore the differences in landscape preference of different types of parks (sample sites) and the linkage between their audiovisuals, which will help push the study of landscape preference mechanism to a deeper level.

Author Contributions

Conceptualization, Y.G.; methodology, Y.G.; software, L.Z.; formal analysis, Y.G.; investigation, Y.G. and L.Z.; data curation, Y.G.; writing—original draft preparation, Y.G. and Y.Z.; writing—review and editing, L.Z.; supervision, Y.Z. All authors have read and agreed to the published version of the manuscript.

Funding

This project was supported by the Natural Science Foundation of Fujian, China (Grant No. 2016J01720) and the Young and Middle-aged Teachers Foundation of Fujian Provincial Education Department, China (Grant No. JAT160300).

Data Availability Statement

The data for this study can be accessed through the uploaded affiliated files or by contacting the relevant author.

Conflicts of Interest

The authors declare no conflict of interest.

References

  1. Jeremy, M.; Michael, M.; Andreea, A. Urban greenspace is associated with reduced psychological stress among adolescents: A Geographic Ecological Momentary Assessment (GEMA) analysis of activity space. Landsc. Urban Plan. 2018, 174, 1–9. [Google Scholar]
  2. Yao, W.; Zhang, X.; Gong, Q. The effect of exposure to the natural environment on stress reduction: A meta-analysis. Urban For. Urban Green. 2021, 57, 126932. [Google Scholar] [CrossRef]
  3. An, C.; Liu, J.; Liu, Q.; Liu, Y.; Fan, X.; Hu, Y. How Perceived Sensory Dimensions of Forest Park Are Associated with Stress Restoration in Beijing? Int. J. Environ. Res. Public Health 2022, 19, 883. [Google Scholar] [CrossRef]
  4. Huang, S.; Qi, J.; Li, W.; Dong, J.; van den Bosch, C.K. The contribution to stress recovery and attention restoration potential of exposure to urban green spaces in low-density residential areas. Int. J. Environ. Res. Public Health 2021, 18, 8713. [Google Scholar] [CrossRef] [PubMed]
  5. Shanahan, D.F.; Lin, B.B.; Bush, R.; Gaston, K.J.; Dean, J.H.; Barber, E.; Fuller, R.A. Toward improved public health outcomes from urban nature. Am. J. Public Health 2015, 105, 470–477. [Google Scholar] [CrossRef] [PubMed]
  6. Corazon, S.S.; Sidenius, U.; Poulsen, D.V.; Gramkow, M.C.; Stigsdotter, U.K. Psycho-physiological stress recovery in outdoor nature-based interventions: A systematic review of the past eight years of research. Int. J. Environ. Res. Public Health 2019, 16, 1711. [Google Scholar] [CrossRef] [PubMed]
  7. Vujcic, M.; Tomicevic-Dubljevic, J.; Zivojinovic, I.; Toskovic, O. Connection between urban green areas and visitors’ physical and mental well-being. Urban For. Urban Green. 2019, 40, 299–307. [Google Scholar] [CrossRef]
  8. Zeng, C.; Lin, W.; Li, N.; Wen, Y.; Wang, Y.; Jiang, W.; Zhang, J.; Zhong, H.; Chen, X.; Luo, W.; et al. Electroencephalography (EEG)-Based Neural Emotional Response to the Vegetation Density and Integrated Sound Environment in a Green Space. Forests 2021, 12, 1380. [Google Scholar] [CrossRef]
  9. Zhan, P.; Hu, G.; Han, R.L.; Kang, Y. Factors Influencing the Visitation and Revisitation of Urban Parks: A Case Study from Hangzhou, China. Sustainability 2021, 13, 10450. [Google Scholar] [CrossRef]
  10. Ma, K.W.; Mak, C.M.; Wong, H.M. Effects of environmental sound quality on soundscape preference in a public urban space. Appl. Acoust. 2021, 171, 107570. [Google Scholar] [CrossRef]
  11. Cassatella, C. Assessing visual and social perceptions of landscape. In Landscape Indicators; Springer: Dordrecht, The Netherlands, 2011; pp. 105–140. [Google Scholar]
  12. Southworth, M.F. The Sonic Environment of Cities. Bachelor’s Thesis, Massachusetts Institute of Technology, Cambridge, MA, USA, 1967. [Google Scholar]
  13. Hedfors, P.; Howell, P.G. Urban sonotopes: Towards a participatory design. Fin. J. Urban. Stud. 2011, 49, 24–43. [Google Scholar]
  14. Sowińska-Świerkosz, B.N.; Chmielewski, T.J. A new approach to the identification of Landscape Quality Objectives (LQOs) as a set of indicators. J. Environ. Manag. 2016, 184, 596–608. [Google Scholar] [CrossRef] [PubMed]
  15. Liu, J.; Kang, J.; Luo, T.; Behm, H.; Coppack, T. Spatiotemporal variability of soundscapes in a multiple functional urban area. Landsc. Urban Plan. 2013, 115, 1–9. [Google Scholar] [CrossRef]
  16. Preis, A.; Kociński, J.; Hafke-Dys, H.; Wrzosek, M. Audio-visual interactions in environment assessment. Sci. Total Environ. 2015, 523, 191–200. [Google Scholar] [CrossRef]
  17. Brown, A.L.; Gjestland, T.; Dubois, D. Acoustic environments and soundscapes. In Soundscape and the Built Environment; Kang, J., Schulte-Fortkamp, B., Eds.; CRC Press: Boca Raton, FL, USA, 2016; pp. 1–16. [Google Scholar]
  18. Rehan, R.M. The phonic identity of the city urban soundscape for sustainable spaces. HBRC J. 2016, 12, 337–349. [Google Scholar] [CrossRef]
  19. Axelsson, Ö.; Nilsson, M.E.; Berglund, B. A principal components model of soundscape perception. J. Acoust. Soc. Am. 2010, 128, 2836–2846. [Google Scholar] [CrossRef]
  20. Ren, X.; Kang, J. Effects of soundscape on rural landscape perception: Landscape visual aesthetic quality and landscape tranquillity of rural landscapes in China. Facilities 2015, 1, 2399–2404. [Google Scholar]
  21. Liu, J.; Xiong, Y.; Wang, Y.; Luo, T. Soundscape effects on visiting experience in city park: A case study in Fuzhou, China. Urban For. Urban Green. 2018, 31, 38–47. [Google Scholar] [CrossRef]
  22. Schafer, R.M. The New Soundscape; BMI Canada Limited: Toronto, ON, Canada, 1969. [Google Scholar]
  23. Brown, A.L. A review of progress in soundscapes and an approach to soundscape planning. Int. J. Acoust. Vib. 2012, 17, 73–81. [Google Scholar] [CrossRef]
  24. Brown, A.L.; Muhar, A. An approach to the acoustic design of outdoor space. J. Environ. Plann. Man. 2004, 47, 827–842. [Google Scholar] [CrossRef]
  25. Langemeyer, J.; Calcagni, F.; Baró, F. Mapping the intangible: Using geolocated social media data to examine landscape aesthetics. Land Use Policy 2018, 77, 542–552. [Google Scholar] [CrossRef]
  26. Polat, A.T.; Akay, A. Relationships between the visual preferences of urban recreation area users and various landscape design elements. Urban For. Urban Green. 2015, 14, 573–582. [Google Scholar] [CrossRef]
  27. Tagliafierro, C.; Longo, A.; Van Eetvelde, V.; Antrop, M.; Hutchinson, W.G. Landscape economic valuation by integrating landscape ecology into landscape economics. Environ. Sci. Policy 2013, 32, 26–36. [Google Scholar] [CrossRef]
  28. Shulin, S.H.I.; Zhonghua, G.O.U.; Leslie, H.C. How does enclosure influence environmental preferences? A cognitive study on urban public open spaces in Hong Kong. Sustain. Cities Soc. 2014, 13, 148–156. [Google Scholar]
  29. Tveit, M.S. Indicators of visual scale as predictors of landscape preference; a comparison between groups. J. Environ. Manag. 2009, 90, 2882–2888. [Google Scholar] [CrossRef] [PubMed]
  30. Chen, T.; Lang, W.; Li, X. Exploring the impact of urban green space on residents’ health in Guangzhou, China. J. Urban Plan. Dev. 2020, 146, 05019022. [Google Scholar] [CrossRef]
  31. Chen, Z.; He, Y.; Yu, Y. Attention restoration during environmental exposure via alpha-theta oscillations and synchronization. J. Environ. Psychol. 2020, 68, 101406. [Google Scholar] [CrossRef]
  32. Cottet, M.; Vaudor, L.; Tronchère, H.; Roux-Michollet, D.; Augendre, M.; Brault, V. Using gaze behavior to gain insights into the impacts of naturalness on city dwellers’ perceptions and valuation of a landscape. J. Environ. Psychol. 2018, 60, 9–20. [Google Scholar] [CrossRef]
  33. Liu, Y.; Hu, M.; Zhao, B. Audio-visual interactive evaluation of the forest landscape based on eye-tracking experiments. Urban For. Urban Green. 2019, 46, 126476. [Google Scholar] [CrossRef]
  34. Liu, Q.; Zhu, Z.; Zeng, X.; Zhuo, Z.; Ye, B.; Fang, L.; Huang, Q.; Lai, P. The impact of landscape complexity on preference ratings and eye fixation of various urban green space settings. Urban For. Urban Green. 2021, 66, 127411. [Google Scholar] [CrossRef]
  35. Zhang, G.; Yang, J.; Wu, G.; Hu, X. Exploring the interactive influence on landscape preference from multiple visual attributes: Openness, richness, order, and depth. Urban For. Urban Green. 2021, 65, 127363. [Google Scholar] [CrossRef]
  36. Carles, J.; Bernáldez, F.; Lucio, J.D. Audio-visual interactions and soundscape preferences. Landsc. Res. 1992, 17, 52–56. [Google Scholar] [CrossRef]
  37. Gobster, P.H. Development of ecological aesthetics in the West: A landscape perception and assessment perspective. Acad. Res. 2010, 4, 2–12. [Google Scholar]
  38. Lindquist, M.; Lange, E. Sensory aspects of simulation and representation in landscape and environmental planning: A soundscape perspective. In Innovative Technologies in Urban Mapping; Springer: Cham, Switzerland, 2014; pp. 93–106. [Google Scholar]
  39. Lindquist, M.; Lange, E.; Kang, J. From 3D landscape visualization to environmental simulation: The contribution of sound to the perception of virtual environments. Landsc. Urban Plan. 2016, 148, 216–231. [Google Scholar] [CrossRef]
  40. Jeon, J.Y.; Jo, H.I. Effects of audio-visual interactions on soundscape and landscape perception and their influence on satisfaction with the urban environment. Build. Environ. 2020, 169, 106544. [Google Scholar] [CrossRef]
  41. Liu, J.; Kang, J.; Behm, H.; Luo, T. Effects of landscape on soundscape perception: Soundwalks in city parks. Landsc. Urban Plan. 2014, 123, 30–40. [Google Scholar] [CrossRef]
  42. Xu, X.; Wu, H. Audio-visual interactions enhance soundscape perception in China’s protected areas. Urban For. Urban Green. 2021, 61, 127090. [Google Scholar] [CrossRef]
  43. Lindquist, M. The Impact of Sound on Landscape Perception: An Empirical Evaluation of Multisensory Interaction for 3D Landscape Visualization. Ph.D. Thesis, University of Sheffield, Sheffield, UK, 2014. [Google Scholar]
  44. Carles, J.L.; Barrio, I.L.; de Lucio, J.V. Sound influence on landscape values. Landsc. Urban Plan. 1999, 43, 191–200. [Google Scholar] [CrossRef]
  45. Rock, I.; Harris, C.S. Vision and touch. Sci. Am. 1967, 216, 96–107. [Google Scholar] [CrossRef]
  46. Torigoe, K. Soundscape, Its Concept and Practice; Press of Kashima: Tokyo, Japan, 1999. [Google Scholar]
  47. Gan, Y.; Luo, T.; Breitung, W.; Kang, J.; Zhang, T. Multi-sensory landscape assessment: The contribution of acoustic perception to landscape evaluation. J. Acoust. Soc. Am. 2014, 136, 3200–3210. [Google Scholar] [CrossRef]
  48. Ren, X.; Kang, J. Interactions between landscape elements and tranquility evaluation based on eye tracking experiments. J. Acoust. Soc. Am. 2015, 138, 3019–3022. [Google Scholar] [CrossRef] [PubMed]
  49. Gan, Y.; Luo, T.; Zhang, T.; Zhang, T.; Qiu, Q. Discussion on the ‘objectivity’ of subjective visual landscape evaluation: A case study of aesthetic landscape evaluation on the Houguang Lake of Wuhan. Hum. Geogr. 2013, 28, 58–63, 120. (In Chinese) [Google Scholar]
  50. Tveit, M.; Ode, Å.; Fry, G. Key concepts in a framework for analysing visual landscape character. Landsc. Res. 2006, 31, 229–255. [Google Scholar] [CrossRef]
  51. Ode, Å.; Tveit, M.S.; Fry, G. Capturing landscape visual character using indicators: Touching base with landscape aesthetic theory. Landsc. Res. 2008, 33, 89–117. [Google Scholar] [CrossRef]
  52. Yao, Y.; Zhu, X.; Xu, Y.; Yang, H.; Sun, X. Assessing the visual quality of urban waterfront landscapes: The case of Hefei, China. Acta Ecol. Sin. 2012, 32, 5836–5845. (In Chinese) [Google Scholar]
  53. Gong, P.; Liu, C.Q.; Gu, X.R. Research about Substitution Effects of Photograph and Animation Media in the Assessment of Urban Plant Visual Landscape. Chin. Landsc. Arch. 2017, 8, 19. (In Chinese) [Google Scholar]
  54. Nassauer, J.I. Culture and changing landscape structure. Landsc. Ecol. 1995, 10, 229–237. [Google Scholar] [CrossRef]
  55. Zheng, B.; Zhang, Y.; Chen, J. Preference to home landscape: Wildness or neatness? Landsc. Urban Plan. 2011, 99, 1–8. [Google Scholar] [CrossRef]
  56. Sevenant, M.; Antrop, M. The use of latent classes to identify individual differences in the importance of landscape dimensions for aesthetic preference. Land Use Policy 2010, 27, 827–842. [Google Scholar] [CrossRef]
  57. Hong, J.Y.; Jeon, J.Y. Influence of urban contexts on soundscape perceptions: A structural equation modeling approach. Landsc. Urban Plan. 2015, 141, 78–87. [Google Scholar] [CrossRef]
  58. Hong, X.C.; Zhu, Z.P.; Liu, J. Perceived occurrences of soundscape influencing pleasantness in urban forests: A comparison of broad-leaved and coniferous forests. Sustainability 2019, 11, 4789. [Google Scholar] [CrossRef]
  59. Ren, X.; Kang, J.; Liu, X. Soundscape perception of urban recreational green space. Landsc. Arch. Front. 2016, 4, 42–56. [Google Scholar]
  60. Jiang, J.; Zhang, J.; Zhang, H.; Yan, B. Natural soundscapes and tourist loyalty to nature-based tourism destinations: The mediating effect of tourist satisfaction. J. Travel Tour. Mark. 2018, 35, 218–230. [Google Scholar] [CrossRef]
  61. Jiang, B.; Xu, W.; Ji, W.; Kim, G.; Pryor, M.; Sullivan, W.C. Impacts of nature and built acoustic-visual environments on human’s multidimensional mood states: A cross-continent experiment. J. Environ. Psychol. 2021, 77, 101659. [Google Scholar] [CrossRef]
  62. Wang, R.H.; Zhao, J.W. Demographic groups’ differences in visual preference for vegetated landscapes in urban green space. Sustain. Cities Soc. 2017, 28, 350–357. [Google Scholar] [CrossRef]
  63. Xu, J.; Li, M.; Gu, Z.; Xie, Y.; Jia, N. Audio-Visual Preferences for the Exercise-Oriented Population in Urban Forest Parks in China. Forests 2022, 13, 948. [Google Scholar] [CrossRef]
  64. Wu, J.S.; Yuan, T.; Wang, T. Preliminary theory of urban landscape esthetics based on three-dimensional landscape indicators. Acta Ecol. Sin. 2017, 37, 4519–4528. (In Chinese) [Google Scholar]
  65. Wang, Y.J. Study on the Visual Landscape Quality of Beijing Country Parks Based on SBE and SD Method; Capital Normal University: Beijing, China, 2013. (In Chinese) [Google Scholar]
  66. Shi, J.X.; Dong, J.W.; Zhang, Z.D.; Wang, X.M. Aesthetic quality evaluation of rural green space landscape. J. Chin. Urban For. 2013, 11, 5–8. [Google Scholar]
  67. Svobodova, K.; Sklenicka, P.; Vojar, J. How does the representation rate of features in a landscape affect visual preferences? A case study from a post-mining landscape. Int. J. Min. Reclam. Environ. 2015, 29, 266–276. [Google Scholar] [CrossRef]
  68. Lindhagen, A.; Hörnsten, L. Forest recreation in 1977 and 1997 in Sweden: Changes in public preferences and behaviour. Forestry 2000, 73, 143–153. [Google Scholar] [CrossRef]
  69. Rogge, E.; Nevens, F.; Gulinck, H. Perception of rural landscapes in Flanders: Looking beyond aesthetics. Landsc. Urban Plan. 2007, 82, 159–174. [Google Scholar] [CrossRef]
  70. Hong, J.Y.; Lee, P.J.; Jeon, J.Y. Evaluation of urban soundscape using soundwalking. In Proceedings of the 20th International Congress on Acoustics, Sydney, Australia, 23–27 August 2010. [Google Scholar]
  71. Ji, X.R.; Lu, F.H.; Wang, Y.P. Acoustic comfort in university campuses’ outdoor learning spaces—Based on 5 university libraries’ outdoor space in Shanxi. J. Appl. Acoust. 2017, 36, 311–316. (In Chinese) [Google Scholar]
  72. Davies, W.J.; Adams, M.D.; Bruce, N.S.; Cain, R.; Carlyle, A.; Cusack, P.; Hall, D.A.; Hume, K.I.; Irwin, A.; Jennings, P.; et al. Perception of soundscapes: An interdisciplinary approach. Appl. Acoust. 2013, 74, 224–231. [Google Scholar] [CrossRef]
  73. Zhang, Y.; Kang, J.; Kang, J. Effects of soundscape on the environmental restoration in urban natural environments. Noise Health 2017, 19, 65. [Google Scholar] [PubMed]
  74. Van den Berg, A.E.; Koole, S.L.; Van der Wulp, N.Y. Environmental preference and restoration:(How) are they related? J. Environ. Psychol. 2003, 23, 135–146. [Google Scholar] [CrossRef]
  75. Liu, J.; Yu, S.S.; Wang, Y.J.; Zhang, J.Q. Research on the Interaction Effect between Landscape and Soundscape Experience in City Parks. Chin. Landsc. Arch. 2017, 33, 86–90. (In Chinese) [Google Scholar]
  76. Hall, D.A.; Irwin, A.; Edmondson-Jones, M.; Phillips, S.; Poxon, J.E. An exploratory evaluation of perceptual, psychoacoustic and acoustical properties of urban soundscapes. Appl. Acoust. 2013, 74, 248–254. [Google Scholar] [CrossRef]
  77. Liu, J.; Yang, L.; Zhang, X.W. Research on the Relationship between Soundscape Perception and Landscape Evaluation in Historical Block: A Case Study in the Three Lanes and Seven Alleys in Fuzhou. Chin. Landsc. Arch. 2019, 35, 35–39. (In Chinese) [Google Scholar]
Figure 1. Park image from Amap (source: http://ditu.amap.com; accessed on 20 January 2020) (A) and panoramic photos of seven sample sites in Zhongshan Park (B).
Forests 13 01376 g001
Figure 2. Visual landscape element composition and sound level of the park.
Forests 13 01376 g002
Figure 3. Frequency of soundscape elements.
Forests 13 01376 g003
Figure 4. Evaluation on park landscape preference.
Forests 13 01376 g004
Figure 5. Ratio of audio/visual contribution to OLP and average sound level.
Forests 13 01376 g005
Figure 6. Ratio of audio/visual contribution to OLP and ratio of audio/visual preference.
Forests 13 01376 g006
Table 1. Indicators of Perceived Visual Landscape Attributes (PVLA) and Perceived Soundscape Attributes (PSA).
PVLALevel (1–5)PSALevel (1–5)
NaturalnessHighly artificial—Highly naturalQuietnessVery noisy—Very peaceful
OpennessHighly closed—Highly openSound VitalityVery boring—Very interesting
Plant DiversityHighly Monotonous—Highly diverseAcoustic RichnessVery poor—Very rich
Color ContrastVery low—Very highAcoustic HarmonyHighly disharmonious—Highly harmonious
Color RichnessVery poor—Very richAcoustic InterferenceVery low—Very high
Plant CoverageHighly sparse—Highly dense
Plant Hierarchy ChangeHighly monotonous—Highly varied
Number of Landscape BuildingsVery few—Very much
ReliefHighly flat—Highly fluctuating
Visual HarmonyHighly disharmonious—Highly harmonious
NeatnessVery messy—Very tidy
Table 2. The personal characteristics of the respondents.
AttributesNumbers of Each Categorization
Age1. <15(14), 2. 15–24(76), 3. 25–34(47), 4. 35–44(27), 5. 45–59(13), 6. >60(26)
Gender1. male (85), 2. Female (118)
Educational background1. primary school (17), 2. secondary school (42),3. high school and trade/technical/vocational college (53), 4. college (91)
Occupation1. employed (59), 2. retired (24), 3. student (81), 4. other (39)
Visit frequency1. several times in a year (99), 2. once in a month (15), 3. once in a week (42), 4. twice or thrice in a week (29), 5. everyday (18)
Length of stay1. <60 min (85), 2. 1 to 3 h (91), 3. 3 to 5 h (19), 4. >5 h (8)
Table 3. Correlation analysis between VLP, SP, and OLP (Spearman).
Sample Site (SS)VLP-SPVLP-OLPSP-OLP
SS1 (n = 29)0.608 **0.645 **0.756 **
SS2 (n = 29)0.491 **0.581 **0.764 **
SS3 (n = 28)0.554 **0.924 **0.604 **
SS4 (n = 29)0.461 *0.576 **0.823 **
SS5 (n = 28)0.674 **0.771 **0.866 **
SS6 (n = 30)0.2520.374 *0.600 **
SS7 (n = 30)0.560 **0.549 **0.796 **
Total SS (n = 203)0.567 **0.658 **0.769 **
** p < 0.01; * p < 0.05.
Table 4. Multiple linear stepwise regression analysis of OLP.
Sample Site (SS)Regression EquationAdjusted R2
SS1OLP = 2.245 + 0.462SP + 0.427VLP0.616
SS2OLP = 1.328 + 0.803SP0.628
SS3OLP = 0.356 + 0.918VLP0.836
SS4OLP = 1.367 + 0.763SP + 0.246VLP0.853
SS5OLP = −2.175 + 0.395SP + 0.394VLP0.444
SS6OLP = 1.020 + 0.615SP + 0.328VLP0.665
SS7OLP = 1.831 + 0.758SP0.559
Total SSOLP = 1.367 + 0.486SP + 0.388VLP0.589
Table 5. Multiple linear backward regression analysis of OLP.
Sample Site (SS)Regression EquationAdjusted R2
Total SSOLP = 2.487 + 0.489SP + 0.362VLP − 0.103E − 0.093A − 0.055G0.593
Table 6. Spearman correlation between visual landscape preference (VLP) and perceived visual landscape attributes (PVLA).
PVLAVisual
Harmony
Color RichnessColor
Contrast
Plant
Coverage
Plant
Diversity
OpennessReliefNaturalnessNumber of Landscape BuildingsPlant
Hierarchy Change
Neatness
VLP0.529 **0.491 **0.488 **0.465 **0.450 **0.449 **0.427 **0.417 **0.411 **0.410 **0.410 **
** p < 0.01.
Table 7. Spearman correlation between soundscape preference (SP) and perceived soundscape attributes (PSA).
PSAAcoustic HarmonyQuietnessSound
Vitality
Acoustic
Richness
Acoustic
Interference
SP0.521 **0.459 **0.421 **0.347 **0.044
** p < 0.01.
Publisher’s Note: MDPI stays neutral with regard to jurisdictional claims in published maps and institutional affiliations.

