Abstract
The importance of multi-sensory perception in constructing human landscape experiences has been increasingly emphasized in contemporary urban life. The aim of this study is to explore aural-visual interaction attributes that may influence people’s perceived overall soundscape comfort in urban green spaces (UGSs). To achieve this, a total of 12 perceptive indicators were identified from the existing literature to evaluate people’s perceived visual and acoustic attributes and types of sound sources, and their relations to the perceived soundscape comfort. 268 responses were obtained in a questionnaire-based survey conducted in five UGSs in Chengdu Outer Ring Ecological Zone. This was done whilst a typical objective acoustic indicator, sound level, was used as a mediator for potential changes on these relations within different sound level ranges. Results suggested that a low level of environmental sound does not correspond to higher ratings on the overall soundscape comfort. It was also found that the environmental sound level of 77 dBA was a turning point in the relation between people’s soundscape comfort and its influential indicators in UGSs. A set of six models was then provided to describe the overall soundscape comfort and its contributing indicators in aural-visual interactions, respectively, in sound level ranges below and above 77dBA.
1. Introduction
Multi-sensory perception, spatial use pattern and the emotional responses of humans constitute their experiences in urban landscapes [1,2]. Urban green spaces (UGSs) have significant impacts on improving the physical [3], psychological [4] and social health [5,6] of urban residents. The design of UGSs has long been concerned with aesthetics, and there is enormous evidence of spatial form and environmental characteristics improving users’ perceived visual quality [7,8]. Although more than 80 percent of our sensory input is visual [9], the importance of multi-sensory perception in constructing human landscape experiences has been increasingly emphasized [10,11], especially soundscape. Soundscape refers to the acoustic environment that people perceive or experience in a certain context [12]. It highlights the auditory properties of a landscape and sets the visual dominance in landscape perception research in a new context, which has now developed into a special focus on the cross effects of aural–visual interactions or soundscape–landscape relationships on human soundscape perception [13,14].
Overall soundscape comfort is comprised of people’s perceptions of aural–visual environmental attributes [15,16]. Exploring the relevant indicators describing these perceived attributes and their mutual influences can enrich and improve the perceptive quality of UGSs and also provides cues for improving people’s perceptions of soundscape comfort. However, to date, very few studies have evaluated soundscape and visual perception in combination in situ [13,17] nor constructed a full model [18] combining perceived aural–visual features and objective acoustic attributes in the application of improving people’s soundscape comfort. This study intends to explore aural–visual indicators and their mutual interactions in influencing the overall soundscape perception of UGSs. Three groups of indicators measuring people’s perceived visual attributes, aural attributes and perceived sound sources were identified to measure and improve people’s perceived soundscape comfort in UGSs. This was done whilst a typical objective acoustic indicator [19], sound level, was used as a mediator. An on-site survey was conducted to explore whether and how these indicators contribute to people’s overall perceived soundscape comfort, with the specific research objectives stated below:
- To identify aural–visual interaction indicators related to the overall soundscape comfort in UGSs and investigate their influences.
- To construct models indicating ways of improving overall soundscape comfort in UGSs based on the identified indicators.
- To discuss the cross effects existing between people’s perceived visual attributes, aural attributes and sound sources.
2. Influential Indicators of Soundscape Perception
2.1. Visual Perception Indicators in Landscape
Visual perception has long been taken as the major basis for evaluating the quality of urban green spaces in landscape studies [20]. Ode et al. (2008) cited biophilic theory, landscape aesthetic, information processing theory, spirit of place, prospect-refuge theory, topophilia, landscape heritage and restorative landscapes [21] as major theoretic bases for developing visual landscape concepts. Biophilic and prospect-refuge theory later constituted the foundation of visual preference research [22] which, as agreed by many scholars, can both be explained by an evolutionary perspective [23]. Prospect-refuge theory [24] proposes people feel most comfortable when they can observe what is happening around them while also being slightly protected. Kaplan and Kaplan then raised a preference matrix stating that coherence, complexity, legibility and mystery are important in creating environments since they can provide people with safety and comfort [25]. Another major and long-lasting theme responding to the question ‘What is it that we like about landscape, and why do we like it?’ [26] is the aesthetic approach to landscape. It is based on Maslow’s hierarchy of needs [27] and composed of at least two interrelated components: cultural theory and biological theory [28].
Drawing from the theoretical literature, numerous studies have contributed to the search for environmental indicators linked with human visual landscapes [29]. A set of 40 commonly used affective descriptors in adaptation theory, such as complexity, naturalness, brightness, openness, coherence, were validated as indicators of visual landscape perceptions [30]. Similarly, complexity, coherence, disturbance, stewardship, imageability, visual scale, naturalness, historicity, and ephemera were identified as being capable of characterizing the visual landscape [21]. Grahn and Stigsdotter constructed perceived sensory dimensions (PSDs) based on existing evidence and a large-scale questionnaire survey determining eight of the most popular sensory dimensions of perception, including serenity, nature, space, species-richness, refuge, prospect, society and culture [31]. The PSDs were later widely applied in more than 60 studies [32] and proved to be an efficient tool in landscape assessment and design. However, evaluation frameworks do not normally consist of indicators solely measuring people’s visual responses. When studies focus on the mutual influence of visual and aural aspects in landscape perceptions, these indicators can hardly provide adequate specific visual implications due to their inherent inter-relations with other perceptive aspects.
2.2. Aural Perception Indicators in Landscape
Soundscape has been used by a variety of disciplines to describe the relationship between a landscape and the composition of its sound [19]. In Southworth’s work [16], it was first mentioned in urban planning literature addressing how the sounds of the built environment enhanced people’s perception of space and their relationship to the activities occurring within cities [33]. There are three important directions in soundscape research aiming to investigate how people perceive the acoustic environment [34]. One is to objectively obtain soundscape information from analyzing sound recordings in terms of physical parameters [35,36] or in spectrograms [37] for regulating the environmental noise [38,39]. Moreover, traditional qualitative methods, such as questionnaires, interviews [40] and on-site observation [41,42], are used to acquire subjective soundscape information. Furthermore, the objective and subjective methods are also often combined in soundscape evaluations [43].
A large body of literature has also explored indicators that affect soundscape perceptions in different dimensions including comfort, tranquility, pleasantness, nature, gentleness, and appropriateness [44,45]. These were then integrated and put through principal component analysis for validation, resulting in a model later referred to as perceived affective quality (PAQ) [46], which raises eight important dimensions relevant to people’s aural perceptions: pleasantness, vibrancy, eventfulness, chaos, annoying, monotony, uneventfulness and calm. The PAQs have been incorporated into the International Standards of Soundscape (ISO) [12] in order to unify soundscape perception descriptors and have been widely applied and validated in later soundscape studies [47]. Similar to visual landscape studies, most soundscape assessment frameworks contain indicators measuring human perceptions caused not only by the aural sensory dimension. As a result, the cross effect between audio-visual attributes has not been strictly clarified, and the results of relevant literature research are inconsistent.
2.3. Types of Sound Sources
Differing from perceptive indicators, sound source is an attribute affiliated with the definition of soundscape that investigates how the acoustic environment can be characterized by identifying what sound sources can be heard in the area and how dominant they are [12]. Scholars have characterized the sources of sounds into three major types: natural sounds that relate to non-organic elements of nature, such as waterfalls (geophony), organic but non-human sources, such as animals’ copulatory vocalizations (known as biophony) and all environmental sounds generated by human sources (anthrophony), such as human voices or human activity-related sounds [15,48]. These were also incorporated into ISO [12] and formalized into three main types of sound sources that are recommended for inclusion in soundscape surveys: sounds of nature, sounds of technology and sounds of human beings. The latter two types are also referred to as mechanical and anthropogenic sounds in the relevant studies [49,50]. They are important in soundscape research since they provide potential cues implying necessary design interventions. For example, natural sounds are preferred while anthropogenic and mechanical sounds are less welcomed in urban parks [49]. In addition, the breeze significantly increases the likelihood of people giving a high comfort evaluation, while sounds from bikes or heavy vehicles significantly lower the likelihood [49].
2.4. Sound Level as Mediator
The design of soundscape developed from noise regulation. Earlier research and practices mostly emphasized the control and reduction of unwanted sound [38,39] in urban areas. However, later studies found that reducing sound level does not necessarily lead to an increase of acoustic comfort in urban areas [51,52]. Individuals’ noise sensitivity [53], a stable personality trait that captures attitudes towards a wide range of environmental noises [54,55], and environmental attributes [56] both have impacts on the relation between sound level and people’s perceived acoustic comfort. Evidence has shown that subjective evaluation of the acoustic environment relates well with the sound level when it is within a certain range [57,58], and the relation as well as the range varies with research contexts. For example, Yang and Kang found that the variation in acoustic comfort evaluations was almost negligible when the sound level was lower than around 73 dBA, whereas when the sound level was over 73 dBA for the mixed sound of fountains and demolition, the evaluation of acoustic comfort evidently decreased with the increase of the sound level [59]. In another study of soundscape perception in pocket parks, results also disclosed that influential indicators change significantly when the sound level passes 70 dBA [57].
2.5. This Study
To date, very few studies have constructed models [18] combining perceived aural–visual features and objective acoustic attributes in the application of improving people’s soundscape comfort on the basis of understanding the influences of aural–visual interaction attributes on the overall soundscape comfort and the inter-relations between them.
This study aims to explore influential indicators of how people perceived overall soundscape comfort in UGSs. Through an on-site survey conducted in five UGSs in Chengdu Outer Ring Ecological Zone, it tries to construct models that can indicate ways of improving people’s overall soundscape comfort according to these interaction indicators in perceived aural and visual aspects. Sound level is used as a mediator in the process to investigate whether and how these influential indicators and models change within different sound level ranges.
3. Methods
3.1. Study Area
This study chose typical UGSs within Chengdu Outer Ring Ecological Zone as study sites. Chengdu is a demonstration city for promoting the Park City agenda in China and has achieved evident progress since 2018. The Outer Ring Ecological Zone is one of the most important projects in this agenda and surrounded by over 30 UGSs of different scales and with different characteristics and functions. However, most UGSs now suffer from noise issues since the Outer Ring Ecological Zone is crossed by highways and is also affected by noise from railways and Tianfu airport. This has seriously affected people’s landscape experience when using these green spaces and, hence, they have become appropriate research sites for this study.
Five UGSs (Figure 1, Table 1) with noise issues (sound level measured in the pilot study exceeded the limit of 70 dBA stipulated in the Standard of Sound Environment Quality [GB3096-2008] [60]), namely Bailuwan Wetland Park (UGS1), Guixi Ecological Park (UGS2), Jiangjia Art Garden (UGS3), Qinglong Lake Wetland Park (UGS4) and Tianfu Lotus Garden (UGS5), were selected as study sites to determine whether and how aural–visual soundscape stimuli can be modified to improve the overall soundscape comfort of green space users based on the following criteria: (1) first, study sites should be fully constructed and open to the public; (2) study sites should have different soundscape sources, visual and acoustic attributes; (3) study sites should contain at least one measurement spot with an open view and qualify for setting acoustic instruments. All selected study sites are dominated by natural characteristics and rich in botanic species.
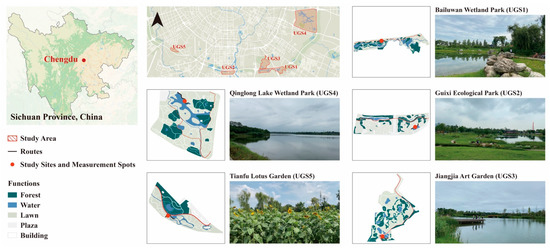
Figure 1.
Site photos of measurement spots.

Table 1.
General conditions of the selected study sites and measurement spots.
Spots to conduct the questionnaire and the acoustic measurement were then selected within the five UGSs (Figure 1). Measurement spots should be able to present the visual and acoustic features of their represented UGSs. In addition, there should be a distance of an over three-minute walk from the entrance to the first measurement spot in each site to allow enough time for subjects to become mentally immersed in the setting [61,62]. The three-minute walking distance is also requested as the least interval within spots in the same site. In addition, there should be enough space for participants to wander around and experience the surrounding environment in each spot. With the consideration of the size of each site and the space’s access to the public within each site, eight spots were chosen in UGS1, three in UGS2, eight in UGS3, one in UGS4 and two in UGS5.
3.2. Questionnaire
A total of 12 indicators were selected from existing research to measure people’s perceived visual and acoustic attributes and types of sound sources in UGSs (Table 2). Four indicators, aesthetic, openness, layering and order, were selected from traditional visual landscape studies and PSDs [18,63] since other indicators, such as tranquility, society and culture, may not be triggered by only human visual perception. Naturalness was also excluded since green spaces are typical natural settings in urban areas. Only vibrancy, harmony, eventfulness and monotony were chosen as indicators of aural attributes because other indicators in PAQs [18] and international soundscape research standards [12], such as pleasantness and calm, may be influenced by environmental information other than acoustics. Furthermore, harmony was adopted from chaos to ensure semantic consistency [64] among indicators. Regarding sound sources, natural, anthropogenic, mechanical and traffic sounds were chosen as indicators based on pilot study results to investigate the dominant position of certain sounds as determined by their perceived occurrences and perceived loudness [65].
Table 2.
Indicators of measuring visual and acoustic attributes and sound sources.
12 indicators and the overall soundscape comfort were together designed into a questionnaire to investigate people’s aural–visual perceptions of the five selected urban UGSs. The questionnaire contained two parts. The first part consisted of the descriptions (Table 2) of the 12 indicators measuring people’s perceived visual and acoustic attributes and sound sources at the study sites. The second part had only one question evaluating people’s overall perceived soundscape comfort of the environment. Both parts used a five-level Likert scale (1–5 representing strongly disagree to strongly agree).
3.3. Apparatus
Equivalent continuous A-weighted sound pressure level (LAeq) is one of the most common parameters in relevant acoustic research [73] for objectively describing the environmental sound level. In this study, it was selected as a mediator and measured by a multi-channel signal analyzer (AWA6290L+). The acoustic instrument is suitable for outdoor conditions with the advantages of having multi-channel receptors and high sensitivity; it has proved effective in measuring and recording outdoor environmental sound level and has been widely applied in academic research and practices [74,75]. In addition to the signal analyses, apparatus used in the field measurement also included two test microphones (AWA14423, frequency range 20–16,000 Hz, sensitivity about 40 mV/Pa), two preamplifiers (AWA14604, Integrated Circuits Piezoelectric, impedance conversion, frequency range 10–200 k Hz, Gain 1), two 80 mm diameter wind balls and two tripods (about 1.6 m high).
3.4. Data Collection
Previous studies suggested that people’s life stage [76], educational background [77] and state of being alone or with company [78] have influenced their landscape perceptions. This study is especially concerned with the aural-visual perceptions of young people since they are more sensitive to surrounding environments than other age groups [79]. Therefore, a total of 20 university students, aged around 22 with normal or corrected-to-normal visual acuity, normal color vision and hearing, were recruited to evaluate each of the measurement spots in the five UGSs. The ratio of male participants to female was 1:1. The sample size was determined according to previous soundscape studies, which stated that the total number of valid responses should be over 100 [42]. All participants were trained before the formal survey.
The field survey was carried out on sunny days with an Air Quality Index less than 60 and wind speed below 5 m/s, in July 2021. Twenty recruited participants were divided into four groups, and each group was led by one researcher. Each participant group travelled through measurement spots in a different order to avoid having too many people appear at the same spot and time. To minimize disturbance caused by researchers, participants were asked to wander around within the scope of each measurement spot by themselves to experience their surrounding environments for five minutes [80] and then complete the questionnaire. Participants were asked to fill out the questionnaire survey in each of the 22 measurement spots, and a total of 380 responses were collected. The survey was ethically approved, and informed consent was obtained from each participant in advance. Noise data, such as an incomplete questionnaire or questionnaires with the same ratings for every indicator, were manually removed and the number of final valid responses was 268 (approximately 12 per spot).
While conducting the questionnaire survey, another group of researchers recorded the equivalent continuous A-weighted sound pressure level of each spot with a multi-channel signal analyzer to indicate environmental sound level. After the calibration using the sound level calibrator (AWA6021A, accuracy level 1), two amplifiers and microphones equipped with wind balls were placed at the center point of each spot, about 1.6 m above the ground, to record the environmental sound level. The sound level within each spot was recorded for three minutes.
3.5. Data Analysis
Potential relations between the 12 indicators describing the visual and acoustic attributes of urban UGSs and the overall soundscape comfort were explored based on the obtained questionnaire results. The analysis of sound level, retrieved from the recorded data in the acoustic instrument, was carried out using the SPL 1/3 octave bands analysis package in the AWA6229 6.0 software. Spectrum analysis was performed on audio files to calculate the equivalent continuous A-weighted sound pressure level (LAeq) of each spot for a consecutively recorded three minutes. The average LAeq of each measurement spot in a park was used as the LAeq of the site.
Responses of the 12 descriptive indicators and the overall soundscape comfort first went through reliability analysis to ensure the consistency of the obtained questionnaire results. Correlational analysis was then conducted between the overall soundscape comfort and the sound level to determine the turning point in this research context. Afterwards, the collected questionnaire responses were separated into two groups based on the disclosed turning point and analyzed by several different methods of multivariate analysis. Correlational analysis was also used in this step to identify indicators relevant to the overall soundscape comfort and linear regression models were formulated to establish stochastic relationships between the overall soundscape comfort and its influencing indicators. The interrelationships among people’s perceived visual attributes, aural attributes and sound sources were then discussed accordingly.
4. Results
4.1. Manipulation Checks and Descriptive Analysis
Data were analyzed using SPSS V 25.0 and examined for internal consistency with Cronbach’s alpha [81]. Calculation of internal consistency (Cronbach’s α) was the preferred measure of inter-rater reliability when cases were rated in terms of an interval variable or interval-like variable, such as the Likert scale used in the questionnaire. The α values of the 12 indicators in the 22 measurement spots suggested sufficient internal consistency (Cronbach’s α = 0.76 > 0.6) and, hence, guaranteed the reliability of the obtained ratings.
The visual and acoustic evaluation results of a site were represented by calculating the average of the questionnaire responses at each spot within the site (Table 3), and the same method was applied for the LAeq results (Table 4). Results showed that UGS2 (3.86) and UGS3 (3.75) ranked the highest in the overall soundscape comfort, followed by UGS4 (3.67), UGS5 (3.55) and UGS1 (3.24). However, results of the overall soundscape comfort were not in line with the sound level measured by acoustic instrument. A ranking of sound level results from lowest to highest were UGS4 (69.3 dBA), UGS5 (74.5 dBA), UGS1 (75.9 dBA), UGS2 (78.8 dBA) and UGS3 (82.3 dBA). Figure 2.
Table 3.
The arithmetic average of perceptive evaluation in the five study sites.
Table 4.
The arithmetic average of the sound pressure level (LAeq) in the different UGSs.
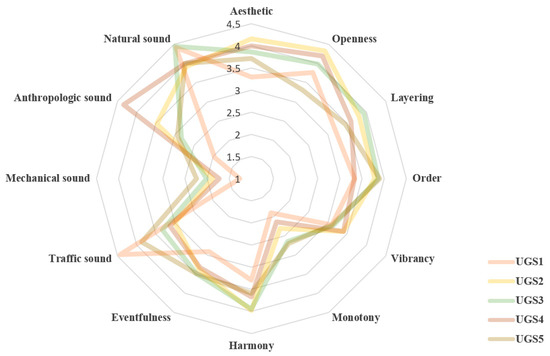
Figure 2.
The evaluation results of the five study sites.
In respect to visual perception, though UGS2 and UGS3 still had relatively higher ratings, each of them had their own visual advantage. Aesthetic and openness were evident visual attributes of UGS2, while UGS3 was characterized by layering and order. The order of UGS4 scored low, but its other three visual indicators were rated above average. The results of UGS5 were just the opposite: order had higher ratings than aesthetics, openness and layering. UGS2 and UGS3 also had the highest ratings in the four aural indicators, with harmony being the obvious advantage for both UGS2 and UGS3. The vibrancy of soundscape was relatively good in UGS4, while UGS5 was generally characterized by the eventfulness of its environmental sounds. Among all the sites, UGS1 had the lowest ratings on almost all visual and aural indicators.
Five study sites showed significantly different attributes regarding sound sources, among which, anthropologic sound was dominant in UGS2 and UGS4. Also, UGS3 and UGS1 were both evidently characterized by natural sound, but they had different subdominant sound sources: mechanical and traffic sounds, respectively. Mechanical and traffic sounds were also prominent in UGS5, where a medium level of natural and anthropologic sounds could be perceived.
4.2. The Turning Point in the Relation between Sound Level and Soundscape Comfort
Inspired by previous studies [59] investigating the relation between soundscape perception and the sound level, this study proposed that the influential indicators of overall soundscape comfort may vary in different decibel ranges. Correlational analysis was carried out on all datasets, and results indicated there was an evident correlation between overall soundscape comfort and the sound level (p < 0.01). Further, scatter plot was used to present how the mean LAeq influenced the overall soundscape comfort. A turning point of 77 dBA was identified in the relation between sound level and soundscape comfort. The overall soundscape comfort slightly increased with sound level when it was above 77 dBA, while an obvious negative relation could be observed when sound level was lower than 77 dBA. Figure 3.
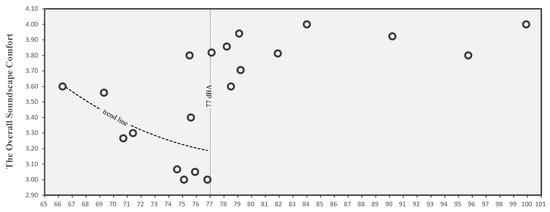
Figure 3.
Scatter plot showing the relation between the overall soundscape comfort and sound pressure level.
Correlational analysis was conducted again to validate the groups of data above and below 77 dBA. Results showed that there was generally an evident negative correlation between the mean LAeq and the overall soundscape comfort when the sound level was under 77 dBA (R = −0.335, p = 0.000 < 0.01), but the correlation coefficient became rather low beyond this sound level (R = 0.139, p = 0.117 > 0.05). This indicates that when the sound level reached a certain value, which was 77 dBA in this study, subjects’ evaluations varied significantly and became more unpredictable. Therefore, 77 dBA was found and validated as a turning point in this study, and the following analysis should be conducted within two groups, above and below 77 dBA, respectively.
4.3. Influences of Aural-Visual Perceptive Attributes in the Overall Soundscape Comfort
268 collected questionnaire responses and sound data measured at the 22 spots were used to formulate linear regression models to establish a stochastic model between the overall soundscape comfort perception and its influencing indicators: sound types, visual attributes and acoustic attributes. Pearson correlational analysis was also employed to reveal the mutual influences between the influencing indicators. Given that the identified turning point of sound pressure level was 77 dB, correlational analysis and regression analysis were taken in two groups of below and above 77 dB to explore potential relations.
4.3.1. Influential Indicators of the Overall Soundscape Comfort
Correlational analysis results showed that mechanical and natural sounds had no significant relation with the overall soundscape comfort in the below 77 dBA group, while aesthetic and vibrancy were not significantly correlated with the overall soundscape comfort in the other group. Thus, they were excluded in the regression analysis. Table 5.
Table 5.
Correlational analysis between the overall soundscape comfort and other indicators.
- Sound types
In the under 77 dBA group, results showed that only the traffic sound (p < 0.01) was significantly related with the overall soundscape comfort, and a linear model with an R2 of 0.314 appeared as:
A = 4.261 − 0.248 × S1
In the above 77 dBA group, both the traffic (p < 0.01) and natural sounds (p < 0.01) were confirmed to be relevant. A model with an R2 of 0.350 was found as:
A = 3.185 − 0.109 × S1 + 0.246 × S4
- 2.
- Visual attributes
The analysis of the below 77 dBA group showed that two indicators describing visual environment attributes, aesthetic (p < 0.01) and openness (p < 0.01), were evidently related to the overall soundscape comfort. The model generated, with an R2 of 0.491, was as follows:
A = 1.870 + 0.289 × V1 + 0.118 × V2
In the above 77 dBA group, the other two indicators of visual aspects, layering and order, appeared to be closely related to the overall soundscape comfort. A model was constructed, and its R2 was 0.332:
A = 2.758 + 0.182 × V3 + 0.097 × V4
- 3.
- Acoustic attributes
Correlational analysis results suggested that people’s acoustic perceptions evaluating the monotony (p < 0.01), harmony (p < 0.01) and eventfulness (p < 0.01) levels of the surrounding environment were significantly influential indicators of the overall soundscape perception. A model describing their relations was calculated with an R2 of 0.483 in the dataset under 77 dBA:
A = 1.701 + 0.072 × A2 + 0.354 × A3 + 0.076 × A4
In another group above 77 dBA, relevant indicators were the same, but the final model (R2 = 0.342) appeared to be different:
A = 2.427 + 0.081 × A2 + 0.209 × A3 + 0.112 × A4
Referring to similar soundscape studies, an R2 over 0.3 [82,83] provides sufficient reliability for the linear model. The constructed models above describing the relation between the overall soundscape perception and its influencing indicators were, thus, effective. The estimated coefficient values for all indicators and model fitting information are listed in Table 6.
Table 6.
Model fit and estimation of B coefficients of models.
4.3.2. Cross Effects of Visual and Acoustic Attributes and Sound Sources
Correlational analysis was also conducted to explore the cross effects of visual and acoustic attributes and sound sources. It was found that the mutual influences between three perceptive aspects appeared to be different in the below and above 77 dBA groups. In the group with sound level below 77 dBA, 42 pairs of indicators were found to be significantly related to each other. In general, there were evident cross effects between visual and aural indicators, most influences being positive. The effects of sound sources on aural and visual indicators, however, varied. Anthropologic and natural sounds were found to be positively correlated with visual and aural indicators, while negative relations were observed between the other two types of sound sources and visual and aural indicators. Indicator pairs (29) with significant mutual effects were far fewer when sound level was over 77 dBA. Obvious positive relations were also revealed within visual indicators, which could hardly be found among aural indicators. Also, compared to the below 77 dBA group, indicator pairs with negative relations evidently decreased. For both groups, no mutual influences were found between the four types of sound sources. Figure 4.
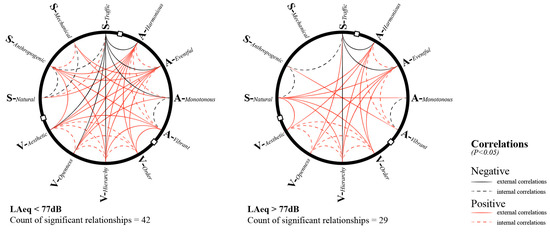
Figure 4.
Cross effects of visual and acoustic attributes and sound sources.
5. Discussion and Conclusions
5.1. The Effects of Sound Level on the Overall Soundscape Comfort
This research found that a low level of environmental sound does not corresponding to higher ratings on the overall soundscape comfort. This, again, implies that importance of visual landscape and specific sound attributes in affecting people’s perceived soundscape comfort [15]. A typical example is UGS3, which has high level of environmental sound as well as high ratings on the aural-visual attributes and the overall soundscape comfort rating. This means that loud sounds do not necessarily have a negative impact on people’s auditory and visual perceptions [84]. In addition, UGS4 has the lowest sound level but its comfort rating only ranks at the third among the five sites. This may be due to the dominance of mechanical and human sounds on the site, as when the two exceed certain ranges, they are often associated with negative human perceptions [85].
Another important finding is that the environmental sound level of 77 dBA was a turning point in the relation between people’s soundscape comfort and its influential indicators in UGSs. The turning point of 77 dBA was different from any similar evidence in previous studies. For example, Yang and Kang found that the subjective evaluation of the sound level generally related well with the mean LAeq, especially when the sound level was below 73 dBA [59]. Below and above the point of 70 dBA was also found to be influential to indicators contributing to human soundscape perception in pocket parks [57]. However, the specific decibel value of turning points reasonably varied in the evaluated environments and participant groups, as it linked with human aural–visual perceptions.
5.2. Different Influential Mechanism below and above 77dBA
In the analysis conducted on the two groups of below and above 77 dBA, it was found that there were obvious differences in terms of specific relevant indicators and their weights in contributing to overall soundscape comfort. Traffic sound was found to have negative effects on the overall soundscape comfort in both ranges below and above 77 dBA. The overall soundscape comfort can also be positively adjusted by natural sound when the sound level was above 77 dBA. This suggested that the benefit of sound sources to overall soundscape comfort only worked when the sound level passed 77 dBA. Aural perceptive indicators with influences on the overall soundscape comfort were the same in the ranges below and above 77 dBA, which meant that the overall soundscape comfort could be stably promoted by the increase of openness, order and layering. However, visual attributes contributing to the overall soundscape comfort were completely different in the ranges below and above 77 dBA. Research findings indicated that aesthetic and openness were important to people’s perceived soundscape comfort when the environmental sound level was below 77 dBA, while when the sound level was over 77 dBA, order and layering appeared to be more important. People’s ability to perceive visual aesthetics may have been disrupted by higher levels of ambient sound, when the sense of order and layering of the visual landscape could help them combat interference brought on by the loudness of sound.
5.3. Mutual Influences between Aural and Visual Aspects in UGSs
Audio-visual interactions are proved to be essential in human perceived soundscape comfort in this study. Results disclosed not only whether and how visual attributes, aural attributes and sound sources interact with each other (external correlation), but also how indicators in each perceptive aspect internally influence with each other (internal correlation). It was found that aural attributes, harmonious and eventful are positively related with all of the four visual indicators, openness, aesthetic, hierarchy and order, while vibrance is only influenced by the last three. Congruent positive effects were also found within the four visual indicators, which is in line with findings in most visual preference studies [86]. Previous studies exploring audio-visual interactions mostly concerned with the different types of sounds and their effects on people perceived visual settings with different landscape characteristics, or vice versa. Very few of them adopted indicators describing people’s perceived aural–visual qualities as this study does, possibly due to the difficulty of using subjective indicators to provide direct cues for design improvements. For example, it was proved that the more urban the visual setting, the more negative the sound ratings [87]. The importance of audio-visual interactions is also confirmed in adjusting soundscape perception in China’s protected areas [88], and in constructing tranquil spaces [89]. Among those studies discussing the mutual influences between environmental visual and aural attributes, the main focus was on specific sound sources (i.e., children shouting, lawn mowing and birds) [41] and visual contents, such as plants, flora, water and typological features [89]. The universal assessment tool for UGSs soundscape comfort which this study seeks to deliver, therefore, has the advantage of flexible application but also has its limitations in developing specific design improvements.
5.4. Limitations
Though research outcomes appeared to be reasonable and were mostly in line with previous findings, limitations did exist in the study in terms of the experimental design and data analysis. Given that the sound pressure level needed to be measured in a fixed point, the questionnaire survey was also conducted in the designated measurement spots. The different pattern of participants wandering to experience the spots within the site may have led to differences in the evaluation results. In addition, the field survey was carried out in July; the relatively high temperature may have affected people’s perceptions [90] as well. The accuracy of the perceptive results may have also been constrained by the number and the specific group (university students) of participants. The open areas in UGS2, UGS3 and UGS5 were much smaller than the other two sites; fewer measurement spots were selected for them. The different numbers of measurement spots and different sizes of open areas in each park are also believed to be influential. As for the data analysis, the overall soundscape comfort was rated with a five-point verbal scale (rating between 1–5), while the sound pressure level was measured by professional apparatus (results between 60–88 dBA). Considering that the range of the sound level was not fixed, no standardization was used to process the data, which may have slightly influenced the identification of the turning points. Moreover, research findings provide no direct relationship between human perceptions and design interventions, thus the identified indicators and the adjusted model can only be used as auxiliary tools in landscape practices. Relevant studies should further explore effective ways of translating people’s aural–visual landscape experience into design languages.
5.5. Conclusions
This study explored influential indicators of human soundscape comfort and the influences of aural-visual interaction attributes on people’s overall perceived soundscape comfort in urban green spaces. Research findings not only indicated environmental perceptive cues related to people’s perceptions of overall soundscape comfort, but a set of six models was also constructed to show how the overall soundscape comfort could be improved through these influential indicators. The outcome of this study not only implies possible design interventions for delivering high-quality urban green spaces, but also extends the applications of audio–visual perceptions in the design of urban public spaces. These can further contribute to enriching human spatial experiences from the perspective of multi-sensory design interventions.
Author Contributions
Conceptualization, Y.Y., Y.H. and Y.S.; methodology, Y.Y. and Y.S.; software, Y.M. and Z.X.; validation, Y.Y. and Y.H.; formal analysis, Y.Y., Y.M. and Z.X.; investigation, Y.M. and Z.X.; resources, Y.S. and Y.H.; data curation, Y.Y. and Y.H.; writing—original draft preparation, Y.Y.; writing—review and editing, Y.Y. and Y.H.; visualization, Y.M. and Z.X.; supervision, Y.S.; project administration, Y.S.; funding acquisition, Y.S. All authors have read and agreed to the published version of the manuscript.
Funding
This research was funded by Nature Science Foundation of China: 51808393; Shanghai Post-doctoral Excellence Program: 2021357; Restorative Urbanism Research Center (RURC), Joint Laboratory for International Cooperation on Eco-Urban Design, Tongji University (CAUP-UD-06); Foreign Expert Program, Ministry of Science and Technology, China (G2022133023L).
Institutional Review Board Statement
The study was conducted in accordance with the Declaration of Helsinki and approved by the Ethics Committee of Tongji University (protocol code 2020tjdx075 and date of approval 09/11/2020).
Informed Consent Statement
Informed consent was obtained from all subjects involved in the study.
Conflicts of Interest
The authors declare no conflict of interest.
References
- Shao, Y.; Xue, Z.; Yin, Y. Exploration of Public Participation Method from the Humanistic Perspective: Perception Stimulation. Landsc. Archit. 2020, 27, 116–122. [Google Scholar]
- Wei, F. “Sensewalk Mapping” as a Method for Teaching Multi-sensorial Landscape Perception. Landsc. Archit. 2021, 28, 96–106. [Google Scholar]
- Lee, A.C.; Maheswaran, R. The health benefits of urban green spaces: A review of the evidence. J. Public Health 2011, 33, 212–222. [Google Scholar] [CrossRef] [PubMed]
- Lee, A.C.K.; Jordan, H.C.; Horsley, J. Value of urban green spaces in promoting healthy living and wellbeing: Prospects for planning. Risk Manag. Healthc. Policy 2015, 8, 131. [Google Scholar] [CrossRef] [PubMed]
- Hong, A.; Sallis, J.F.; King, A.C.; Conway, T.L.; Saelens, B.; Cain, K.L.; Fox, E.H.; Frank, L.D. Linking green space to neighborhood social capital in older adults: The role of perceived safety. Soc. Sci. Med. 2018, 207, 38–45. [Google Scholar] [CrossRef] [PubMed]
- Maas, J.; Van Dillen, S.M.; Verheij, R.A.; Groenewegen, P.P. Social contacts as a possible mechanism behind the relation between green space and health. Health Place 2009, 15, 586–595. [Google Scholar] [CrossRef] [PubMed]
- Tang, Z.; Liu, B. Progress in Visual Landscape Evaluation. Landsc. Archit. 2015, 09, 113–120. [Google Scholar]
- Shu, X.; Shen, X.; Zhou, X.; Hao, P. Research on Strategies and Determinants of Nature Education Environment Design Based on Landscape Perception Theory. Landsc. Archit. 2019, 26, 48–53. [Google Scholar]
- Rock, I.; Harris, C.S. Vision and touch. Sci. Am. 1967, 216, 96–107. [Google Scholar] [CrossRef]
- Hong, X. Progress of Contemporary Urban Soundscape Researches. Landsc. Archit. 2021, 28, 65–70. [Google Scholar] [CrossRef]
- Hong, X.; Huang, Z.; Wang, G.; Liu, J. Modeling Long-Term Perceived Soundscape in Urban Parks: A Case Study of Three Urban Parks in Vancouver, Canada. Landsc. Archit. 2022, 29, 86–91. [Google Scholar] [CrossRef]
- The International Organization for Standardization. PD ISO/TS 12913-2:2018 Acoustics—Soundscape—Part 2: Data Collection and Reporting Requirements; ISO Copyright Office: Geneva, Switzerland, 2018. [Google Scholar]
- Jo, H.I.; Jeon, J.Y. Overall environmental assessment in urban parks: Modelling audio-visual interaction with a structural equation model based on soundscape and landscape indices. Build. Environ. 2021, 204, 108166. [Google Scholar] [CrossRef]
- Nitidara, N.P.A.; Sarwono, J.; Suprijanto, S.; Soelami, F.N. The multisensory interaction between auditory, visual, and thermal to the overall comfort in public open space: A study in a tropical climate. Sustain. Cities Soc. 2022, 78, 103622. [Google Scholar] [CrossRef]
- Liu, J.; Kang, J.; Behm, H.; Luo, T. Effects of landscape on soundscape perception: Soundwalks in city parks. Landsc. Urban Plan. 2014, 123, 30–40. [Google Scholar] [CrossRef]
- Southworth, M.F. The Sonic Environment of Cities. Doctoral Dissertation, Massachusetts Institute of Technology, Boston, MA, USA, 1967. [Google Scholar]
- Jo, H.I.; Jeon, J.Y. The influence of human behavioral characteristics on soundscape perception in urban parks: Subjective and observational approaches. Landsc. Urban Plan. 2020, 203, 103890. [Google Scholar] [CrossRef]
- Xiang, Y.; Hedblom, M.; Wang, S.; Qiu, L.; Gao, T. Indicator selection combining audio and visual perception of urban green spaces. Ecol. Indic. 2022, 137, 108772. [Google Scholar] [CrossRef]
- The International Organization for Standardization. PD ISO/TS Acoustics–Soundscape–Part 1: Definition and Conceptual Framework; ISO Copyright Office: Geneva, Switzerland, 2014. [Google Scholar]
- Biljecki, F.; Ito, K. Street view imagery in urban analytics and GIS: A review. Landsc. Urban Plan. 2021, 215, 104217. [Google Scholar] [CrossRef]
- Ode, Å.; Tveit, M.S.; Fry, G. Capturing landscape visual character using indicators: Touching base with landscape aesthetic theory. Landsc. Res. 2008, 33, 89–117. [Google Scholar] [CrossRef]
- Palmer, S.E.; Schloss, K.B.; Sammartino, J. Visual aesthetics and human preference. Annu. Rev. Psychol. 2013, 64, 77–107. [Google Scholar] [CrossRef]
- Kaplan, R.; Kaplan, S. The Experience of Nature: A Psychological Perspective; Cambridge University Press: New York, NY, USA, 1989. [Google Scholar]
- Ruddell, E.J.; Hammitt, W.E. Prospect refuge theory: A psychological orientation for edge effect in recreation environments. J. Leis. Res. 1987, 19, 249–260. [Google Scholar] [CrossRef]
- Kaplan, S. Aesthetics, affect, and cognition: Environmental preference from an evolutionary perspective. Environ. Behav. 1987, 19, 3–32. [Google Scholar] [CrossRef]
- Appleton, J. The Experience of Landscape; Wiley Chichester: New York, NY, USA, 1996. [Google Scholar]
- Maslow, A.; Lewis, K. Maslow’s hierarchy of needs. Salenger Inc. 1987, 14, 987–990. [Google Scholar]
- Bourassa, S.C. Toward a theory of landscape aesthetics. Landsc. Urban Plan. 1988, 15, 241–252. [Google Scholar] [CrossRef]
- Schirpke, U.; Tappeiner, G.; Tasser, E.; Tappeiner, U. Using conjoint analysis to gain deeper insights into aesthetic landscape preferences. Ecol. Indic. 2019, 96, 202–212. [Google Scholar] [CrossRef]
- Russell, J.A.; Lanius, U.F. Adaptation level and the affective appraisal of environments. J. Environ. Psychol. 1984, 4, 119–135. [Google Scholar] [CrossRef]
- Grahn, P.; Stigsdotter, U.K. The relation between perceived sensory dimensions of urban green space and stress restoration. Landsc. Urban Plan. 2010, 94, 264–275. [Google Scholar] [CrossRef]
- Stoltz, J.; Grahn, P. Perceived sensory dimensions: An evidence-based approach to greenspace aesthetics. Urban For. Urban Green. 2021, 59, 126989. [Google Scholar] [CrossRef]
- Meng, Q.; Kang, J. Effect of sound-related activities on human behaviours and acoustic comfort in urban open spaces. Sci. Total Environ. 2016, 573, 481–493. [Google Scholar] [CrossRef]
- Brown, A.L. Advancing the concepts of soundscapes and soundscape planning. In Proceedings of the Conference of the Australian Acoustical Society (Acoustics 2011), Gold Coast, Australia, 2–4 November 2011. [Google Scholar]
- Barber, J.R.; Burdett, C.L.; Reed, S.E.; Warner, K.A.; Formichella, C.; Crooks, K.R.; Theobald, D.M.; Fristrup, K.M. Anthropogenic noise exposure in protected natural areas: Estimating the scale of ecological consequences. Landsc. Ecol. 2011, 26, 1281–1295. [Google Scholar] [CrossRef]
- Farina, A.; Pieretti, N.; Piccioli, L. The soundscape methodology for long-term bird monitoring: A Mediterranean Europe case-study. Ecol. Inform. 2011, 6, 354–363. [Google Scholar] [CrossRef]
- Pijanowski, B.C.; Farina, A.; Gage, S.H.; Dumyahn, S.L.; Krause, B.L. What is soundscape ecology? An introduction and overview of an emerging new science. Landsc. Ecol. 2011, 26, 1213–1232. [Google Scholar] [CrossRef]
- Harris, C.M. Handbook of Acoustical Measurements and Noise Control; McGraw-Hill New York: New York, NY, USA, 1991. [Google Scholar]
- Kliuchko, M.; Heinonen-Guzejev, M.; Vuust, P.; Tervaniemi, M.; Brattico, E. A window into the brain mechanisms associated with noise sensitivity. Sci. Rep. 2016, 6, 39236. [Google Scholar] [CrossRef] [PubMed]
- Liu, J.; Kang, J.; Luo, T.; Behm, H.; Coppack, T. Spatiotemporal variability of soundscapes in a multiple functional urban area. Landsc. Urban Plan. 2013, 115, 1–9. [Google Scholar] [CrossRef]
- Liu, J.; Kang, J.; Luo, T.; Behm, H. Landscape effects on soundscape experience in city parks. Sci. Total Environ. 2013, 454, 474–481. [Google Scholar] [CrossRef] [PubMed]
- Kang, J.; Zhang, M. Semantic differential analysis of the soundscape in urban open public spaces. Build. Environ. 2010, 45, 150–157. [Google Scholar] [CrossRef]
- Jeon, J.Y.; Lee, P.J.; You, J.; Kang, J. Perceptual assessment of quality of urban soundscapes with combined noise sources and water sounds. J. Acoust. Soc. Am. 2010, 127, 1357–1366. [Google Scholar] [CrossRef]
- Axelsson, Ö.; Nilsson, M.E.; Hellström, B.; Lundén, P. A field experiment on the impact of sounds from a jet-and-basin fountain on soundscape quality in an urban park. Landsc. Urban Plan. 2014, 123, 49–60. [Google Scholar] [CrossRef]
- Liu, J.; Wang, Y.; Zimmer, C.; Kang, J.; Yu, T. Factors associated with soundscape experiences in urban green spaces: A case study in Rostock, Germany. Urban For. Urban Green. 2019, 37, 135–146. [Google Scholar] [CrossRef]
- Axelsson, Ö.; Nilsson, M.E.; Berglund, B. A principal components model of soundscape perception. J. Acoust. Soc. Am. 2010, 128, 2836–2846. [Google Scholar] [CrossRef]
- Navickas, E. Urban Soundscape: The Relationship between Sound Source Dominance and Perceptual Attributes along with Sound Pressure Levels. Bachelor Thesis, University of Groningen, Groningen, The Netherlands, 2020. [Google Scholar]
- Kang, J.; Schulte-Fortkamp, B.; Fiebig, A.; Botteldooren, D. Mapping of soundscape. Soundscape Built Environ. 2016, 161, 36. [Google Scholar]
- Tse, M.S.; Chau, C.K.; Choy, Y.S.; Tsui, W.K.; Chan, C.N.; Tang, S.K. Perception of urban park soundscape. J. Acoust. Soc. Am. 2012, 131, 2762–2771. [Google Scholar] [CrossRef]
- Zhang, X.; Ba, M.; Kang, J.; Meng, Q. Effect of soundscape dimensions on acoustic comfort in urban open public spaces. Appl. Acoust. 2018, 133, 73–81. [Google Scholar] [CrossRef]
- Kang, J.; Yang, W. Soundscape in urban open public spaces. World Archit. 2002, 144, 76–79. [Google Scholar]
- Schulte-Fortkamp, B. The quality of acoustic environments and the meaning of soundscapes. In Proceedings of the 17th International Conference on Acoustics, Rome, Italy, 2–7 September 2001. [Google Scholar]
- Moreira, N.M.; Bryan, M. Noise annoyance susceptibility. J. Sound Vib. 1972, 21, 449–462. [Google Scholar] [CrossRef]
- Ellermeier, W.; Eigenstetter, M.; Zimmer, K. Psychoacoustic correlates of individual noise sensitivity. J. Acoust. Soc. Am. 2001, 109, 1464–1473. [Google Scholar] [CrossRef] [PubMed]
- Zimmer, K.; Ellermeier, W. Psychometric properties of four measures of noise sensitivity: A comparison. J. Environ. Psychol. 1999, 19, 295–302. [Google Scholar] [CrossRef]
- Schreckenberg, D.; Griefahn, B.; Meis, M. The associations between noise sensitivity, reported physical and mental health, perceived environmental quality, and noise annoyance. Noise Health 2010, 12, 7. [Google Scholar] [CrossRef]
- Wang, X. The Optimization Study of the Soundscape for the Urban Park Green Space; Tianjin University: Tianjin, China, 2014. [Google Scholar]
- Maristany, A.; López, M.R.; Rivera, C.A. Soundscape quality analysis by fuzzy logic: A field study in Cordoba, Argentina. Appl. Acoust. 2016, 111, 106–115. [Google Scholar] [CrossRef]
- Yang, W.; Kang, J. Acoustic comfort evaluation in urban open public spaces. Appl. Acoust. 2005, 66, 211–229. [Google Scholar] [CrossRef]
- Ministry of Ecology and Environment of the People’s Republic of China. Environmental Quality Standard for Noise; China Environmental Science Press: Beijing, China, 2008.
- Jo, H.I.; Jeon, J.Y. Effect of the appropriateness of sound environment on urban soundscape assessment. Build. Environ. 2020, 179, 106975. [Google Scholar] [CrossRef]
- Aumond, P.; Can, A.; De Coensel, B.; Ribeiro, C.; Botteldooren, D.; Lavandier, C. Global and continuous pleasantness estimation of the soundscape perceived during walking trips through urban environments. Appl. Sci. 2017, 7, 144. [Google Scholar] [CrossRef]
- Motoyama, Y.; Hanyu, K. Does public art enrich landscapes? The effect of public art on visual properties and affective appraisals of landscapes. J. Environ. Psychol. 2014, 40, 14–25. [Google Scholar] [CrossRef]
- Jo, H.I.; Jeon, J.Y. Perception of urban soundscape and landscape using different visual environment reproduction methods in virtual reality. Appl. Acoust. 2022, 186, 108498. [Google Scholar] [CrossRef]
- Liu, J.; Xiong, Y.; Wang, Y.; Luo, T. Soundscape effects on visiting experience in city park: A case study in Fuzhou, China. Urban For. Urban Green. 2018, 31, 38–47. [Google Scholar] [CrossRef]
- Lee, L.-H. Perspectives on landscape aesthetics for the ecological conservation of wetlands. Wetlands 2017, 37, 381–389. [Google Scholar] [CrossRef]
- Plit, J.; Myga-Piątek, U. The degree of landscape openness as a manifestation of cultural metamorphose. Quaest. Geogr. 2014, 33, 145–154. [Google Scholar] [CrossRef][Green Version]
- Liu, Y.; Li, L. Mountainous city featured landscape planning based on GIS-AHP analytical method. ISPRS Int. J. Geo-Inf. 2020, 9, 211. [Google Scholar] [CrossRef]
- Zhang, G.; Yang, J.; Wu, G.; Hu, X. Exploring the interactive influence on landscape preference from multiple visual attributes: Openness, richness, order, and depth. Urban For. Urban Green. 2021, 65, 127363. [Google Scholar] [CrossRef]
- Kawai, K.; Kojima, T.; Hirate, K.; Yasuoka, M. Personal evaluation structure of environmental sounds: Experiments of subjective evaluation using subjects’ own terms. J. Sound Vib. 2004, 277, 523–533. [Google Scholar] [CrossRef]
- Brown, A.; Kang, J.; Gjestland, T. Towards standardization in soundscape preference assessment. Appl. Acoust. 2011, 72, 387–392. [Google Scholar] [CrossRef]
- Liu, J.; Yang, L.; Xiong, Y.; Yang, Y. Effects of soundscape perception on visiting experience in a renovated historical block. Build. Environ. 2019, 165, 106375. [Google Scholar] [CrossRef]
- Nilsson, M.; Botteldooren, D.; De Coensel, B. Acoustic indicators of soundscape quality and noise annoyance in outdoor urban areas. In Proceedings of the 19th International Congress on Acoustics, Madrid, Spain, 2–7 September 2007. [Google Scholar]
- Song, X.; Lv, X.; Yu, D.; Wu, Q. Spatial-temporal change analysis of plant soundscapes and their design methods. Urban For. Urban Green. 2018, 29, 96–105. [Google Scholar] [CrossRef]
- Cao, X.; Hsu, Y. The Effects of Soundscapes in Relieving Stress in an Urban Park. Land 2021, 10, 1323. [Google Scholar] [CrossRef]
- Lyons, E. Demographic correlates of landscape preference. Environ. Behav. 1983, 15, 487–511. [Google Scholar] [CrossRef]
- Hartig, T.; Staats, H. Linking preference for environments with their restorative. Landsc. Res. Landsc. Plan. Asp. Integr. Educ. Appl. 2005, 12, 279. [Google Scholar]
- Staats, H.; Jahncke, H.; Herzog, T.R.; Hartig, T. Urban options for psychological restoration: Common strategies in everyday situations. PLoS ONE 2016, 11, e0146213. [Google Scholar] [CrossRef] [PubMed]
- Kurakata, K.; Mizunami, T.; Sato, H.; Inukai, Y. Effect of ageing on hearing thresholds in the low frequency region. J. Low Freq. Noise Vib. Act. Control 2008, 27, 175–184. [Google Scholar] [CrossRef]
- Bahalı, S.; Tamer-Bayazıt, N. Soundscape research on the Gezi Park–tunel square route. Appl. Acoust. 2017, 116, 260–270. [Google Scholar] [CrossRef]
- Hinton, P.R. Statistics Explained; Routledge: London, UK, 2014. [Google Scholar]
- Yang, M. A Review of Regression Analysis Methods: Establishing the Quantitative Relationships between Subjective Soundscape Assessment and Multiple Factors; Universitätsbibliothek der RWTH Aachen: Aachen, Germany, 2019. [Google Scholar]
- Lionello, M.; Aletta, F.; Kang, J. A systematic review of prediction models for the experience of urban soundscapes. Appl. Acoust. 2020, 170, 107479. [Google Scholar] [CrossRef]
- Hong, J.Y.; Lam, B.; Ong, Z.-T.; Ooi, K.; Gan, W.-S.; Kang, J.; Yeong, S.; Lee, I.; Tan, S.-T. The effects of spatial separations between water sound and traffic noise sources on soundscape assessment. Build. Environ. 2020, 167, 106423. [Google Scholar] [CrossRef]
- Green, M.; Murphy, D. Environmental sound monitoring using machine learning on mobile devices. Appl. Acoust. 2020, 159, 107041. [Google Scholar] [CrossRef]
- Hong, J.Y.; Jeon, J.Y. Designing sound and visual components for enhancement of urban soundscapes. J. Acoust. Soc. Am. 2013, 134, 2026–2036. [Google Scholar] [CrossRef]
- Viollon, S.; Lavandier, C.; Drake, C. Influence of visual setting on sound ratings in an urban environment. Appl. Acoust. 2002, 63, 493–511. [Google Scholar] [CrossRef]
- Xu, X.; Wu, H. Audio-visual interactions enhance soundscape perception in China’s protected areas. Urban For. Urban Green. 2021, 61, 127090. [Google Scholar] [CrossRef]
- Pheasant, R.J.; Fisher, M.N.; Watts, G.R.; Whitaker, D.J.; Horoshenkov, K.V. The importance of auditory-visual interaction in the construction of ‘tranquil space’. J. Environ. Psychol. 2010, 30, 501–509. [Google Scholar] [CrossRef]
- Guan, H.; Hu, S.; Lu, M.; He, M.; Mao, Z.; Liu, G. People’s subjective and physiological responses to the combined thermal-acoustic environments. Build. Environ. 2020, 172, 106709. [Google Scholar] [CrossRef]
Publisher’s Note: MDPI stays neutral with regard to jurisdictional claims in published maps and institutional affiliations. |
© 2022 by the authors. Licensee MDPI, Basel, Switzerland. This article is an open access article distributed under the terms and conditions of the Creative Commons Attribution (CC BY) license (https://creativecommons.org/licenses/by/4.0/).