Article

Carbon Storage Expectations on Swamp Jelutung (Dyera polyphylla Miq. Steenis.) on Peatland for Tackling Climate Change

1
The Maluku-Papua Region Social Forestry and Environmental Partnership Center, Jl. Kebun Cengkeh, Ambon 97128, Indonesia
2
Forestry Department, Faculty of Agriculture, Pattimura University, Jl. Ir. M. Putuhena, Ambon 97233, Indonesia
*
Author to whom correspondence should be addressed.
Forests 2022, 13(8), 1297; https://doi.org/10.3390/f13081297
Submission received: 15 June 2022 / Revised: 22 July 2022 / Accepted: 3 August 2022 / Published: 15 August 2022
(This article belongs to the Special Issue Carbon Fluxes and Production in Forest Ecosystems)

Abstract

:
(1) Background: The destruction of peatlands caused by forest fire can significantly damage the ecosystems, flora, and fauna found in forests. Swamp jelutung (Dyera polyphylla) is a tree species that can be planted on peatland and combined with seasonal plants to provide multiple economic and environmental benefits. The aim of this study is to analyze the biomass and carbon stocks above and belowground in stands of swamp jelutung of an age class of 10, 13, and 17 years. (2) Methods: Observation plots were determined based on the age classes of D. polyphylla plants. The plots were determined using a purposive sampling method with a size of 20 m × 5 m with two sample plots in each class of plant age. The biomass calculation measured the diameters of living trees without causing any damage. The understory biomass was obtained by cutting and then placing in a container before weighing and recording the wet weight. The necromass was determined by measuring the diameter and length of all the wood. (3) Results: The amount of aboveground biomass (trees) was divided into 111.73 ton/ha (17 years), 55.96 ton/ha (13 years), and 50.08 ton/ha (10 years) age classes. The root biomass had the highest values of 18.36 ton/ha (17 years), 9.45 ton/ha (13 years), and 9.07 ton/ha (10 years). Meanwhile, the organic C contents in peat soil under stands of D. polyphylla were 33.45% (13 years), 31.32% (17 years), and 26.14% (10 years). (4) Conclusions: D. polyphylla trees play a role in restoring forest ecosystems on peatlands and absorb more CO2 as the trees age. Therefore, they are useful in dealing with climate change.

1. Introduction

The forest and land fires on peatlands in Sumatra, Riau, and Kalimantan have significantly impacted the destruction of ecosystems, flora, and fauna in forests. Peatland fires occur due to drought through the drainage system or forest area clearing on a large scale. After a fire incident, most living species in the forest find it challenging to return to their original states. The vegetation community differs from the original types that made up the peat forest before the incident [1]. Peatlands have distinct subsidence, irreversible drying properties, poor mineral nutrients, and high acidity but can quickly burn in the absence of water [2]. The smoke produced causes upper respiratory tract infections, asthma, and chronic obstructive pulmonary disease of the respiratory tract.
Air quality due to peatland burning has decreased. According to the results of a study in Pelalawan Village (Riau Province), the average emissions on a sapric plot were 273 ppm CH4, 10,395 ppm CO2, and 1223 ppm CO and in hemic plots were 306 ppm, 10,678 ppm, and 2176 ppm, respectively. The content of high CO emissions means that combustion occurs completely from wet (moist) conditions [3]. The appearance can interfere with visibility, especially for flight transport. In addition, smoke from forest and land fires can reach neighboring countries, such as Singapore, Malaysia, and their surrounding areas [4]. Peatlands have large terrestrial carbon stocks and are also a significant source of CO2, CH4 and N2O emissions, thus requiring appropriate and sustainable management.
The conditions that result in the release of carbon from peatlands usually arise from human activities and peat forest fires. Carbon emissions into the atmosphere in the form of CO2, CH4, and N2O gases are the cause of increasing greenhouse gas (GHG) concentrations, resulting in global warming. The clearing of peatlands for agricultural and plantation development is also a source of GHG emissions. In general, this begins with the creation of various drainages for draining peatlands. Given the importance of GHG emissions on peatlands, the IPCC made the 2013 Supplement to the 2006 IPCC Guidelines for National Greenhouse Gas Inventories: Wetlands. According to the Supplement, CH4 emissions from drainage canals can reach CH4 2259 kg/ha/year or the equivalent of 47 tons of CO2-e/ha/year [5].
Furthermore, they are a massive carbon storehouse, recognized as an essential sub-stance from greenhouses in global warming. Many failures of peat forest conversion to oil palm plantations have resulted in environmental degradation, such as loss of biodiversi-ty, damage to ecosystem functions, and other side effects. Forest and peatland fires release many carbon emissions to drive climate change. As a result, they destroy tropical wetland ecosystems and accelerate the process of climate change. The recovery time for forest eco-systems damaged by fire is very long, taking 30–50 years or more. Therefore, comprehen-sive forest fire disaster risk management is needed between ministries and government agencies, including neighboring countries, within the ASEAN Agreement on Disaster Risk Management [6].
The action to restore damaged forest ecosystems includes planting tree species that live on peatlands, and a local type is chosen, which has its peculiarities. In addition, this tree species has a high commercial value compared to others. This includes balangeran (Shorea balangeran), kempas (Kompasia malaccensis), meranti rawa (Shorea pauciflora), and jelutung rawa (Dyera polyphylla), etc. Planting jelutung rawa (D. polyphylla) can provide multiple benefits for economic and environmental conservation. Furthermore, hydrological regulation techniques and appropriate agricultural practices on peatlands can benefit D. polyphylla without contributing to increased GHG emissions [7]. According to [8], Dyera spp. are used as food, medicine, housing, and trade goods. The sap produced can be sold to generate income for the community around the forest. D. polyphylla has turned out to be tolerant of inundation conditions even though it had only been planted for 2 weeks [9]. This plant is the most suitable species for deep peatlands because of its high-speed growth [10].
An effort to convert peatlands into forests is through peat restoration, which has different stages of activities carried out in the form of mapping, species determination and restoration, timing, implementation, and special approaches to improve the local community’s economy. An area’s cultivation method and the amount of carbon-stock-lowering emissions should be determined to restore forest ecosystems on degraded peatlands of this type. This includes the knowledge of the flowering and fruiting period, where this tree flowers in some areas in November and produces ripe fruit from February to May [11]. Therefore, a strategic solution applied to reduce the greenhouse effect is planting local types of plants with superior properties that are resistant to climate change and maintain field capacity conditions. Forest and land management efforts should involve the community in a participatory manner in areas encumbered with rights. The efforts to use land are in line with the mandate of Law no. 41 of 1999 concerning Forestry, namely, “Forestry development can increase the capacity of the community in the economic, social and environmental sustainability sectors in an equitable and environmentally friendly manner”. The calculations should measure the information on emission and absorption factors for peat swampland. The main challenge in calculating the emission levels and references is complying with monitoring, reporting, and verification principles. Information on carbon stocks in peat swampland can determine emission and absorption factors for GHG gases in the forestry sector at the national level, particularly in the Central Kalimantan Province (central Indonesia). According to [12], there was a significant variation in annual GHG emissions and removals in Central Kalimantan Province, reflecting the impact of previous and current land management practices. Likewise, there were fluctuations in weather conditions, especially in the dry season, with higher fires.
Forests on peatlands play an important role in reducing global warming because they have global carbon storage capacity in the soil and climate moderation, regulate water management, and support people’s lives. The information on carbon stocks in peat swampland can become a reference for parties in making technical decisions, such as (a) the planting vegetation types to increase carbon sequestration and (b) the prediction of emissions in certain forest types and trees at the time of felling. Furthermore, peatlands have large terrestrial carbon stocks and are also a significant source of CO2 emissions, thus requiring appropriate and sustainable management. The purpose of this research is to analyze the biomass and carbon stocks above and belowground in stands of swamp jelutung of 10-, 13-, and 17-years age class. One of the benefits of this research is to provide important information in an efforts to restore degraded peat swamp land for climate change management.

2. Materials and Methods

Figure 1 shows a research location in the community-owned forest in Jabiren Village, Pulang Pisau Regency, Central Kalimantan Province.
Carbon stock measurements were carried out on D. polyphylla located on communi-ty-owned land. The jelutung swamp stands were divided into 17 years, 13 years, and 10 years of age classes. The sketch of the research location is presented in Figure 2.
The research implementation procedure was as follows:
1.
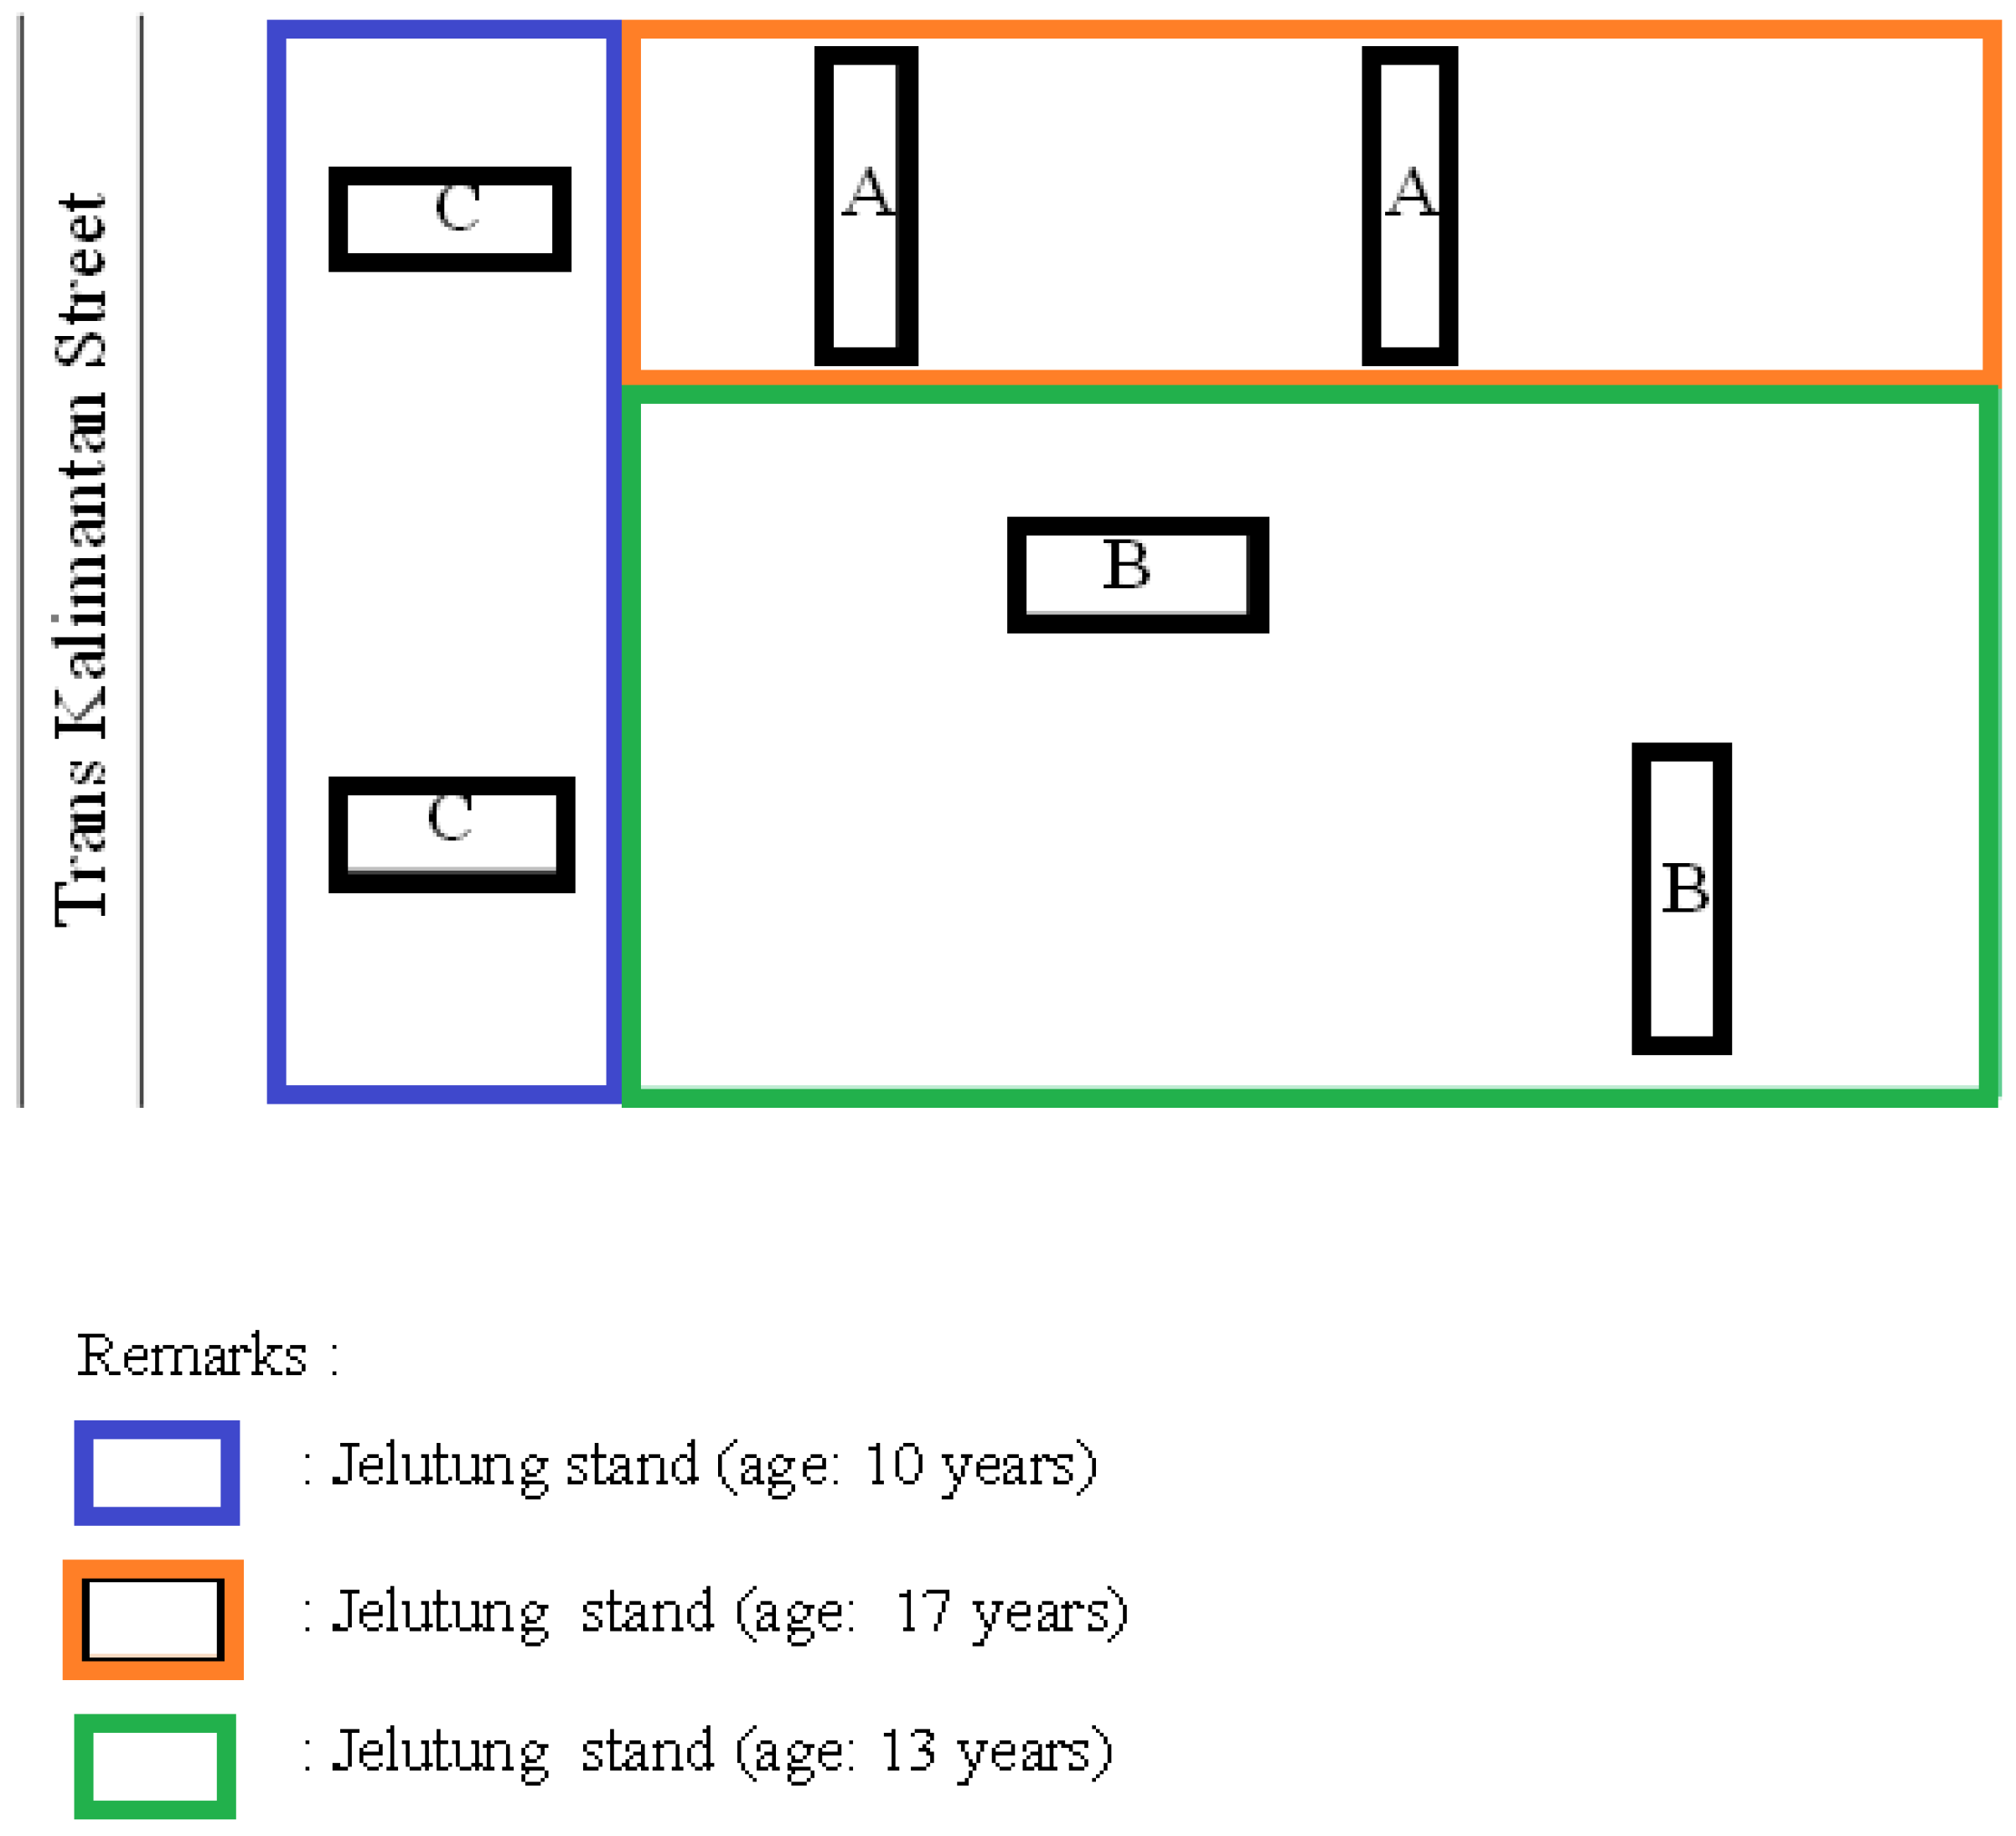
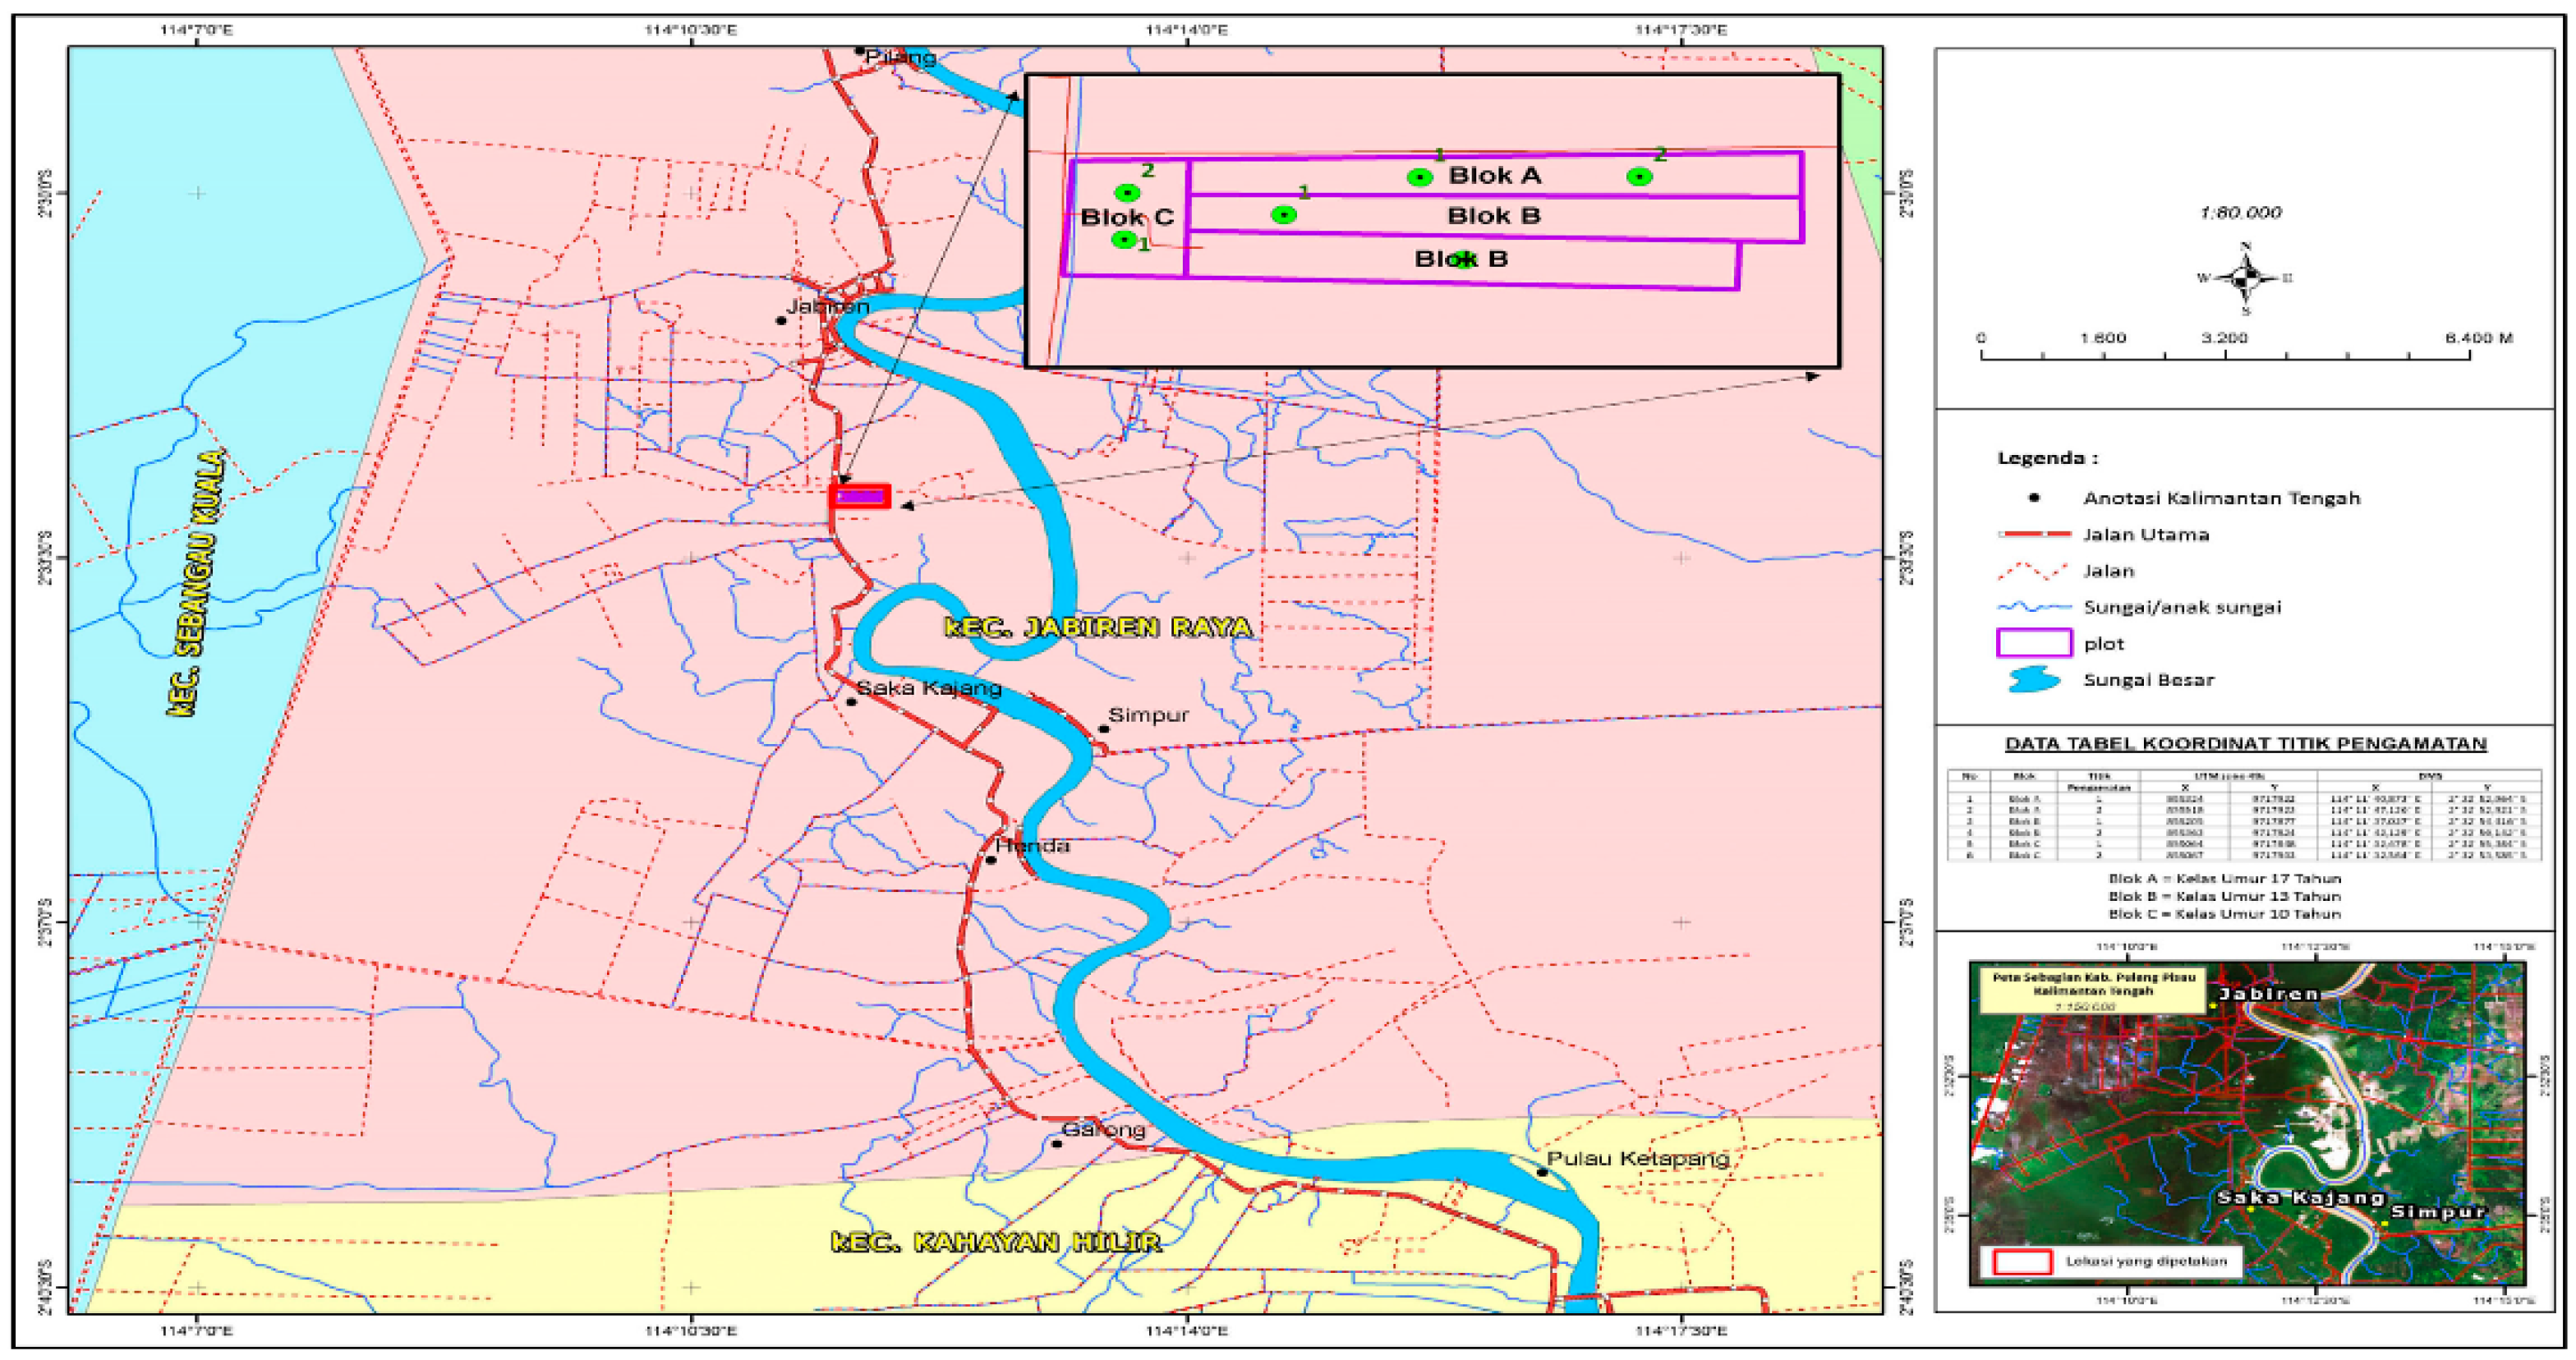
Observation plots were determined based on the age classes of D. polyphylla plants by measuring and marking the boundary markers with ribbons to mark the boundaries of the plots. The plots were determined using a purposive sampling method with a size of 20 m × 5 m (area = 0.01 ha) for 2 (two) sample plots in each class of plant age.
2.
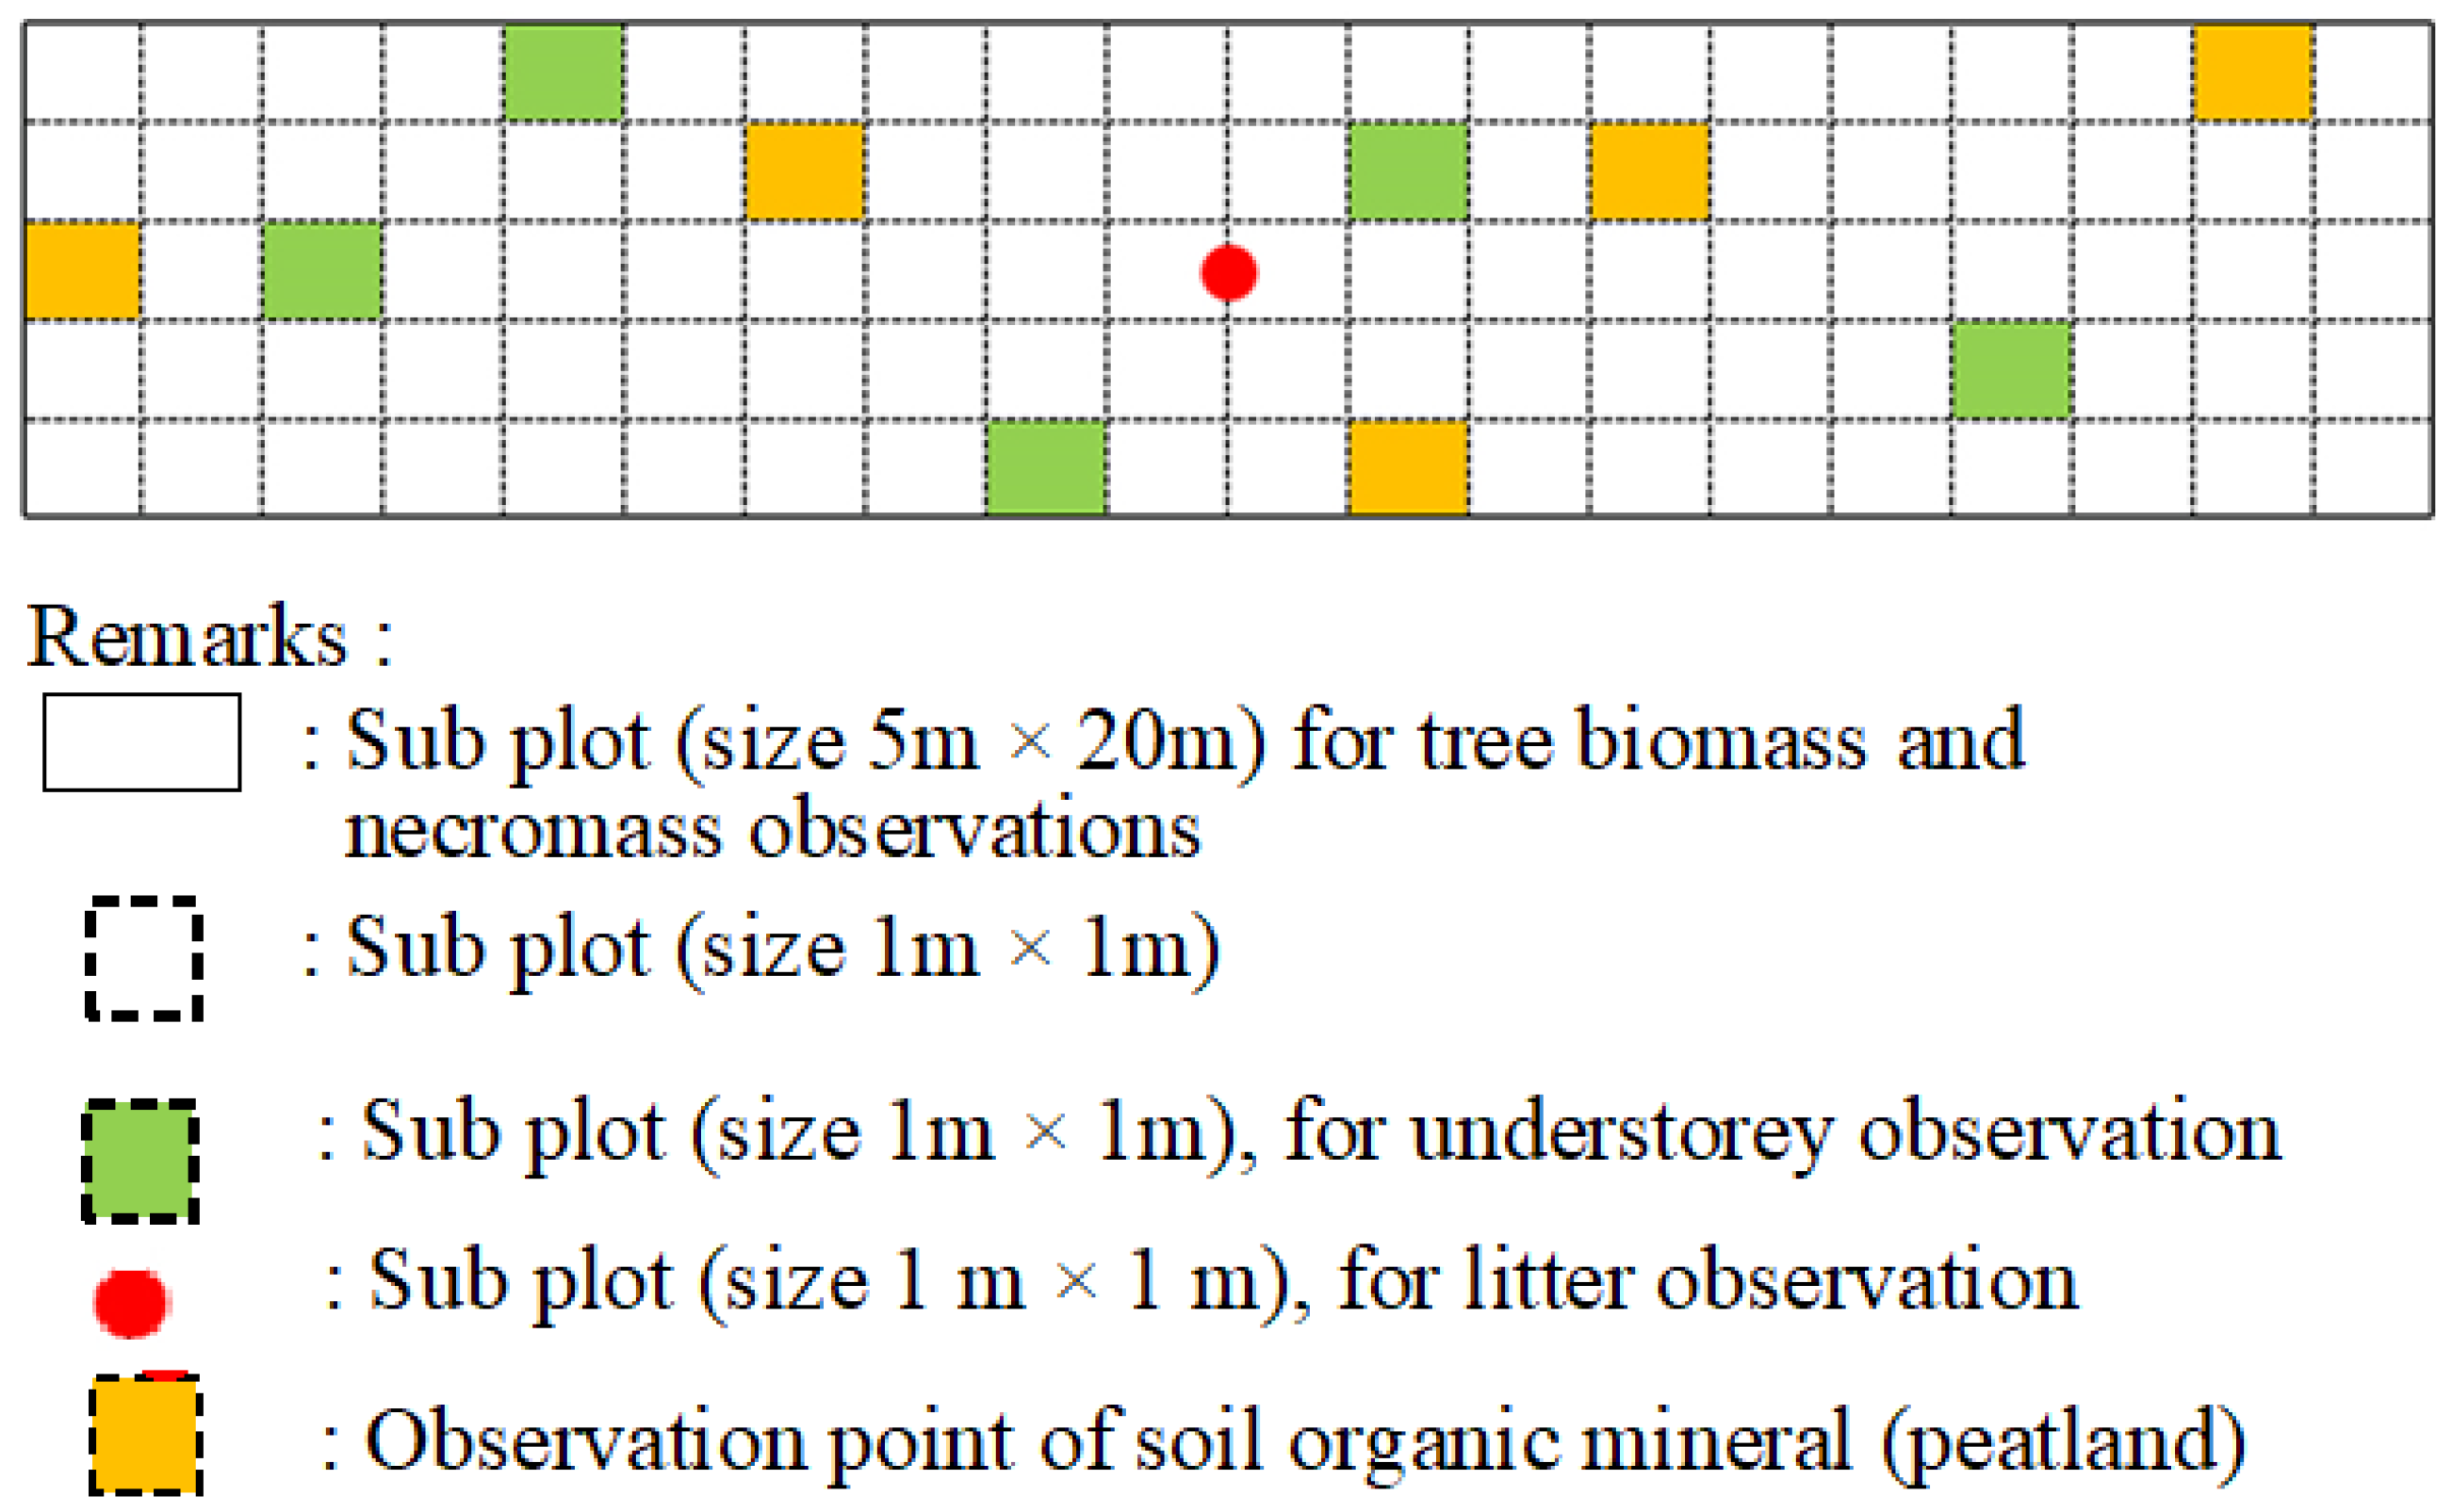
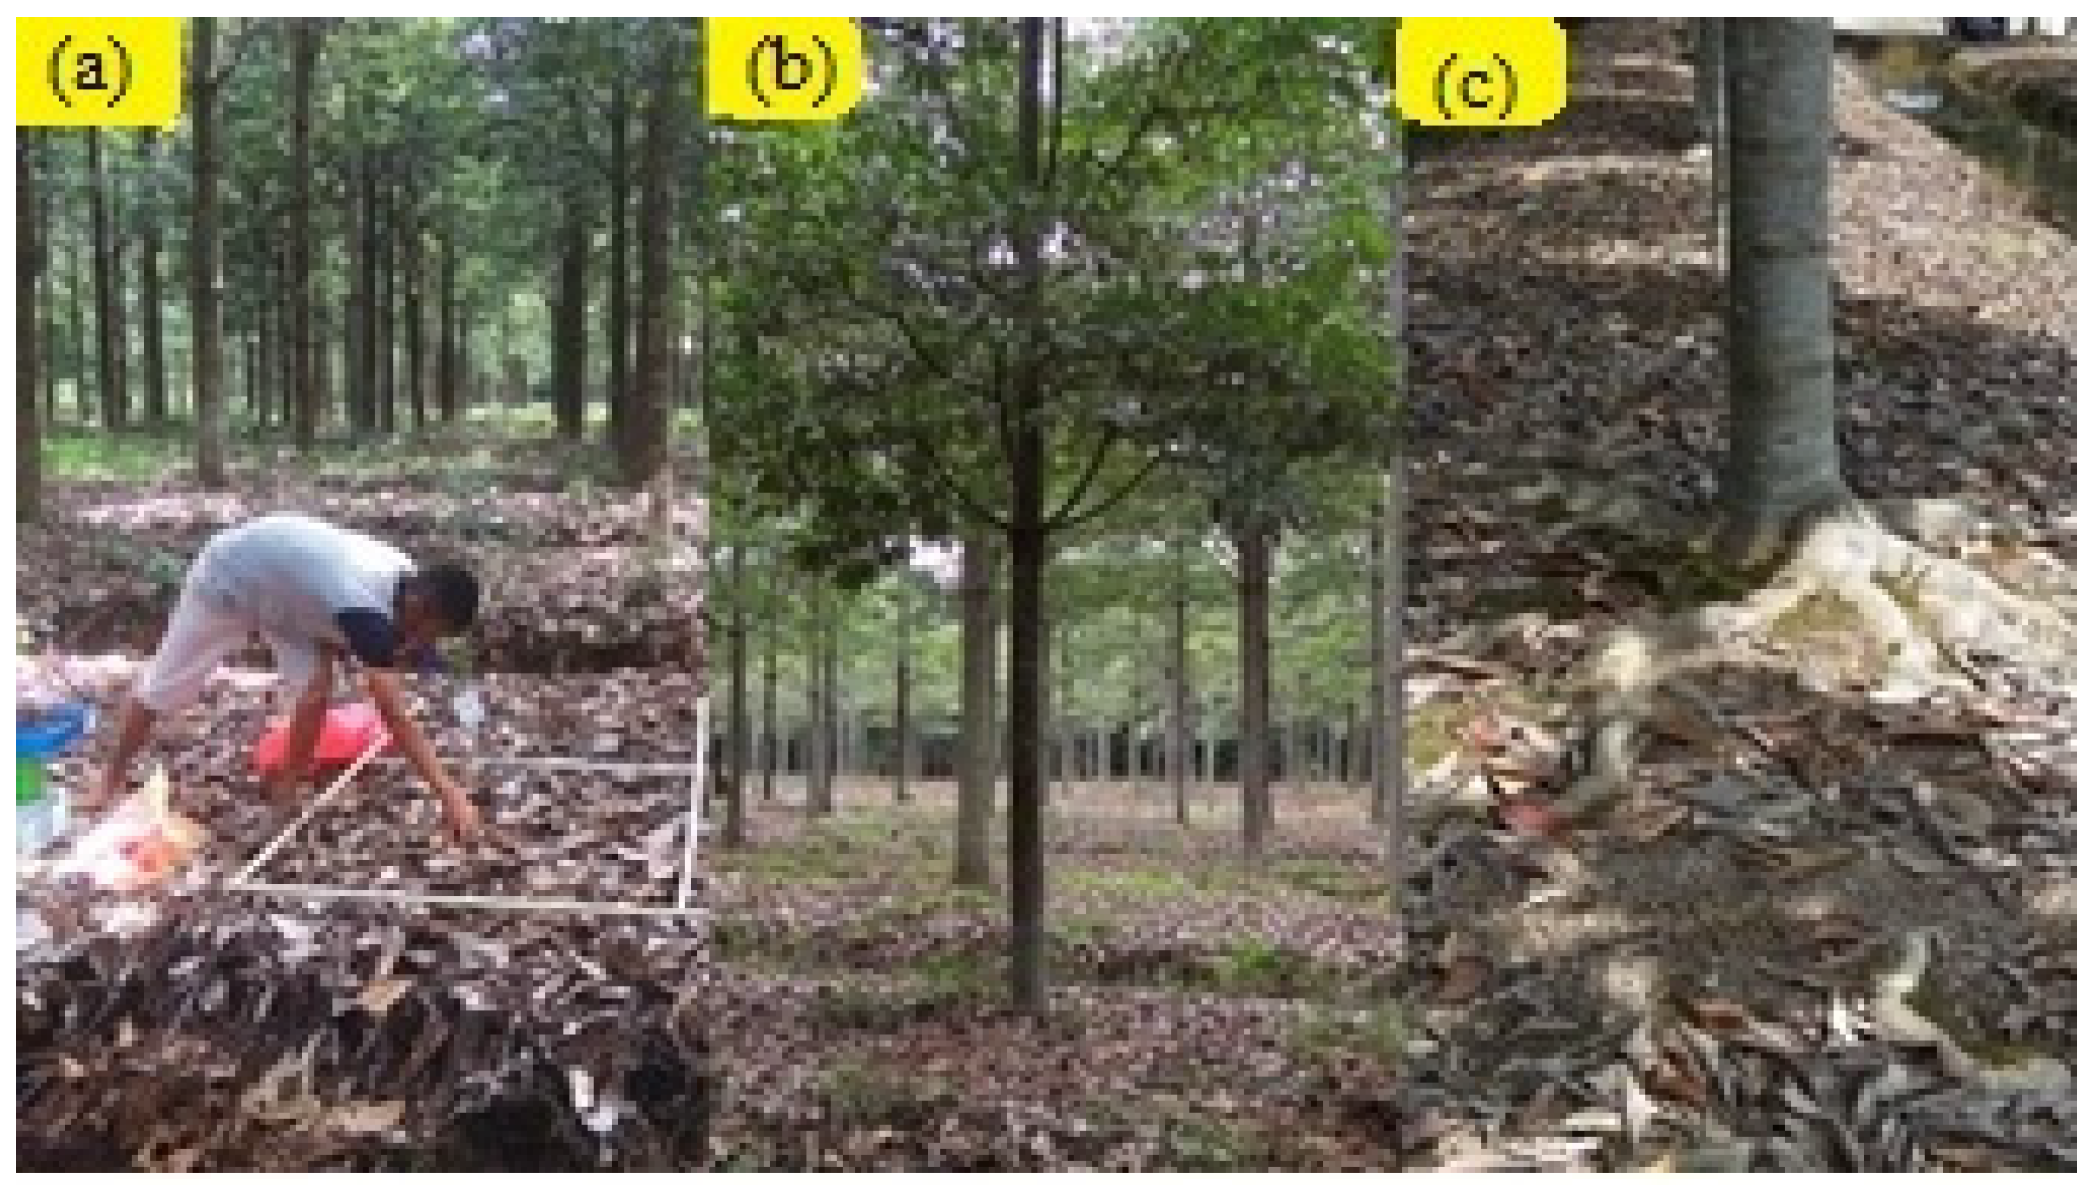
We created an observation subplot measuring 1 m × 1 m (area 1 m2) in the observation plots for each plant age class to observe understory and litter in the plots. The observed subplots were determined randomly with 5 subplots, as shown in Figure 3.
3.
The tree biomass calculation used the measurement of the diameters of living trees without damage in the measuring plots of 5 m × 20 m with two replications.
4.
To measure the understory biomass, 10 plots of samples were made randomly using a 1 m × 1 m plot. The plots’ lower plants (shrubs, grass, and herbs) were obtained by cutting and then placed in a container. The wet weight was recorded after weighing, and 200 g of lower plants were taken. The samples were put in plastic bags and then labeled to be taken to the laboratory. This activity calculated the dry weight in an oven, and from a plot of 1 m × 1 m, a wet weight of understory <200 g was used as a sample.
5.
Measurement of the wood necromass was carried out in a plot of 20 m × 5 m by measuring the diameter and length. The measurement of necromass was carried out in two forms, namely wood and dead trees. Deadwood was a fallen tree with a diameter of ≥2.5 cm and a length of ≥1 m. It consisted of 3 categories: good, moderate, and a degree of weathering. Dead trees could stand upright with a height of ≥1 m and a diameter of ≥2.5 cm [13]. They were categorized based on the level of the tree’s integrity, affecting the amount of carbon stored in this section.
6.
Carbon storage in the litter necromass was dead biomass with a size larger than soil organic matter, as well as deadwood measuring <2.5 cm with a height <1 m that underwent a decay process on the surface or became soil organic minerals [14]. The plot for measuring carbon storage for litter types was a square with an area of 1 m2 (1 m × 1 m). Therefore, measurement plots of 10 units were randomly placed on the research subplot.
7.
Data processing:
(a)
Measurement of tree biomass:
We entered the tree diameter data into the allometric model developed by [15] with the following model equation:
B A P = f D B H
B A P = a + D B H b
L N B A P = a + b . L N D B H
L N B A P = 1.831 + 2.348 . L N D B H
B A P = E x p   L N B A P
where
BAP: aboveground biomass in kg
DBH: diameter at breast height in cm
The root biomass content was estimated using the root-to-shoot ratio (RSR) method. The allometric equation used in [13] was as follows:
B B P = E x p   1.0587 + 0.8836 × L N B A P
where
BBP: belowground biomass in kg
BAP: aboveground biomass in kg
(b)
The laboratory measured the dry weight of the understory biomass and litter necromass. The biomass estimation formula was used to calculate the amount of understory biomass and litter necromass stored in a 1 m × 1 m plot as follows:
W k t = W K c W B c × W B t
where
WKt: total dry biomass (g)
WBt: total wet biomass (g)
WBc: sample of wet biomass (g)
WKc: sample of dry biomass (g)
(c)
Measurement of the dry weight of woody necromass:
The calculation of the dry weight of the necromass using the allometric formula for living trees referred to the research of [13]. The allometric equation for estimating the total biomass of deadwood used that of living trees multiplied by a correction or decomposition factor. The following formula was used to calculate the biomass of D dead trees:
N P M = 0.25   π D 1 + D 2 2 × 100 2 × T × R K ρ
where
NPM: dead tree necromass (kg)
π: 22/7
D1, D2: base and tip diameter, respectively (cm)
T: tree height (m)
RKρ: mean squared density of deadwood (kg/m3)
The value of the correction factor in calculating the biomass of dead trees was based on SNI (Indonesian National Standard) measurements according to carbon stock:
Dead Tree A: multiplied by the value of correction factor 0.9.
Dead Tree B: multiplied by the value of correction factor 0.8.
Dead Tree C: multiplied by the value of correction factor 0.7.
(d)
Calculation of the amount of C stored between fields:
The calculation of the amount of carbon stored per plot followed the research procedure. Most laboratory results use dry weight and biomass parameters, not carbon units. In contrast, all estimates of biomass units use total carbon, and the content analysis requires special tools and methods [13]. The use of universal carbon estimates at the global level corresponds to a correction factor of 0.47 [14]. Therefore, all measurement sources in the field should calculate the total carbon in each subplot and convert it to tons/ha. The extrapolation process should pay attention to the area of the subplot. The total biomass calculation for the mathematical equation plot was as follows:
B P   p l o t = B P 1 × 10 / p l o t   a r e a 1 + B P 2 × 10 / p l o t   a r e a 2 + B P 3 × 10 / p l o t   a r e a 3
where
BP plot: total tree biomass in the plot (ton/ha)
BP123: total tree biomass in plots 1, 2, and 3, respectively (kg)
Plot area123: width of plots 1, 2, and 3, respectively (m2)
Necromass and other biomass could be calculated using the above formula.
The following formula was used to calculate each biomass component in the land:
B = B P + B A + B T b + N S + T G N P l o t
where
B: average biomass and necromass in the land (ton/ha)
∑ BP: total tree biomass from all the plots (ton/ha)
∑ BA: total root biomass of all the plots (ton/ha)
∑ BTb: total understory biomass from all the plots (ton/ha)
∑ NS: total litter necromass of the entire plot (ton/ha)
∑ TG: total peat soil biomass from all the plots (ton/ha)
N plot: total plots
The mathematical equation for calculating the conversion of biomass to carbon (C) was:
C   s t o c k = B . C F
where
C stock: amount of carbon stored on average (ton/ha)
B: average biomass and necromass of land (ton/ha)
CF: carbon fraction (0.47)
The data measurements were tabulated and analyzed using a t-test analysis to determine the differences in biomass and the amount of carbon stored in each age class of D. polyphylla stand on peatlands. The calculation result was then compared with the t-table value for certain degrees of freedom, and there were two alternative hypotheses, as follows:
There was a real difference when t count > t tabel.
There was no real difference when t count < t tabel.
The hypothesis predictions used 95% (0.05) and 99% (0.01) levels of confidence. These differences were stated as “real” (significant) or “very real” (very significant) [16]. An ANOVA analysis and Tukey test at the 95% confidence level were carried out to determine the effects of D. Poliphylla’s age on the amount of carbon (C) stored in each constituent component.

3. Results

The aboveground biomass at the D. polyphylla stand location consisted of biomass and necromass. The components of biomass consisted of swamp jelutung trees and undergrowth. Meanwhile, the necromass was only found in the aboveground litter under the D. polyphylla stands, and the total plant biomass consisted of three age classes. In age class I (17 years), the plants had the most significant amount of biomass savings at 111.73 ton/ha compared to II (13 years) III (10 years), with storage values of 55. 96 ton/ha and 50.08 ton/ha, respectively, as seen in Table 1.
The calculations of the amounts of biomass found in the understory under D. polyphylla stands in three classes are presented in Table 2.
The results of the litter necromass observations in each plot are presented in Table 3.
The subsurface biomass component at the study site consisted of the roots of the swamp D. polyphylla plants and the peat soil. Observation of the biomass stores in the roots of D. polyphylla was carried out using the root-to-shoot ratio (RSR), as presented in Table 4.
The condition and organic C content in peat soil under stands of D. polyphylla can be seen in Table 5.
Figure 4 depicts the average amounts of stored biomass per constituent component aboveground in D. polyphylla, which became the average amount of C stored in each constituent component aboveground.
Statistical tests were carried out to determine the truth of the hypotheses. The results of the one-way ANOVA analysis for the average amounts of C stored in the jelutung swamp trees for three age classes are presented in Table 6.
The honest real difference test is presented in Table 7.
One-way Anova analysis results for the average amounts of C stored in the litter under D. polyphylla stands for three age classes are presented in Table 8.
In addition to trees and litter as constituent components of C stored on the surface, understory was also found with the lowest average value compared to the other two on the surface. Table 9 shows the paired t-test for the average amounts of C stored in plants from three age classes of the D. polyphylla stand at a 95 percent confidence level.
Paired t-test results for the average amounts of C stored in plants under D. polyphylla stands for two age classes are presented in Table 10.
Storage was also found below the surface with constituent components, including the roots of the D. polyphylla trees and the peat soil. Figure 5 depicts the average amounts of C deposited belowground.
The carbon stock was estimated based on the amount of biomass contained in its constituent components in one land unit. From the observations, the amounts of C stored in the D. polyphylla stand for three age classes were as follows:
Table 11 shows that the most significant average numbers of stored C were in the class I plot (751.77 ton/ha), followed by the class II plot (725.85 ton/ha) and the class III plot (533.53 ton/ha). The paired t-Test was for the total amount of C stored both aboveground (BAP) and belowground (BBP) at 95% confidence intervals. The results showed that plant age did not affect the total amount of C stored in each plant age class.
Paired t-test results for the amounts of C stored both aboveground (BAP) and belowground (BBP) are presented in Table 12.

4. Discussion

Based on Table 1, in age class I (17 years), plants had the most significant amount of biomass savings at 111.73 ton/ha compared to age classes II (13 years) and III (10 years), with storage values of 55. 96 ton/ha and 50.08 ton/ha, respectively. The growing conditions for age class I (age 17 years) were peat land with an average depth of 0.92 m, mature peat (sapric), and constant moisture due to overflowing river or brackish water. For age class II (age 13 years) and age class III (age 10 years), the peat land was relatively shallow with an average depth of 0.90 and 0.86 m, the peat was undercooked (hemic), and it was wet due to overflow or rainfall. The location of the peatlands for age classes II and III was far from the river flow, while age class I was close to the river flow. This indicated that the growing conditions of age class I were relatively more fertile than those of age classes II and III, so the amount of biomass stored in age class I was almost twice that of age class II. In addition to D. polyphylla having a high biomass content, this species also has the highest percentage of survival rate at 98%. This high percentage is because jelutung is one of the native tree species of peat swamp forests. This species is generally one of the types of trees commonly used for restoration activities. This consideration is because it has a high conservation value, and there are advantages such as good adaptability to peat swamp land, which is always inundated or periodically inundated, so that it can survive despite unfavorable environmental conditions [17]. The biomass content was almost 4.5 times greater in class I because the stands studied were older than 17 years.
Based on Table 2, the largest average amount of biomass was found in understory plants under the marsh jelutung stands of age class II, with a biomass value of 1.18 ton/ha, followed by age class I at 1.15 ton/ha and age class III at 1.00 ton/ha. This was because the canopy density of marsh jelutung at age class II is still relatively loose, causing a lot of sunlight to enter the floor below the stand compared to the dense canopy density at age class I. The average widths of the canopies for age classes I, II, and III, respectively, were 7.8 m, 6.1 m, and 5.8 m. The presence of plant types that make up the understory community is closely related to the intensity of incoming light and is less influenced by other factors, such as the availability of nutrients in the soil. The contribution of the understory to the aboveground biomass varied but was generally quite small. However, this component was still included in the analysis to produce a complete estimate of the total aboveground forest biomass [18]. Underground plants are one of the providers of aboveground carbon biomass. They absorb carbon and leave the atmosphere with CO2 through the decomposition process. Understory plants also serve as a groundcover that is kept moist by the soil, allowing the decay process to occur quickly and providing nutrients for staple plants [19].
Litter is organic material that is above the soil surface. Under the stands of D. polyphylla, it was mainly sourced from the leaves, twigs, and fruits, and a small part came from the dead understory. The leaf litter of D. polyphylla was slow to decompose because the dry part was stiff and could be crushed into small pieces with sharp sides. Based on Table 3, it can be seen that the average value of the litter necromass was greater than the understory biomass. To clarify the condition of litter in jelutung stands for age classes I, II, and III at the study site, see Figure 6.
This is not consistent with the research results of [20] at the tailings deposition area of PT Freeport Indonesia, which stated that the biomass and carbon stock values of litter were lower than that of understory plants. It was suspected to be related to organic matter’s decomposition process, which took place more quickly in the litter. This could happen because each vegetation that makes up forest stands produces different biomass quality, especially in the contents of litter and understory biomass. Furthermore, the remaining biomass is a source of organic matter that improves the soil quality.
Based on Table 4, the total root biomass values for the plant age classes of 17 years, 13 years, and 10 years were 18.36 ton/ha, 9.45 ton/ha, and 9.07 ton/ha, respectively. Jelutung has a high conservation value, and there are advantages such as good adaptability to peat swamp land, which is always inundated or periodically inundated, so that it can survive despite unfavorable environmental conditions. Peat soil is rich in organic matter because it is formed from plant debris that is not completely decomposed. It is also the most important buffer for ecosystems because of its high carbon storage and water retention capacity. In addition, peat is a participatory ecosystem for carbon storage and air release and can be used as a resource for agriculture, forestry, and energy. In addition, peatlands have many regulatory, production, and economic functions [21].
The most significant contribution to the total C stored in the subsurface is peat soil as its constituent component, but statistically, this is not the case. This indicates that the vegetation of the stems and roots are also two critical components in biomass allocation. This is closely related to the amount of C stored on the upper surface. In addition, the age of the tree/stand with a diameter affects the amount of biomass contained, and the amount of litter produced by D. polyphylla stands has an impact on biomass and C stored.
The aboveground and belowground biomass of D. polyphylla increased with the increasing age classes of 10, 13, and 17 years. In our opinion, this observation can be used for determining the maximum jelutung biomass cycle to be harvested and the maximum tree volume cycle. Usually, it is determined by means of the graph intersection between the mean annual increment (MAI) and the current annual increment (CAI) to determine the maximum volume cycle, as has been conducted in Southeastern Brazil [22]. Thus, the measurement of the biomass of D. Polyphylla can be used for peat restoration in the context of handling climate changes as well as helping in handling forest management.
Table 11 clearly shows that the amount of C stock below the surface was much larger than the C stock above the surface. In addition, the deeper the peat, the greater the carbon content. This is in accordance with the results of research on Pematang Gadung Peat Swamp Forest and Lesan River Protection Forest, Kalimantan [23]. In general, the compo-sitions of C stock in peatlands are greater below the surface than above and vice versa for dry land or mineral soils above the surface compared to below the surface.

5. Conclusions

The aboveground biomass of D. polyphylla increases with the age classes of 10, 13, and 17 years to 50.08 ton/ha, 55.96 ton/ha, and 111.73 ton/ha. Necromass biomass also increases the age class to 10.14 ton/ha (10 years), 14.04 ton/ha (13 years), and 24.61 ton/ha (17 years). Likewise, the belowground biomass increases the age class to 9.07 ton/ha (10 years), 9.45 ton/ha (13 years), and 18.36 ton/ha (17 years). Furthermore, the highest understorey and peat biomasses were found in the 13-year age class of 1.18 ton/ha. C stock aboveground increased from age class III, II, and I to 14.15 ton/ha, 16.69 ton/ha, and 32.31 ton/ha, respectively. Likewise, C stock belowground increased from age class III, II, and I to 533.53 ton/ha, 725.85 ton/ha, and 751.77 ton/ha. D. polyphylla trees play a role in restoring forest ecosystems on peatlands and absorbing more CO2 as the tree ages; therefore, it is useful in dealing with climate change. In addition, this species has a high conservation value, and there are advantages such as good adaptability to peat swamp land, which is always inundated or periodically inundated so that it can survive despite unfavorable environmental conditions.

Author Contributions

Conceptualization, D.S.; methodology, D.S. and G.M.; software, D.S.; validation, G.M.; formal analysis D.S. and G.M.; investigation, D.S.; resources, D.S and G.M.; data curation, D.S.; writing—original draft preparation, D.S.; writing—review and editing, G.M.; visualization, G.M.; supervision, G.M.; project administration, D.S.; funding acquisition, G.M. All authors have read and agreed to the published version of the manuscript.

Funding

This research was funded by the head of the Maluku-Papua Region Social Forestry, the Environmental Partnership Center, and Gun Mardiatmoko.

Data Availability Statement

Not applicable.

Acknowledgments

The authors are grateful to the head of the Maluku-Papua Region Social Forestry and the Environmental Partnership Center for funding most of this research in 2019.

Conflicts of Interest

The authors declare no conflict of interest.

References

  1. Istomo Komar, T.E.; Tata, M.H.L. Hutan Rawa Gambut di Indonesia; Indonesia’s Work Programme for 2008 ITTO CITES Project; Pusat Penelitian dan Pengembangan Hutan dan Konservasi Alam Badan Penelitian dan Pengembangan Kehutanan, Kementerian Kehutanan: Bogor, Indonesia, 2010; ISBN 9786029584233. [Google Scholar]
  2. Daryono, H. Lahan Rawa Gambut Secara Lestari (Potency, problems, policy and peatland management needed for sustainable peat swamp forest). J. Anal. Kebijak. Kehutan. 2009, 6, 71–101. [Google Scholar]
  3. Nurhayati, A.; Aryanti, E.; Saharjo, B. Kandungan Emisi Gas Rumah Kaca Pada Kebakaran Hutan Rawa Gambut Di Pelalawan Riau (Greenhouse Gases Emission From Peat Fire At Pelalawan Riau). J. Ilmu Pertan. Indones. 2010, 15, 78–82. [Google Scholar]
  4. Raditya, I.N. Sejarah Kebakaran Hutan & Lahan di Indonesia Terparah Tahun 1997. 2019. Available online: https://tirto.id/sejarah-kebakaran-hutan-lahan-di-indonesia-terparah-tahun-1997-eijN (accessed on 6 May 2021).
  5. Hiraishi, T.; Krug, T.; Tanabe, K.; Srivastava, N.; Baasansuren, J.; Fukuda, M.; Troxler, T.G. 2013 Supplement to the 2006 IPCC Guidelines for National Greenhouse Gas Inventories: Wetlands; IPCC: Geneva, Switzerland, 2014; ISBN 9789291691395. [Google Scholar]
  6. Apriando, T. Pakar: Kebakaran Hutan dan Lahan Percepat Perubahan Iklim. 2015. Available online: https://www.mongabay.co.id/2015/10/22/pakar-kebakaran-hutan-dan-lahan-percepat-perubahan-iklim/ (accessed on 17 August 2021).
  7. Tata, H.L.; Sofiyuddin, M.; Mulyoutami, E.; Perdana, A. Jelutung Rawa: Teknik Budidaya dan Prospek Ekonominya; World Agroforestry Centre (ICRAF) Southeast Asia Regional Program: Bogor, Indonesia, 2015; ISBN 9789793198781. [Google Scholar]
  8. Aminah Ervizal, A.M.; Zuhud, I.Z.S. Utilization of Jelutung (Dyera spp.) among Anak Dalam Tribe in Bukit Duabelas National Park). Media Konserv. 2016, 21, 168–173. [Google Scholar]
  9. Santosa, P.B.; Rachmanadi, D.W.H. Pengaruh Genangan Terhadap Tanaman Jelutung (Dyera polyphylla. (Miq.) V. Steenis); Lukmandaru, G., Pujiarti, R., Widyorini, R., Irawati, W.D.N.D., Listyanto, T.P., Eds.; Fakultas Kehutanan Universitas Gadjah Mada: Yogyakarta, Indonesia, 2014; pp. 258–264. [Google Scholar]
  10. Hani, A.; Siarudin, M.; Indrajaya, Y. Revegetation of Peatlands in West Kalimantan with Superior Commodities. In Proceedings of the 5th SATREPS Conference, Bogor, Indonesia, 17 November 2020; pp. 1–5. [Google Scholar]
  11. Rochmayanto, Y.; Priatna, D.; Wibowo, A.; Fentie, M.S.J.; Lestari, S.N.S.; Muttaqin, M.Z.; Samsoedin, I.; Ari Rosadi, D.S. Strategi dan Teknik Restorasi Ekosistem Hutan Rawa Gambut; Yanto Rochmayanto Dolly Priatna, M.Z.M., Ed.; IPB Press: Bogor, Indonesia, 2021; ISBN 9786232566927. [Google Scholar]
  12. Krisnawati, H.; Adinugroho, W.C.; Imanuddin, R.; dan Hutabarat, S. Indonesian National Carbon Accounting System (INCAS): Pendugaan Emisi Gas Rumah Kaca Tahunan dari Hutan dan Lahan Gambut di Kalimantan Tengah Kementerian Lingkungan Hidup dan Kehutanan; Siregar, C.A., Agus, F., Parsons, M., Fitzgerald, N., Karyanto, O., Boer, R., Waterworth, R., Sugardiman, R.A., Teddy Rusolono, T.H.d.Y.J., Eds.; Pusat Penelitian dan Pengembangan Konservasi dan Rehabilitasi: Bogor, Indonesia, 2015; ISBN 9786021681305. [Google Scholar]
  13. Manuri, S.; Putra, C.A.S.; Saputra, A.D. Tehnik Pendugaan Cadangan Karbon Hutan; Deutsche Gesellschaft für Internationalle Zusamenarbeit (GIZ) GmbH—German International Cooperation Merang REDD Pilot Project (MRPP): Palembang, Indonesia, 2011; ISBN 9786029949223. [Google Scholar]
  14. Intergovernmental Panel on Climate Change (IPCC). 2006 IPCC Guidelines for National Greenhouse Gas Inventories; Eggleston, S., Buendia, L., Miwa, K., Todd Ngara, K.T., Eds.; IGES: Kanagawa, Japan, 2006; ISBN 4887880324. [Google Scholar]
  15. Manuri, S.; Brack, C.; Nugroho, N.P.; Hergoualc’h, K.; Novita, N.; Dotzauer, H.; Verchot, L.; Putra, C.A.S.; Widyasari, E. Tree biomass equations for tropical peat swamp forest ecosystems in Indonesia. For. Ecol. Manag. 2014, 334, 241–253. [Google Scholar] [CrossRef]
  16. Simon, H. Metode Inventore Hutan; Pustaka Pelajar: Yogyakarta, Indonesia, 2007; ISBN 9789791277174. [Google Scholar]
  17. Gunawan, H.; Mudiyarso, D.; Mizuno, K.; Forest, I. Taksiran Akumulasi Biomassa atas Permukaan pada Eksperimen Restorasi Lahan Gambut Bekas Terbakar, Area Transisi Cagar Biosfer Giam Siak Kecil-Bukit Batu, Riau, Sumatera Indonesia Pusat Studi Bencana Universitas Riau, Sumatera Center for Southeast Asia. J. Riau Biol. 2016, 1, 8–16. [Google Scholar]
  18. Krisnawati, H.; Adinugroho, W.C.; Imanuddin, R.; Hutabarat, S. Pendugaan Biomassa Hutan untuk Perhitungan Emisi CO2 di Kalimantan Tengah: Pendekatan Komprehensif Dalam Penentuan Faktor; Waterworth, R., Parsons, M., Susmianto, A., Eds.; Pusat Penelitian dan Pengembangan Konservasi dan Rehabilitasi, Badan Penelitian dan Pengembangan Kehutanan—Kementerian Kehutanan: Bogor, Indonesia, 2014; ISBN 9786021681091. [Google Scholar]
  19. Sutaryo, D. Penghitungan Biomassa: Sebuah Pengantar Untuk Studi Karbon dan Perdagangan Karbon; Wetlands International Indonesia Programme Jl: Bogor, Indonesia, 2009; ISBN 9789604742332. [Google Scholar]
  20. Windusari, Y.; Sari, N.A.; Yustian, I.; Zulkifli, H. Estimation of carbon biomass from the understorey and litter vegetation at tailings deposition area of PT Freeport Indonesia. Biospecies 2012, 5, 22–28. [Google Scholar]
  21. Agus, F.; Made, I.G. Lahan Gambut: Potensi untuk Pertanian dan Aspek Lingkungan; World Agroforestry Centre (ICRAF): Bogor, Indonesia, 2008; ISBN 9786028039109. [Google Scholar]
  22. De Oliveira Neto, S.N.; Salles, T.T.; Leite, H.G.; Ferreira, G.B.; Melido, R.C.N. Tree Modeling and Economic Evaluation of Agroforestry Systems in Southeastern Brazil. Silva Lusit. 2013, 21, 43–60. [Google Scholar]
  23. Irawan, U.S.; Purwanto, E. Pengukuran dan Pendugaan Cadangan Karbon pada Ekosistem Hutan Gambut dan Mineral, Studi Kasus di Hutan Rawa Gambut Pematang Gadung dan Hutan Lindung Sungai Lesan, Kalimantan; Yayasan Tropenbos Indonesia: Bogor, Indonesia, 2020. [Google Scholar]
Figure 1. Research location in Jabiren Village.
Forests 13 01297 g001
Figure 2. Sketch of the research location.
Forests 13 01297 g002
Figure 3. Example of distribution of random sampling points.
Forests 13 01297 g003
Figure 4. The average amount of C stored in each constituent. the component aboveground in D. polyphylla stands in three age classes.
Forests 13 01297 g004
Figure 5. The average amounts of C stored in each constituent component belowground in D. polyphylla stands with three age classes.
Forests 13 01297 g005
Figure 6. The condition of litter in jelutung stands for age classes I, II, and III. Remarks: (a) solid litter in age class I; (b) moderate litter in age class II; and (c) rare litter in age class III.
Forests 13 01297 g006
Table 1. The average amounts of biomass stored in D. polyphylla trees for 3 age classes.
Plant Age ClassNo.
Plot
Tree Biomass (kg/100 m2)Tree Biomass
(ton/ha)
I
(17 years)
1582.9358.29
2534.3653.44
Total1,117.29111.73
II
(13 years)
1266.0526.60
2293.5329.35
Total559.5755.96
III
(10 years)
1283.5028.35
2217.3221.73
Total500.8250.08
Source: observational data, 2019.
Table 2. The average amounts of stored biomass in the understory under D. polyphylla stands for 3 age classes.
Plant Age ClassNo.
Plot
Stored Biomass (kg/ha)Stored Biomass (ton/ha)
I
(17 years)
1488.690.49
2661.890.66
Total1150.581.15
II
(13 years)
1725.130.73
2457.930.46
Total1183.061.18
III
(10 years)
1483.140.49
2507.820.51
Total990.961.00
Source: observational data, 2019.
Table 3. The average amounts of necromass stored in the litter under D. polyphylla stands for three age classes of plants.
Plant Age ClassNo.
Plot
Litter Necromass (kg/ha)Litter Necromass (ton/ha)
I
(17 years)
111,186.5011.19
213,419.8913.42
Total24,606.4024.61
II
(13 years)
16993.816.99
27041.847.04
Total14,035.6414.04
III
(10 years)
15814.915.81
24322.274.32
Total10,137.1810.14
Source: observational data, 2019.
Table 4. The average amounts of biomass stored in the roots of D. polyphylla trees for three age classes.
Plant Age ClassNo.
Plot
Root Biomass (kg/ha)Root Biomass (ton/ha)
I
(17 years)
1948.199.48
2887.608.88
Total1835.8018.36
II
(13 years)
1437.754.38
2507.205.07
Total944.959.45
III
(10 years)
1507.025.07
2400.004.00
Total907.029.07
Source: observational data, 2019.
Table 5. Condition and organic C content in peat soil under stands of D. polyphylla for three age classes.
Plant Age ClassNo. PlotPeat Maturity RatePeat Thickness
(m)
Organic C
(%)
I
(17 years)
1Hemic0.8732.37
2Sapric0.9630.26
Average 0.9231.32
II
(13 years)
1Hemic0.9232.48
2Hemic0.8834.41
Average 0.9033,45
III
(10 years)
1Hemic0.8824.09
2Hemic0.8428.18
Average 0.8626.14
Source: observational data, 2019.
Table 6. One-way ANOVA analysis results for the average amounts stored in D. polyphylla trees for thre age classes.
Composing ComponentsSource of
Diversity
Sum of
Squares
dfMean
Square
F-StatisticSig.
TreeTreatment2686.1421343.0721.320.00
Error3591.635763.01
Total6277.7859
Source: results of research data analysis, 2019.
Table 7. Honest Tukey’s significant difference test results for the average amounts of C stored in D. polyphylla trees for three age classes.
Age ClassMean C of Trees
1011.77 a
1312.38 a
1726.26 b
Information: numbers in the column followed by the same letter are not significantly different. Source: results of research data analysis, 2019.
Table 8. One-way Anova analysis results for the average amounts of C stored in the litter under D. polyphylla stands for three age classes.
Composing ComponentsSource of DiversitySum of
Squares
dfMean
Square
F-StatisticsSig.
TreeTreatment61.89230.9419.970.00
Error41.83271.55
Total103.7129
Source: results of research data analysis, 2019.
Table 9. Honest Tukey’s significant difference test results for the average amounts of C stored in the litter under D. polyphylla stands with three age classes.
Age ClassC Litter Average
102.38 a
132.30 a
175.78 b
Information: numbers in the column followed by the same letter are not significantly different. Source: results of research data analysis, 2019.
Table 10. Paired t-test results for the average amounts of C stored in plants under D. polyphylla stands for two age classes.
TdfSig.
Ages of 17 and 13 years old100.4010.251
Source: results of research data analysis, 2019.
Table 11. The total average amounts of stored carbon (C stock) in the study location in D. polyphylla stands with three age classes.
Composing ComponentsAge Class I
(ton/ha)
Age Class II
(ton/ha)
Age Class III
(ton/ha)
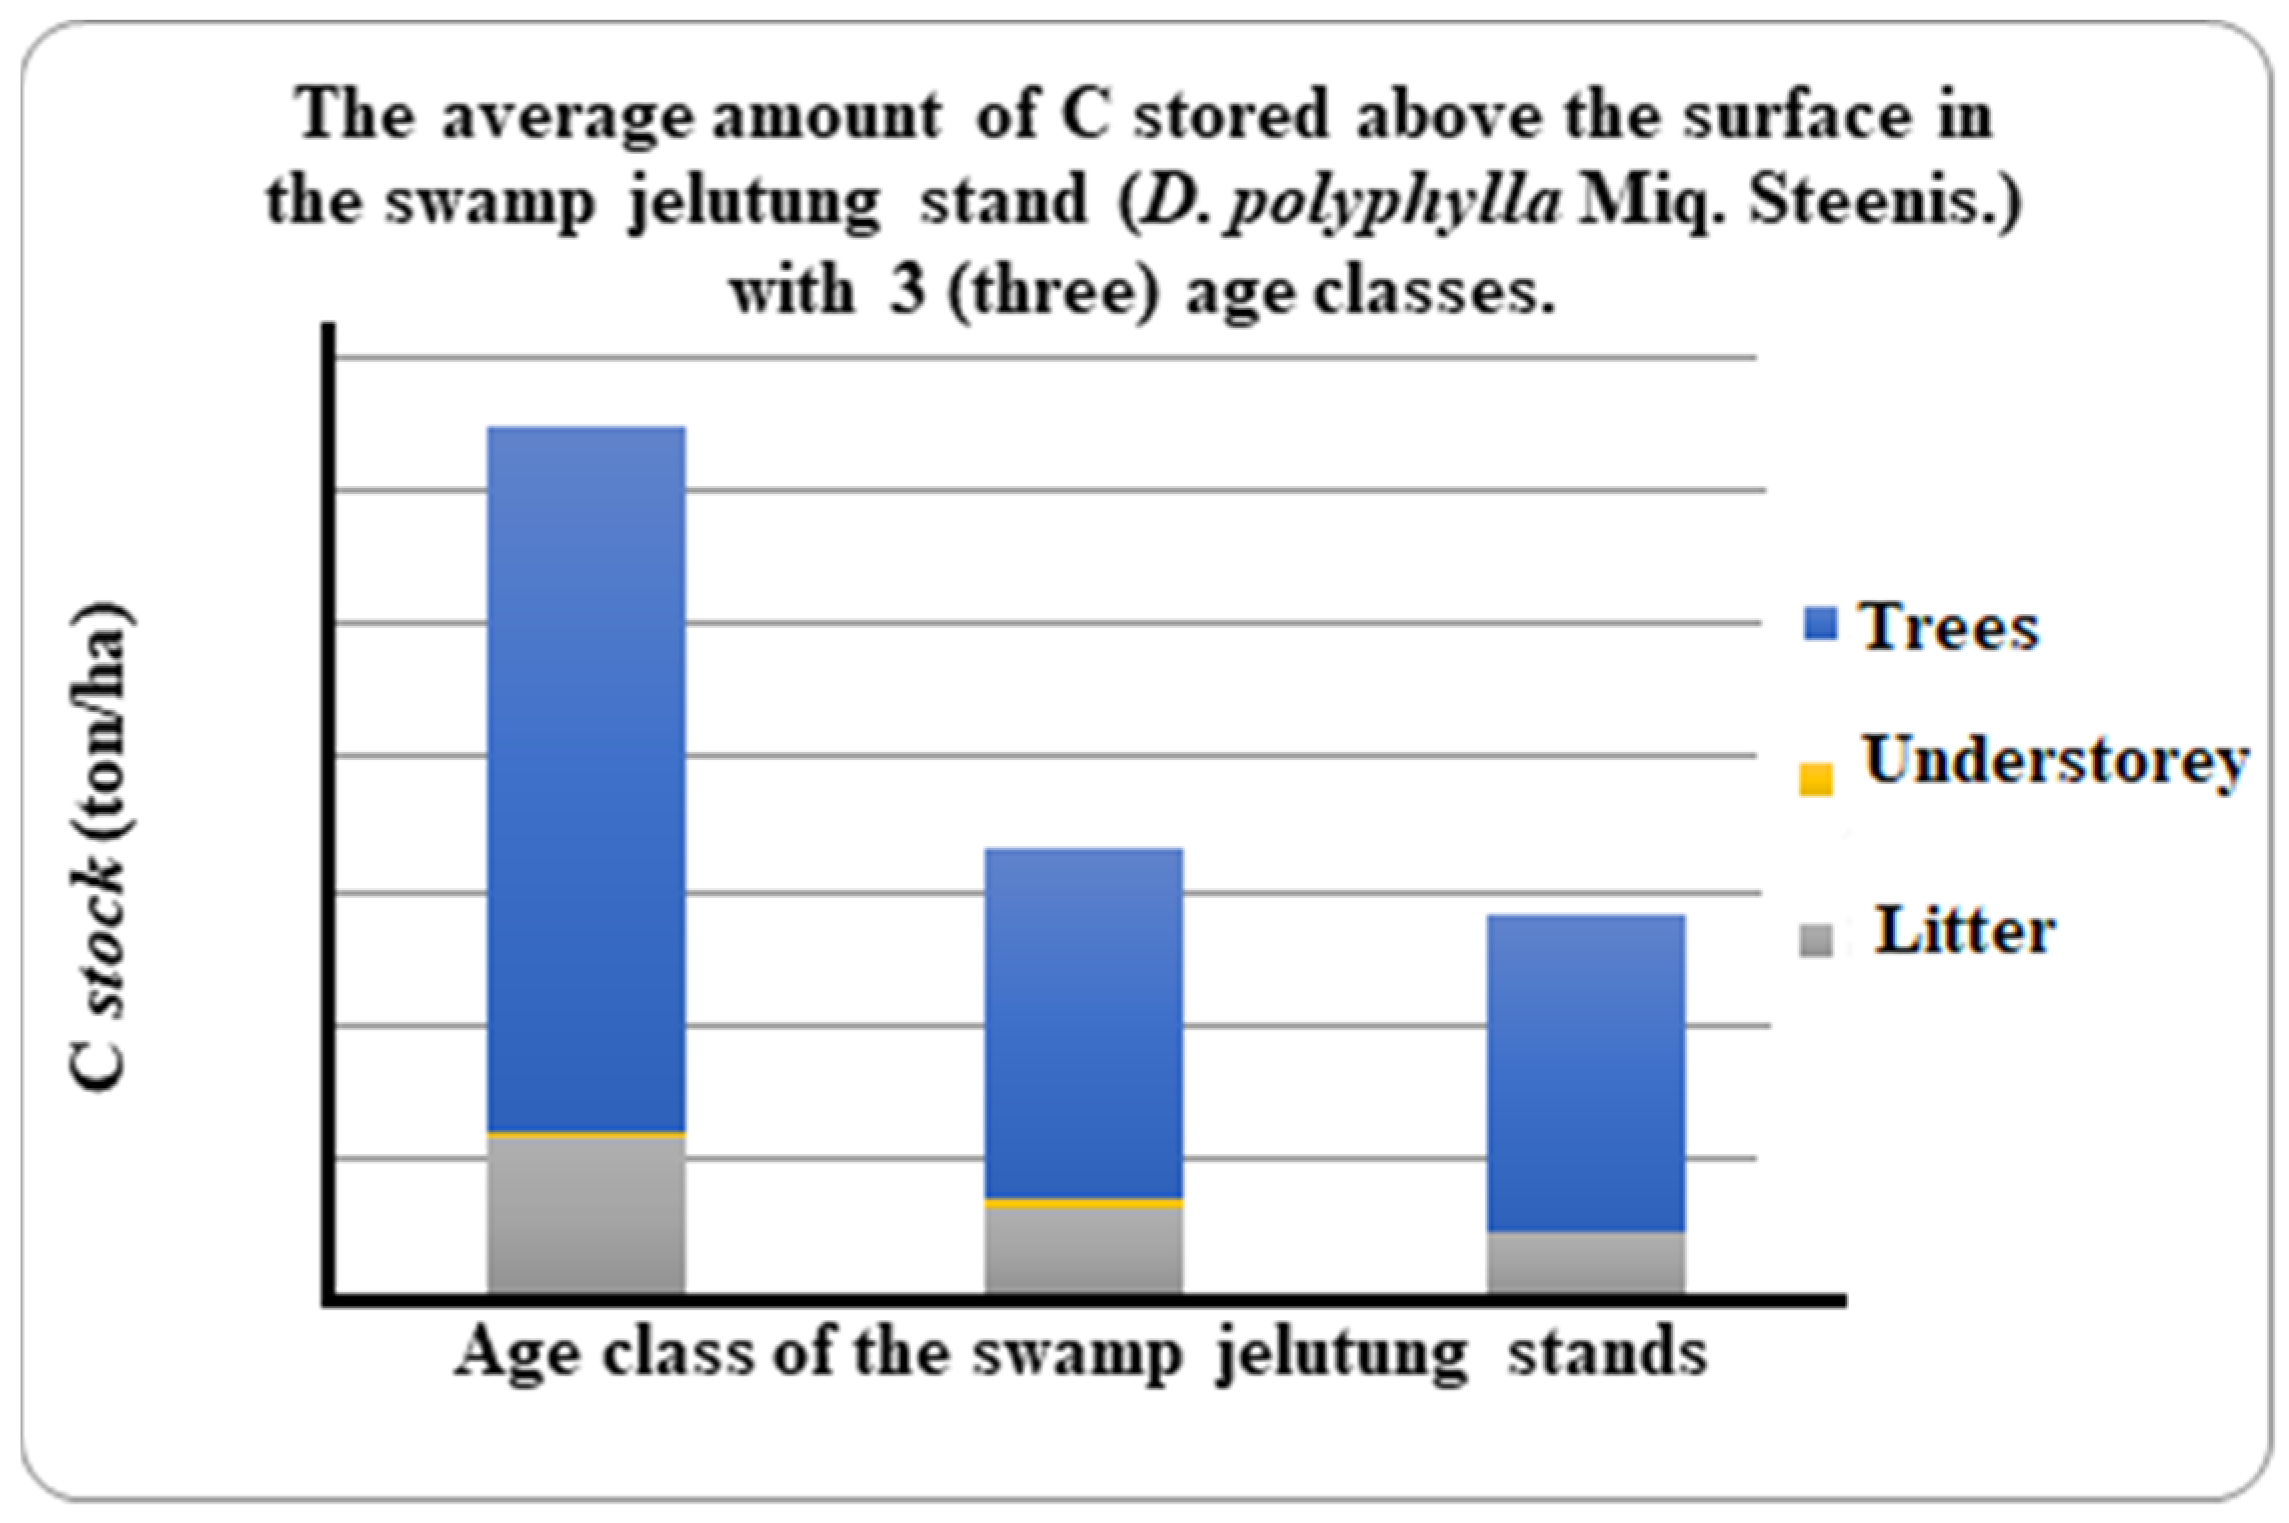
C stock aboveground:
       Tree (∑ BP)26.2613.1211.77
       Bottom plants (∑ BTb)0.270.280.00
       Litter necromass (∑ NS)5.783.302.38
       Total C stock32.3116.6914.15
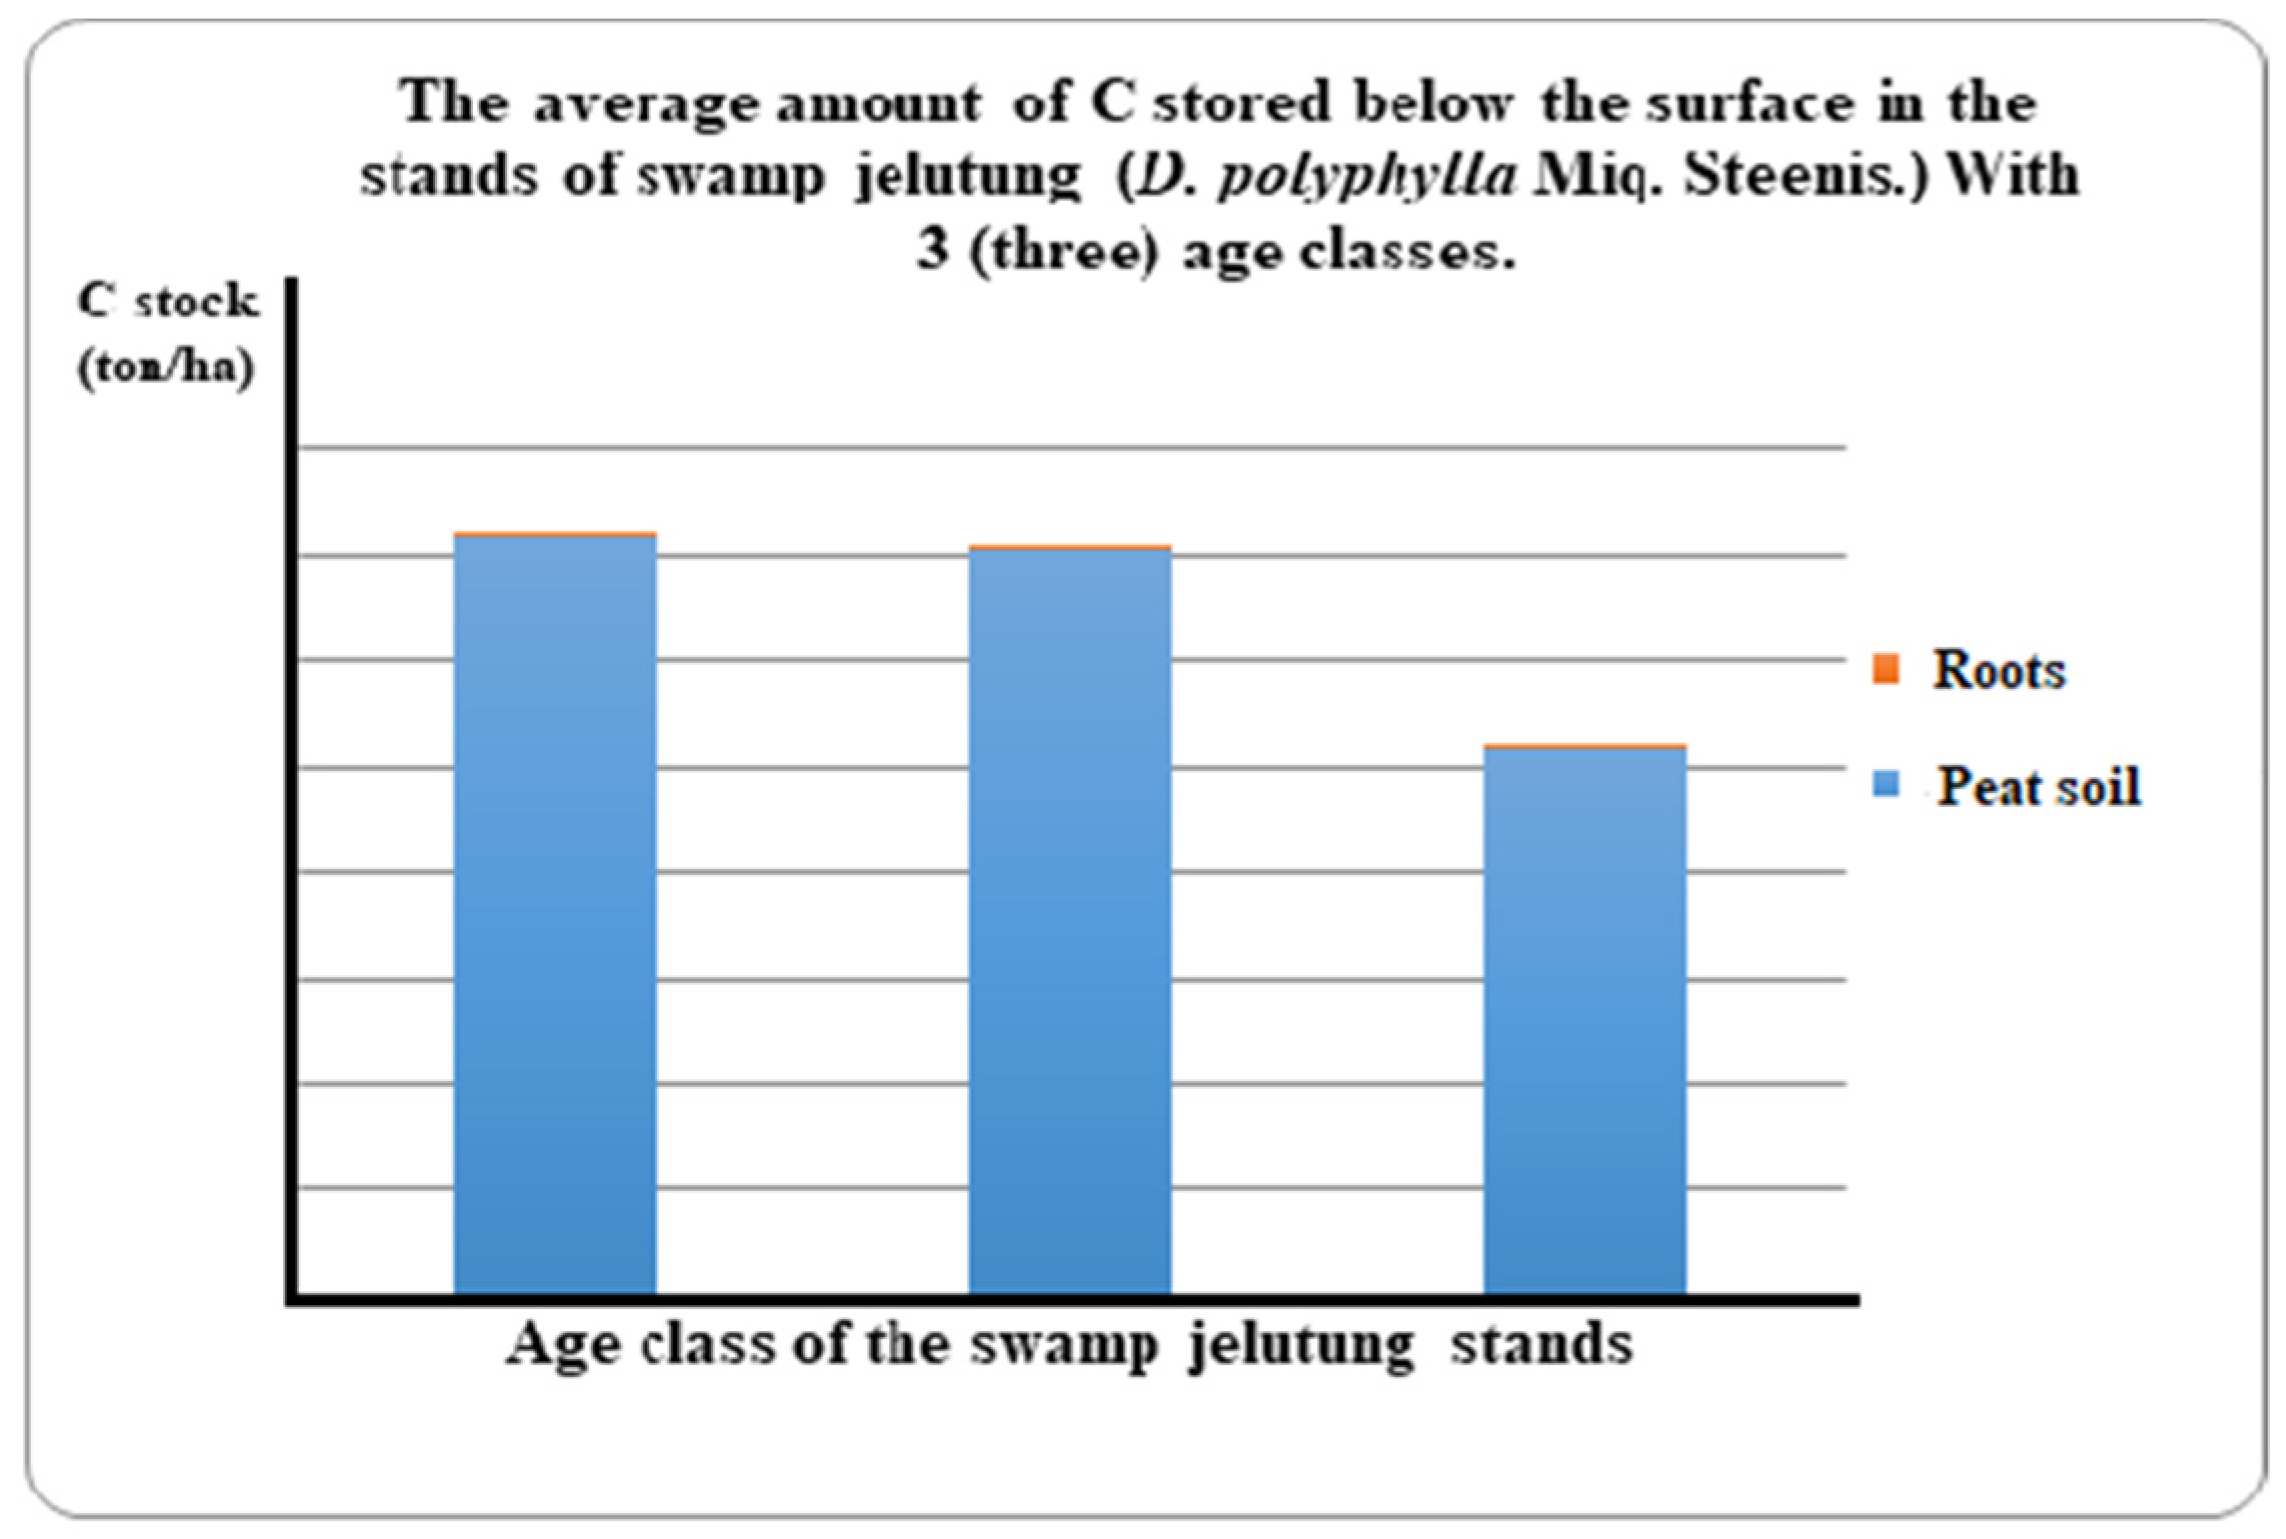
C stock belowground:
       Root of the tree (∑ BA)4.312.352.13
       Peat soil (∑ TG)715.14706.81517.25
       Total C stock719.46709.15519.38
Total C stock751.77725.85533.53
Source: results of observational data processing, 2019.
Table 12. Paired t-test results for the amounts of C stored both aboveground (BAP) and belowground (BBP).
tdfSig.
BAP and BBP1.933650.058
Source: results of research data analysis, 2019.
Publisher’s Note: MDPI stays neutral with regard to jurisdictional claims in published maps and institutional affiliations.

