Abstract
The Qinling Mountains are located on the dividing line between the north and the south of China. Mt. Taibai, the study site, is the highest peak in the Qinling Mountains and also the highest peak in eastern mainland China. At Mt. Taibai, several dendroecological studies have been conducted on the relationship between tree-ring indices and climatic factors using traditional statistical methods. In this study, the response of Larix chinensis Beissn radial growth to climatic factors was explored in the treeline area of Mt. Taibai using the process-based Vaganov–Shashkin-Lite (VSL) model for the first time. The conclusions were obtained according to the analysis of the L. chinensis tree-ring samples collected from both the northern and southern slopes of Mt. Taibai. The VSL model showed that temperature limits L. chinensis growth during the entire growing season, while the model did not indicate precipitation as a limiting factor. The model showed significant positive correlations between the simulated and observed tree-ring chronologies for 1959–2013, excluding the uppermost sample site on the northern slope. However, the model performance deteriorated with increasing altitude, which may be due to the decreased sensitivity of radial growth to climatic factors above the treeline.
1. Introduction
Numerous studies have demonstrated that tree-ring records can preserve high-resolution information at subannual to centennial timescales and can enable a comprehensive understanding of paleoclimate changes [1,2,3]. Dendroclimatological studies are generally based on the assumption that the approximate relationship between limiting factors and tree growth is temporally invariant [4]. However, multiple studies have detected a phenomenon known as the “divergence problem” which is the tendency for tree growth to demonstrate a weakening temperature response, especially at high latitudes and high altitudes, in the context of global warming in recent decades [5,6,7,8]. The phenomenon mainly presents as anomalous declines in the sensitivity of tree-ring growth indices in response to temperature variation [9], reduced tree growth from temperature-induced drought stress [10], and divergent responses of tree growth in response to climatic factors at the same site depending on microtopography [11] and tree age [12]. The divergence problem challenges traditional statistical approaches to reconstruct the paleoclimate history based on the stable relationship between tree growth and climatic factors.
The Vaganov–Shashkin-Lite model (VSL model) is a simplified descendant of the full Vaganov–Shashkin model (VS model) [13]. It is one of the simplest but most effective process-based dendroecological models, especially in study areas where detailed daily climate data are absent [14]. The VSL model requires only latitude and monthly temperature and precipitation data to simulate the climatic controls on tree growth based on nonlinear and nonstationary tree-growth responses as well as the principle of limiting factors [15,16]. The VSL model has been used under different environmental conditions in boreal to semiarid to temperate regions [17]. Tolwinski-Ward et al. first presented a simple and efficient model and performed three validation studies in North America [14]. The VSL model has been successfully validated against 2287 globally distributed tree-ring width datasets [18]. Furthermore, the VSL model was used to simulate Nothofagus pumilio growth in upper treeline forests in northern Patagonia [19]. Additionally, the application of the VSL model has been shown to improve the simulation of forest growth responses to drought in the Mediterranean area [20]. A recent study clarified the multifaceted growth patterns of primary Picea abies Karst. forests in the Carpathian arc based on the VSL model [21]. In China, process-based tree-ring models have been used to assess the relationships between tree growth and limiting climatic factors. For example, the physiological response of tree growth to climatic factors was discussed using the full VS model in the Helan region and northeastern Qaidam Basin [22,23]. Based on the TREE-RING model (the ecological mechanism model simulates the growth changes in cells in the cambium region and then analyzes the growth mechanism of trees), the growth of Picea grassifolia Kom. was simulated, and the physiological response mechanism was analyzed at the eastern edge of the Qaidam Basin [24]. On the Tibetan Plateau, the VS-oscilloscope model (the model was developed to quantify tree-ring formation as a function of climate variables to the kinetics of secondary xylem development) was utilized to identify the relationships between forest growth and cambium phenology [25]. However, to date, the application of the VSL model has not been described in China. Based on the VSL model, the differences between the research on the radial growth and response to climatic factors of L. chinensis and the traditional method were explored; at the same time, the internal relationship between climatic factors and radial growth at different altitudes in typical regions and tree species was analyzed.
The Qinling Mountains are the geographical boundary between northern and southern China. Mt. Taibai (33°41′ N–34°15′ N, 107°19′ E–107°58′ E, 3767 m a.s.l.) is not only the peak of the Qinling Mountains but also the highest mountain in eastern mainland China (Figure 1). Mt. Taibai is roughly located on the precipitation line at which 800 mm of annual precipitation falls in China and is on the boundary between the humid and semihumid zones [26,27,28]. Thus, the study area is located in a transitional and sensitive climate zone suitable for studying tree-ring climatology. It is one of the few mountains high enough to extend above the treeline in eastern China [29,30]. L. chinensis is a perennial and ligneous plant species. It is distributed only in the Qinling Mountains, at an altitude of 2800–3500 m, covering 11.8% of the total forest area of Mt Taibai. As the dominant species of the treeline area on Mt. Taibai, L. chinensis is seldom disturbed by human activities because of inaccessibility; thus, it is widely used in research on climate change. For example, the tree-ring chronologies of L. chinensis were used to reconstruct early spring temperatures in the Qinling Mountains [31,32]. A 30- to 40-year cycle in temperature changes was found for the past 300 years on Mt. Taibai [33]. These climate reconstructions make it possible to describe the climate history of Mt. Taibai over the past hundreds of years; however, all of the paleoclimate reconstructions using L. chinensis tree-ring chronologies are based on empirical statistical models. Process-based models have never been documented as being used in the study area. Tree-ring climatology analysis based on process-based models provides more systematic climate indicators for reconstructing paleoclimate. Based on the growth mechanism of L. chinensis, the VSL model explores the main climatic factors that control the radial growth of L. chinensis from different altitudes and slope aspects and the growth differences under different location conditions and systematically analyzes the inveterate reasons.
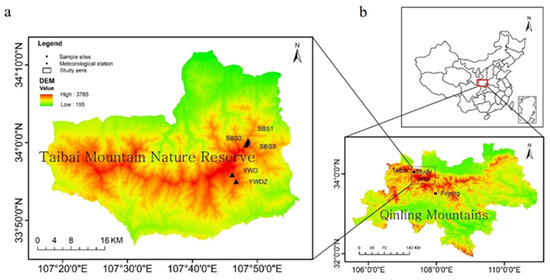
Figure 1.
(a) Map of the Mt. Taibai study area and locations of the tree-ring sampling sites; (b) location of the Qinling Mountains and the two meteorological stations used in the study.
In this study, we simulated the response of L. chinensis growth to the main limiting climate drivers using the process-based VSL model to investigate (1) the applicability of the VSL model for simulating the relationship between the L. chinensis tree-ring series and climate changes, (2) the differences in tree growth along the altitudinal gradients of the northern and southern slopes at Mt. Taibai, and (3) the main limiting factors controlling the growth of L. chinensis.
2. Materials and Methods
2.1. Study Area
The Qinling Mountains (32°30′ N–34°45′ N, 104°30′ E–112°45′ E) lie east–west in central China and extend 1500 km [34] (Figure 1). They form the critical boundary between the warm–temperate and subtropical climates that separate deciduous broadleaved forest from the mixed deciduous–evergreen broadleaved forest [35,36]. Thus, as the transitional zone, the Qinling Mountains support high plant and wildlife biodiversity levels and are very sensitive to climatic change.
Mt. Taibai is located in the central part of the Qinling Mountains. The base of the mountains is composed of stone covered by loess, and Quaternary glacial remnants, such as cirques, glacial erosion lakes, and moraines, are found at higher elevations [37]. Mt. Taibai shows a clear vertical vegetation spectrum with increasing altitude. Broadleaved Quercus spp. forests dominate the area below 1200 m on the northern slopes and below 1400 m on the southern slopes. The vegetation between 1200 and 1650 m in the north and 1400 and 2050 m in the south is a Quercus aliena var. acuteserrata mixed broadleaved–conifer forest. A Quercus mongolica Fisch. Ex Ledeb forest occurs only on the northern slope at the area of 1650–2300 m. With increasing elevation, the vegetation changes to a Betula platyphylla Suk. forest (2300–2950 m in the north versus 2250–2850 m in the south) and an Abies fargesii Franch. forest (2900–3150 m in the north versus 2850–3200 m in the south). A L. chinensis forest (3150–3400 m in the north versus 3200–3430 m in the south) forms the modern treeline. Above the treeline, subalpine and alpine shrubs and meadows dominate [30,38].
2.2. Sampling and Developing the Chronology
Tree-ring samples (N3065, N3210, and N3404) were collected from living L. chinensis at the sites located in the forest near the treeline on the northern slope of Mt. Taibai in October 2013. The altitudes of these sites ranged from 3065 m a.s.l (N3065) to 3404 m a.s.l (N3404). Samples S3100 and S3210 were obtained from the southern slope of Mt. Taibai at elevations of 3100 to 3210 m a.s.l in June 2013, respectively (Table 1).

Table 1.
Information on the tree-ring sampling sites.
During the sampling process, the locations with thin soil layers and large slopes were selected for sampling; we selected trees with good growth, thick diameter at breast height, and no pests and diseases to collect sample cores. Two opposite cores were sampled at the breast height of the tree stems with an increment borer according to standard dendrochronological sampling procedures [39]. In the laboratory, the cores were dried and mounted on grooved wooden supports. The surfaces of the samples were polished with progressively finer sandpaper to make the tree-ring boundaries clearly visible [40]. Tree-ring widths were then measured using a LINTAB increment measuring system at a 1/100 mm precision. Visual cross-dating and measurements were checked with the program COFECHA to evaluate measurement accuracy and minimize potential dating errors [41].
Ring-width chronologies were developed for each site using the ARSTAN program [42]. The negative exponential curves and spline functions were used to standardize the tree-ring series to remove the nonclimatic biological growth disturbances related to the tree chronologies. In the detrending process, we consistently applied different window sizes to further accurately and effectively determine the common interval. For the chronologies of the five elevation sampling points derived in this paper, 30-year effective windows and 15-year overlapping areas were adopted. Three kinds of sample chronologies at Mt. Taibai were set up: standard chronology (STD), residual chronology (RES), and arstan chronology (ARS). Tree-ring width STD chronology contains a lot of ambient noise. While the tree-ring width RES chronology includes external climate signals, it removes noise signals such as tree growth trends and intraspecific competition, but there are still low-frequency interspecific interference factors. RES chronology is most suitable for analyzing the response of tree-ring width to climatic factors. The tree-ring width ARS chronology not only removes the influence of tree growth factors but also removes interference factors in small forest areas, resulting in a weak response to climate change [4]. To better retain low-frequency variation and resulting chronological quality, the STD was employed in the additional analyses.
2.3. Meteorological Data and Statistical Analysis
Because the sampling sites were distributed on both the southern and northern slopes of Mt. Taibai, instrument-recorded climate data from the Taibai County climate station (34.09° N, 107.3° E, 1543.6 m a.s.l) on the northern slope and the Foping County climate station (33.53° N, 107.98° E, 1192 m a.s.l) on the southern slope near the sample sites were employed for analyzing the tree growth-climate response. The station data included mean monthly temperatures and precipitation spanning from 1959 to 2013.
According to the meteorological records from the Taibai station, the mean annual temperature on the northern slope of Mt. Taibai is 7.87 °C, the mean precipitation from 1959 to 2013 was 741 mm, and precipitation from June to September is 51.0% of the annual total. Records from Foping County show that the mean temperature and mean annual precipitation from 1959 to 2013 were 11.9 °C and 913 mm, respectively, on the southern slope of Mt. Taibai. Both the mean annual temperature and precipitation on the southern slope exceeded those on the northern slope (Figure 2). The southern slope of Mt. Taibai is on the windward slope of the southeast monsoon, superimposed with the blocking of tall terrain, and there is sufficient precipitation on the southern slope in summer.
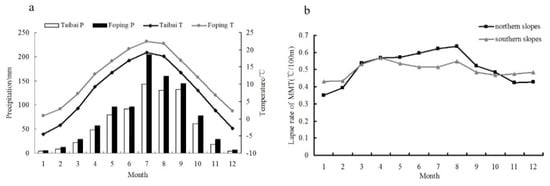
Figure 2.
(a) Average annual temperature (T) and precipitation (P) at the Taibai and Foping climate stations, based on data for 1959–2013; (b) the monthly temperature lapse rates on the southern and northern slopes of Mt. Taibai [42].
Since the elevations of the meteorological stations were lower than those of the sample sites, varied lapse rates in different months and locations were applied to interpolate the temperatures from both climate stations to the sample sites [43] (Figure 2). The precipitation data for the sample sites were generated using the average value of the monthly precipitation of the two meteorological stations. To analyze the differences in the main climatic factors affecting the radial growth of L. chinensis at different tree-ring sampling sites, the Pearson correlation coefficient was utilized in SPSS software to analyze the relationship between the tree-ring width indices and meteorological variables.
2.4. Description of the VSL Model
VSL model version 2.3 (accessed on 15 June 2012, available at http://www.ncdc.noaa.gov/paleo/softnlib/softlib.html) was used in the study with MATLAB. In the model, nonlinearity is used to calculate the monthly (s) and yearly (t) tree-growth response (g(s,t)). The principle of tree-growth limiting factors is represented by the minimum of the temperature response gT(s,t) and soil moisture response gM(s,t), modulated by the insolation response gE(s,t) [14].
g(s,t) = min[gT(s,t), gM(s,t)] × gE(s,t)
gT(s,t), the temperature-based growth response, is calculated using ramp functions where T1 is the threshold temperature below which growth ceases, while T2 is the temperature above which growth is nonlimited.
Similar to gT(s,t), gM(s,t) is also defined as piecewise linear functions, with parameters M1 and M2 representing the growth response to the range of soil moisture values where soil moisture is calculated from the temperature and total precipitation data according to the empirical hydrology model of a one-layer leaky bucket [44].
The form min {gT(s,t), gM(s,t)} represents the law of minimum limiting factors so that the growth depends on the limiting environmental variable. gE(s,t) represents the insolation-based growth response. The value is the ratio of the mean monthly day length to that in the summer solstice month. The day length is estimated using a standard trigonometric approximation, which is mainly determined from the site latitude [45].
gE(s,t) = L(s,t)/max[L(s,t)]
Monthly mean temperature, accumulated precipitation, and latitude are only required to run the VSL model. The other 12 tunable parameters are entered into the model as the temperature and moisture thresholds, parameters for the estimation of soil moisture, and the time periods when tree-ring growth is responsive to climate.
2.5. Model Parameterization Procedure
In the VSL model, four parameters (T1, T2, M1, and M2) controlling the simulated growth response to temperature and soil moisture were critical to the performance of the model. In this study, the Bayesian model was used to estimate the growth function parameters for each sampling site with the climatic data from 1959 to 2013 [46]. Markov Chain Monte Carlo (MCMC) chains and white Gaussian noise model error were adopted for the evaluation of each sampling site [19]. The median values of each of the four parameters in the posterior probability distribution were finally used as the “calibrated” growth response values for the specific sampling sites [18,19].
In addition, we also used a simple optimization procedure to select the optimal growth parameters (the parameter set producing the simulation that correlated most significantly with the observed ring-width series at each site was considered ‘‘optimal’’ and used to create the simulations on which the analysis was performed) [14]. In the optimization approach, growth parameters were tested in 3 intervals at 5 different locations. The growth parameter set that resulted in the simulation that correlated most significantly with the observed ring-width chronologies was then used as the optimal parameter [18].
According to the “one-size-fits-all” simulation approach used in the VSL model, the other 8 parameters listed were default values set for the VSL model, which showed the best overall performance for a variety of environmental conditions [14,18,47,48] (Table 2). A growth period interval of 16 months was used in the model, starting from the previous September to December of the modeled year. The integration interval explains the persistence of the radial growth of the L. chinensis, indicated by the high autocorrelation values. To assess the temporal stability of the growth response functions and test the performance of the growth parameters, we divided the entire period of 1959–2013 into two periods with equal intervals of 27 years. Based on the Bayesian approach, we calculated the parameters T1, T2, M1, and M2 for each site independently and separately for the two periods 1959–1985 and 1986–2013 [18].
Table 2.
Numerical values of the VSL model parameters.
Table 2.
Numerical values of the VSL model parameters.
| Parameter | Parameter Description | Value |
|---|---|---|
| T1 | Threshold temp. for gT >0 | Table 3 |
| T2 | Threshold temp. for gT = 1 | Table 3 |
| M1 | Threshold soil moist. for gM >0 | Table 3 |
| M2 | Threshold soil moist. for gM = 1 | Table 3 |
| α | Runoff parameter 1 | 0.093 month−1 |
| μ | Runoff parameter 2 | 5.8 (dimensionless) |
| m | Runoff parameter 3 | 4.886 (dimensionless) |
| Wmax | Max moisture held by soil | 0.8 v/v |
| Wmin | Min moisture held by soil | 0.01 v/v |
| dr | Root (bucket) depth | 1000 mm |
| I0 If | Integration start month Integration end month | −4 12 |
Table 3.
Bayesian estimation statistics for the tuned VSL growth response parameters T1, T2, M1, and M2 for the five sites from 1959 to 2013, 1959 to 1985, and 1986 to 2013.
Table 3.
Bayesian estimation statistics for the tuned VSL growth response parameters T1, T2, M1, and M2 for the five sites from 1959 to 2013, 1959 to 1985, and 1986 to 2013.
| Calib. 1959–2013 | Calib. 1959–1985 | Calib. 1986–2013 | |||||||||||
|---|---|---|---|---|---|---|---|---|---|---|---|---|---|
| Mean | Min | Max | SD | Mean | Min | Max | SD | Mean | Min | Max | SD | ||
| N3065 | T1 (°C) | 8.52 | 8.33 | 8.76 | 0.08 | 6.59 | 6.06 | 7.33 | 0.13 | 7.91 | 3.85 | 8.64 | 0.62 |
| T2 (°C) | 17.06 | 11.87 | 22.81 | 2.25 | 17.02 | 12.31 | 22.62 | 2.28 | 14.10 | 10.36 | 22.87 | 3.12 | |
| M1 (v/v) | 0.036 | 0.001 | 0.094 | 0.021 | 0.035 | 0.001 | 0.091 | 0.021 | 0.036 | 0.001 | 0.098 | 0.021 | |
| M2 (v/v) | 0.25 | 0.11 | 0.49 | 0.09 | 0.25 | 0.11 | 0.46 | 0.09 | 0.26 | 0.10 | 0.48 | 0.09 | |
| N3210 | T1 (°C) | 7.71 | 7.68 | 7.74 | 0.01 | 7.64 | 4.91 | 8.88 | 1.24 | 7.16 | 3.85 | 7.22 | 0.40 |
| T2 (°C) | 16.86 | 12.02 | 22.75 | 2.38 | 17.01 | 11.18 | 22.61 | 2.38 | 16.92 | 10.48 | 23.13 | 2.67 | |
| M1 (v/v) | 0.037 | 0.002 | 0.090 | 0.021 | 0.033 | 0.001 | 0.090 | 0.021 | 0.033 | 0.001 | 0.091 | 0.020 | |
| M2 (v/v) | 0.26 | 0.11 | 0.46 | 0.09 | 0.25 | 0.10 | 0.45 | 0.09 | 0.26 | 0.10 | 0.48 | 0.09 | |
| N3404 | T1 (°C) | 8.58 | 8.30 | 8.90 | 0.10 | 8.41 | 7.66 | 8.90 | 0.39 | 7.89 | 7.85 | 7.92 | 0.01 |
| T2 (°C) | 17.26 | 11.28 | 22.76 | 2.45 | 16.89 | 11.80 | 22.48 | 2.46 | 16.95 | 11.60 | 22.71 | 2.53 | |
| M1 (v/v) | 0.033 | 0.001 | 0.091 | 0.021 | 0.034 | 0.002 | 0.092 | 0.020 | 0.035 | 0.001 | 0.086 | 0.021 | |
| M2 (v/v) | 0.24 | 0.10 | 0.47 | 0.08 | 0.25 | 0.11 | 0.49 | 0.09 | 0.24 | 0.10 | 0.47 | 0.09 | |
| S3100 | T1 (°C) | 6.83 | 6.79 | 6.84 | 0.01 | 6.40 | 6.37 | 6.44 | 0.01 | 6.83 | 6.81 | 6.86 | 0.01 |
| T2 (°C) | 18.24 | 15.30 | 23.38 | 1.93 | 17.57 | 13.77 | 23.18 | 2.00 | 17.97 | 15.30 | 21.64 | 1.67 | |
| M1 (v/v) | 0.037 | 0.001 | 0.097 | 0.021 | 0.034 | 0.001 | 0.086 | 0.021 | 0.034 | 0.002 | 0.092 | 0.020 | |
| M2 (v/v) | 0.26 | 0.11 | 0.45 | 0.09 | 0.24 | 0.10 | 0.44 | 0.08 | 0.25 | 0.11 | 0.45 | 0.08 | |
| S3210 | T1(°C) | 4.41 | 4.16 | 4.54 | 0.04 | 4.20 | 2.84 | 5.26 | 0.21 | 4.67 | 4.63 | 4.70 | 0.01 |
| T2 (°C) | 17.63 | 14.67 | 22.79 | 1.97 | 17.31 | 11.86 | 22.75 | 2.29 | 17.93 | 14.90 | 22.44 | 1.72 | |
| M1 (v/v) | 0.035 | 0.002 | 0.092 | 0.022 | 0.036 | 0.001 | 0.095 | 0.021 | 0.036 | 0.001 | 0.090 | 0.022 | |
| M2 (v/v) | 0.27 | 0.10 | 0.48 | 0.10 | 0.24 | 0.10 | 0.47 | 0.09 | 0.26 | 0.11 | 0.48 | 0.09 | |
To evaluate the sensitivity of the model parameters that defined the temperature and water balance growth functions, we varied one of the parameters (T1, T2, M1, and M2), while keeping all other parameters constant in the simulation, and this was repeated for each new tree-ring sampling site [47].
3. Results
3.1. Chronological Characteristics Analysis
The entire time period chronology (1959–2013) was evaluated using the following statistical parameters: mean sensitivity (MS), standard deviation (SD), first-order autocorrelation (AC1), average correlation between tree-ring series (Rbar), signal-to-noise ratio (SNR), expressed population signal (EPS), and first principal component (PC1). The MS values of the five chronologies ranged between 0.147 (N3065) and 0.269 (S3210). This result shows that under the influence of climatic factors, the radial growth of L. chinensis varied to a certain extent. The AC1 values ranged from 0.532 to 0.652, reflecting that tree-ring growth of the current year was significantly restricted by the growth of the previous year. The EPS detects the degree to which a particular chronology represents the basic change characteristics of L. chinensis tree-ring widths in the study area well. All the EPS values of the five chronologies on Mt. Taibai were greater than 0.85, indicating statistical acceptability [49,50]. The criterion Rbar is the average correlation coefficient between tree-ring series and characterizes the common variance, which indicated the sample cores at the sampling point had better consistency [49,51]. The high PC1 values between 0.443 and 0.612 revealed that there were strong common climate signals among the tree-ring width chronologies of L. chinensis (Table 4).
Table 4.
Statistical features of the tree-ring width standard chronology (STD) for the sample sites (1959–2013).
3.2. Process-Based Modeling of Tree Ring Growth
Both the Bayesian model and the simple optimization procedure used to estimate the growth parameters of L. chinensis showed similar estimation results. Based on the Bayesian model method, the values of each parameter in the two time periods were calculated, the results showed strong consistency among the parameters in the two periods, which confirmed that the growth parameter set selected in the study could be used to simulate L. chinensis tree growth over the entire time period (Table 3). The correlation between the observed and simulated values of tree-ring width increased as T1 increased to its highest value; then, the correlation value decreased with the continued increase in T1. No obvious change was observed when the other parameters were varied, and this result was consistent with the presumption that the tree-ring growth correlation in L. chinensis is mainly limited by temperature. Model sensitivity testing revealed that the minimum temperature T1 was the most sensitive parameter to L. chinensis growth.
3.3. Relationships between Actual and Simulated Tree-Ring Chronologies
The relationship between the observed and simulated annual tree-ring indices was assessed by Pearson’s correlation coefficients for 1959–2013. To separate the low- and high-frequency signals of the chronologies, a 5-year sliding mean with coefficients was also calculated.
In general, the simulated chronologies were consistent with the observed values. Except for N3404, the correlations of the original series and the 5-year sliding means series were greater than 0.357 and 0.657, respectively, which were significant at the 99% confidence level (Figure 3). Compared with the average correlation coefficient value of 0.29 across all continents, the VSL model result presented a better simulation phenomenon of L. chinensis growth at Mt. Taibai [18]. The higher correlation coefficients at a more significant confidence level via the 5-year running mean showed that the model captured the low-frequency component well at the sample sites excluding N3404. The weak relationship was characteristic of N3404, which was the highest sample site located on the northern slope of Mt. Taibai, especially as shown by the 5-year sliding mean coefficient.
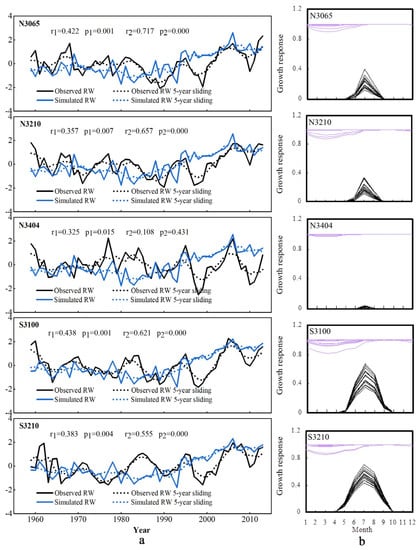
Figure 3.
Intercomparison of actual and simulated tree-ring chronologies with the associated seasonal patterns of climate limitations simulated by the VSL model at each site (N3065, N3210, N3404, S3100, and S3210). (a) Comparison between the standard tree-ring width chronology of L. chinensis from the five sample sites and simulation series using meteorological data. Correlation coefficients are given for 1959–2013, where r1 is the original value, and r2 is the 5-year sliding value. (b) Annual and long-term mean monthly growth rates due to soil moisture (gM, purple) and temperature (gT, black) for 1959–2013.
Based on the VSL model, we estimated the partial influence of temperature and precipitation on tree-ring formation throughout the growing season. The results showed that during the whole 16-month period, gT was less than gM (Figure 3). According to the principle of limiting factors, the results clearly demonstrated that tree growth at most of the sampling sites was generally limited by temperature. The results from the statistical model also revealed positive correlations between the radial growth of L. chinensis and temperature variations from March to July (Figure 4).
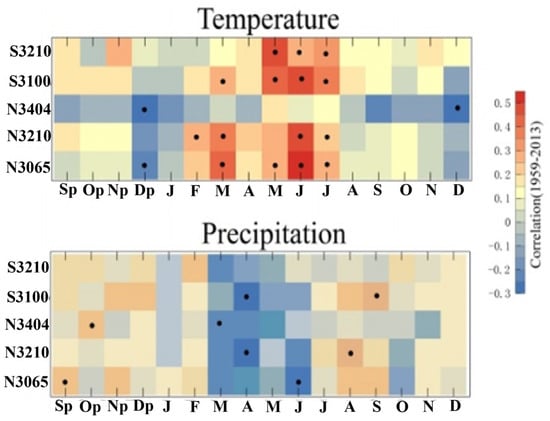
Figure 4.
Tree-ring growth responses to temperature and precipitation over 1959–2013 based on statistical model methods. The correlations are calculated from September of the previous year (Sp) to December of the current year (D). The black points indicate the significantly correlated months (p < 0.05).
The VSL model allowed us to analyze features of tree-ring growth response in specific environmental conditions. The results show that the overall skill of the model was slightly higher at two sites on the southern slope than at those on the northern slope. Correlations between the actual and simulated tree-ring chronologies decreased with increasing altitude and were even less significant at the high-altitude site N3404 (Figure 3). The VSL model output indicated that for both the northern and southern slopes of Mt. Taibai, the mean growth response to temperature was zero in the winter months when it was coldest (Figure 3). However, on the southern slope, the growth response started to increase after April and peaked in July and August during the warmest time of the year and then decreased until October.
3.4. Validation in the Tree-Ring Width Index Simulated by the VSL Model
From the results of the Pearson correlation analysis, it can be seen that the average temperature from May to July had a strong response to the tree-ring width index; therefore, the temperature factors and the tree-ring width index of the month in this interval were selected for spatial correlation analysis (Figure 5). The spatial correlation analysis between the tree-ring width index and the mean temperature (CRU TS 4.05(land) 0.5° × 0.5°) from May to July based on observations and the VSL model simulations was performed on the European Climate Assessment & Dataset data website of the World Meteorological Organization (accessed on 10 May 2012, http://www.climexp.knmi.nl) [52]. The rationality and accuracy of the simulation results of the VSL model were further verified. The responses of the observed and simulated tree-ring width index and climatic factors were extremely similar, and both had significant spatial responses near the Qinling Mountains, Yangtze River basins, and the downstream area of the Yellow River in China. The simulated tree-ring width index and climatic factors had a wider spatial response range and better effect, which further verified the rationality and accuracy of the model simulation.
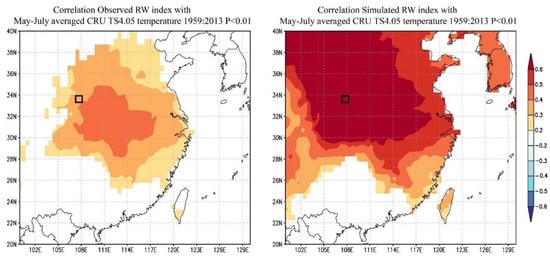
Figure 5.
Spatial correlation analysis between the observed and simulated RW index and grid data.
4. Discussion
4.1. Climatic Responses
We note that these results are consistent with those of previous studies indicating that early spring and summer temperatures are the main climatic factors controlling tree radial growth in the Qinling Mountains [31,33,53,54,55]. Physiologically, temperature is crucial to tree growth, and high temperatures in the early growing season may increase the temperature of soil and tree leaves; thus, radial growth will be accelerated [56]. Warm temperature will also promote snow melt and result in the early initiation of cambial activity and increase the supply of photosynthates, which would result in a wide tree ring [54,57].
The influences of precipitation were not reflected in the VSL model because the moisture at our sample sites reached the lower bound for optimal moisture (M2). This VSL model did not provide an upper threshold in the growth response functions at which the influence of moisture turns negative. Thus, during the whole year, the growth response to moisture gM remained at level 1, indicating moisture did not limit tree growth. In the central and northern regions of China, with the same period of rain and heat, the tree growing season is mainly concentrated in summer [35,53,58]. Long-term high temperature in summer means less precipitation; more precipitation results in less high temperature weather to a certain extent [59,60]. The results showed that the radial growth and development of L. chinensis were mainly limited by the temperature factor. High temperature weather and less precipitation were conducive to the formation of wide rings in that year. Enhanced precipitation induces a lower temperature, which increases the probability of narrowing the annual ring width as a result. Relatively speaking, under the influence of topographic conditions, in the high-altitude areas of the mountains, the microclimate conditions are cold and wet, whereas in the low-altitude areas of the mountains, the microclimate conditions are warm and dry [30,58]. As altitude elevation increases, precipitation increases and temperature decreases. In the high-altitude area, the precipitation meets the needs of the growth of L. chinensis, and the temperature conditions are closely related to the growth of the ring width. There was a significantly positive correlation between tree-ring width and the temperature factor, and a poor or significantly negative correlation with the precipitation factor. A low temperature reduces the activity of tree roots and even causes permanent damage, inhibiting the growth and development of trees; a higher temperature is conducive to maintaining the necessary temperature conditions for tree growth and the transmission of organic matter and energy, promoting tree growth and development [35,48,60]. However, we found a negative relationship between the radial growth of L. chinensis and precipitation from March to June in the traditional statistical results (Figure 4). In fact, previous studies have noted the negative influence of precipitation on tree-ring growth, especially at high altitudes [61].
Neglecting the negative effects of moisture is probably one of the reasons that the model of the N3404 tree-ring chronology above the treeline performed poorly. The lack of modeled snowmelt may also have resulted in the overestimation of tree growth [14]. To reduce tunable parameters, the VSL model did not account for snow dynamics [14,19]; however, temperature and precipitation affect tree growth through snow cover in the study area. In the treeline area, trees are principally fed by snowmelt in late spring and early summer [6], and high precipitation during this season likely diminishes snowmelt or even causes mechanical damage from freezing rain or snow, which in turn slows cambial activity and hinders tree growth. Another possible reason for this result was that there was an error in the setting of water parameters in the soil during the use of the VSL model, which should be improved to increase the accuracy of the parameters in future research on the larger area.
4.2. Effects of Topographical Factors on the Behavior of the VSL Model
The growing season for L. chinensis on the northern slope of Mt. Taibai was shorter from May to September than in the other months. Elevation has a strong effect on tree growth that varies with climate and terrain. The differences that occurred with altitude may be attributable to the decreasing sensitivity of climate signals in the chronologies, which has been indicated by several studies, such as those in the Lüliang Mountains as well as in the Qilian Mountains [58,59]. Measurements of leaf morphology suggest that trees at high elevations will change their ecological strategies by reducing their metabolic rates to adapt to harsh alpine environments [62]. In the adjacent area, Pcicea crassifolia Kom. and L. chinensis have similar biological habits; the research on Pcicea crassifolia found that at different altitudes, biological indicators such as stoma density and the needle dry weight of conifers are different [63]. As the altitude increases, the ecological environment of the location becomes more extreme, the stoma density and needle dry weight of the conifer species decrease. Stoma density is closely related to atmospheric carbon dioxide concentration and other environmental factors, while needle dry weight affects the organic matter content of trees. Thus, the two indicators are crucial to the photosynthesis process of plants. There is a positive relationship between temperature and photosynthesis in a geographical environment. As the altitude increases, the temperature conditions become worse, slowing down the photosynthesis of plants, thereby reducing the index values of stoma density and needle dry weight of conifers. This further affects the growth and development of coniferous species, manifesting as poor habitat development and reduced sensitivity to temperature environments. At the highest altitudes, the decrease in temperature sensitivity of L. chinensis was closely related to the changes in stoma porosity and needle dry weight in conifers. The L. chinensis growing in the upper limit of the forest maintains a lower physiological and metabolic level, which is conducive to tree growth to avoid the impact of environmental changes to the greatest extent, and the ecological adaptation strategy to the environment has changed [62,64,65]. At the same time, the response of trees growing in the upper forest area to environmental factors lags behind that in the lower forest area. Trees growing near the maximum precipitation height are the least sensitive to environmental factor responses. The highest geographical location of L. chinensis (N3404) in this paper was located in the area with maximum precipitation under the influence of topographic rain, which weakens the sensitivity to temperature to a certain extent [66]. In this study, trees growing at high elevations showed a lower sensitivity to the climate, which was also reflected in the results from the statistical analysis (Figure 4). The weakening limitation of temperature on the growth response led to the poor performance of the VSL model at the high-altitude sites.
4.3. Perspectives of the VSL Model
The strength of the VSL model is its ability to integrate both temperature and precipitation information to simulate a nonlinear tree-growth response to climate change. For example, the application of the VS model at lower elevation sites in Switzerland demonstrated that temperature only limited growth at the beginning of the growing season, while precipitation limited growth at the end of the growing season [18]. However, this advantage was not clearly shown in our study, because the growth response was mainly driven by temperature during the entire growing season. Furthermore, the VSL model lacks upper limits for optimal temperature and moisture. Thus, the optimal growth simulated under sufficient conditions of temperature or moisture may not reflect reality. The comprehensive analysis of the VSL model shows that limited by a single climate factor, the model advantage is not obvious; however, limited by a variety of climatic factors, the model advantage is obvious [14,18,67,68].
Although our research was conducted in the relatively limited range of Mt. Taibai, other results for a range of environments, species, and time scales suggest that the VSL model is capable of simulating a wide variety of tree-ring records and their response to climate forcing [47]. The model requirement that monthly climate data be used also makes the VSL model more widely applicable. The advantages of this model provide an opportunity for its use in the aggregation of tree-ring records for paleoclimatic reconstruction.
As a simple and skilled simulator of tree-ring width chronologies, the VSL model can be easily coupled to monthly GCM (General Circulation Model) output for “pseudoproxy experiments” as well as for ensemble forward modeling.
5. Conclusions
We developed L. chinensis tree-ring chronologies from five sites on Mt. Taibai spanning an altitudinal gradient on both northern and southern slopes, and this approach allowed us to explore the suitability of the VSL model in different environmental settings to determine the climate response of L. chinensis.
- (1)
- In general, the simulated chronologies were consistent with the observed values except for the series of sample N3404 above the treeline. The VSL model simulated a dominant temperature control on tree growth during the entire growing period. The unsuccessful simulation in N3404 may be due to neglecting the negative effects of moisture and not including modeled snowmelt.
- (2)
- The overall skill of the VSL model was slightly higher at two sites on the southern slope than at those on the northern slope. Correlations between the actual and simulated tree-ring chronologies decreased with increasing altitude. The differences may be attributable to the decreasing sensitivity of climate signals with the altitudes contained in the chronologies.
- (3)
- Through the study of L. chinensis by the VSL model in this paper, it can be seen that L. chinensis was limited by a single climate factor, and the advantages of the VSL model were not obvious. Despite the limitations of the VSL model, it has many potential applications, such as data assimilation and forward modeling.
Author Contributions
Conceptualization, S.L. and W.G.; Methodology, S.L.; Software, N.G.; Validation, W.G., J.W., N.G. and Q.Y.; Formal Analysis, S.L.; Investigation, S.L., N.G. and H.B.; Resources, H.B.; Data Curation, N.G.; Writing—Original Draft Preparation, S.L.; Writing—Review and Editing, W.G., J.W., Q.Y. and H.B.; Visualization, J.W., N.G. and Q.Y.; Supervision, S.L.; Project Administration, S.L. and H.B.; Funding Acquisition, S.L. and H.B. All authors have read and agreed to the published version of the manuscript.
Funding
The study was supported financially by the Open Fund Project of the State Key Laboratory of Loess and Quaternary Geology (no. SKLLQG1611), the National Forestry Public Welfare Industry Scientific Research Project of China (no. 201304309), and the Natural Science Foundation of Shaanxi Province (no. 2014JQ5172).
Data Availability Statement
The data presented in this study are available on request from the corresponding author.
Acknowledgments
We are grateful to Bao Guang for the help with laboratory analysis. We thank Wang Jun, Yue Ming, and Liu Kang for their participation in the field work.
Conflicts of Interest
The authors declare no conflict of interest.
References
- Briffa, K.R. Annual climate variability in the Holocene: Interpreting the message of ancient trees. Quatern. Sci. Rev. 2000, 19, 87–105. [Google Scholar] [CrossRef]
- Cook, E.R.; Woodhouse, C.A.; Eakin, C.M.; Meko, D.M.; Stahle, D.W. Long term aridity changes in the western United States. Science 2004, 306, 1015–1018. [Google Scholar] [CrossRef]
- Esper, J.; Cook, E.R.; Schweingruber, F.H. Low-frequency signals in long tree ring chronologies for reconstructing past temperature variability. Science 2002, 295, 2250–2253. [Google Scholar] [CrossRef]
- Fritts, H.C. Tree Rings and Climate; Academic Press: London, UK, 1976. [Google Scholar]
- D’Arrigo, R.; Wilson, R.; Liepert, B.; Cherubini, P. On the ‘Divergence Problem’ in Northern Forests: A review of the tree-ring evidence and possible causes. Glob. Planet. Chang. 2008, 60, 289–305. [Google Scholar] [CrossRef]
- Coppola, A.; Leonelli, G.; Salvatore, M.C.; Pelfini, M.; Baroni, C. Weakening climatic signal since mid-20th century in European larch tree-ring chronologies at different altitudes from the Adamello-Presanella Massif (Italian Alps). Quatern. Res. 2012, 77, 344–354. [Google Scholar] [CrossRef]
- Li, Q.; Liu, Y.; Song, H.M.; Yang, Y.K.; Zhao, B.Y. Divergence of tree-ring-based drought reconstruction between the individual sampling site and the Monsoon Asia Drought Atlas: An example from Guancen Moutain. Sci. Bull. 2015, 60, 1688–1697. [Google Scholar] [CrossRef]
- Schwab, N.; Kaczka, R.J.; Janecka, K.; Bohner, J.; Chaudhary, R.P.; Scholten, T.; Schickhoff, U. Climate change induced shift of tree growth sensitivity at a central Himalayan treeline ecoto. Forests 2018, 9, 267. [Google Scholar] [CrossRef]
- Briffa, K.R.; Schweingruber, F.H.; Jones, P.D.; Osborn, T.J.; Shiyatov, S.G.; Vaganov, E.A. Reduced sensitivity of recent tree-growth to temperature at high norther latitudes. Nature 1998, 391, 678–682. [Google Scholar] [CrossRef]
- Barber, V.A.; Juday, G.P.; Finney, B.P. Reduced growth of Alaskan white spruce in the twentieth century from temperature-induced drought stress. Nature 2000, 405, 668–673. [Google Scholar] [CrossRef]
- Wilmking, M.; Myers-Smith, I. Changing climate sensitivity of black spruce (Picea mariana Mill) in a peatland-forest landscape in Interior Alaska. Dendrochronologia 2008, 25, 167–175. [Google Scholar] [CrossRef]
- Wu, G.J.; Xu, G.B.; Chen, T.; Liu, X.H.; Zhang, Y.F.; An, W.L.; Wang, W.Z.; Fang, Z.A.; Yu, S.L. Age-dependent tree-ring growth responses of Schrenk spruce (Picea schrenkiana) to climate—A case study in the Tianshan Mountain, China. Dendrochronologia 2013, 31, 318–326. [Google Scholar] [CrossRef]
- Vaganov, E.A.; Hughes, M.K.; Shashkin, A.V. Growth Dynamics of Conifer Tree Rings: Images of Past and Future Environments; Springer Science & Business Media: New York, NY, USA, 2006. [Google Scholar]
- Tolwinski-Ward, S.E.; Evans, M.N.; Hughes, M.K.; Anchukaitis, K.J. An efficient forward model of the climate controls on interannual variation in tree-ring width. Clim. Dyn. 2011, 36, 2419–2439. [Google Scholar] [CrossRef]
- Matskovsky, V.; Fidel, A.R.; Guillermo, M.P. Removal of a non-climatically induced seven-year cycle from Nothofagus pumilio tree-ring width chronologies from Tierra del Fuego, Argentina for their use in climate reconstructions. Dendrochronologia 2019, 57, 125610. [Google Scholar] [CrossRef]
- Sanchez-Salguero, R.; Camarero, J.J.; Gutiérrez, E.; Gazol, A.; Sangüesa-Barreda, G.; Moiseev, P.; Linares, J.C. Climate Warming Alters Age-Dependent Growth Sensitivity to Temperature in Eurasian Alpine Treelines. Forests 2018, 9, 688. [Google Scholar] [CrossRef]
- Zeng, X.M.; Evans, M.N.; Liu, X.H.; Wang, W.Z.; Xu, G.B.; Wu, G.J.; Zhang, L.N. Spatial patterns of precipitation-induced moisture availability and their effects on the divergence of conifer stem growth in the western and eastern parts of China’s semi-arid region. For. Ecol. Manag. 2019, 451, 117524. [Google Scholar] [CrossRef]
- Breitenmoser, P.; Brönnimann, S.; Frank, D. Forward modelling of tree-ring width and comparison with a global network of tree-ring chronologies. Clim. Past 2014, 10, 437–449. [Google Scholar] [CrossRef]
- Lavergne, A.; Dauxa, V.; Villalb, R.; Barichivich, J. Temporal changes in climatic limitation of tree-growth at upper treeline forests: Contrasted responses along the west-to-east humidity gradient in Northern Patagonia. Dendrochronologia 2015, 36, 49–59. [Google Scholar] [CrossRef]
- Mina, M.; Martin-Benito, D.; Bugmann, H.; Cailleret, M. Forward modeling of tree-ring width improves simulation of forest growth responses to drought. Agric. For. Meteorol. 2016, 221, 13–33. [Google Scholar] [CrossRef]
- Bjorklund, J.; Rydval, M.; Schurman, J.S.; Seftigen, K.; Trotsiuk, V.; Jandaa, P.; Mikolas, M.; Dusatko, M.; Cada, V.; Bace, R.; et al. Dientangling the multi-faceted growth patterns of primary Picea abies forests in the Carpathian arc. Agric. For. Meteorol. 2019, 271, 214–224. [Google Scholar] [CrossRef]
- Shi, J.F.; Liu, Y.; Vaganov, E.; Cai, Q.F.; Shishov, V. A primary discussion on the climatic response of Pinus tabulaeformis in the Helan Mountain. Chin. J. Quat. Sci. 2005, 25, 245–251. (In Chinese) [Google Scholar]
- Zhang, Y.X.; Shao, X.M.; Xu, Y.; Wilmking, M. Process-based modeling analyses of Sabina prewalskii growth response to climate factors around the northeastern Qaidam Basin. Chin. Sci. Bull. 2011, 56, 1518–1525. (In Chinese) [Google Scholar] [CrossRef][Green Version]
- Li, Y.; Shao, X.M.; Guo, J. Primary discussion of the climate mechanism response of Picea Grassifolia on east edge of Qaidem Basin. Chin. J. Plateau Meteorol. 2010, 29, 349–358. (In Chinese) [Google Scholar]
- He, M.H.; Yang, B.; Shishov, V.; Rossi, S.; Brauning, A.; Ljungqvist, F.C.; Griessinger, J. Relations between wood formation and cambium phenology on the Tibetan Plateau during 1960–2014. Forests 2018, 9, 86. [Google Scholar] [CrossRef]
- Yang, Y.; Yao, C.X.; Xu, D.L. Ecological compensation standards of national scenic spots in western China: A case study of Taibai Mountain. Tour. Manag. 2020, 76, 103950. [Google Scholar] [CrossRef]
- Kou, Z.X.; Yao, Y.H.; Hu, Y.F.; Zhang, B.P. Discussion on position of China’s north-south transitional zone by comparative analysis of mountain altitudinal belts. J. Mt. Sci. 2020, 17, 1901–1915. [Google Scholar] [CrossRef]
- Wang, J.; Zhang, B.P.; Yao, Y.H. The Spatial Pattern of the Upper Limit of Montane Deciduous Broad-Leaved Forests and Its Geographical Interpretation in the East Monsoon Realm of China. Forests 2021, 12, 1225. [Google Scholar] [CrossRef]
- Wang, X.P.; Zhang, L.; Fang, J.Y. Geographical differences in alpine timberline and its climatic interpretation in China. Acta Geogr. Sin. 2004, 59, 871–879. (In Chinese) [Google Scholar]
- Tang, Z.Y.; Fang, J.Y. Temperature variation along the northern and southern slopes of Mt. Taibai, China. Agric. For. Meteorol. 2006, 139, 200–207. [Google Scholar] [CrossRef]
- Liu, H.B.; Shao, X.M. Reconstruction of early-spring temperature of Qinling Mountains using tree-ring chronologies. Chin. J. Acta Geogr. Sin. 2003, 58, 879–884. (In Chinese) [Google Scholar]
- Hu, Y.F.; Bao, G.; Liu, N.; Qu, Y. May-July mean minimum temperature variability in the mid-Qinling Moutains, central China, since 1814 CE. Quatern. Int. 2018, 476, 102–109. [Google Scholar] [CrossRef]
- Dai, J.H.; Shao, X.M.; Cui, H.T.; Ge, Q.S.; Liu, H.Y.; Tang, Z.Y. Reconstruction of past eco-climate by tree-ring width index of Larix Chinensis on Mt. Taibai. Chin. J. Quat. Sci. 2003, 23, 428–435. (In Chinese) [Google Scholar]
- Liu, Y.; Linderholm, H.W.; Song, H.M.; Cai, Q.F.; Tian, Q.H.; Sun, J.Y.; Chen, D.L.; Simelto, N.E.; Seftigen, K.; Tian, H.; et al. Temperature variations recorded in Pinus tabulaeformis tree rings from the southern and northern slopes of the central Qinling Mountains, central China. Boreas 2009, 38, 285–291. [Google Scholar] [CrossRef]
- Wu, Z.Y. China Vegetation; Science Press: Beijing, China, 1980. [Google Scholar]
- Li, X.Q.; Dodson, J.; Zhou, J.; Wang, S.M.; Sun, Q.L. Vegetation and climate variations at Taibai, Qinling Mountains in central China for the last 3500 cal BP. J. Integr. Plant Biol. 2005, 47, 905–916. [Google Scholar] [CrossRef]
- Shi, Z.Y.; Wang, F.Y.; Zhang, K.; Chen, Y.L. Diversity and distribution of arbuscular mycorrhizal fungi along altitudinal gradients in Mount Taibai of the Qinling Mountains. Can. J. Microbiol. 2014, 60, 811–818. [Google Scholar] [CrossRef]
- Wang, H.Y.; Liu, H.Y.; Liu, Y.H.; Cui, H.T.; Abrahamsen, N. Mineral magnetism and other characteristics of sediments from an alpine lake (3410 m a.s.l.) in central China and implications for late Holocene climate and environment. J. Paleolimnol. 2010, 43, 345–367. [Google Scholar] [CrossRef]
- Stokes, M.A.; Smiley, T.L. An Introduction to Tree-Ring Dating; University of Chicago Press: Chicago, IL, USA, 1968. [Google Scholar]
- Pilcher, J.R. Sample preparation, cross-dating and measurement. In Methods of Dendrochronology: Applications in the Environmental Sciences; Cook, E.R., Kairiukstis, L., Eds.; Kluwer: Dordrecht, The Netherlands, 1990. [Google Scholar]
- Holmes, R.L. Computer-assisted quality control in tree-ring dating and measurement. Tree Ring Bull 1983, 43, 69–78. [Google Scholar]
- Cook, E.R. A Time Series Analysis Approach to Tree Ring Standardization; University of Arizona: Tucson, AZ, USA, 1985. [Google Scholar]
- Zhai, D.P.; Bai, H.Y.; Qin, J.; Deng, C.H.; Liu, R.J.; He, H. Temporal and spatial variability of air temperature lapse rates in Mt. Taibai, Central Qinling Mountains. Chin. J. Acta Geogr. Sin. 2016, 71, 1587–1595. (In Chinese) [Google Scholar]
- Huang, J.; Van den Dool, H.M.; Georgakakos, K.P. Analysis of model-calculated soil moisture over the United States (1931–1993) and applications to long-range temperature forecasts. J. Clim. 1996, 9, 1350–1362. [Google Scholar] [CrossRef]
- Gates, D.M. Biophysical Ecology; Springer-Verlang: New York, NY, USA, 1980. [Google Scholar]
- Tolwinski-Ward, S.E.; Anchukaitis, K.J.; Evans, M.N. Bayesian parameter estimation and interpretation for an intermediate model of tree-ring width. Clim. Past 2013, 9, 1481–1493. [Google Scholar] [CrossRef]
- Evans, M.N.; Reichert, B.K.; Kaplan, A.; Anchukaitis, K.J.; Vaganov, E.A.; Hughes, M.K.; Cane, M.A. A forward modeling approach to paleoclimatic interpretation of tree-ring data. J. Geophys. Res. 2006, 111, G03008. [Google Scholar] [CrossRef]
- Touchan, R.; Shishov, V.V.; Meko, D.M.; Nouiri, I.; Grachev, A. Process based model sheds light on climate sensitivity of Mediterranean tree-ring width. Biogeosciences 2012, 9, 965–972. [Google Scholar] [CrossRef]
- Wigley, T.M.; Briffa, K.R.; Jones, P.D. On the average value of correlated time series, with applications in dendroclimatology and hydrometeorology. J. Clim. Appl. Meteorol. 1984, 23, 201–213. [Google Scholar] [CrossRef]
- Cook, E.R.; Kairiukstis, L.A. Methods of Dendrochronology: Applications in the Environmental Sciences; Springer: New York, NY, USA, 2013. [Google Scholar]
- Liu, Y.; Lei, Y.; Sun, B.; Song, H.M.; Li, Q. Annual precipitation variability inferred from tree-ring width chronologies in the Changling–Shoulu region, China, during AD 1853–2007. Dendrochronologia 2013, 31, 290–296. [Google Scholar] [CrossRef]
- Trouet, V.; Van Oldenborgh, G.J. KNMI Climate Explorer: A Web-Based Research Tool for High-Resolution Paleoclimatology. Tree-Ring Res. 2013, 69, 3–13. [Google Scholar] [CrossRef]
- Wu, X.D.; Shao, X.M. A preliminary analysis on response of tree-ring density to climate in the Qinling Mountains of China. Chin J. Appl. Meteorol. 1994, 5, 253–256. (In Chinese) [Google Scholar]
- Dang, H.S.; Jiang, M.X.; Zhang, Q.F.; Zhang, Y.J. Growth response of subalpine fir (Abies fargesii) to climate variability in the Qinling Mountain, China. For. Ecol. Manag. 2007, 240, 143–150. [Google Scholar] [CrossRef]
- Liu, Y.; Wang, Y.; Li, Q.; Song, H.M.; Linderholm, H.W.; Leavitt, S.W.; Wang, R.Y.; An, Z.S. Tree-ring stable carbon isotope-based May-July temperature reconstruction over Nanwutai, China, for the past century and its record of 20th century warming. Quatern. Sci. Rev. 2014, 93, 67–76. [Google Scholar] [CrossRef]
- Peterson, D.W.; Peterson, D.L.; Ettl, G.J. Growth response of subalpine fir to climatic variability in the Pacific Northwest. Can. J. For. Res. 2002, 32, 1503–1517. [Google Scholar] [CrossRef]
- Splechtna, B.E.; Dobry, J.; Klinka, K. Tree-ring characteristics of subalpine fir (Abies lasiocarpa (Hook) Nutt.) in relation to elevation and climatic fluctuations. Ann. For. Sci. 2000, 57, 89–100. [Google Scholar] [CrossRef]
- Cai, Q.F.; Liu, Y. Climatic response of three tree species growing at different elevations in the Lüliang Mountains of Northern China. Dendrochronologia 2013, 31, 311–317. [Google Scholar] [CrossRef]
- Zhang, Y.X.; Michael, N.E.; Yu, L.; Huang, L.; Wang, Y.F. What causes variable response in tree growth to climate change at a single site? A case study of Picea crassifolia at the upper treeline, Qilian Mountains, China. Trees 2020, 34, 615–622. [Google Scholar] [CrossRef]
- Wang, J.C.; Li, S.H.; Guo, Y.L.; Yang, Q.; Ren, R.; Han, Y.J. Responses of Larix principis-rupprechtii radial growth to climatic factors at different elevations on Guancen mountain, North-Central China. Forests 2022, 13, 99. [Google Scholar] [CrossRef]
- Leonelli, G.; Pelfini, M.; Battipaglia, G.; Cherubini, P. Site-aspect influence on climate sensitivity over time of a high-altitude Pinus cembra tree-ring network. Clim. Chang. 2009, 96, 185–201. [Google Scholar] [CrossRef]
- Gou, X.H.; Chen, F.H.; Yang, M.; Li, J.; Peng, J.; Jin, L. Climatic response of thickleaf spruce (Piceacrassifolia) tree-ring width at different elevation sover Qilian Mountains, northwestern China. J. Arid. Environ. 2005, 61, 513–524. [Google Scholar] [CrossRef]
- Qiang, W.Y.; Wang, X.L.; Chen, T.; Feng, H.Y.; An, L.Z.; He, Y.Q.; Wang, G. Variations of stomatal density and carbon isotope values of Picea crassif olia at different altitudes in the Qilian Mountains. Trees 2003, 17, 258–262. [Google Scholar] [CrossRef]
- Wang, B.; Chen, T.; Wu, G.J.; Xu, G.B.; Zhang, Y.F.; Gao, H.N.; Zhang, Y.; Feng, Q. Qinghai spruce (Picea crassifolia) growth–climate response between lower and upper elevation gradient limits: A case study along a consistent slope in the mid-Qilian Mountains region. Environ. Earth Sci. 2016, 75, 236. [Google Scholar] [CrossRef]
- Ponocná, T.; Spyt, B.; Kaczka, R.; Büntgen, U.; Treml, V. Growth trends and climate responses of Norway spruce along elevational gradients in East-Central Europe. Trees 2016, 30, 1633–1646. [Google Scholar] [CrossRef]
- Peng, J.F.; Gou, X.H.; Chen, F.H.; Liu, P.X.; Zhang, Y.Q.; Zhang, Y.; Tian, Q.H. The characteristics of tree-ring width of Sabina przewalskii Kom for different elevations in the A’nyemaqen Moutains. J. Glaci. Geocry 2006, 28, 713–721. [Google Scholar]
- Acevedo, W.; Reich, S.; Cubasch, U. Towards the assimilation of tree-ring-width records using ensemble Kalman filtering techniques. Clim. Dyn. 2016, 46, 1909–1920. [Google Scholar] [CrossRef]
- Evans, M.N.; Smerdon, J.E.; Kaplan, A.; Tolwinski-Ward, S.E.; González-Rouco, J.F. Climate field reconstruction uncertainty arising from multivariate and nonlinear properties of predictors. Geophys. Res. Lett. 2014, 41, 9127–9134. [Google Scholar] [CrossRef]
Publisher’s Note: MDPI stays neutral with regard to jurisdictional claims in published maps and institutional affiliations. |
© 2022 by the authors. Licensee MDPI, Basel, Switzerland. This article is an open access article distributed under the terms and conditions of the Creative Commons Attribution (CC BY) license (https://creativecommons.org/licenses/by/4.0/).