Abstract
The Loess Plateau is a fragile ecological zone that is sensitive to climate change. The response, adaptation, and feedback of tree growth in forest ecosystems to global warming and CO2 enrichment are urgent scientific issues. Intrinsic water use efficiency (iWUE) is an important indicator for understanding forest ecosystem adaptability to climate change and CO2 enrichment. In this study, tree-ring width, tree-ring stable carbon isotope ratio (δ13C), and iWUE of P. tabulaeformis Carr. were established. Climate response analysis showed that temperature was the main limiting factor affecting radial tree growth and that relative humidity significantly affected the stable carbon isotope fractionation of tree rings. During 1645–2011, the iWUE increased by 27.1%. The responses of iWUE to climate factors and atmospheric CO2 concentrations (Ca) showed that the long-term variation in iWUE was affected by Ca, which could explain 69% of iWUE variation, and temperature was the main factor causing iWUE interannual variation. The ecosystem of P. tabulaeformis showed a positive response to rising Ca, as its carbon sequestration capacity increased. In response to global warming and CO2 enrichment, rising Ca promoted increases in iWUE but ultimately failed to offset the negative impact of warming on tree growth in the study area.
1. Introduction
Forests account for approximately 30% of the global land surface area and are the world’s most important and largest natural terrestrial ecosystems [1,2]. They store nearly 45% of the carbon in terrestrial systems, accounting for ~50% of the net primary productivity on land, and can absorb approximately 25% of anthropogenic carbon emissions, effectively alleviating the rate of global warming [3,4]. As the most active carbon pool in the world, forest ecosystems significantly affect the global carbon cycle and climate change [5,6]. The relationship between forests and climate change is reciprocal, and global climate change also has an important impact on forest ecosystems [7,8]. It is an indisputable fact that global warming and atmospheric CO2 concentrations continue to rise. Rising temperatures and CO2 concentrations have a direct impact on the photosynthesis of plants, thereby affecting the health and stability of forest ecosystems [9,10]. In the context of global warming and CO2 enrichment, the response and adaptability of forest ecosystem to such rapid environmental change and its dynamic variations in the future are the focus of scientific attention. However, present-day observational data are too limited to reveal these issues.
As the main components of forest systems, individual trees can grow for hundreds or even thousands of years. Due to their sensitivity to atmospheric CO2 concentrations and climate change, trees have become an important tool for studying environmental variations at various time scales over the past century or even millennia and at large regional spatial scales [11,12,13,14]. Trees are also ideal resources for studying the dynamic variations and climate adaptability of forests [15]. Tree-ring stable carbon isotopes have the advantages of relatively clear physiological mechanisms, stronger climate signals, small sample size requirements, and relatively complete retention of low-frequency signals; hence, they play an important role in research on climate change [16,17]. The intrinsic water use efficiency (iWUE) derived from the tree-ring stable carbon isotope ratios (δ13C) is defined as the ratio of the photosynthetic assimilation rate to water evapotranspiration. Studying the long-term variation history of iWUE is an important starting point for understanding the relationships among tree growth, global warming, and the continuously rising CO2 concentration. It is also a breakthrough point for understanding the long-term adaptability of forest ecosystems to climate change and the coupling relationship between carbon and the water cycles [18,19,20], which plays a key role in exploring the maximization of the ecological benefits of forests.
The Loess Plateau is located at the intersection of the northwest arid region, the eastern monsoon region, and the arid Qinghai-Tibet Plateau region in central and northern China (Figure 1). It is a key region sensitive to climate change [21]. There are frequent human activities and severe soil erosion on the Loess Plateau. In recent years, increasing extreme climate events have brought serious threats to the ecological environment of the local forest [22]. For example, in 2010, heavy rains occurred in Zhouqu County, Gansu Province, and triggered mudslides that caused significant numbers of lives to be lost and many trees to be destroyed [23]. Since the 1970s, the runoff of the Yellow River has gradually decreased, seriously affecting the growth of trees near the Yellow River Basin [24]. In the context of global warming and CO2 enrichment, tree growth processes are changing in the Loess Plateau. Does warming and rising CO2 concentrations promote or inhibit tree growth? How does tree growth in the local forest ecosystem respond to rapid climate change? What are the adaptation strategies of forest ecosystems to climate change? These issues are directly related to the health and stability of forest ecosystems and affect the productivity and carbon sink capacity of forest systems [25,26]. Many climate reconstructions have been performed in this area based on tree-ring width, density, and stable oxygen isotope indicators [27,28,29], but there are relatively few studies on the correlations among rising CO2 concentrations, climate change, tree growth, and long-term dynamic variations in iWUE in the context of global warming and CO2 enrichment.
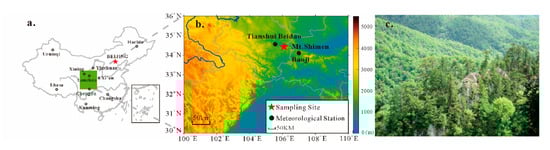
Figure 1.
(a) The green area represents the location of the study area in China, (b) the distribution of tree-ring sampling site and adjacent meteorological stations, and (c) the photo of Mt. Shimen.
In this study, Mt. Shimen located on the Loess Plateau was selected as the research site, and P. tabulaeformis in its forest system was collected to establish tree-ring width, δ13C, and iWUE series. The variability and characteristics of these three time series are compared. The effects of rising atmospheric CO2 concentrations and climate change on the tree-ring width, δ13C, and iWUE series are analyzed, and the relationship between iWUE and tree-ring width chronology is discussed. This paper aims to reveal the physiological response of P. tabulaeformis to global warming and CO2 enrichment and improve our understanding of the water–carbon coupling process of forests. This study provides a scientific basis for forest management and future plantation breeding to a certain extent.
2. Materials and Methods
2.1. Study Area and Sampling
Mt. Shimen is located in the city of Tianshui, Gansu Province, on the northern slope of the West Qinling Mountains (Figure 1a,b). The area is sparsely populated, and the forests are secondary in nature. The types of forest vegetation are complex and mainly dominated by sharp-toothed oak. Mt. Shimen belongs to the warm temperate monsoon climate zone. The annual average temperature is 11 °C, the annual average precipitation is 491 mm, and the average altitude is 2094 m. Affected by many climatic factors such as the East Asian monsoon and westerly circulation, this area has formed unique and complex climatic characteristics.
The tree-ring sampling site was located at the ridge of Mt. Shimen (34°27′ N, 106°09′ E, 2050–2150 m a.s.l.) (Figure 1c). The soil at this site is thin, mountainous brown forest soil. In 2010, we collected a set of P. tabulaeformis cores, which mostly grows in the crevices of rocks. From late April to August is the growing season of P. tabulaeformis in the study area [30]. Two cores were taken from each selected tree in different directions. In total, 64 core samples were collected from 32 living trees. Tree-ring samples were processed and cross-dated according to the standard dendrochronological technique [31]. All samples were measured with a 0.01 mm precision. The quality of the cross-dating was then checked using the COFECHA program [32]. Tree-ring width chronology was developed by the ARSTAN program [33]. When detrending the non-climate signals, a straight line or negative exponential function was adopted. The standard tree-ring chronology was used in this study. The tree-ring width data have been published by Song et al. [34].
2.2. Measurement of Tree-Ring Cellulose δ13C
The collected tree-ring samples were dried, fixed, polished, and cross-dated to determine the exact year of each ring of all samples. In the absence of carbon pollution, each annual ring was separated under a microscope with a thin, sharp knife. The detailed experimental procedures for α-cellulose extraction can be found in [14].
Approximately 110–140 μg of homogenized α-cellulose was wrapped in a tin capsule for measurement. The δ13C values were determined using the Delta V Advantage isotope ratio mass spectrometer connected with a FLASH 2000 elemental analyzer (EA). The carbon isotope ratio was expressed as δ13C relative to the deviation of the Pee Dee Belemnite (PDB). One standard cellulose sample (IAEA CH3) was inserted for every eight samples. The δ13C values of tree rings were calculated as follows: δ13C = (Rsample/Rstandard − 1) × 103‰ (R represents the 13C/12C ratio, and Rsample and Rstandard are the R values of the sample and the standard sample, respectively). The analytical accuracy of the carbon isotope measurement was less than ±0.2‰ according to repeated measurements of the working standard.
2.3. Calculation of Physiological Parameters
Studies have shown that climate and atmospheric CO2 concentrations are the main factors affecting the variation in tree-ring δ13C. Climate affected the high-frequency variation in the tree-ring δ13C series, and CO2 concentration affected the low-frequency variation in the tree-ring δ13C series [17,35]. Since the Industrial Revolution, due to the extensive use of fossil fuels, atmospheric CO2 concentrations have continued to increase, while atmospheric δ13Cair has continued to decrease, resulting in a decreasing trend in global tree-ring δ13C values [36,37,38], and this change is not related to climate. To accurately capture the climate information reflected by tree-ring δ13C series, it is necessary to separate low- and high-frequency signals [39,40,41]. As outlined by Farquhar et al. [42], we used δ13C ratios from the CO2 recorded by ice cores and atmospheric CO2 to remove the effect of δ13C in annual atmospheric CO2 from the tree-ring δ13C time series [43]. Finally, we obtained a normalized carbon isotope fractionation time series (Δ13C). Δ13C was defined as:
where δ13Cair is the δ13C value of atmospheric CO2 and δ13Ctree is the δ13C value of tree-ring cellulose.
Δ13C = (δ13Cair − δ13Ctree)/(1 + δ13Ctree/1000)
Cellulose Δ13C values were then converted to Ci/Ca ratios using the following equation [41]:
where a (~4.4‰) is the isotopic fractionation coefficient of CO2 diffusion from the atmosphere into the intercellular space of cells, b (~27‰) is the corresponding discrimination value for carboxylation, and Ci and Ca are the intercellular and atmospheric CO2 concentrations, respectively.
Δ13C = a + (b − a) Ci/Ca
iWUE is defined as the ratio between the photosynthetic assimilation rate (A) and stomatal conductance for water vapor (gs) [44,45] using the following equation:
iWUE = A/gs = Ca × [(1 − Ci/Ca)/1.6]
Based on Formulas (1)–(3), the iWUE series of the Mt. Shimen region from 1645 to 2011 was established.
2.4. Climatic Data
There are two meteorological stations available adjacent to the sampling site: Tianshui Beidao Station (34°34′ N, 105°52′ E, 1154.9 m a.s.l., 1965–2011) and Baoji Station (34°12′ N, 107°05′ E, 612.4 m a.s.l., 1952–2011). Comparing the monthly total precipitation, monthly mean temperature, and monthly mean relative humidity of those two stations, the climate changes in the study area appeared to be consistent (Figure 2a–c). The Baoji Station, with its long observation period (started in 1952), was selected for the climate response analysis. According to the records from the Baoji Station, the annual total precipitation from 1952 to 2011 was 675.18 mm, the annual mean temperature was 13.20 °C, and the annual mean relative humidity was 67.33%. The climatic data were downloaded from the Meteorological Information Center of China (http://data.cma.cn/, accessed on 23 September 2018). The characteristics of interannual climate change at Baoji Station indicated that in the instrumental period, the annual average temperature generally showed an increasing trend and the annual precipitation showed a downward trend (Figure 2d,e). The relative humidity, a comprehensive index of both temperature and precipitation, also showed a downward trend (Figure 2f). Partial correlation analysis was carried out to determine which climate factor dominated the changes in relative humidity. Partial correlation analysis showed that the correlation between relative humidity and temperature was not as high as that between relative humidity and precipitation; thus, precipitation was the dominant climatic factor responsible for changes in relative humidity, and relative humidity was also an indicator of hydrological changes in the study area. In addition, the Palmer drought severity index (PDSI) grid point data with 0.5° × 0.5° resolution were obtained via the KNMI Climate Explorer [46].
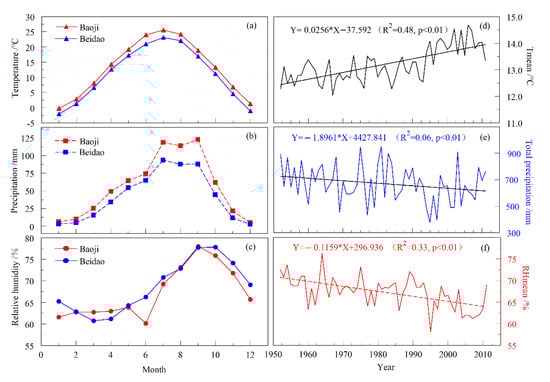
Figure 2.
Climatic records of Baoji and Tianshui Beidao Stations. (a–c) Multi-year monthly mean temperature, monthly precipitation, and monthly mean relative humidity distributions. (d–f) Annual mean temperature, annual total precipitation, and annual mean relative humidity records at Baoji Meteorological Station during 1952–2011, where the oblique line represents the trend of climate change.
2.5. Statistical Method
A final tree-ring Δ13C series for Mt. Shimen was generated using the “numerical mix method” [47]. This method synthesized each individual tree-ring Δ13C series into a total series that could represent the variation in tree-ring Δ13C for Mt. Shimen, and this total series was used for the response analysis. Pearson’s correlation analysis was conducted to determine the influence of local climate factors and atmospheric CO2 concentrations on variations in tree-ring width, Δ13C, and iWUE time series. Since tree growth may be affected by climate conditions before and during the growing season, the correlation between the monthly climate factors from January to December of the previous year and tree-ring Δ13C series was also analyzed. In addition, the first-order difference correlation method was used to analyze the correlation between the tree-ring width standard chronology (STD) and iWUE at a high frequency, and a 31-year sliding correlation was used to obtain the trend of the correlation between them over time.
3. Results and Discussion
3.1. Characteristics of Tree-Ring Cellulose δ13C and Δ13C Series
After comparing all samples, five cores with relatively clear tree-ring boundaries were finally selected for stable carbon isotope research. The five cores were named SM 37B (1615–2011), SM 32C (1635–2011), SM 41A (1619–2011), SM 18A (1891–2011), and SM 13B (1882–2011). To avoid the interference of the “juvenile effect”, we removed the values of the first 30 years of each core. Table 1 shows the statistical characteristics of the tree-ring δ13C series on Mt. Shimen. The first-order autocorrelation (AR1) of each series was significant (0.44–0.65), indicating that there was a significant climate and isotope lag effect from the previous year to the present year of each tree-ring δ13C series, but the influence of climate factors in the present year was still dominant. This may be because in the process of synthesizing organic compounds during photosynthesis in the current year, trees use part of the organic compounds that were stored in the trees in the previous year. The δ13C values of C3 plants usually range from −20‰ to −35‰ [41], while the δ13C values of C3 plants located in arid and semiarid regions are relatively high. In our study, the mean values of tree-ring δ13C in each series ranged from −23.45‰ to −21.09‰, with an average value of −22.26‰ (Table 1), which is consistent with the theoretical values and similar to the results of previous studies of P. tabulaeformis [48,49]. Figure 3a shows the interannual and interdecadal variations in each tree-ring δ13C series. It can be seen that their variation trend was quite consistent. Our measurement series showed a significant decline since 1850, with an annual decrease of 0.011‰ (Figure 3a), which is consistent with the continuous decline in atmospheric δ13Cair since the Industrial Revolution. This decline was recorded in our tree-ring cellulose δ13C series.

Table 1.
Statistical characteristics of individual and composite tree-ring cellulose δ13C time series.
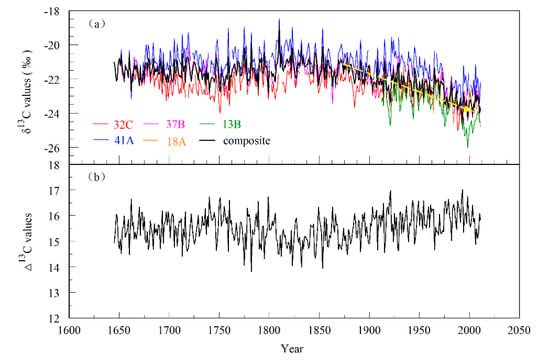
Figure 3.
(a) Individual and composite tree-ring cellulose δ13C time series of P. tabulaeformis (with 30 years of juvenile growth removed, the yellow, thick line is a downward trend), and (b) the composite tree-ring cellulose Δ13C time series.
After correcting the tree-ring δ13C series of each core, we obtained five tree-ring Δ13C series and finally synthesized a total tree-ring Δ13C time series using the “numerical mix method” (Figure 3b) [47]. The correlations between the tree-ring δ13C and Δ13C series of each core were significant. The correlations between the individual tree-ring δ13C series (r = 0.61–0.93, p < 0.0001) were significantly higher than those between the tree-ring Δ13C series (r = 0.33–0.87, p < 0.0001) (Table 2). The results indicated that the individual δ13C series were greatly affected by common factors, and it is likely that the variation in atmospheric CO2 concentration resulted in a consistent variation trend in the individual tree-ring δ13C series.
Table 2.
Correlations between tree-ring cellulose δ13C and Δ13C time series.
3.2. Variation Characteristics of Ca, Ci, Ci/Ca, and iWUE
Since the 1850s, the changes in Ca, leaf intercellular CO2 concentration (Ci), and iWUE all showed a significant increasing trend (Figure 4a,c), and the variation in Ci/Ca was relatively stable (Figure 4b). During the whole period (1645–2011), Ca increased from 285 to 391.63 ppm, and Ci increased from a minimum of 118.75 ppm in 1782 to a maximum of 201.60 ppm in 2010. The iWUE of P. tabulaeformis in Mt. Shimen varied from 80.87 to 128.03 μmol/mol, with an average value of 94.55 μmol/mol. The iWUE of P. tabulaeformis increased by 27.1% over the past 367 years. Peñuelas et al. [50] found that iWUE increased by approximately 20.5% globally. In tropical regions, iWUE increased by approximately 40% [51], and in temperate regions, the iWUE of different tree species increased from 19% to 48% [52]. The rate of increase for iWUE in our study area was very consistent with that in temperate regions, which provides further evidence for the increase in iWUE in temperate forest ecosystems.
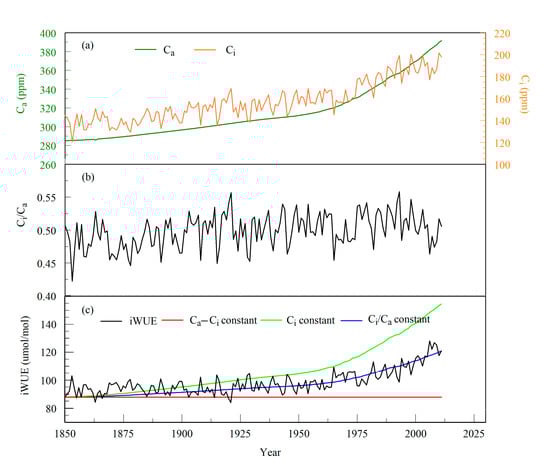
Figure 4.
(a) Variations in atmospheric CO2 concentration (Ca) and leaf intercellular CO2 concentration (Ci), (b) 13C discrimination ratios (Ci/Ca), and (c) iWUE calculated from three scenarios as a baseline for interpreting gas exchange in response to increasing Ca [53]. The atmospheric CO2 concentration was derived from McCarroll and Loader [41].
3.3. Regulation of Hydrological Factors and Temperature in Tree-Ring Radial Growth and Stable Carbon Isotopic Fractionation
Pearson correlation analysis was conducted between the STD chronology and various climatic factors (monthly average temperature, precipitation, relative humidity, and PDSI). Correlation analysis showed that the STD chronology had a negative correlation with temperature in all months, and this correlation was very significant in multiple months. In contrast, precipitation, relative humidity, and PDSI were positively correlated with the STD chronology in most months. After combining the months, the STD chronology had the highest correlation with the average temperature from May to July, with a correlation coefficient of −0.70 (1952–2011, p < 0.0001), indicating that temperature was the main limiting factor affecting tree radial growth in the study area. The period from May to July was the fastest growing period for trees in Mt. Shimen. During this period, if precipitation is insufficient, then excessively high temperatures easily lead to aggravated soil moisture evaporation, and the transpiration of trees is strengthened accordingly. This causes moisture stress in the trees, hinders their uptake of nutrients, and ultimately limits their radial growth, leading to the formation of narrow or missing rings.
The tree-ring cellulose Δ13C series in Mt. Shimen was negatively correlated with temperature and positively correlated with precipitation, relative humidity, and PDSI in most months (Figure 5). After combining the months, the correlations between them were all significant. However, the tree-ring cellulose Δ13C series had the highest correlation with mean relative humidity from May to September (r = 0.527, p < 0.001, n = 60) (Figure 5). These results showed that the average relative humidity from May to September was the main climatic factor affecting the stable carbon isotopic fractionation of tree rings on Mt. Shimen. The above results were consistent with the stable carbon isotope study in Tianmu Mountain [17], that conform to the fractionation mechanism of stable carbon isotopes in tree-ring cellulose [42] and have reasonable explanations in terms of physiology. May–September is the growth season for trees on Mt. Shimen. During this crucial period, P. tabulaeformis absorbs atmospheric CO2 through its leaves, and when the external relative humidity is high, the stomatal conductance of the leaves increases. At this time, more CO2 enters the leaves for photosynthesis, in which CO2 molecules containing lighter carbon atoms (12C) more easily pass-through stomata, and 12C is preferentially used by photosynthetic enzymes, resulting in strong fractionation of 13C, which results in lower δ13C and higher Δ13C values in tree rings. However, the reduction in external relative humidity aggravates the moisture stress of the trees. Some leaf stomata will close to prevent excessive water loss, which reduces the CO2 concentration in plants. This leads to lower recognition of CO2 by the plants, so the trees have to use more 13C elements to participate in photosynthesis, and the fractionation of stable carbon isotopes decreases, resulting in a reduction in tree-ring Δ13C values.
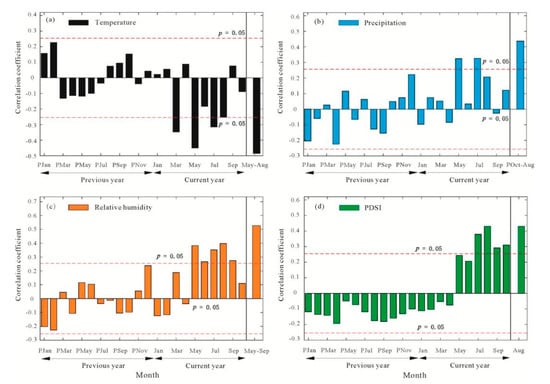
Figure 5.
Correlation analysis between tree-ring cellulose Δ13C series of P. tabulaeformis and temperature (a), precipitation (b), relative humidity (c), PDSI (d) in Mt. Shimen during 1952–2011.
3.4. Response of the iWUE Series to Environmental Factors
Since the 1850s, the iWUE of P. tabulaeformis has been significantly positively correlated with Ca, and the correlation coefficient has reached 0.833 (n = 162, p < 0.001) (Figure 6). According to the regression analysis, Ca could explain 69% and 82% of the variance in iWUE and Ci, respectively, indicating that the increase in the atmospheric CO2 concentration was the main reason for the increase in iWUE and Ci. The increase in Ca causes a decrease in the stomatal conductance of leaves and leads to a decrease in the transpiration rate of the trees, ultimately reducing water loss in the trees. The relative increase in soil moisture alleviates the restriction of water on tree growth, thereby improving the photosynthetic rate of the leaves [54,55,56]. This process enhances the ability of the leaves to assimilate and absorb CO2. The above factors resulted in the improvement in the iWUE of P. tabulaeformis. This tree physiological process has also been confirmed by many Free-Air CO2 Enrichment (FACE) and short-term CO2 control experiments [57]. Saurer et al. [53] proposed three gas exchange scenarios in response to increasing Ca: (1) Ci remains constant, the value of Ci/Ca decreases, and iWUE increases, (2) Ci/Ca remains constant and iWUE increases, representing a positive response of iWUE increase to rising Ca, and (3) Ca–Ci remains constant, which represents the negative response of iWUE increase to rising Ca. In our study, the variation in iWUE from 1850 to 1900 was closer to Scenario (1); after the 1900s, Scenario (2) was more in line with the variation in iWUE (Figure 4c). This result indicated that the change in iWUE in the study area showed a positive response to rising Ca. In the context of global warming and CO2 enrichment, P. tabulaeformis in Mt. Shimen showed some adaptability to the continuous increase in Ca, and its carbon sequestration capacity increased further.

Figure 6.
Scatter diagram of the relationship between iWUE and atmospheric CO2 concentration (Ca). The straight line represents the change trend. The regression equation, explained variance, and level of significance are also shown.
The increase in Ca explained the low-frequency variation in the iWUE; however, the variation in iWUE was also the result of a regional climate response [58,59]. Leaf stomatal conductance is the main factor affecting the interannual variation in iWUE, and the change in stomatal conductance is closely related to the climatic conditions in the study area. Therefore, we explored the response of iWUE to climatic factors. Correlation analysis showed that iWUE was significantly positively correlated with annual mean temperature (r = 0.73, n = 60, p < 0.01) and negatively correlated with annual mean precipitation (r = −0.30, n = 60, p < 0.02), relative humidity (r = −0.65, n = 60, p < 0.01), and PDSI (r = −0.41, n = 60, p < 0.01) (Figure 7), indicating that temperature has a more important effect on interannual variation in iWUE. Higher temperature decreases the relative humidity and soil moisture, which aggravates water stress in trees and leads to a decrease in the stomatal conductance and the transpiration rate of trees, thus increasing their intrinsic water use efficiency. Liu et al. [14] reconstructed the mean relative humidity (RHJA) variations from 1615 to 2011 based on tree-ring stable oxygen isotopes on Mt. Shimen. The RHJA reconstruction presents a drying trend since 1860. Song et al. [34] and Chen et al. [29] reconstructed the temperature variation history based on tree-ring width and density indicators in Mt. Shimen and found a rising temperature trend in recent decades, which was also confirmed by meteorological data (Figure 2d–f). This trend of warming and drying climate change was also the reason for the increase in the iWUE of P. tabulaeformis in our study area.
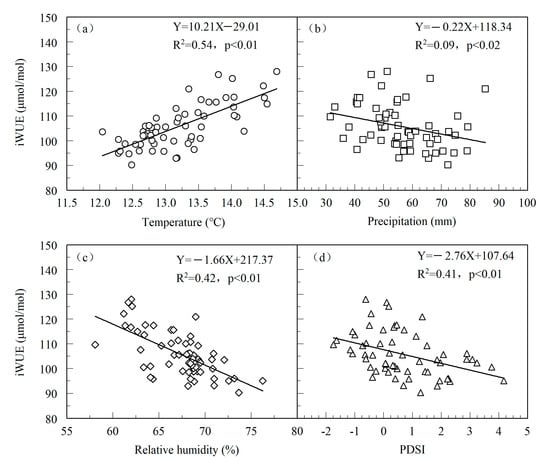
Figure 7.
Scatter diagrams of the relationship between iWUE and annual mean temperature (a), annual mean precipitation (b), annual mean relative humidity (c), and annual mean PDSI (d). The straight line represents the change trends. The regression equation, explained variance, and level of significance are also shown.
3.5. Relationship between Tree Radial Growth and iWUE
In contrast to the continuous increase in iWUE, the radial growth of P. tabulaeformis presented phased characteristics. From 1645 to 1720, radial tree growth showed a downward trend, followed by an upward trend from 1721 to 1880, and then another downward trend. Correlation analysis showed that the iWUE series of P. tabulaeformis was significantly negatively correlated with the tree-ring STD chronology (r = −0.25, 1645–2011, p < 0.001) (Figure 8a). After 1850, the correlation between these two series was more significant, and the correlation coefficient reached −0.38. The correlation coefficient between the first-order difference of the iWUE and the first-order difference of the tree-ring STD chronology was very high, with r = −0.50 (n = 366, p < 0.001) (Figure 8b). To further clarify the relationship between the iWUE series and tree-ring STD chronology, a 31-year sliding correlation analysis was performed on the two series. Negative correlations were found between these two series starting in 1645 (Figure 8c). To verify the reliability of the correlations and avoid false correlations due to the opposite trends of the iWUE series and tree-ring STD chronology, we calculated the 31-year sliding correlation of the first-order difference between the two series and found that the two were also negatively correlated throughout the whole study period (Figure 8c). The above results showed that the increase in iWUE did not promote the radial growth of P. tabulaeformis in the study area. Theoretically, the increase in iWUE can stimulate radial tree growth, especially for trees growing in arid areas [39,53]. However, some studies have found that radial tree growth does not change due to the increase in iWUE. For example, Peñuelas et al. [50] studied 47 forest biomes around the world and found that the increase in iWUE did not promote radial tree growth in their study areas. A study on the iWUE of trees in Europe found that radial tree growth did not benefit from an increased iWUE regardless of whether the climate in the study area was dry or wet [60].
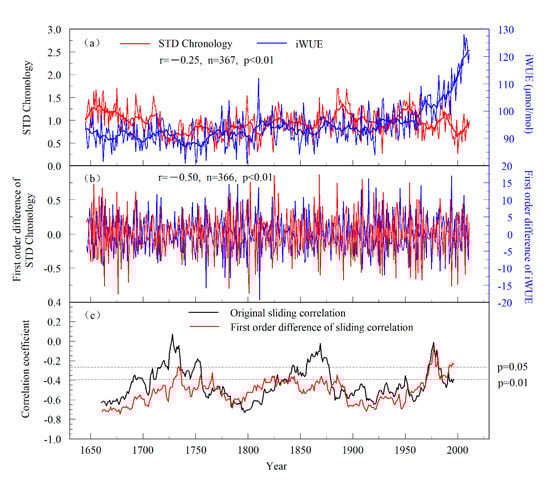
Figure 8.
(a) Comparisons between the iWUE and the tree-ring STD chronology (the thick line is an 11-year moving average series), (b) first-order difference series, and (c) the 31-year sliding correlations between the tree-ring STD chronology and the iWUE series in Mt. Shimen.
The increase in iWUE did not stimulate the radial growth of P. tabulaeformis. This is because the climate in the study area has shown a warming trend in recent decades; however, the rising temperature did not bring more precipitation with global climate change. Instead, the study area has displayed a continuous drying trend since 1860, causing the soil moisture to decrease, which limits tree growth in the area. In the context of warming and rising Ca, leaf stomatal conductance decreased, which had a positive impact on iWUE, but the increase in iWUE did not offset the negative impact of warming on tree growth in the study area, and P. tabulaeformis experienced a decline in growth. With a decrease in tree stomatal conductance, Ci did not decrease but showed an increasing trend (Figure 4a). However, tree radial growth did not increase with increasing Ci, which indicates that the decline in tree radial growth may be due to other factors in addition to the decrease in stomatal conductance. In fact, tree radial growth is influenced by many factors, such as nutrient limitations, changes in canopy structure, and adaptation to increasing atmospheric CO2 [61,62], some of which may play a coupling role between increased iWUE and the radial growth of trees.
4. Conclusions
In this study, an annual-resolution tree-ring δ13C and iWUE series of P. tabulaeformis was established for Mt. Shimen for the period of 1645 to 2011. The responses of tree-ring STD chronology and tree-ring Δ13C series to major climate factors showed that temperature was the main limiting factor affecting tree radial growth. The stable carbon isotopic fractionation of tree rings was mainly controlled by the average relative humidity from May to September. The iWUE showed a significant increasing trend during 1645–2011. The increase in atmospheric CO2 concentration was the main factor affecting the long-term variation in iWUE, and temperature had an important influence on the interannual variation in iWUE. P. tabulaeformis in the study area showed some adaptability to the continuous increase in Ca, as its carbon sequestration capacity was enhanced. Although the increasing CO2 concentration promoted the increase in iWUE, it did not produce a “fertilization effect” on the radial growth of trees and did not offset the negative effects of warming on tree growth in the study area. Our study is helpful for understanding the coupling relationship between water and the carbon cycle in forest ecosystems and provides a reference for forest management and future plantation breeding in arid areas.
Author Contributions
Data analysis, M.R. and Q.L.; writing—original draft and revising, M.R., Y.L., Q.L. and H.S.; methodology, M.R., Q.L. and Q.C.; investigation, Q.L., H.S., C.S., Q.C. and Y.L.; software, M.R. and C.S. All authors have read and agreed to the published version of the manuscript.
Funding
This research was funded by the National Natural Science Foundation of China (Nos. U1803245), the 2nd Tibetan Plateau Scientific Expedition and Research (2019QZKK0101), the National Natural Science Foundation of China (Nos. 41630531 and 32061123008), the Strategic Priority Research Program of the Chinese Academy of Sciences (No. XDB40000000), the State Key Laboratory of Loess and Quaternary Geology, Institute of Earth Environment, CAS (SKLLQG2022).
Institutional Review Board Statement
Not applicable.
Informed Consent Statement
Not applicable.
Data Availability Statement
Not applicable.
Conflicts of Interest
The authors declare no conflict of interest.
References
- FAO. Global Forest Resources Assessment 2020: Main Report; FAO: Rome, Italy, 2020. [Google Scholar]
- Li, P.; Zhu, J.; Hu, H.; Guo, Z.; Pan, Y.; Birdsey, R.; Fang, J. The relative contributions of forest growth and areal expansion to forest biomass carbon. Biogeosciences 2016, 13, 375–388. [Google Scholar] [CrossRef] [Green Version]
- Pennisi, E. Tropical forests store carbon despite warming. Science 2020, 368, 813. [Google Scholar] [CrossRef] [PubMed]
- Bonan, G.B. Forests and Climate Change: Forcings, Feedbacks, and the Climate Benefits of Forests. Science 2008, 320, 1444–1449. [Google Scholar] [CrossRef] [PubMed] [Green Version]
- Anderegg, W.R.L.; Trugman, A.T.; Badgley, G.; Anderson, C.M.; Bartuska, A.; Ciais, P.; Cullenward, D.; Field, C.B.; Freeman, J.; Goetz, S.J.; et al. Climate-driven risks to the climate mitigation potential of forests. Science 2020, 368, 1327. [Google Scholar] [CrossRef] [PubMed]
- Pan, Y.D.; Birdsey, R.A.; Fang, J.Y.; Houghton, R.; Kauppi, P.E.; Kurz, W.A.; Phillips, O.L.; Shvidenko, A.; Lewis, S.L.; Canadell, J.G.; et al. A Large and Persistent Carbon Sink in the World’s Forests. Science 2011, 333, 988–993. [Google Scholar] [CrossRef] [PubMed] [Green Version]
- Xu, B.; Arain, M.A.; Black, T.A.; Law, B.E.; Pastorello, G.Z.; Chu, H.S. Seasonal variability of forest sensitivity to heat and drought stresses: A synthesis based on carbon fluxes from North American forest ecosystems. Glob. Chang. Biol. 2020, 26, 901–918. [Google Scholar] [CrossRef] [Green Version]
- Du, H.B.; Liu, J.; Li, M.H.; Buntgen, U.; Yang, Y.; Wang, L.; Wu, Z.F.; He, H.S. Warming-induced upward migration of the alpine treeline in the Changbai Mountains, northeast China. Glob. Chang. Biol. 2018, 24, 1256–1266. [Google Scholar] [CrossRef]
- Wang, Z.G.; Wang, C.K. Tree Ecophysiological Responses to Elevated Carbon Dioxide Concentration. Terr. Ecosyst. Conserv. 2021, 1, 39–52. (In Chinese) [Google Scholar]
- Aakala, T.; Hari, P.; Dengel, S.; Newberry, S.L.; Mizunuma, T.; Grace, J. A prominent stepwise advance of the tree line in north-east Finland. J. Ecol. 2014, 102, 1582–1591. [Google Scholar] [CrossRef]
- Buntgen, U. Scrutinizing tree-ring parameters for Holocene climate reconstructions. Wires Clim. Chang. 2022, 13, e778. [Google Scholar] [CrossRef]
- Yang, B.; Qin, C.; Bräuning, A.; Osborn, T.J.; Trouet, V.; Ljungqvist, F.C.; Esperi, J.; Schneider, L.; Grießinger, J.; Büntgen, U.; et al. Long-term decrease in Asian monsoon rainfall and abrupt climate change events over the past 6,700 years. Proc. Natl. Acad. Sci. USA 2021, 118, e2102007118. [Google Scholar] [CrossRef] [PubMed]
- Li, Q.; Liu, Y.; Nakatsuka, T.; Liu, R.S.; Cai, Q.F.; Song, H.M.; Wang, S.J.; Sun, C.F.; Fang, C.X. Delayed warming in Northeast China: Insights from an annual temperature reconstruction based on tree-ring δ18O. Sci. Total Environ. 2020, 749, 141432. [Google Scholar] [CrossRef]
- Liu, Y.; Ren, M.; Li, Q.; Song, H.M.; Liu, R.S. Tree-ring δ18O based July–August relative humidity reconstruction on Mt. Shimen, China, for the last 400 years. Atmos Res. 2020, 243, 105024. [Google Scholar] [CrossRef]
- Lu, W.W.; Yu, X.X.; Guodong, J.I.A.; Hanzhi, L.I.; Ziqiang, L.I.U. Responses of Intrinsic Water-use Efficiency and Tree Growth to Climate Change in Semi-Arid Areas of North China. Sci. Rep. 2018, 8, 308. [Google Scholar]
- McCarroll, D.; Duffy, J.E.; Loader, N.J.; Young, G.H.F.; Davies, D.; Miles, D.; Ramsey, C.B. Are there enormous age-trends in stable carbon isotope ratios of oak tree rings? Holocene 2020, 30, 1637–1642. [Google Scholar] [CrossRef]
- Liu, Y.; Ta, W.Y.; Li, Q.; Song, H.M.; Sun, C.F.; Cai, Q.F.; Liu, H.; Wang, L.; Hu, S.L.; Sun, J.Y.; et al. Tree-ring stable carbon isotope-based April–June relative humidity reconstruction since AD 1648 in Mt. Tianmu, China. Clim. Dyn. 2018, 50, 1733–1745. [Google Scholar] [CrossRef]
- Li, Y.J.; Dong, Z.P.; Chen, D.L.; Zhao, S.Y.; Zhou, F.F.; Cao, X.G.; Fang, K.Y. Growth decline of Pinus Masson iana in response to warming induced drought and increasing intrinsic water use efficiency in humid subtropical China. Dendrochronologia 2019, 57, 125609. [Google Scholar] [CrossRef]
- Wang, Y.; Zhang, Y.; Fang, O.Y.; Shao, X.M. Long-term changes in the tree radial growth and intrinsic water-use efficiency of Chuanxi spruce (Picea likiangensis var. balfouriana) in southwestern China. J. Geogr. Sci. 2018, 28, 833–844. [Google Scholar] [CrossRef] [Green Version]
- Liu, X.H.; Wang, W.Z.; Xu, G.B.; Zeng, X.M.; Wu, G.J.; Zhang, X.W.; Qin, D.H. Tree growth and intrinsic water-use efficiency of inland riparian forests in northwestern China: Evaluation via δ13C and δ18O analysis of tree rings. Tree Physiol. 2014, 34, 966–980. [Google Scholar] [CrossRef] [Green Version]
- Liu, Y.; Wang, L.; Li, Q.; Cai, Q.F.; Song, H.M.; Sun, C.F.; Liu, R.S.; Mei, R.C. Asian summer monsoon-related relative humidity record by tree-ring δ18O during last 205 years. J. Geophys. Res. Atmos. 2019, 124, 9824–9838. [Google Scholar] [CrossRef]
- Chen, Y.; Li, Y.Q.; Wang, X.Y.; Yao, C.P.; Niu, Y.Y. Risk and countermeasures of global change in ecologically vulnerable regions of China. J. Desert Res. 2022, 42, 148–158. (In Chinese) [Google Scholar]
- Yi, C.W. Causes and prevention countermeasures of “8·8” mountain flood debris flow in Zhouqu County. Soil Water Conserv. China 2011, 3, 24–26. (In Chinese) [Google Scholar]
- Liu, Y.; Song, H.M.; An, Z.S.; Sun, C.F.; Trouet, V.; Cai, Q.F.; Liu, R.S.; Leavitt, S.W.; Song, Y.; Li, Q.; et al. Recent anthropogenic curtailing of Yellow River runoff and sediment load is unprecedented over the past 500 y. Proc. Natl. Acad. Sci. USA 2020, 117, 18251–18257. [Google Scholar] [CrossRef] [PubMed]
- Lewis, S.L.; Wheeler, C.E.; Mitchard, E.T.A.; Koch, A. Regenerate natural forests to store carbon. Nature 2019, 568, 25–28. [Google Scholar] [CrossRef] [PubMed]
- Brodrick, P.G.; Anderegg, L.D.L.; Asner, G.P. Forest Drought Resistance at Large Geographic Scales. Geophys. Res. Lett. 2019, 46, 2752–2760. [Google Scholar] [CrossRef] [Green Version]
- Cui, L.L.; Liu, Y.; Li, Q.; Song, H.M.; Fang, C.X. A July–August relative humidity record in North China since 1765 AD reconstructed from tree-ring cellulose δ18O. Int. J. Biometeorol. 2021, 65, 905–915. [Google Scholar] [CrossRef]
- Tao, Q.; Zhang, Q.; Chen, X. Tree-ring reconstructed diurnal temperature range on the eastern Tibetan plateau and its linkage to El Nio-Southern Oscillation. Int. J. Climatol. 2020, 41, 1696–1711. [Google Scholar] [CrossRef]
- Chen, F.; Yuan, Y.J. May–June maximum temperature reconstruction from mean earlywood density in North Central China and its linkages to the summer monsoon activities. PLoS ONE 2014, 9, e107501. [Google Scholar] [CrossRef] [Green Version]
- Zeng, Q.; Rossi, S.; Yang, B. Effects of Age and Size on Xylem Phenology in Two Conifers of Northwestern China. Front. Plant Sci. 2017, 8, 2264. [Google Scholar] [CrossRef]
- Cook, E.R.; Kairiukstis, L.A. Methods of Dendrochronology: Applications in the Environmental Sciences; International Institute for Applied Systems Analysis. Kluwer Academic Publishers: Dordrecht, The Netherlands, 1990; pp. 1–394. [Google Scholar]
- Holmes, R.L. Computer-assisted quality control in tree-ring dating and measurement. Tree-Ring Bull 1983, 43, 69–78. [Google Scholar]
- Cook, E.R. A Time-Series Analysis Approach to Tree-Ring Standardization. Ph.D. Thesis, The University of Arizona, Tucson, AZ, USA, 1985. [Google Scholar]
- Song, H.M.; Liu, Y.; Li, Q.; Gao, N.; Ma, Y.Y.; Zhang, Y.H. Tree-ring based May–July temperature reconstruction since AD 1630 on the western Loess Plateau, China. PLoS ONE 2014, 9, e93504. [Google Scholar] [CrossRef] [PubMed] [Green Version]
- Feng, X.H. Trends in intrinsic water-use efficiency of natural trees for the past 100–200 years: A response to atmospheric CO2 concentration. Geochim. Cosmochim. Acta 1999, 63, 1891–1903. [Google Scholar] [CrossRef]
- Xu, G.B.; Liu, X.H.; Belmecheri, S.; Chen, T.; Wu, G.J.; Wang, B.; Zeng, X.M.; Wang, W.Z. Disentangling Contributions of CO2 Concentration and Climate to Changes in Intrinsic Water-Use Efficiency in the Arid Boreal Forest in China’s Altay Mountains. Forests 2018, 9, 642. [Google Scholar] [CrossRef] [Green Version]
- Leavitt, S.W.; Lara, A. South American tree rings show declining δ13C trend. Tellus B 1994, 46, 152–157. [Google Scholar] [CrossRef]
- Freyer, H.D. On the 13C record in tree rings. Part II. Registration of microenvironmental CO2 and anomalous pollution effect. Tellus 1979, 31, 308–312. [Google Scholar]
- Yang, T.; Yang, B.; Boucher, É.; Rossi, S. How did climate and CO2 concentration affect intrinsic water-use effciency and tree growth in a semi-arid region of China? Trees 2021, 35, 769–781. [Google Scholar] [CrossRef]
- Liu, Y.; Ma, L.M.; Cai, Q.F.; An, Z.S.; Liu, W.G.; Gao, L.Y. Reconstruction of summer temperature (June–August) at Mt. Helan, China, from tree-ring stable carbon isotope values since AD 1890. Sci. China Ser. D Earth Sci. 2002, 45, 1127–1136. [Google Scholar] [CrossRef]
- McCarroll, D.; Loader, N.J. Stable isotopes in tree rings. Quat. Sci. Rev. 2004, 23, 771–801. [Google Scholar] [CrossRef]
- Farquhar, G.D.; O’Leary, M.H.; Berry, J.A. On the relationship between carbon isotope discrimination and the intercellular carbon dioxide concentration in leaves. Aust. J. Plant Physiol. 1982, 9, 121–137. [Google Scholar] [CrossRef]
- Coplen, T.B. Discontinuance of SMOW and PDB. Nature 1995, 375, 285. [Google Scholar] [CrossRef]
- Fu, L.; Xu, Y.; Xu, Z.H.; Wu, B.; Zhao, D. Tree water use efficiency and growth dynamics in response to climatic and environmental changes in a temperate forest in Beijing, China. Environ. Int. 2020, 134, 105209. [Google Scholar] [CrossRef] [PubMed]
- Linares, J.C.; Camarero, J.J. From pattern to process: Linking intrinsic water-use efficiency to drought-induced forest decline. Glob. Chang. Biol. 2012, 18, 1000–1015. [Google Scholar] [CrossRef]
- Dai, A.; Trenberth, K.E.; Qian, T. A global data set of Palmer Drought Severity Index for 1870–2002: Relationship with soil moisture and effects of surface warming. J. Hydrometeorol. 2004, 5, 1117–1130. [Google Scholar] [CrossRef]
- Liu, Y.; Wang, R.Y.; Leavitt, S.W.; Song, H.M.; Linderholm, H.W.; Li, Q.; An, Z.S. Individual and pooled tree-ring stable-carbon isotope series in Chinese pine from the Nan Wutai region, China: Common signal and climate relationships. Chem. Geol. 2012, 330, 17–26. [Google Scholar] [CrossRef]
- Liu, Y.; Ma, L.M.; Leavitt, S.W.; Cai, Q.F.; Liu, W.G. A preliminary seasonal precipitation reconstruction from tree-ring stable carbon isotopes at Mt. Helan, China, since AD 1804. Glob. Planet Chang. 2004, 41, 229–239. [Google Scholar] [CrossRef]
- Liu, Y.; Wu, Z.D.; Leavitt, S.W.; Hughes, M.K. Stable carbon isotope in tree rings from Huangling, China and climatic variation. Sci. China Ser. D Earth Sci. 1996, 39, 152–161. [Google Scholar]
- Peñuelas, J.; Canadell, J.G.; Ogaya, R. Increased water-use efficiency during the 20th century did not translate into enhanced tree growth. Global Ecol. Biogeogr. 2011, 20, 597–608. [Google Scholar] [CrossRef]
- Brienen, R.J.W.; Wanek, W.; Hietz, P. Stable carbon isotopes in tree rings indicate improved water use efficiency and drought responses of a tropical dry forest tree species. Trees 2011, 25, 103–113. [Google Scholar] [CrossRef] [Green Version]
- Waterhouse, J.S.; Switsur, V.R.; Barker, A.C.; Carter, A.H.C.; Hemming, D.L.; Loader, N.J.; Robertson, I. Northern European trees show a progressively diminishing response to increasing atmospheric carbon dioxide concentrations. Quat. Sci. Rev. 2004, 23, 803–810. [Google Scholar] [CrossRef]
- Saurer, M.; Siegwolf, R.T.W.; Schweingruber, F.H. Carbon isotope discrimination indicates improving water-use efficiency of trees in northern Eurasia over the last 100 years. Glob. Chang. Biol. 2004, 10, 2109–2120. [Google Scholar] [CrossRef]
- Werner, C.; Meredith, L.K.; Ladd, S.N.; Ingrisch, J.; Kubert, A.; van Haren, J.; Bahn, M.; Bailey, K.; Bamberger, I.; Beyer, M.; et al. Ecosystem fluxes during drought and recovery in an experimental forest. Science 2021, 374, 1514–1518. [Google Scholar] [CrossRef]
- Rigden, A.J.; Salvucci, G.D. Stomatal response to humidity and CO2 implicated in recent decline in U.S. evaporation. Glob. Chang. Biol. 2016, 23, 1140–1151. [Google Scholar] [CrossRef] [PubMed]
- Betts, R.A.; Boucher, O.; Collins, M.; Cox, P.M.; Falloon, P.D.; Gedney, N.; Hemming, D.L.; Huntingford, C.; Jones, C.D.; Sexton, D.M.H.; et al. Projected increase in continental runoff due to plant responses to increasing carbon dioxide. Nature 2007, 448, 1037–1041. [Google Scholar] [CrossRef] [PubMed]
- Ainsworth, E.A.; Rogers, A. The response of photosynthesis and stomatal conductance to rising CO2: Mechanisms and environmental interactions. Plant Cell Environ. 2007, 30, 258–270. [Google Scholar] [CrossRef] [PubMed]
- Lu, K.L.; Chen, N.; Zhang, X.W.; Wang, J.R.; Wang, M.H.; Khan, S.; Han, C.; Zhang, C.K.; Wang, S.Y.; Wang, L.N.; et al. Increased drought and atmospheric CO2 positively impact intrinsic water use efficiency but do not promote tree growth in semi-arid areas of northwestern China. Trees 2019, 33, 669–679. [Google Scholar] [CrossRef]
- Guo, G.Y. Investigations of Tree-Ring Growths and Stable Isotopes in Fuzhou–Taking the Pinus massoniana of Yongtai County as Example. Master’s Thesis, Fujian Normal University, Fujian, China, 2018. (In Chinese). [Google Scholar]
- Lévesque, M.; Siegwolf, R.; Saurer, M.; Eilmann, B.; Rigling, A. Increased water-use efficiency does not lead to enhanced tree growth under xeric and mesic conditions. New Phytol. 2014, 203, 94–109. [Google Scholar] [CrossRef] [Green Version]
- Gong, X.Y.; Ma, W.T.; Yu, Y.Z.; Fang, K.; Yang, Y.; Tcherkez, G.; Adams, M.A. Overestimated gains in water-use efficiency by global forests. Global Chang. Biol. 2022, 28, 4923–4934. [Google Scholar] [CrossRef]
- McCarthy, H.R.; Oren, R.; Finzi, A.; Johnsen, K.H. Canopy leaf area constrains [CO2]-induced enhancement of productivity and partitioning among aboveground carbon pools. Proc. Natl. Acad. Sci. USA 2007, 103, 19356–19361. [Google Scholar] [CrossRef] [PubMed] [Green Version]
Publisher’s Note: MDPI stays neutral with regard to jurisdictional claims in published maps and institutional affiliations. |
© 2022 by the authors. Licensee MDPI, Basel, Switzerland. This article is an open access article distributed under the terms and conditions of the Creative Commons Attribution (CC BY) license (https://creativecommons.org/licenses/by/4.0/).