Article

Limited Effects of Precipitation Manipulation on Soil Respiration and Inorganic N Concentrations across Soil Drainage Classes in Northern Minnesota Aspen Forests

by
Anna B. Stockstad
1,*,
Robert A. Slesak
2,
Alan J. Toczydlowski
1,
Charles R. Blinn
1,
Randall K. Kolka
3 and
Stephen D. Sebestyen
3
1
Department of Forest Resources, University of Minnesota—Twin Cities, St. Paul, MN 55108, USA
2
Pacific Northwest Research Station, USDA Forest Service, Olympia, WA 98512, USA
3
Northern Research Station, USDA Forest Service, Grand Rapids, MN 55744, USA
*
Author to whom correspondence should be addressed.
Forests 2022, 13(8), 1194; https://doi.org/10.3390/f13081194
Submission received: 7 June 2022 / Revised: 20 July 2022 / Accepted: 27 July 2022 / Published: 28 July 2022
(This article belongs to the Special Issue Biogeochemical Cycling in Forest Ecosystems)

Abstract

:
It is critical to gain insight into the responses of forest soils to the changing climate. We simulated future climate conditions with growing season throughfall reduction (by 50%) and winter snow removal using a paired-plot design across a soil drainage class gradient at three upland, Populus-dominated forests in northern Minnesota, USA. In situ bulk soil respiration and concentrations of extractable soil N were measured during the summers of 2020–2021. Soil respiration and N concentrations were not affected by throughfall reduction and snow removal, which was largely attributed to the limited treatment effects on soil moisture content and soil temperature. Drainage class was only a significant factor during the spring thaw period in 2021. During this period, the poorly drained plots had lower respiration rates compared to the well-drained plots, which was associated with the drainage class effects on soil temperature. The results of the companion laboratory incubation with varying levels of soil moisture also indicated no effect of the treatment on soil respiration, but effects of drainage class and moisture content on respiration were observed. Our results indicate that the combined effects of reduced summer and winter precipitation on soil respiration and N dynamics may be limited across the range of conditions that occurred in our study.

1. Introduction

Forest soils are a major component of carbon (C) and nitrogen (N) cycling, both within upland forest ecosystems and globally [1,2,3]. Soil respiration is the main pathway for the release of plant-fixed carbon dioxide (CO2) back to the atmosphere either through root (autotrophic) respiration or the decomposition of soil organic matter by microbes (heterotrophic respiration) [3,4]. N commonly limits growth in upland forest ecosystems as it is an essential macronutrient [1,5]. Microbes and fungi influence the transformation and efflux of C and N in soils, and these factors are largely controlled by climate effects on soil moisture and temperature [1,6,7,8]. Since forest soils store large amounts of C (as well as N), understanding forest biogeochemical cycling under a changing climate is critical for the development of forest management strategies [1,2].
Changes in summer and winter precipitation as well as changes to winter frost dynamics are likely to alter the cycling and flux of C and N from soil [8,9,10,11]. For the Laurentian Mixed Forest Province in northern Minnesota, climate modeling by Handler et al. (2014) projected a slight decrease in total precipitation by 2100, with the largest decline (40 percent) occurring during the summer [12]. Additionally, by the end of the century, winter temperatures are projected to increase by an additional 3–7 °C and more winter precipitation will occur as rain instead of snow [12]. These regional climate change predictions are similar to those for other northern latitudes [12,13].
In northern ecosystems, snowpack serves as an insulative layer over the soil surface, influencing both the soil temperature and frost depth [14]. Decreased snowpack, and thus greater frost depth, have been correlated with decreased net heterotrophic respiration from forest soils [1,8,15]. Increased soil frost reduces soil respiration into the growing season due to extended periods of colder soil temperature and its suppression of biologic activity [16]. With regard to N, Fitzhugh et al. (2001) found that inorganic N concentrations increased following freezing events, and N leaching subsequently increased, similar to the others [17,18]. Increased frost depth may increase N mineralization and nitrification rates due to higher amounts of microbial and root mortality and the disruption of soil aggregates [17].
In the summer, declines in soil moisture associated with reduced rainfall or enhanced evapotranspiration in a warmer climate may cause decreases in microbial activity and root respiration if the soil moisture becomes limiting to biologic activity [9,10]. Past studies have used throughfall reduction, where a percentage of precipitation below the canopy is diverted from experimental plots to approximate the effects of reduced precipitation in the future. In a throughfall reduction study in Massachusetts, USA, Borken et al. (2006) found that complete throughfall exclusion significantly decreased the bulk soil respiration by 10–30% compared to ambient conditions [10]. Additionally, Schindlbacher et al. (2012) found that reductions in the bulk soil respiration due to complete throughfall exclusion offset concurrent increases in the bulk soil respiration due to soil warming [9]. The influence of throughfall reduction on N dynamics, however, is not as clearly understood due to the complexity of N cycling in soils. For example, throughfall reduction has been shown to increase extractable ammonium concentrations but decrease extractable nitrate concentrations, with no discernable effect on the total N supply [19]. It is possible that N supply in soil may not be as sensitive to changes in the soil moisture compared to the soil C fluxes. In a meta-analysis of global N dynamics, Deng et al. (2021) found that drought had no significant effect on the total N concentrations in forest ecosystems [20]. However, as with the above, the extractable ammonium increased under drought conditions, and the extractable N decreased [20].
Drainage class is likely to be an important factor when considering fluctuations in soil moisture and frost associated with climate change and the related effects on C and N dynamics. In the field, soil texture and landscape position create differences in the soil drainage or wetness, which is classified by depth to redoximorphic features (i.e., mottling, gleying) [21]. Soil aeration, relative moisture supply, and potential rooting depth are all influenced by drainage class [22]. As a result of these variations in soil moisture, microbial communities and their activity may also vary with drainage class. For example, the rates of soil respiration versus methanogenesis differ with drainage class due to variations in moisture levels [23]. The effects of reduced rainfall and snowpack may vary by drainage class in forest soils, but we are not aware of any studies to evaluate such an effect.
Paired-plot experiments, with either snow removal or throughfall exclusion treatments compared to an ambient control, have been used to investigate the response of forest soil C and N fluxes to changes in seasonal precipitation [8,9,10,11,16,17,24]. However, no studies have combined snow removal and throughfall reduction treatments in one experiment. Applying the two treatments seasonally on the same plot allows for a more representative simulation of future precipitation patterns for the North-Central USA, as projected by climate models. We aim to bridge the gap between existing snow removal and throughfall reduction experiments to better understand the future of aspen forests in Minnesota under a changing climate. Our primary objective was to quantify the influence of combined throughfall exclusion and snow removal on soil respiration and N cycling, and to provide a more comprehensive assessment of the combined seasonal effects of climate change on forest soil biogeochemistry.

2. Materials and Methods

2.1. Study Area

The study included three sites located in Aitkin, Itasca, and St. Louis counties within the Laurentian Mixed Forest Province (LMFP) in northern Minnesota, USA (Table 1). All sites were located in the LMFP and dominated by upland quaking aspen (Populus tremuloides Michx.) in the forest canopy with beaked hazel (Corylus cornuta), willow (Salix spp.), or speckled alder (Alnus incana) in the understory. Mean summer (June–August) and winter temperatures for this region are 18 °C and −12 °C, respectively (Handler et al., 2014). The average precipitation in LMFP during the summer is 305 mm, and the average snowfall ranges from 1016 mm to 1778 mm [12].

2.2. Site Characteristics

Mature quaking aspen (40–60 years) dominated the overstory canopy at all sites. Loamy soils occurred on relatively flat topography (less than 10% slope; Table 1). Plot locations within the target drainage classes (well-drained through poorly drained) were identified based on depth to redoximorphic features (Table 1). Drainage classes were defined as >102 cm to redoximorphic features (well-drained, WD), 51–101 cm (moderately well drained, MWD), 26–50 cm (somewhat-poorly drained, SPD), and 0–25 cm (poorly drained, PD) [25].

2.3. Experimental Design

The study occurred from May 2018 until May 2022. We used a paired-plot, 4 × 2 factorial design with Factor 1 being drainage class and Factor 2 being treatment (precipitation manipulation or control conditions). Treatments were replicated across the three sites, with each site containing eight 4 × 4-m plots across the four drainage classes for a total of twenty-four plots across all three sites (three replications per drainage class × treatment combination). The paired treatment and control plots (ambient conditions) were located adjacent to each other within each drainage class. Within each plot, treatments included both snow removal during the winter (Supplementary Materials Figure S1) and throughfall reduction during the growing season (Supplementary Materials Figure S2).

2.4. Snow Removal Treatment

Snow was removed from the treatment plots during the winter according to the method developed by Friesen et al. (2021) [24]. To allow for snow removal without impacting the soil surface, gray aluminum window screening (Phifer Incorporated, Tuscaloosa, AL, USA) was placed over the entire treatment plot area prior to the first snowfall. Screens were not placed within the control plots. Shrubs and other woody stems were cut annually prior to screen placement in both the control and treatment. Snow was cleared manually and was always cleared and deposited away from the control plot to limit any possible disturbance of the experimental control. Snow was cleared after every event of 5 cm or more, or at least weekly.

2.5. Throughfall Reduction Treatment

Throughfall reduction shelters were installed during the growing season to simulate a 50% reduction in throughfall similar to the design implemented by Yahdjian and Sala (2002) [26]. The shelters were guttered with 10.16 cm wide, U-shaped white vinyl gutters that extended 40 cm past the plot boundary. The ridgeline of the A-frame shelter ran along a north–south transect so that the panels were situated on an east–west transect to avoid warming created by a south-facing panel. Control plots were left as an experimental reference and did not receive any precipitation reduction treatment. To assess the treatment efficacy, the volume of throughfall in plots was measured biweekly during the growing season of 2021 using 20.3 cm funnels attached to glass jars that were placed in each quadrant of the moderately drained plots at each site (n = 4 collectors per plot and site).

2.6. Soil Moisture, Soil Temperature, and Air Temperature Measurements

Soil temperature and moisture were measured every 15 min throughout the study at depths of 10, 20, 30, 40, and 60 cm via Decagon 5 TM sensors (±0.1 °C, ±0.08 m3 m−3 SWC; METER Group, Pullman, WA, USA). Sensors were installed in a cluster at the center of the plots (Supplementary Materials Figures S2 and S3) and connected to EM50 dataloggers (METER Group). Air temperature was recorded in control plots every 90 min with Thermochron iButton sensors (±0.5 °C; Maxim Integrated Products, Inc., Sunnyvale, CA, USA) enclosed in a PVC solar shield.

2.7. In Situ Measurements of Bulk Soil Respiration

Bulk soil respiration (μmol m−2 s−1) was measured biweekly during the growing season of 2020 (late June–September 2020) and 2021 (April–September 2021). Fluxes of CO2 were measured with a LI-COR LI-8100 Automated Soil CO2 Flux System, which was calibrated three times (LI-COR Biosciences, Lincoln, NE, USA). Collars made of PVC with a diameter of 20 cm were installed at a depth of 1.5–5 cm two weeks prior to the first measurement. Measurements of CO2 concentrations within the chamber were taken over a two-minute period with a forty-five second post-purge. The soil surface temperature at the time of measurement was measured with a Procheck Handheld soil water content and temperature probe (METER Group, Pullman, WA, USA).

2.8. Extractable Soil N

A sequential core technique was used to assess N availability during the growing seasons of 2020 and 2021, with cores being deployed at the same time as each growing season and then sequentially extracted over consecutive months. Four PVC tubes (25 cm long and 5 cm diameter) were hammered 20 cm into the soil along a transect in each plot. One core was removed from each plot each month. Ten gram samples from each depth (0–5 cm, 5–20 cm) were separated after cutting crosswise and homogenizing, and then stored in a refrigerator overnight prior to extraction. The remaining soil was oven-dried at 105 °C for twenty-four hours to calculate the gravimetric water content in the samples. The 10 g samples were then combined with 40.0 mL of a 2.0 mol/L potassium chloride (KCl) solution, shaken for one hour (via shaker table), and chilled for one hour at 1.7–3.9 °C to limit any additional reactions within the slurry. Soil slurries were then filtered (Whatman 42 filter paper) using gravity filtration into plastic 20 mL sample vials, and frozen until analysis. Samples were analyzed for ammonium (NH4+), nitrate + nitrite (NO3 + NO2-N), and total N (TN) concentrations (ppm) using a Lachat Quickchem 8500 Flow Injection Analysis System (Hach, Loveland, CO, USA) in the USDA Forest Service Northern Research Station chemistry laboratory in Grand Rapids, Minnesota. Following analysis, the concentrations were corrected for soil mass (adjusted based on oven dried mass) and converted to units of milligrams per kilogram of soil.

2.9. Laboratory Incubation

A laboratory incubation of field soils was used to determine the effect of varying moisture levels on heterotrophic soil respiration under a controlled environment. Four subsamples of soil were collected at the end of the experiment from each plot to a depth of 15 cm and combined to produce a bulk soil sample for each of the twenty-four plots. The bulk soil samples were air-dried for one month and then sieved through a 2 mm mesh. Three 10.0 g subsamples of soil were taken from each bulk soil sample for each combination of site, drainage class, and treatment (n = 72). Each subsample received one of three levels of moisture manipulation to establish a moisture gradient during the incubation: 2.5 mL, 5.0 mL, or 7.5 mL of deionized water.
Soils were then incubated for fourteen days in 237 mL glass jars inside a 20 °C growth chamber in the absence of light. The lids remained sealed during the incubation, but the jars were opened every three days for three minutes to maintain an aerobic environment. Two HOBO U23-002 temperature loggers (±0.2 °C; Onset Computer Corporation, Bourne, MA, USA) were placed within the growth chamber and recorded the air temperature every fifteen minutes (one on the top shelf and one on the bottom shelf). The average temperature for the top shelf was 20.4 °C ± 0.05 °C and 19.9 °C ± 0.144 °C for the bottom shelf.
Three days prior to sampling, the vials were evacuated using ultra high purity helium (He). Gas samples (12 mL) were collected on the seventh and fourteenth days of the incubation. To begin, jars were opened and allowed to equilibrate with the atmosphere. After 90 s, a time-zero (T0) gas sample was taken to represent ambient conditions. Gas samples were immediately transferred with a needle from the syringe to 9 mL glass vials sealed with butyl rubber septa. Following the T0 measurement, jars were resealed with a lid and septa and allowed to incubate for 1 h. Gas samples were then taken from each jar after 1 h (T1) through the septa and immediately transferred to the vials. Gas samples were analyzed within 24 h using a gas chromatograph (Model 5890, Agilent/Hewlett-Packard, Santa Clara, CA, USA) in conjunction with an autosampler (Tekmar 7000, Teledyne Tekmar, Mason, OH, USA). The gas chromatograph was equipped with a thermal conductivity detector for CO2. Fluxes (μg g−1 h−1) of CO2 were calculated from the T0 and T1 measurements.

2.10. Data Analysis

Repeated measures, linear mixed effect models were used to evaluate the influence of drainage class, treatment, and time on the soil water content (SWC), soil temperature, soil respiration, and extractable N concentrations. For the SWC and soil temperature, the analysis was constrained to the growing season (May–September/October 2019–2021) to focus on the effects of the throughfall reduction treatment, which was expected to have the most influence on the soil respiration and extractable N. For the soil incubation, drainage class, treatment, moisture content, and time were used as factors in repeated measures, mixed effect models. Site (block) was included as a random effect in all models. Soil temperature, pre-treatment C (%), and clay content (%) were included as covariates in the model of soil respiration. Pre-treatment N (%) and clay content were also included as covariates in the NH4+, NO3 + NO2-N, and TN models.
The mixed effect model analysis with repeated measures was performed using the R package “nlme” [27]. Autocorrelation matrices (corAR1 function) were included in the models to account for temporal correlation in the data [27]. For all analyses, each year was run separately. The least square means analysis with the Tukey p-value adjustment was performed when significant effects were found by using the “lsmeans” package in R [28].
The datasets were checked for outliers using plots of residuals and boxplots. The only dataset with outliers that skewed the distribution were in the extractable N dataset from 2021. Extreme outliers were assumed to be from sample contamination and were removed from the dataset. Plots of standardized residuals and quantile–quantile (Q–Q) plots were used to visually validate the assumptions of normality, linearity, constant variance, and independence. The respiration fluxes were transformed using a natural logarithm to correct for non-normality. The CO2 values from the incubation were also log-transformed to correct for non-normality. The quantile–quantile plots and plots of the standardized residuals were used to identify the best transformation of the dependent variable. If transformed to meet the assumptions of linear models, the least square means and confidence intervals are presented as back-transformed values in the figures.
All of the statistical analyses and data visualizations were performed using R statistical software in RStudio (RStudio Version 1.1.463, Boston, MA, USA). The level of significance (alpha) was defined as a p-value < 0.05.

3. Results

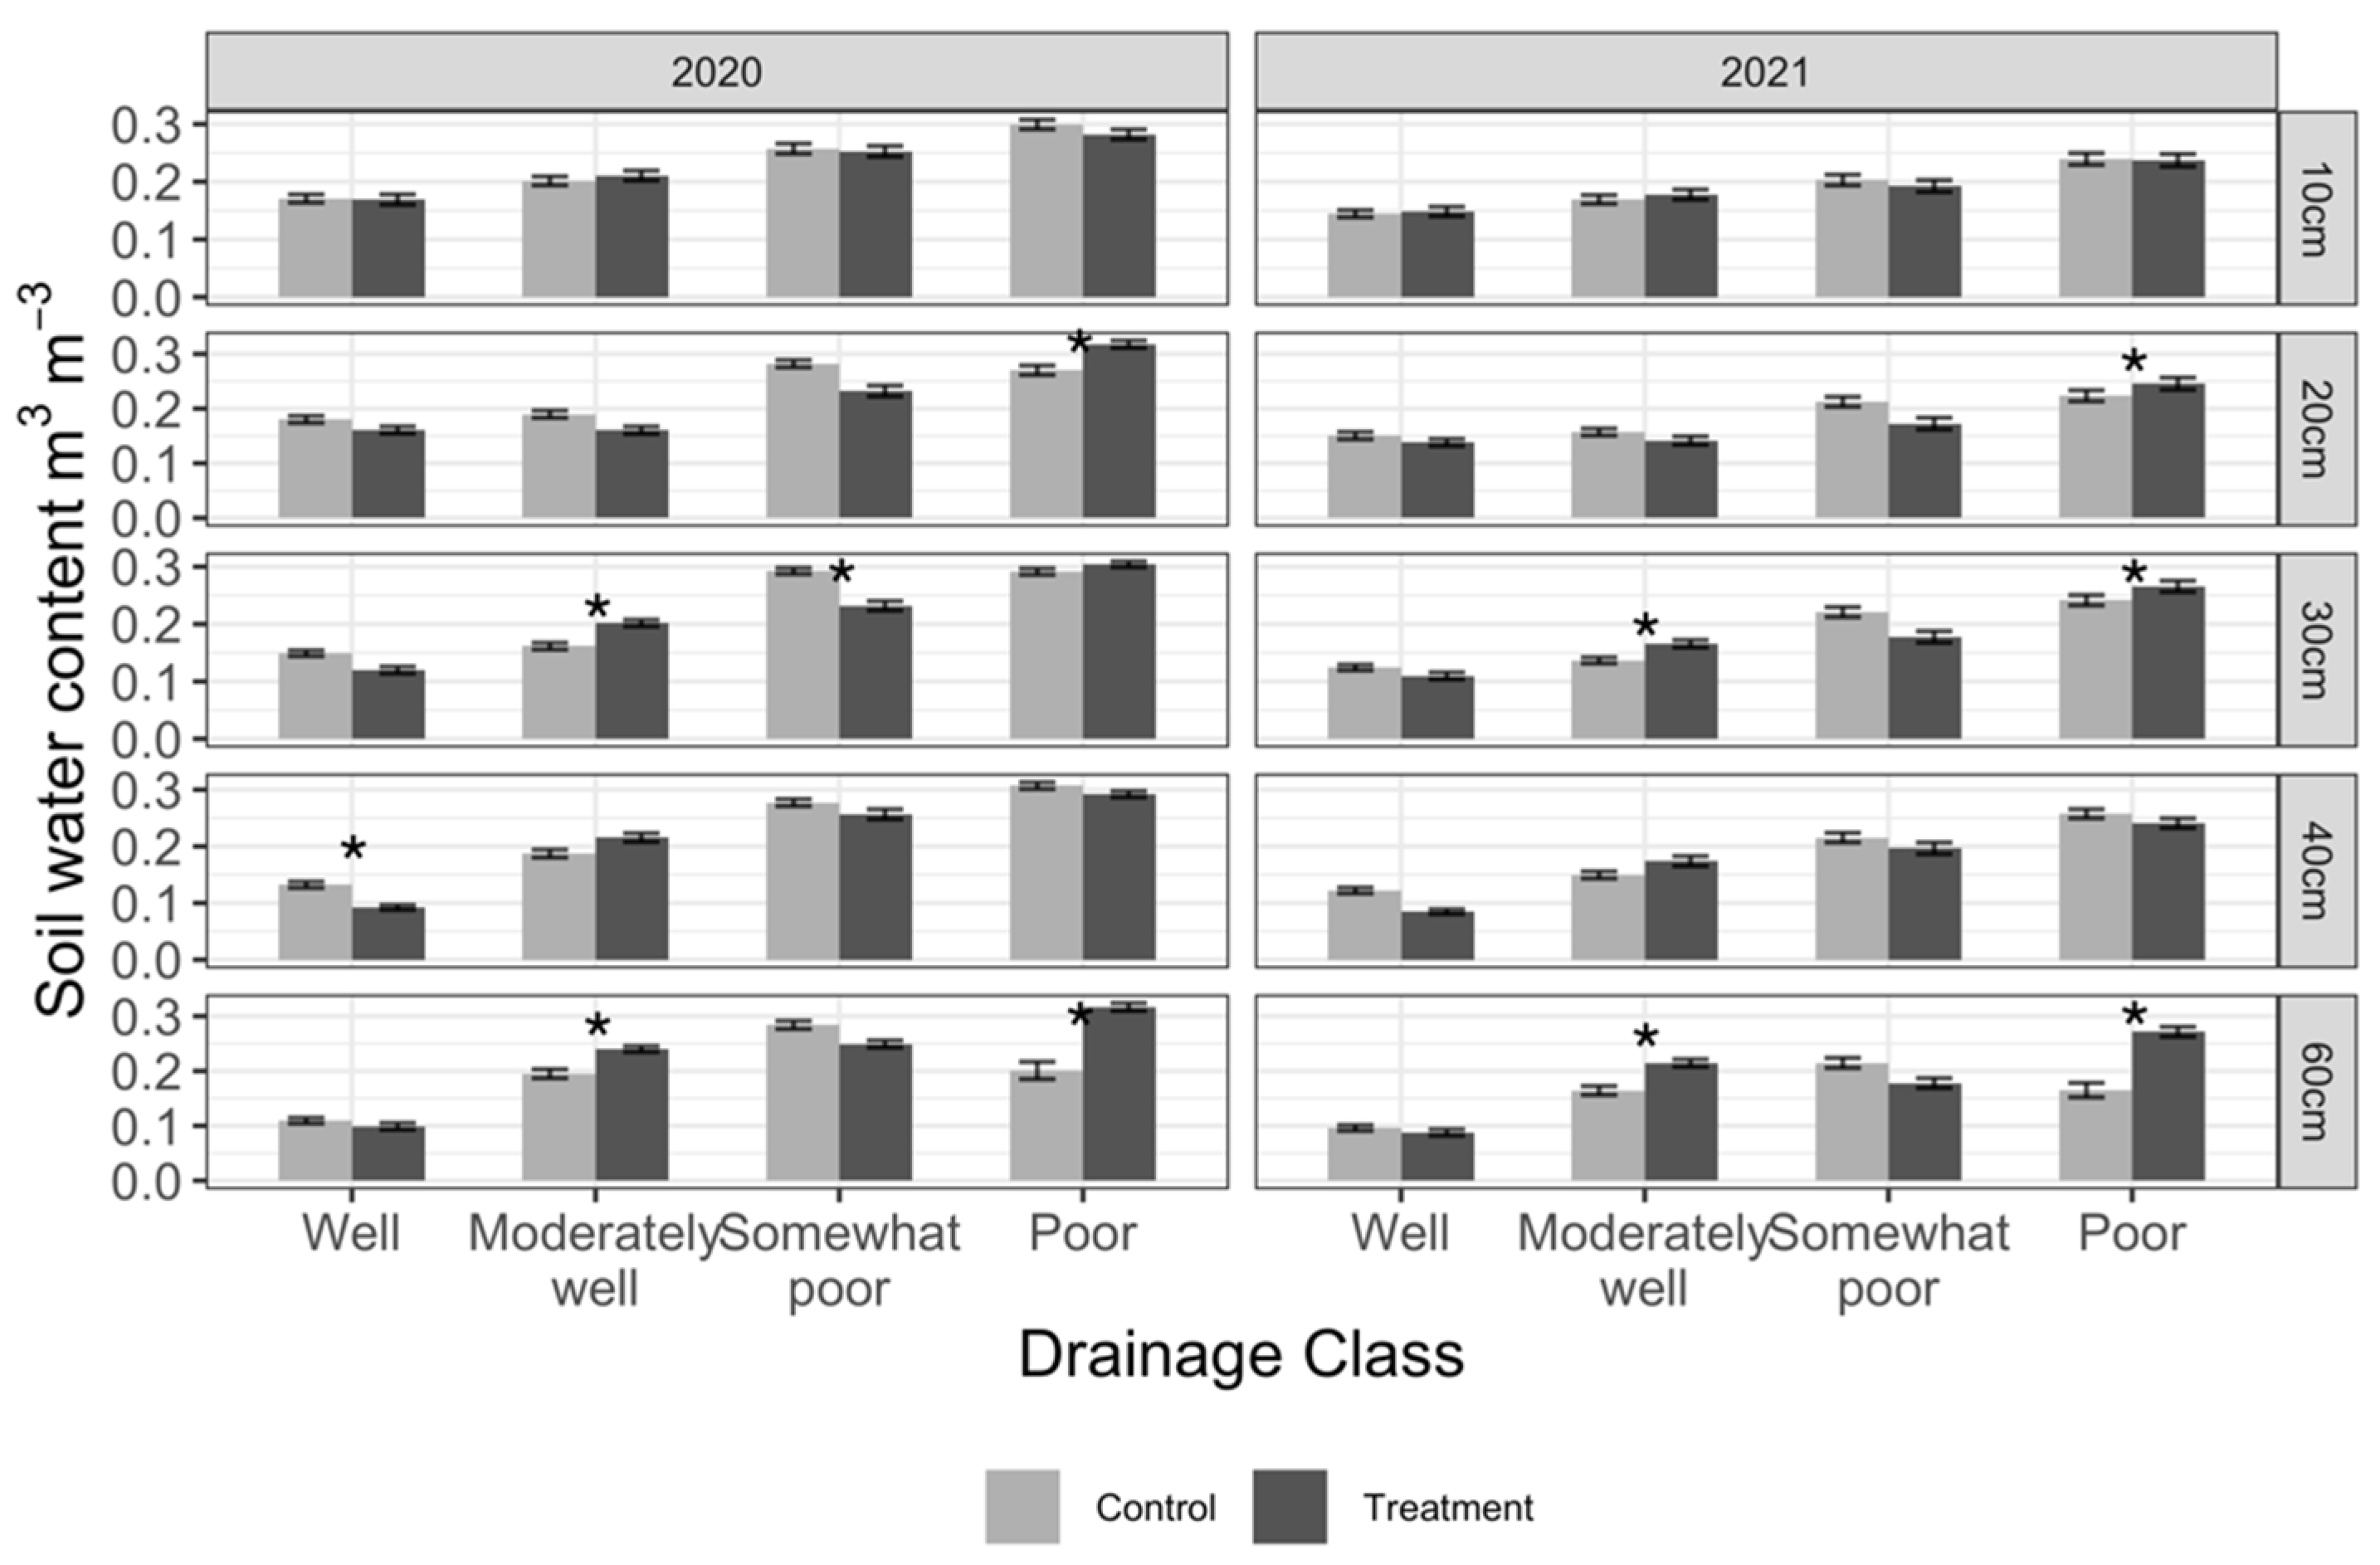
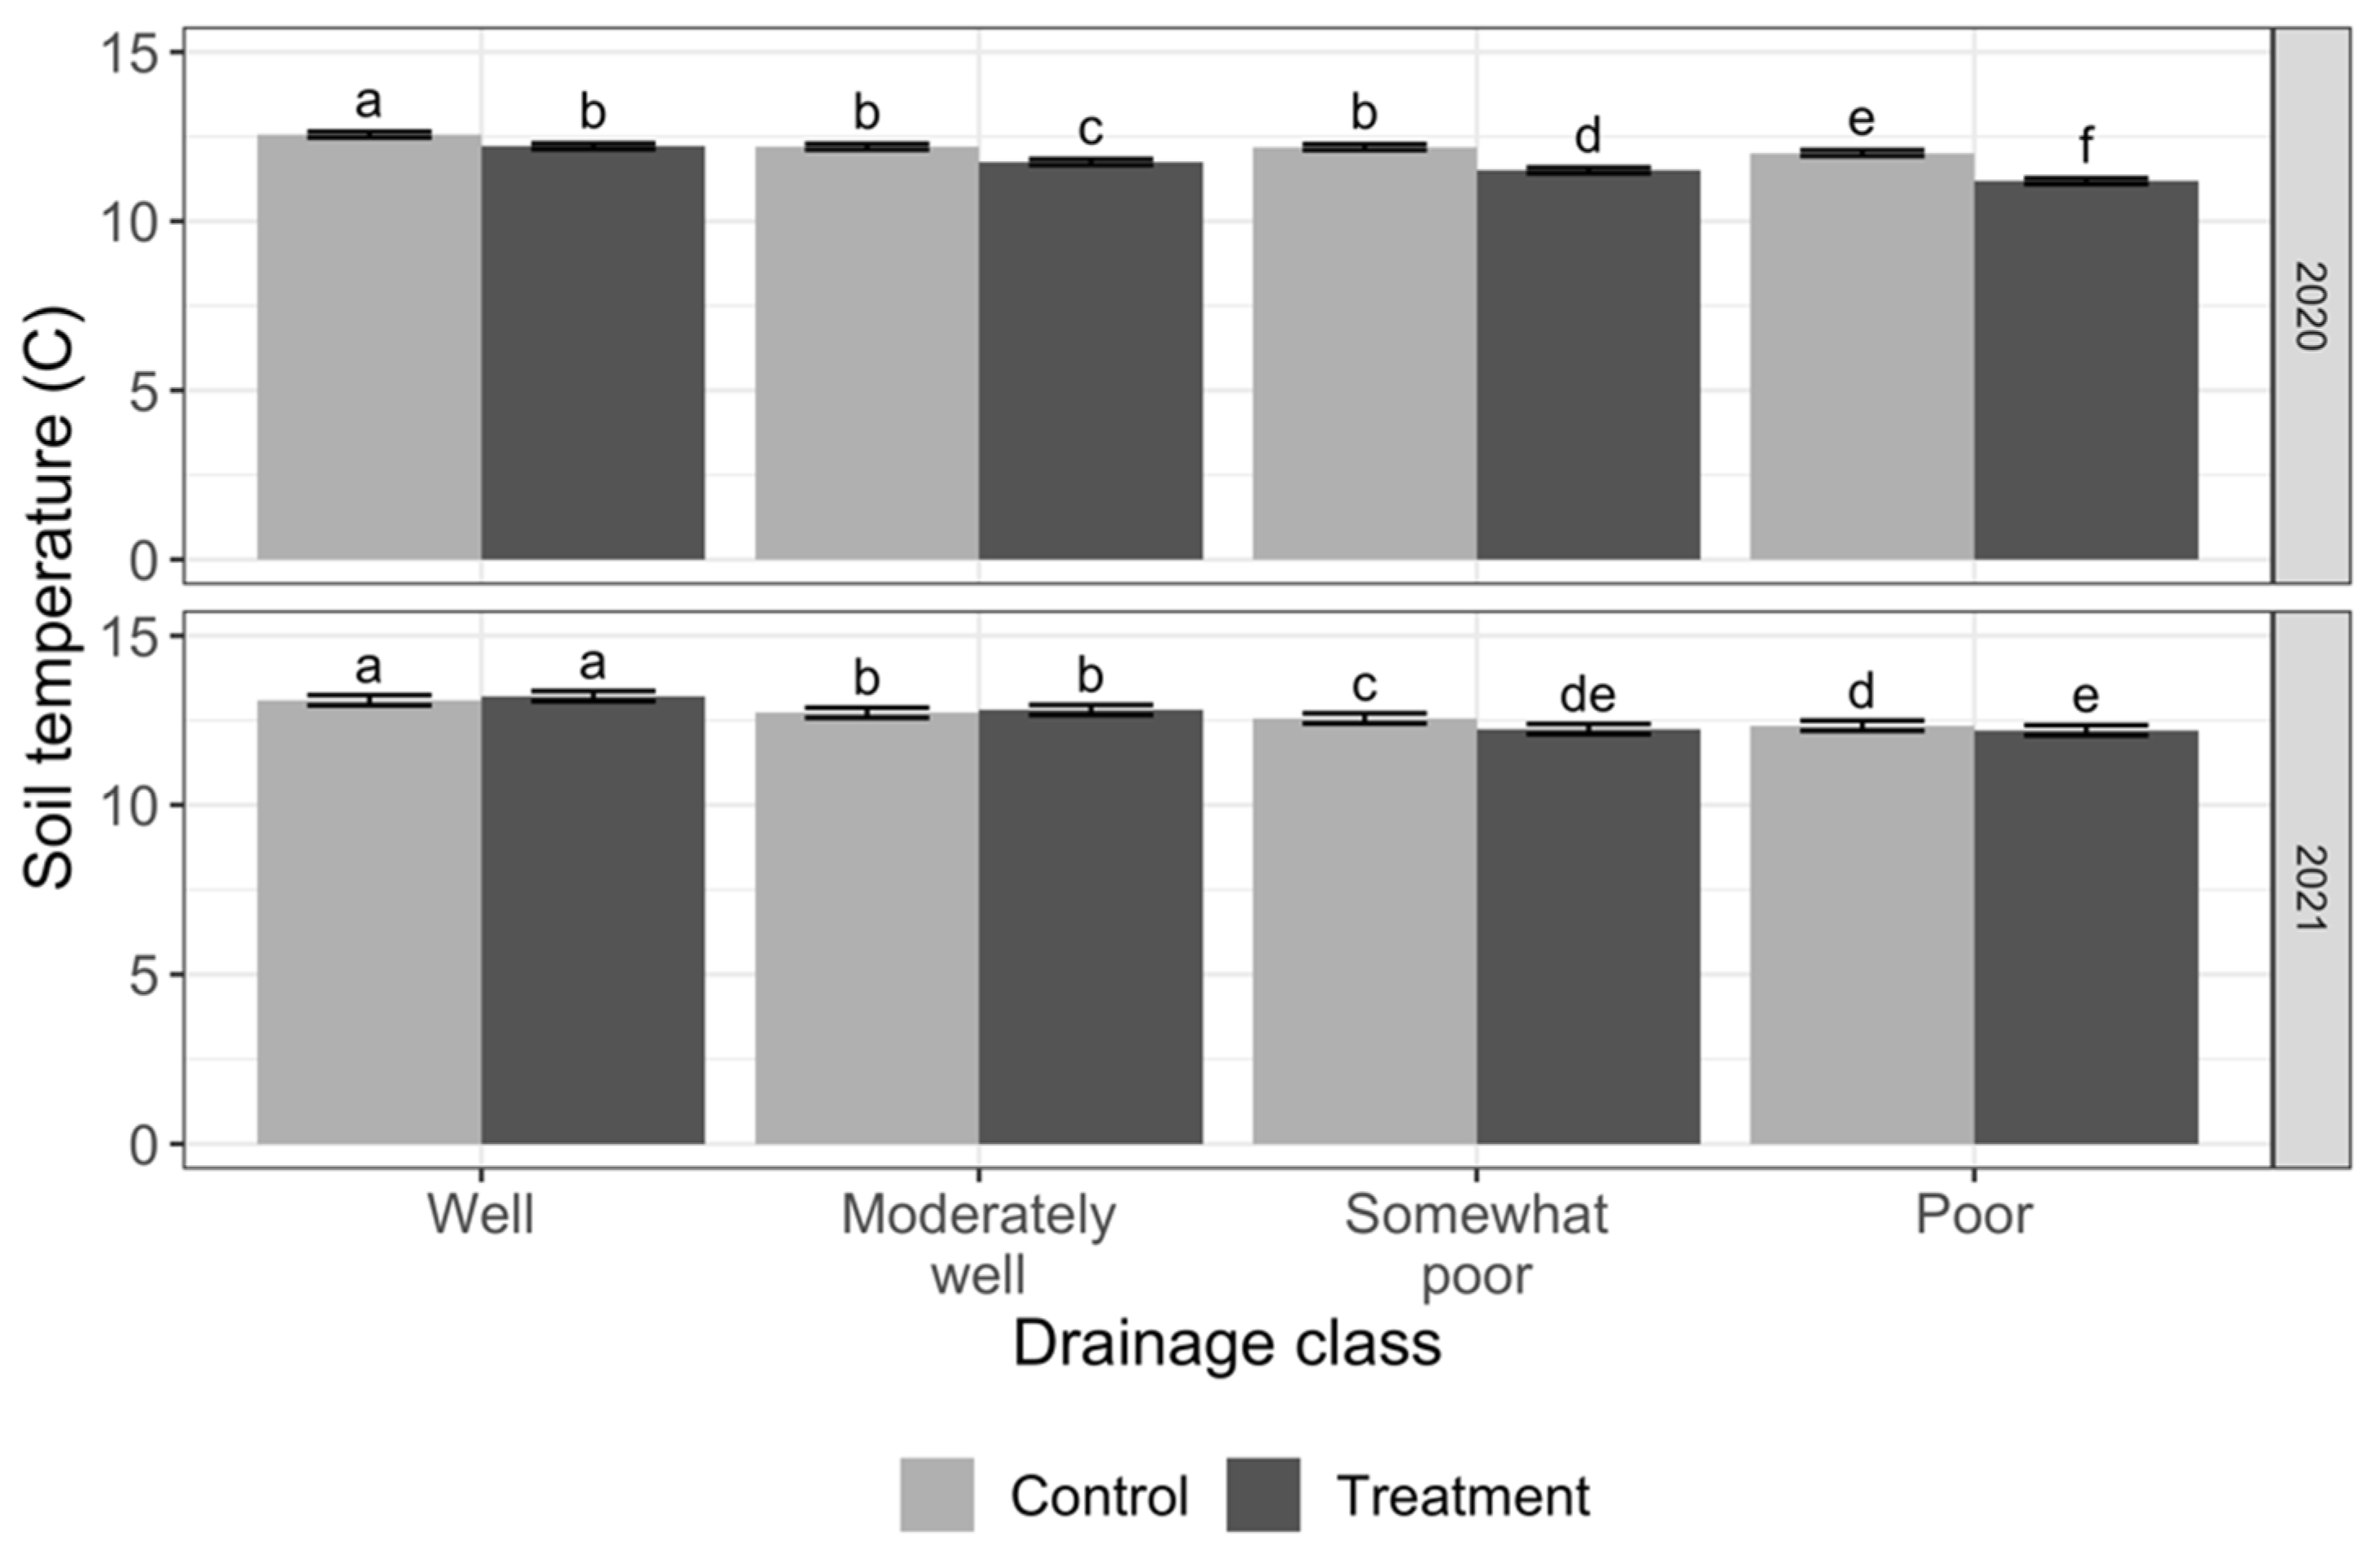
3.1. Effects of Treatment on Soil Water Content and Temperature

There was a significant interaction between drainage class, treatment, and depth on summer SWC in both years (p < 0.001 for both years; Supplementary Materials Table S2). Notably, there were limited effects of throughfall reduction across the drainage classes on SWC in the surface horizons, even though the biweekly average throughfall volume measured in the control plots was 648.6 mL (±54.44 mL) and 305.5 mL (±108.4 mL) for the treatment plots (Figure 1). Significant differences in SWC between the control and treatment within a drainage class at a given depth were mainly present for depths of 30–60 cm for the WD, MWD, SPD, and PD classes during both years. However, the treatment plots were not consistently drier than the control plots. For example, the treatment plots were drier than the control for the WD class at 40 cm during 2020 (difference of −0.04 m3 m−3, and there was no significant difference (p = 0.15) during 2021. The treatment plots in the MWD class had significantly higher SWC than the control plots at 30 and 60 cm during 2020 and 2021 with differences ranging from 0.04 to 0.06 m3 m−3. The PD class showed a similar trend at 20 cm and 60 cm during 2020 and 20 cm during 2021. Differences in SWC at 60 cm in the PD class were likely due to fluctuations in the water table.
There were significant interactions between treatment and time in the growing season soil temperature models for both years (Supplementary Materials Table S3). Soil temperature was significantly lower in the treatment compared to the control during early May in both years due to snow removal and its effect on frost development (2020: difference of 4.4 °C; 2021: difference of 1.6 °C). Soil temperature equilibrated between the ambient and treatment conditions later in the growing season during 2020 (mid-June) compared to 2021 (mid-May) (Figure 2).
There was also a significant interaction between drainage class and treatment on the growing season soil temperature in both years; Supplementary Materials Table S3). Mean growing season soil temperature decreased from WD to PD (difference of 0.55–0.75 °C for the control during the summers of 2020 and 2021; Figure 3), with soil temperatures in the treatment plot typically being slightly lower (difference of 0.13–0.83 °C) compared to the control within each drainage class (except WD, MWD in 2021, differences of −0.12, −0.08 °C respectively; Figure 3).

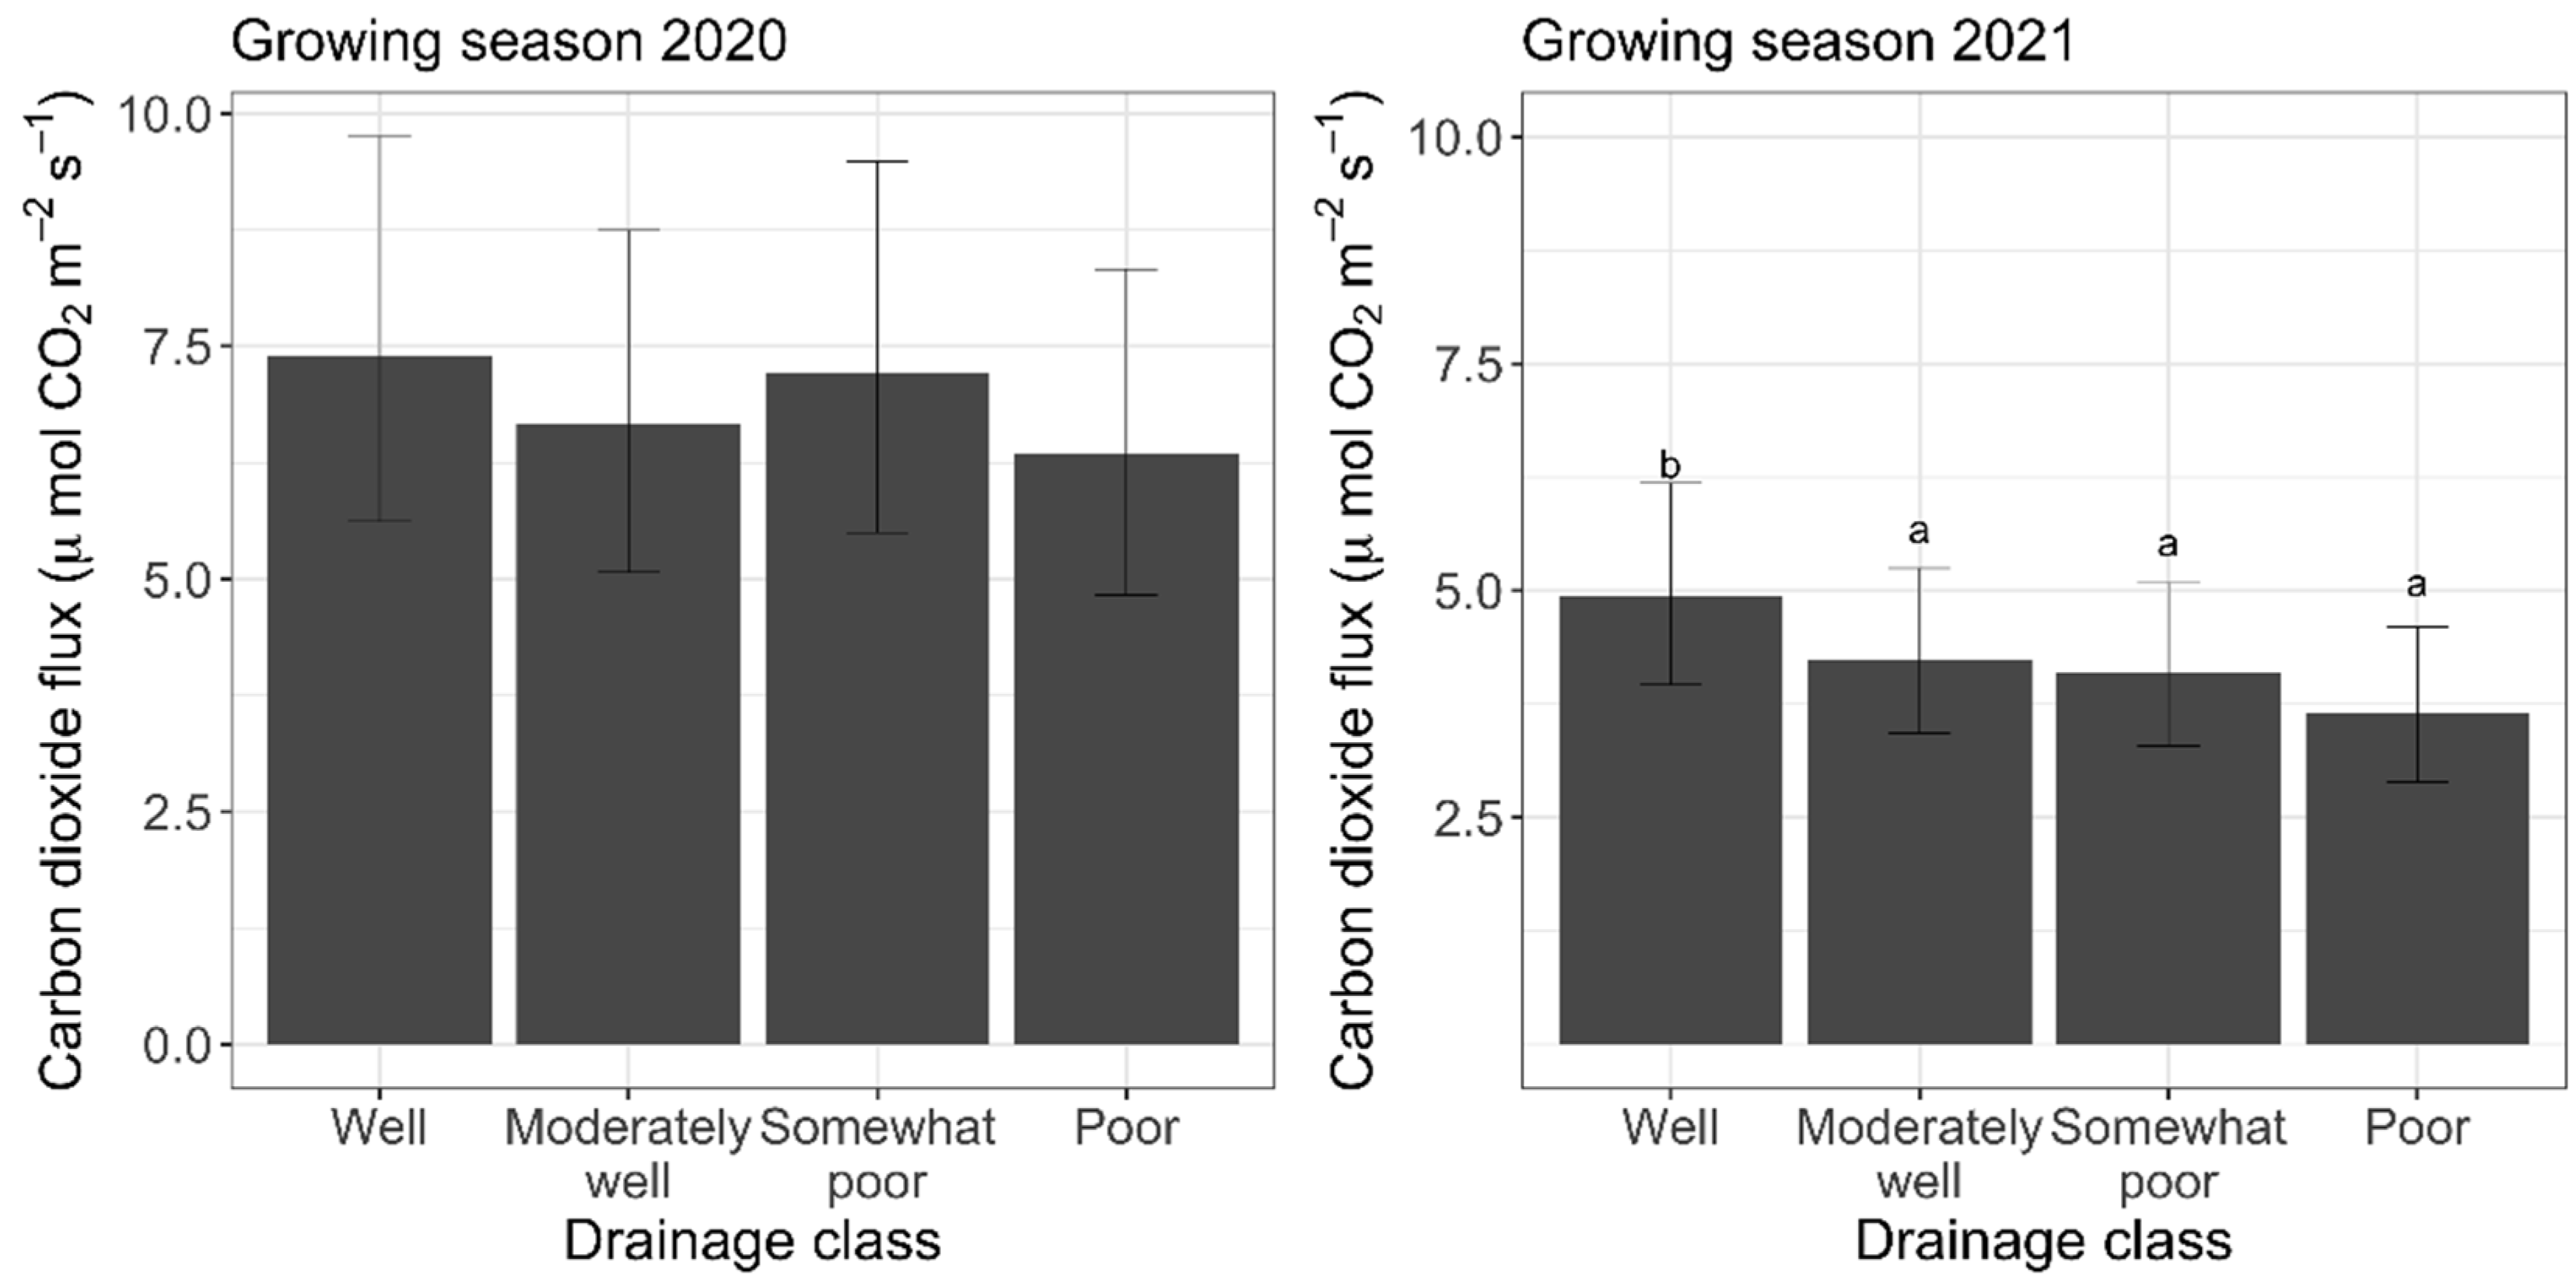
3.2. In Situ Bulk Soil Respiration

There was no effect of treatment on in situ bulk soil respiration in either year (p = 0.2 in 2020, p = 0.9 in 2021), but there was a significant effect of drainage class in 2021 (Supplementary Materials Table S4). In 2021, the well-drained class had a higher respiration rate compared to the other drainage classes with differences of 0.15–0.31 μmol m−2 s−1 (WD-MWD p = 0.04, WD-SPD p = 0.02, WD-PD; Figure 4). Visual examination of the data indicated that there was some evidence of differences in bulk soil respiration during the thaw period among drainage classes in 2021 (Supplementary Materials Figure S5). Bulk soil respiration was suppressed in the wetter drainage classes (SPD and PD) during this period compared to the WD and MWD classes (non-significant difference of 1.38 μmol m−2 s−1 between WD and PD). The later initiation of sampling in 2020 may have missed any thaw period effect between treatments and among drainage classes.
There was a notable decline in soil respiration rates (CO2 flux) from 2020 to 2021 that was associated with a drought during 2021 in the study region. Across treatments and drainage classes, bulk soil respiration rates decreased by roughly 25% from 2020 to 2021 during the growing season (p < 0.001; Supplementary Materials Tables S4 and S5).

3.3. Extractable Soil N

There was no effect of treatment on the extractable N concentrations in either year, and no significant interaction between drainage class and treatment (Supplementary Materials Table S6). The concentrations of extractable N were mainly influenced by drainage class (statistics presented in Supplementary Materials Table S6), and drainage class also significantly affected the TN concentrations during 2020 and 2021 (p < 0.001 for both years). The main differences in extractable TN concentrations in 2020 and 2021 were driven by higher values in the SPD class compared to other drainage classes (Table 2). In 2020, TN concentrations in the SPD class were higher than the WD, MWD, and PD classes by 6.5 mg kg−1 (p < 0.001), 5.6 mg kg−1 (p = 0.002), and 4.2 mg kg−1 (p = 0.02), respectively. There was a significant increase in TN concentrations from 2020 to 2021 (Table 2, Supplementary Materials Table S5). The same pattern was maintained across years, with SPD having the highest mean concentration of TN, then PD, MWD, and WD having the lowest mean concentration (Table 2).
Concentrations of extractable N were mainly influenced by drainage class (statistics presented in Supplementary Materials Table S6), and drainage class also significantly affected the TN concentrations during 2020 and 2021 (p < 0.001 for both years). The main differences in extractable TN concentrations in 2020 and 2021 were driven by higher values in the SPD class compared to other drainage classes (Table 2). In 2020, the TN concentrations in the SPD class were higher than the WD, MWD, and PD classes by 6.5 mg kg−1 (p < 0.001), 5.6 mg kg−1 (p = 0.002), and 4.2 mg kg−1 (p = 0.02), respectively. There was a significant increase in TN concentrations from 2020 to 2021 (Table 2, Supplementary Materials Table S5). The same pattern was maintained across years, with SPD having the highest mean concentration of TN, then PD, MWD, and WD having the lowest mean concentration (Table 2).
Drainage class was a significant factor in the NH4+ model during 2020 and was not significant in 2021 (p = 0.014, p = 0.372 respectively). In 2020, the only difference in extractable NH4+ concentrations was between the SPD and PD class (−1.91 mg kg−1; Table 2). There was an increase in NH4+ concentrations from 2020 to 2021 for both treatments and across drainage classes (p values < 0.05; Supplementary Materials Table S5). The increase in NH4+ concentrations from 2020 to 2021 parallels the increase in TN concentrations between the two growing seasons.
Extractable NO3 + NO2-N concentrations were affected by the drainage class in both 2020 and 2021 (p < 0.001 for both years; Table 2, Supplementary Materials Table S5). In 2020, only the WD class was different and had the lowest concentration of NO3 + NO2-N compared to all other drainage classes (Table 2; 1.2–1.6 mg kg−1). Similarly in 2021, the WD class also had a lower concentration of NO3 + NO2-N (difference 0.7–3.9 mg kg−1) compared to MWD, SPD, and PD (Table 2). Additionally, NO3 + NO2-N concentrations in the SPD class during 2021 were higher than the MWD class (Table 2; 3.1 mg kg−1), but not different from PD. The pattern in NO3 + NO2-N concentrations during 2021 mirrors that of TN concentrations (Table 2), with SPD having the highest concentration of NO3 + NO2-N, then PD, MWD, and WD having the lowest concentration. There was an increase in NO3 + NO2-N concentrations from 2020 to 2021 across both treatments and drainage classes (all p-values < 0.05; Supplementary Materials Table S5).

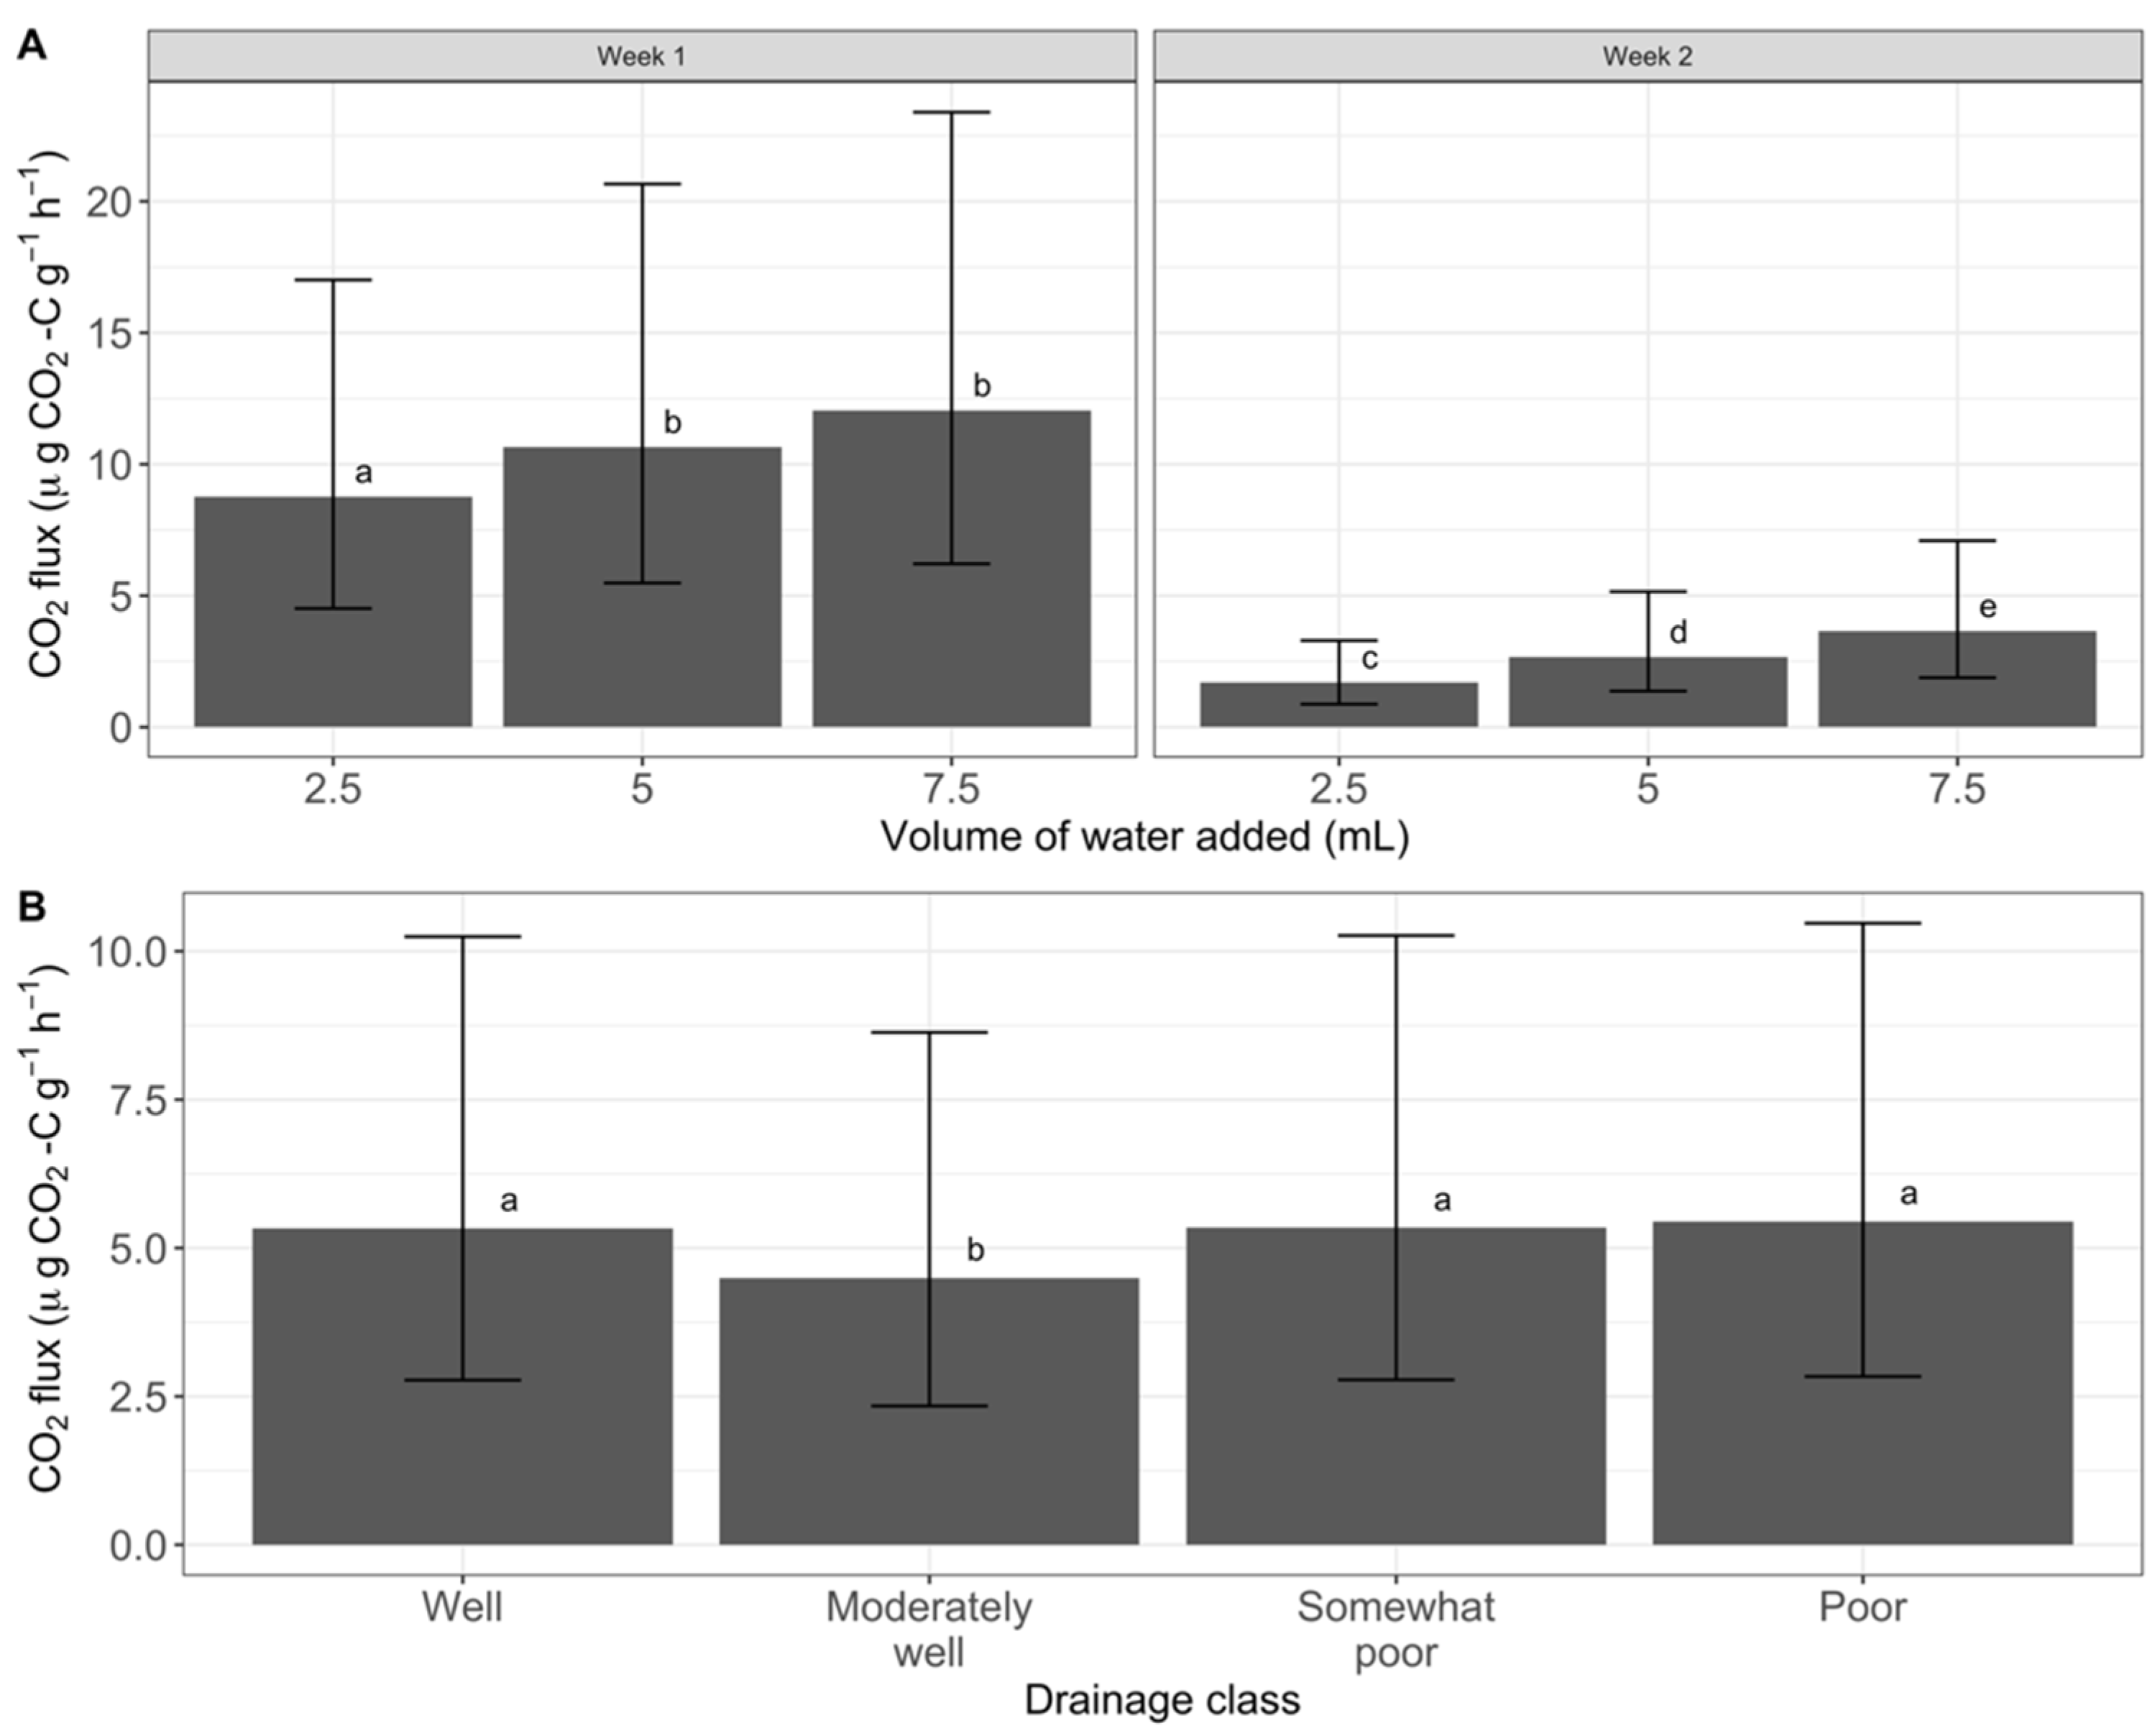
3.4. Laboratory Incubation

The results of the soil incubation were generally consistent with the field results with respect to soil respiration (CO2 flux). As with the field results, there was no effect of treatment on CO2 flux (p = 0.44; Supplementary Materials Table S10) while there was an effect (p = 0.004) of drainage class on the CO2 fluxes during the incubation. Only the MWD class had a lower CO2 flux compared to the other drainage classes (Figure 5; p = 0.01 MWD–SPD, p = 0.01 MWD–WD, p = 0.003 MWD–PD).
There was an interaction between the amount of water added (representative of soil moisture status) and sample date (p < 0.001). Fluxes of CO2 increased with the volume of water added, and this pattern was seen during both sampling periods (Figure 5). However, during the second week of the two-week incubation, CO2 fluxes for each level of water added were different (p < 0.001). The 5.0 mL and 7.5 mL levels were not different during week one. Fluxes of CO2 decreased from the first to second week of the incubation (>50% reduction).

4. Discussion

Evaluating biogeochemical responses to changes in precipitation and temperature is crucial for understanding forest soils under a changing climate. We used a field study to simulate reduced summer and winter precipitation and found minimal effects of throughfall reduction and snow removal on soil respiration and extractable N concentrations. Drainage class was a stronger indicator of soil respiration and extractable N concentrations than treatment, but the effects were limited likely due to the limited efficacy of the throughfall reduction treatment on SWC, and the snow removal effects on soil temperature that did not persist into the period when spring/summer respiration was measured. Results from the laboratory incubation support findings from the field that there were significant effects of SWC on CO2 fluxes, but no treatment effect under controlled conditions.

4.1. Soil Respiration

The treatment (summer throughfall reduction followed by winter snow removal) did not result in differences in the in situ bulk soil respiration during either year of the study. These results are in contrast with previous studies that have shown a decline in soil respiration with throughfall reduction [9,10]. However, these studies excluded all throughfall from entering the plots (similar in size to plots in the current study) to simulate severe drought, resulting in SWC reductions at the soil surface [9,10]. In contrast, our 50% reduction in throughfall in the current study had inconsistent effects on SWC across drainage classes, with the treatment plots being wetter at times compared to the control plots (Figure 1). The lack of a consistent effect of treatment on SWC is likely why there was no effect of treatment on the soil respiration. Experimental artifact may have contributed to the insignificant treatment effect on SWC. For example, the small size of the plots may have limited any treatment effect on SWC within the plots or created an edge effect from lateral soil water flow [29,30].
Snow removal resulted in a temperature lag, where soil temperature was significantly lower in the treatment plots compared to the control from May–June in both years (Figure 2). However, there were no differences in soil respiration between the ambient and treated conditions during this period, despite the strong influence of soil temperature on soil respiration [3,9,11,23]. The timing of respiration measurements and early spring thaw may have inhibited the detection of any treatment effect. For example, in early May 2021, mean soil temperature was significantly lower in the treatment plots (3.0 °C) compared to the control (4.7 °C), but soil temperature equilibrated between the control and treatment relatively quickly in early June (Figure 2). In addition, in 2020, sampling began in late June (delayed due to COVID-19 pandemic restrictions on field research) after soil temperature had normalized between the control and treatment. The larger differences in soil temperature between treatments that occurred in the spring of that year (Figure 2) likely would have had a larger effect on soil respiration. Thus, the lack of treatment effect may have not been captured during either year due to delayed sampling (2020) or an earlier thaw (2021). If this is the case, then any treatment effect would have been short in duration.
The effect of drainage class on soil respiration in 2021 was minimal as only the WD class had a higher respiration rate compared to the other three drainage classes (Figure 4). Davidson et al. (1998) showed that soil respiration generally decreased with increasing SWC (from WD to PD), but that soil respiration was also suppressed at low values of SWC (θv < 0.12) under drought conditions [23]. The lack of more pronounced and consistent effects of drainage class may be due to the offsetting effects of SWC and soil temperature on soil respiration, which may mask any response, or to minimal differences in microbial responses, as suggested by the incubation results (Figure 5). It is also possible that the variation in soil water contents among drainage classes was not large enough to become limiting to soil respiration. The positive effect of increasing moisture content on soil respiration in the lab incubation supports this: the maximum moisture content during the incubation (θg-incubation = 0.75, average bulk density of in situ soils = 1.05 g cm−3, θv-incubation ≈ 0.71) was higher than the maximum moisture content observed in the field across all three years (θv-field = 0.47).
The comparison of the laboratory incubation to the field experiment removes the effects of the field microclimate on the response and any contributions of autotrophic respiration, which allows for the direct observation of heterotrophic respiration associated with the microbial community and available C substrate. The lack of a treatment effect under controlled laboratory conditions is consistent with the field observations, indicating that the treatment did not modify the soil microbial community or other factors that influence C efflux (e.g., microbial community composition, litter quality, enzyme activity, etc.). Since microbial transformations of C are strongly affected by soil moisture and temperature, a treatment effect on the microbial community or C substrate should have appeared under controlled incubation conditions without the influence of vegetation [23,31,32].
The observed effect of drainage class and volume of water added indicated that soil C differed by drainage class and responded to changes in SWC (Figure 5). The drainage effect during the incubation was minimal, since only the MWD class had a significantly lower CO2 flux, which could be due to lower microbial activity or substrate availability compared to the other drainage classes. This pattern suggests that similar soil respiration in the field among the MWD, SPD, and PD classes was due to higher autotrophic respiration in the MWD class. Furthermore, the highest in situ respiration rate in the WD class during 2021 was likely to be caused by higher autotrophic respiration compared to the other drainage classes. The investigation of the differences in autotrophic versus heterotrophic respiration was beyond the scope of this study, but it emphasizes the complexity of soil–microbe–plant interactions across a drainage gradient in forest soils.

4.2. Extractable Soil N

The lack of any treatment effects on the extractable N concentrations is also likely to be a result of the insignificant effect of throughfall reduction on the SWC of the surface horizons, since microbial transformations of N are dependent on soil moisture and temperature [7,19,20]. Previous studies have shown the response of extractable N concentrations to reduced precipitation to be complex and the direction of the change variable. For example, drying may limit the transport of substrates and enzymes via changes in water potential or alter soil structure by disrupting soil aggregate content [33], though this likely did not occur in our study since there was no effect of treatment on the surface SWC. Homyak et al. (2017) found that precipitation reduction decreased the extractable NH4+ but NO3 was not affected, potentially due to the increase in the microbial mortality and decline in plant uptake of NH4+, and decline in the production and consumption of NO3 [19]. In contrast, Deng et al. (2021) found that both NH4+ and NO3 concentrations increased with drought in forest ecosystems, potentially due to the decreased uptake of N by plants and reduced NO3 leaching as a result of the reductions in saturation [20]. The increase in the concentrations of extractable nitrogen from 2020 to 2021 may have been due to the mechanisms proposed by Deng et al. (2021) including an increase in the extractable nitrogen due to the decreased plant uptake and decreased leaching.
Our experiment differed from past throughfall reduction studies due to the combination with snow removal and the inclusion of a drainage class gradient. There may have been offsetting the effects of throughfall reduction and snow removal on extractable N, since snow removal increased frost depth, which may have increased the microbial and fine root mortality, as shown in other studies [8,11,17,34]. Still, the lack of treatment effect in this study was most likely due to the insignificant effect of throughfall reduction on the SWC of the surface horizons. However, even if there were offsetting effects of the treatment components, the lack of biogeochemical responses are a valid representation of the future response of C and N dynamics to reduced precipitation in both the winter and summer.
There were some small and inconsistent effects of drainage class on the soil extractable N concentrations. Even though transformations of N via microbes are dependent on soil moisture and the drainage class clearly influenced SWC (Figure 1), the absolute differences in SWC were apparently insufficient to influence the extractable N concentrations. In aerobic mineral soils, concentrations of NH4+ typically increase with increasing soil moisture, but mineralization is limited at high moisture levels due to anoxic conditions and at extremely low moisture conditions due to reduced substrate supply and enzyme activity [35]. Under favorable conditions (warm and moderate water content), nitrification may occur quickly and thus shift the mineral N balance toward NO3- dominance [35]. In this study, NH4+ concentrations were expected to increase from WD to PD since the SWC increased from WD to PD, assuming that a high limiting SWC was not reached in PD. Since soil temperatures and water contents are low and moderate for a large portion of the year, respectively, one could also expect NO3 + NO2 to be a smaller component of the mineral N balance due to less ideal conditions for rapid nitrification (Table 1) [35]. This pattern was not observed in the field, but NH4+ was a larger component of the mineral N balance compared to NO3 + NO2-N. Typically, the SPD class had the highest concentrations of TN, NH4+, and NO3 + NO2-N, and the lowest concentrations were observed in WD. This pattern may have been due to the optimal moisture content for microbial activity in SPD, but moisture may have been limiting in PD (too wet) and WD (too dry). Although the effect of drainage class was not clear, the use of a drainage class gradient in a throughfall reduction and snow removal study has not been implemented in prior studies, and thus our findings provide insight in the context of the experimental design and C and N dynamics across varying moisture conditions in a forested landscape.

5. Conclusions

Overall, our results indicate that the response of soil respiration and N dynamics under reduced precipitation scenarios is complex, but may not be greatly affected by the combination of reduced snow cover and throughfall over the range of conditions that was observed in our study. The additional effects of climate change such as concurrent warming may alter the response of C and N dynamics as observed here, and merit further study under reduced precipitation scenarios across drainage classes in forest ecosystems as well as in combination with warming. Understanding these processes is crucial when predicting the future of forest biogeochemical cycling and productivity under a changing climate.

Supplementary Materials

The following supporting information can be downloaded at: https://www.mdpi.com/article/10.3390/f13081194/s1, Figure S1: Paired-plot design schematic (panel A) and field photo (panel B) with snow removal treatment during the winter. (Photo credit: Alan Toczydlowski, University of Minnesota); Figure S2: Paired-plot design with throughfall reduction treatment during the growing season is shown in panel A. All plots and transparent roof panels were oriented on an east-west transect, with the shelter ridgeline running north-south. Precipitation reduction shelters were designed to exclude 50% of throughfall. Plots that received treatment were randomized in each pair. Panel B shows the throughfall exclusion shelter on a treatment plot during the growing season. (Photo credit: Alan Toczydlowski); Figure S3: Mean weekly soil temperature during the winters of 2018/19, 2019/20, and 2020/21 across drainage class, treatment, depth, and week; Figure S4: Mean weekly soil water content during the growing seasons of 2019, 2020, and 2021 by drainage class, treat-ment, and depth; Figure S5: Soil respiration during 2021 across time and drainage classes. Let-ters indicate significant differences (p-value < 0.05); Figure S6: Least square mean values of ex-tractable ammonium across drainage classes for 2021. Letters indicate significant differences between drainage classes (p-value < 0.05). Error bars represent 95% confidence intervals; Table S1: Mean percentages of pre-treatment carbon and nitrogen by site and drainage class; Table S2: Four-way ANOVA summary for soil water content models for the growing seasons of 2020 and 2021. Model coefficient p-values are shown. Bolded values indicate a significant result (p-value < 0.05); Table S3: Four-way ANOVA summary for soil temperature models for the growing sea-sons of 2020 and 2021. Model coefficient p-values are shown. Bolded values indicate a significant result (p-value < 0.05); Table S4: Three-way ANOVA results summary for the field bulk soil res-piration model. Numerator degrees of freedom and model coefficient p-values are shown. Bolded values indicate a significant result (p-value < 0.05); Table S5: Mean soil respiration, total nitrogen, ammonium, and nitrate/nitrite for summers of 2020 and 2021. Superscript letters indi-cate significant differences between means within a given year. Level of significance (alpha) is 0.05. Confidence intervals are 95% confidence; Table S6: Three-way ANOVA results for total ni-trogen, ammonium, and nitrate/nitrite models. Pre-treatment nitrogen and percent clay were included as covariates in the models. Bolded values indicate a significant result (p-value < 0.05); Table S7: Two-way ANOVA summaries of mixed models of species richness and Shannon’s Di-versity Index for 2021 vegetation community surveys. Site was included as a random variable in the models. Numerator degrees of freedom are shown. Bolded values denote significant result (p-value < 0.05); Table S8: Species richness (number of species) for all plots by location; Table S9: Shannon’s Diversity Index for all plots by location; Table S10: Four-way ANOVA results for carbon dioxide model. Numerator degrees of freedom and model coefficient p-values are shown. Bolded values indicate a significant result (p-value < 0.05).

Author Contributions

Conceptualization, R.A.S., C.R.B., R.K.K. and S.D.S.; Methodology, R.A.S., C.R.B., R.K.K. and S.D.S.; Formal analysis, A.B.S. and A.J.T.; Investigation, A.B.S. and A.J.T.; Writing—original draft preparation, A.B.S.; Writing—review and editing, R.A.S., C.R.B., R.K.K., S.D.S. and A.B.S.; Visualization, A.B.S. and A.J.T.; Supervision, R.A.S.; Project administration, R.A.S., C.R.B. and A.J.T.; Funding acquisition, R.A.S., C.R.B., R.K.K. and S.D.S. All authors have read and agreed to the published version of the manuscript.

Funding

Funding for this project was provided by the Minnesota Environment and Natural Resources Trust Fund as recommended by the Legislative-Citizen Commission on Minnesota Resources (LCCMR).

Institutional Review Board Statement

Not applicable.

Informed Consent Statement

Not applicable.

Data Availability Statement

The datasets analyzed during the current study are available from the corresponding author on reasonable request.

Acknowledgments

The authors thank everyone who helped with snow removal at the sites: Alexis Grinde, Steve Kolbe, Stephen Nelson, and Ryan Steiner (UMD Natural Resources Research Institute) and Anne Gapinski and Gwen Keller (UMN). We thank Nathan Aspelin (chemistry laboratory analyst) and the USDA Forest Service Northern Research Station for leading the soil chemical analyses; Rodney Venterea and Scott Mitchell at the USDA Agricultural Research Service for help with the incubation and running the gas chromatograph analyses; Tyler Roman (USDA Forest Service Northern Research Station) for help with the calibration of the LICOR LI-8100; and Jacob Burdick at the Marcell Research Center for lodging (USDA Forest Service Northern Research Station). Participation of all Forest Service personnel was funded by the Northern Research Station and Pacific Northwest Research Station of the USDA Forest Service. We also thank Hannah Friesen for the assistance with the snow removal and statistical analyses/code.

Conflicts of Interest

The authors declare no conflict of interest.

References

  1. Bernal, S.; Hedin, L.O.; Likens, G.E.; Gerber, S.; Buso, D.C. Complex Response of the Forest Nitrogen Cycle to Climate Change. Proc. Natl. Acad. Sci. USA 2012, 109, 3406–3411. [Google Scholar] [CrossRef] [PubMed] [Green Version]
  2. Schlesinger, W.H.; Andrews, J.A. Soil Respiration and the Global Carbon Cycle. Biogeochemistry 2000, 48, 7–20. [Google Scholar] [CrossRef]
  3. Wei, W.; Weile, C.; Shaopeng, W. Forest Soil Respiration and Its Heterotrophic and Autotrophic Components: Global Patterns and Responses to Temperature and Precipitation. Soil Biol. Biochem. 2010, 42, 1236–1244. [Google Scholar] [CrossRef]
  4. Högberg, P.; Read, D.J. Towards a More Plant Physiological Perspective on Soil Ecology. Trends Ecol. Evol. 2006, 21, 548–554. [Google Scholar] [CrossRef] [PubMed]
  5. Rennenberg, H.; Dannenmann, M.; Gessler, A.; Kreuzwieser, J.; Simon, J.; Papen, H. Nitrogen Balance in Forest Soils: Nutritional Limitation of Plants under Climate Change Stresses. Plant Biol. 2009, 11, 4–23. [Google Scholar] [CrossRef] [PubMed]
  6. Haaf, D.; Six, J.; Doetterl, S. Global Patterns of Geo-Ecological Controls on the Response of Soil Respiration to Warming. Nat. Clim. Chang. 2021, 11, 623–627. [Google Scholar] [CrossRef]
  7. Knoepp, J.D.; Swank, W.T. Using Soil Temperature and Moisture to Predict Forest Soil Nitrogen Mineralization. Biol. Fertil. Soils 2002, 36, 177–182. [Google Scholar] [CrossRef]
  8. Monson, R.K.; Lipson, D.L.; Burns, S.P.; Turnipseed, A.A.; Delany, A.C.; Williams, M.W.; Schmidt, S.K. Winter Forest Soil Respiration Controlled by Climate and Microbial Community Composition. Nature 2006, 439, 711–714. [Google Scholar] [CrossRef] [PubMed]
  9. Schindlbacher, A.; Wunderlich, S.; Borken, W.; Kitzler, B.; Zechmeister-Boltenstern, S.; Jandl, R. Soil Respiration under Climate Change: Prolonged Summer Drought Offsets Soil Warming Effects. Glob. Chang. Biol. 2012, 18, 2270–2279. [Google Scholar] [CrossRef]
  10. Borken, W.; Savage, K.; Davidson, E.A.; Trumbore, S.E. Effects of Experimental Drought on Soil Respiration and Radiocarbon Efflux from a Temperate Forest Soil. Glob. Chang. Biol. 2006, 12, 177–193. [Google Scholar] [CrossRef] [Green Version]
  11. Muhr, J.; Borken, W.; Matzner, E. Effects of Soil Frost on Soil Respiration and Its Radiocarbon Signature in a Norway Spruce Forest Soil. Glob. Chang. Biol. 2009, 15, 782–793. [Google Scholar] [CrossRef]
  12. Handler, S.; Duveneck, M.J.; Iverson, L.; Peters, E.; Scheller, R.M.; Wythers, K.R.; Brandt, L.; Butler, P.; Janowiak, M.; Shannon, P.D.; et al. Minnesota Forest Ecosystem Vulnerability Assessment and Synthesis: A Report from the Northwoods Climate Change Response Framework Project. In Gen. Tech. Rep. NRS-133. Newtown Square, PA.; U.S. Department of Agriculture, Forest Service, Northern Research Station: Madison, WI, USA, 2014; 228p. [Google Scholar] [CrossRef]
  13. Collins, M.; Knutti, R.; Arblaster, J.; Dufresne, J.-L.; Fichefet, T.; Gao, X.; Gutowski, W.J., Jr.; Johns, T.; Krinner, G.; Shongwe, M.; et al. Long-Term Climate Change: Projections, Commitments and Irreversibility. In Climate Change 2013—The Physical Science Basis: Contribution of Working Group I to the Fifth Assessment Report of the Intergovernmental Panel on Climate Change; Cambridge University Press: Cambridge, UK, 2013; 108p. [Google Scholar]
  14. Campbell, J.L.; Ollinger, S.V.; Flerchinger, G.N.; Wicklein, H.; Hayhoe, K.; Bailey, A.S. Past and Projected Future Changes in Snowpack and Soil Frost at the Hubbard Brook Experimental Forest, New Hampshire, USA. Hydrol. Process. 2010, 24, 2465–2480. [Google Scholar] [CrossRef] [Green Version]
  15. Hardy, J.P.; Groffman, P.M.; Fitzhugh, R.D.; Henry, K.S.; Welman, A.T.; Demers, J.D.; Fahey, T.J.; Driscoll, C.T.; Tierney, G.L.; Nolan, S. Snow Depth Manipulation and Its Influence on Soil Frost and Water Dynamics in a Northern Hardwood Forest. Biogeochemistry 2001, 56, 151–174. [Google Scholar] [CrossRef]
  16. Öquist, M.G.; Laudon, H. Winter Soil Frost Conditions in Boreal Forests Control Growing Season Soil CO2 Concentration and Its Atmospheric Exchange. Glob. Chang. Biol. 2008, 14, 2839–2847. [Google Scholar] [CrossRef]
  17. Fitzhugh, R.D.; Driscoll, C.T.; Groffman, P.M.; Tierney, G.L.; Fahey, T.J.; Hardy, J.P. Effects of Soil Freezing Disturbance on Soil Solution Nitrogen, Phosphorus, and Carbon Chemistry in a Northern Hardwood Ecosystem. Biogeochemistry 2001, 56, 215–238. [Google Scholar] [CrossRef]
  18. Mitchell, M.J.; Driscoll, C.T.; Kahl, J.S.; Murdoch, P.S.; Pardo, L.H. Climatic Control of Nitrate Loss from Forested Watersheds in the Northeast United States. Environ. Sci. Technol. 1996, 30, 2609–2612. [Google Scholar] [CrossRef]
  19. Homyak, P.M.; Allison, S.D.; Huxman, T.E.; Goulden, M.L.; Treseder, K.K. Effects of Drought Manipulation on Soil Nitrogen Cycling: A Meta-Analysis. J. Geophys. Res. Biogeosci. 2017, 122, 3260–3272. [Google Scholar] [CrossRef] [Green Version]
  20. Deng, L.; Peng, C.; Kim, D.-G.; Li, J.; Liu, Y.; Hai, X.; Liu, Q.; Huang, C.; Shangguan, Z.; Kuzyakov, Y. Drought Effects on Soil Carbon and Nitrogen Dynamics in Global Natural Ecosystems. Earth Sci. Rev. 2021, 214, 103501. [Google Scholar] [CrossRef]
  21. Veneman, P.L.M.; Spokas, L.A.; Lindbo, D.L. Soil Moisture and Redoximorphic Features: A Historical Perspective. In Quantifying Soil Hydromorphology; John Wiley & Sons, Ltd.: Hoboken, NJ, USA, 1998; pp. 1–23. [Google Scholar] [CrossRef]
  22. Briggs, R.D.; Lemin, R.C., Jr. Soil Drainage Class Effects on Early Response of Balsam Fir to Precommercial Thinning. Soil Sci. Soc. Am. J. 1994, 58, 1231–1239. [Google Scholar] [CrossRef]
  23. Davidson, E.A.; Belk, E.; Boone, R.D. Soil Water Content and Temperature as Independent or Confounded Factors Controlling Soil Respiration in a Temperate Mixed Hardwood Forest. Glob. Chang. Biol. 1998, 4, 217–227. [Google Scholar] [CrossRef] [Green Version]
  24. Friesen, H.C.; Slesak, R.A.; Karwan, D.L.; Kolka, R.K. Effects of Snow and Climate on Soil Temperature and Frost Development in Forested Peatlands in Minnesota, USA. Geoderma 2021, 394, 115015. [Google Scholar] [CrossRef]
  25. Ditzler, C.; Scheffe, K.; Monger, H.C. (Eds.) Soil Science Division Staff. In Soil Survey Manual; USDA Handbook 18; Government Printing Office: Washington, DC, USA, 2017. [Google Scholar]
  26. Yahdjian, L.; Sala, O.E. A Rainout Shelter Design for Intercepting Different Amounts of Rainfall. Oecologia 2002, 133, 95–101. [Google Scholar] [CrossRef] [PubMed]
  27. Pinheiro, J.; Bates, D.; DebRoy, S.; Sarkar, D.; R Core Team. nlme: Linear and Nonlinear Mixed Effects Models; R Package Version 3.1-153; R Foundation for Statistical Computing: Vienna, Austria, 2021; Available online: https://CRAN.R-project.org/package=nlme (accessed on 1 September 2020).
  28. Lenth, R.V. Emmeans: Estimated Marginal Means, AKA Least-Squares Means; R Package Version 1.5.4; R Foundation for Statistical Computing: Vienna, Austria, 2021; Available online: https://CRAN.R-project.org/package=emmeans (accessed on 1 September 2020).
  29. Beier, C.; Beierkuhnlein, C.; Wohlgemuth, T.; Penuelas, J.; Emmett, B.; Körner, C.; de Boeck, H.; Christensen, J.H.; Leuzinger, S.; Janssens, I.A.; et al. Precipitation Manipulation Experiments—Challenges and Recommendations for the Future. Ecol. Lett. 2012, 15, 899–911. [Google Scholar] [CrossRef]
  30. Fay, P.A.; Carlisle, J.D.; Knapp, A.K.; Blair, J.M.; Collins, S.L. Altering Rainfall Timing and Quantity in a Mesic Grassland Ecosystem: Design and Performance of Rainfall Manipulation Shelters. Ecosystems 2000, 3, 308–319. [Google Scholar] [CrossRef]
  31. Barba, J.; Curiel Yuste, J.; Poyatos, R.; Janssens, I.A.; Lloret, F. Strong Resilience of Soil Respiration Components to Drought-Induced Die-off Resulting in Forest Secondary Succession. Oecologia 2016, 182, 27–41. [Google Scholar] [CrossRef] [Green Version]
  32. Schlesinger, W.H.; Dietze, M.C.; Jackson, R.B.; Phillips, R.P.; Rhoades, C.C.; Rustad, L.E.; Vose, J.M. Forest Biogeochemistry in Response to Drought. Glob. Chang. Biol. 2016, 22, 2318–2328. [Google Scholar] [CrossRef]
  33. Borken, W.; Matzner, E. Reappraisal of Drying and Wetting Effects on C and N Mineralization and Fluxes in Soils. Glob. Chang. Biol. 2009, 15, 808–824. [Google Scholar] [CrossRef]
  34. Groffman, P.M.; Driscoll, C.T.; Fahey, T.J.; Hardy, J.P.; Fitzhugh, R.D.; Tierney, G.L. Effects of Mild Winter Freezing on Soil Nitrogen and Carbon Dynamics in a Northern Hardwood Forest. Biogeochemistry 2001, 56, 191–213. [Google Scholar] [CrossRef]
  35. Porporato, A.; D’Odorico, P.; Laio, F.; Rodriguez-Iturbe, I. Hydrologic Controls on Soil Carbon and Nitrogen Cycles. I. Modeling Scheme. Adv. Water Resour. 2003, 26, 45–58. [Google Scholar] [CrossRef]
Figure 1. Three-way interaction between treatment, drainage class, and sensor depth for the two years of SWC models. Asterisks indicate a significant difference (p < 0.05) between the control and treatment within each drainage and treatment combination. Error bars indicate the standard error. The sensor depth in centimeters in shown on the right y-axis.
Forests 13 01194 g001
Figure 2. Mean weekly soil temperature during the growing seasons of 2020 and 2021 by treatment. Asterisks indicate weeks with significant difference between the means of the control and treatment.
Forests 13 01194 g002
Figure 3. Mean soil temperature by drainage class and treatment for the growing seasons of 2020 and 2021. The letters indicate significant differences (p-value < 0.05) among the drainage classes within each year.
Forests 13 01194 g003
Figure 4. The least square mean values of bulk soil respiration by drainage class for 2020 and 2021. Letters represent significant differences between the drainage classes within a specific year (p-value < 0.05). Error bars represent 95% confidence intervals.
Forests 13 01194 g004
Figure 5. The least square mean values of the CO2 flux for pairwise comparisons of the volume of water (soil moisture status) added by week are shown in panel (A). The least square means of CO2 flux by drainage class are shown in panel (B). Letters represent significant differences (p-value < 0.05). Error bars represent 95% confidence intervals.
Forests 13 01194 g005
Table 1. The site locations, map units, and pre-treatment physical and chemical data for the three sites (county) determined from the soil survey information. The soil survey information is from the National Cooperative Soil Survey [25].
Site (County)CoordinatesSoil UnitSoil TextureBulk
Density (g cm−3)
% C% N
Aitkin46.361908,
−93.236416
Milaca-Millward complexFine sandy loam1.03–1.211.24–1.940.07–0.14
Itasca47.688509,
−93.546264
Warba-Menahga complexFine sandy loam1.24–1.310.73–1.070.04–0.06
Morph very fine sandy loamVery fine sandy loam1.31–1.320.820.05
Baudette silt loamSilt loam1.27–1.361.120.08
St. Louis47.182644,
−92.104667
Aldenlake-Pequaywan complexSandy loam1.02–1.221.24–1.900.08–0.13
Brimson stony fine sandy loamStony fine sandy loam0.84–0.933.25–5.250.22–0.39
Table 2. The least square means of the concentrations of the extractable total N, ammonium, and NO3 + NO2-N by drainage class during the growing seasons of 2020 and 2021. Groups with different superscript letters indicate significant differences (p-value < 0.05) between drainage classes within a given year.
Total N (mg kg−1)
(95% Confidence Interval)
Drainage Class20202021
WD5.51 (3.68.4) a10.6 (5.620.2) a
MWD6.45 (4.29.9) a11.5 (6.121.9) ab
SPD12.0 (7.918.2) b17.5 (9.233.3) c
PD7.81 (5.012.3) a15.7 (8.1330.2) bc
Ammonium (mg kg−1)
(95% confidence interval)
Drainage class20202021
WD2.51 (0.728.7) ab15.8 (3.473.8) a
MWD3.81 (1.113.1) ab14.2 (3.0366.3) a
SPD4.00 (1.213.7) b12.0 (2.459.3) a
PD2.09 (0.587.5) a18.0 (3.786.9) a
Nitrate + nitrite (mg kg−1)
(95% confidence interval)
Drainage class20202021
WD0.43 (0.171.0) a0.09 (0.010.65) a
MWD1.48 (0.613.6) b0.70 (0.095.7) b
SPD1.59 (0.663.8) b3.78 (0.2653.9) c
PD1.24 (0.483.2) b2.29 (0.2125.1) bc
Publisher’s Note: MDPI stays neutral with regard to jurisdictional claims in published maps and institutional affiliations.

