Article

Potential of Agroforestry to Provide Wood Resources to Central Asia

1
Gesellschaft Für Internationale Zusammenarbeit (GIZ), 53113 Bonn, Germany
2
World Agroforestry, Central Asia Office, Bishkek 720001, Kyrgyzstan
3
Leibniz-Institut Für Agrarentwicklung in Transformationsökonomien (IAMO), 06120 Halle (Saale), Germany
4
Eberswalde University for Sustainable Development, Schicklerstraße 5, 16225 Eberswalde, Germany
5
TIIAME National Research University, 39 Kari Niayzi Street, Tashkent 100000, Uzbekistan
*
Author to whom correspondence should be addressed.
Forests 2022, 13(8), 1193; https://doi.org/10.3390/f13081193
Submission received: 25 May 2022 / Revised: 15 July 2022 / Accepted: 26 July 2022 / Published: 28 July 2022
(This article belongs to the Special Issue Economy and Sustainability of Agroforestry Ecosystems)

Abstract

:
Background: Agroforestry systems have the potential to provide timber and wood as a domestic raw material, as well as an additional source of income for rural populations. In Central Asia, tree windbreaks from mainly poplar trees have a long tradition, but were largely cut down as source for fuel wood after the disintegration of the Soviet Union. As Central Asia is a forest-poor region, restoration of tree windbreaks has the potential to provide timber and wood resources to that region. This study aimed to assess the potential of tree windbreaks to contribute to domestic timber and wood production. Methods: This study rests on a GIS-based analysis, in which tree lines (simulated by line shape files) were intersected with cropland area. The tree data to calculate timber and wood volumes stem from a dataset with 728 single trees from a relevant range of climatic conditions. Results: The potential annually available timber volumes from tree windbreaks with 500 m spacing are 2.9 million m3 for Central Asia as a whole and 1.5 million m3 for Uzbekistan alone, which is 5 times the current domestic roundwood production and imports of the country. Conclusions: tree windbreaks offer untapped potential to deliver wood resources domestically as a raw material for wood-based value chains.

1. Introduction

It is widely recognized that agroforestry provides a number of benefits directly to land users and indirectly to society [1,2,3]. Thereby, agroforestry is understood as land use systems in which woody perennials (trees and shrubs in the case of Central Asia) are deliberately used on the same land as crops or animals [4]. Trees on farms provide an additional source of income from timber, fruits, fodder, or fuel wood [5,6]. Those trees also store carbon in their biomass and increase carbon sequestration [7,8]. In this way, agroforestry contributes to the mitigation of climate change and has been listed as a major land-based carbon removal technique [8]. An expansion of agroforestry systems does not replace ongoing land uses, so conflicts over land that may occur in the context of afforestation projects are less likely to be instigated. Therefore, IPCC [9,10] listed agroforestry among the land management practices that substantially contribute to climate change mitigation, while not compromising food supply.
In a large number of contexts, trees on farms help to increase crop yields, mainly because the microclimate is improved [11]. Windspeed and evapotranspiration are reduced, while temperature extremes are moderated [12]. Therefore, agroforestry, especially in arid or semi-arid regions, contributes to climate change adaptation as well. In particular, tree windbreak systems do reduce wind speed, which substantially reduces evapotranspiration and water consumption of agriculture in drylands [12,13,14,15,16,17].
Tree windbreaks are the major agroforestry system in Central Asia, in particular across the irrigated agriculture of that region. According to the definition of agroforestry [4], such trees were planted along field boundaries with a clear purpose to reduce the wind speed and provide timber in a forest poor region. The cropland in Kyrgyzstan, Tajikistan, Turkmenistan, and Uzbekistan is significantly dependent on irrigation, due to the arid climate in the cropland regions of those countries. According to FAOSTAT [18], in Kyrgyzstan and Tajikistan, 69% and 87% of the cropland are irrigated, respectively. In Turkmenistan and Uzbekistan, more than 95% of all cropland is equipped with irrigation. As the source for the irrigation water are the rivers, that cropland is concentrated along those rivers, with the Amu Darya, Syr Darya, Chui, Ili, and Talas being the major ones. In Kazakhstan, irrigated land is concentrated in the southern part of the country, which are the provinces Almaty, Zhambul, and South Kazakhstan as well as Qyzylorda along the Syr Darya River.
Tree lines along field boundaries, which actually serve as tree windbreaks, have a long tradition across Central Asia. Those tree lines mainly consisted of Populus nigra trees. During the period of the Soviet Union, tree windbreaks were strongly promoted [13,14,19,20]. After the collapse of the Soviet Union, trade between the Republics was largely interrupted; especially energy supply to rural communities dropped severely. Therefore, substantial parts of the tree windbreaks were felled, because people needed to use wood as fuel. Today, this pressure on tree windbreaks has decreased across Central Asia, most prominently in Kazakhstan and Turkmenistan, countries that have large gas and oil reserves and were able to provide gas to rural areas faster than the other countries [21]. Farmers’ perception of tree windbreaks and willingness to establish them anew differs between communities and ranges from unwillingness to establish such tree windbreaks in some communities to acceptance by a majority of farmers in other villages, who believe there to be lots of benefits from tree windbreaks [22].
In the Central Asian climate, tree windbreaks reduce the crop water consumption and the whole systems of crops with tree windbreaks consume less water than crops without tree windbreaks [17]. The total income from systems of crops with tree windbreaks over longer time periods was found to be higher than the income from crops without tree windbreaks over the same time period [23]. These findings suggest that tree windbreaks should be restored and expanded across the countries of Central Asia, which is in line with political strategies of the countries, such as strategies in the field of green economy, forest restoration and sustainable land use, as well as the commitments under the Bonn Challenge, as reviewed in UNECE/FAO [21].
All five countries of Central Asia are forest poor countries, with forest covers below 10% [24] and must import large quantities of wood to meet their demand for timber and fuel wood. Trees on farms could contribute to domestic wood harvest and help to meet domestic wood demand. Against this background, this study aims at exploring the potential of tree windbreak systems as the major agroforestry system in the region of Central Asia to contribute to domestic wood production. Thereby, this study aims at assessing the potential amounts of timber and fuel wood that could be harvested sustainably from tree windbreak systems of the dominant P. nigra cultivars, if they were established across all available cropland under irrigated agriculture. So, the result of this study will mark an upper limit of timber and fuel potentially harvested from tree windbreaks, which may provide insights into the opportunities for the region of Central Asia offered by agroforestry.

2. Materials and Methods

This study refers to the irrigated cropland across Central Asia. Geographically, the whole area of Kyrgyzstan, Tajikistan, Turkmenistan, and Uzbekistan was included. From Kazakhstan, only the regions Almaty, Zhambul, South Kazakhstan, and Qyzylorda were included, because the regions further north and west do not have substantial cropland areas equipped with irrigation systems. Within this geographical region, only croplands in plains or valleys were included, while croplands on sloping lands (slope > 5°) were excluded, as such cropland usually is not equipped with irrigation systems. Xinjiang and Mongolia, which culturally and from the climate and ecological point of view belong to Central Asia, were not included in this study.

2.1. Mapping of Cropland under Irrigated Irrigation and Calculating the Length of Potential Tree Windbreaks

As a first step, the cropland, which was presumably under irrigated agriculture, was digitized manually from Landsat OLI satellite images from the growing season 2019. Afterwards, these cropland areas, broken down by countries and provinces, were intersected with line shape files, which resembled square shaped grids with grid cells of 1000 m × 1000 m, 500 m × 500 m, and 200 m × 200 m, respectively. Later, these different grids are referred to as the 1000 m grid, 500 m grid, and 200 m grid. The digitizing work was performed in Q-GIS (version 3.4, https://www.qgis.org/en/site/forusers/visualchangelog34/index.html, accessed on 24 May 2022), while the intersections and calculation of the line lengths were carried out in GRASS GIS (version 7.8, https://grass.osgeo.org/news/2019_09_15_grass_gis_7_8_0_released/, accessed on 24 May 2022).
From each Landsat tile, the cropland was digitized in spring (May–June) and summer (Aug to Sep), in order to accommodate for winter wheat and barley, which are harvested in June, and other crops, such as maize, cotton, and rice, which are harvested during late summer and autumn. The normalized vegetation index (NDVI) was calculated for each Landsat image, in order to separate cropland, which was cropped during 2019, from the cropland, which was left fallow at least during 2019. The NDVI was calculated as follows:
N D V I = N I R R E D N I R + R E D
NDVI—normalized vegetation index; NIR—near infrared (channel 5 of Landsat OLI); RED—visible red (channel 4 of Landsat OLI)
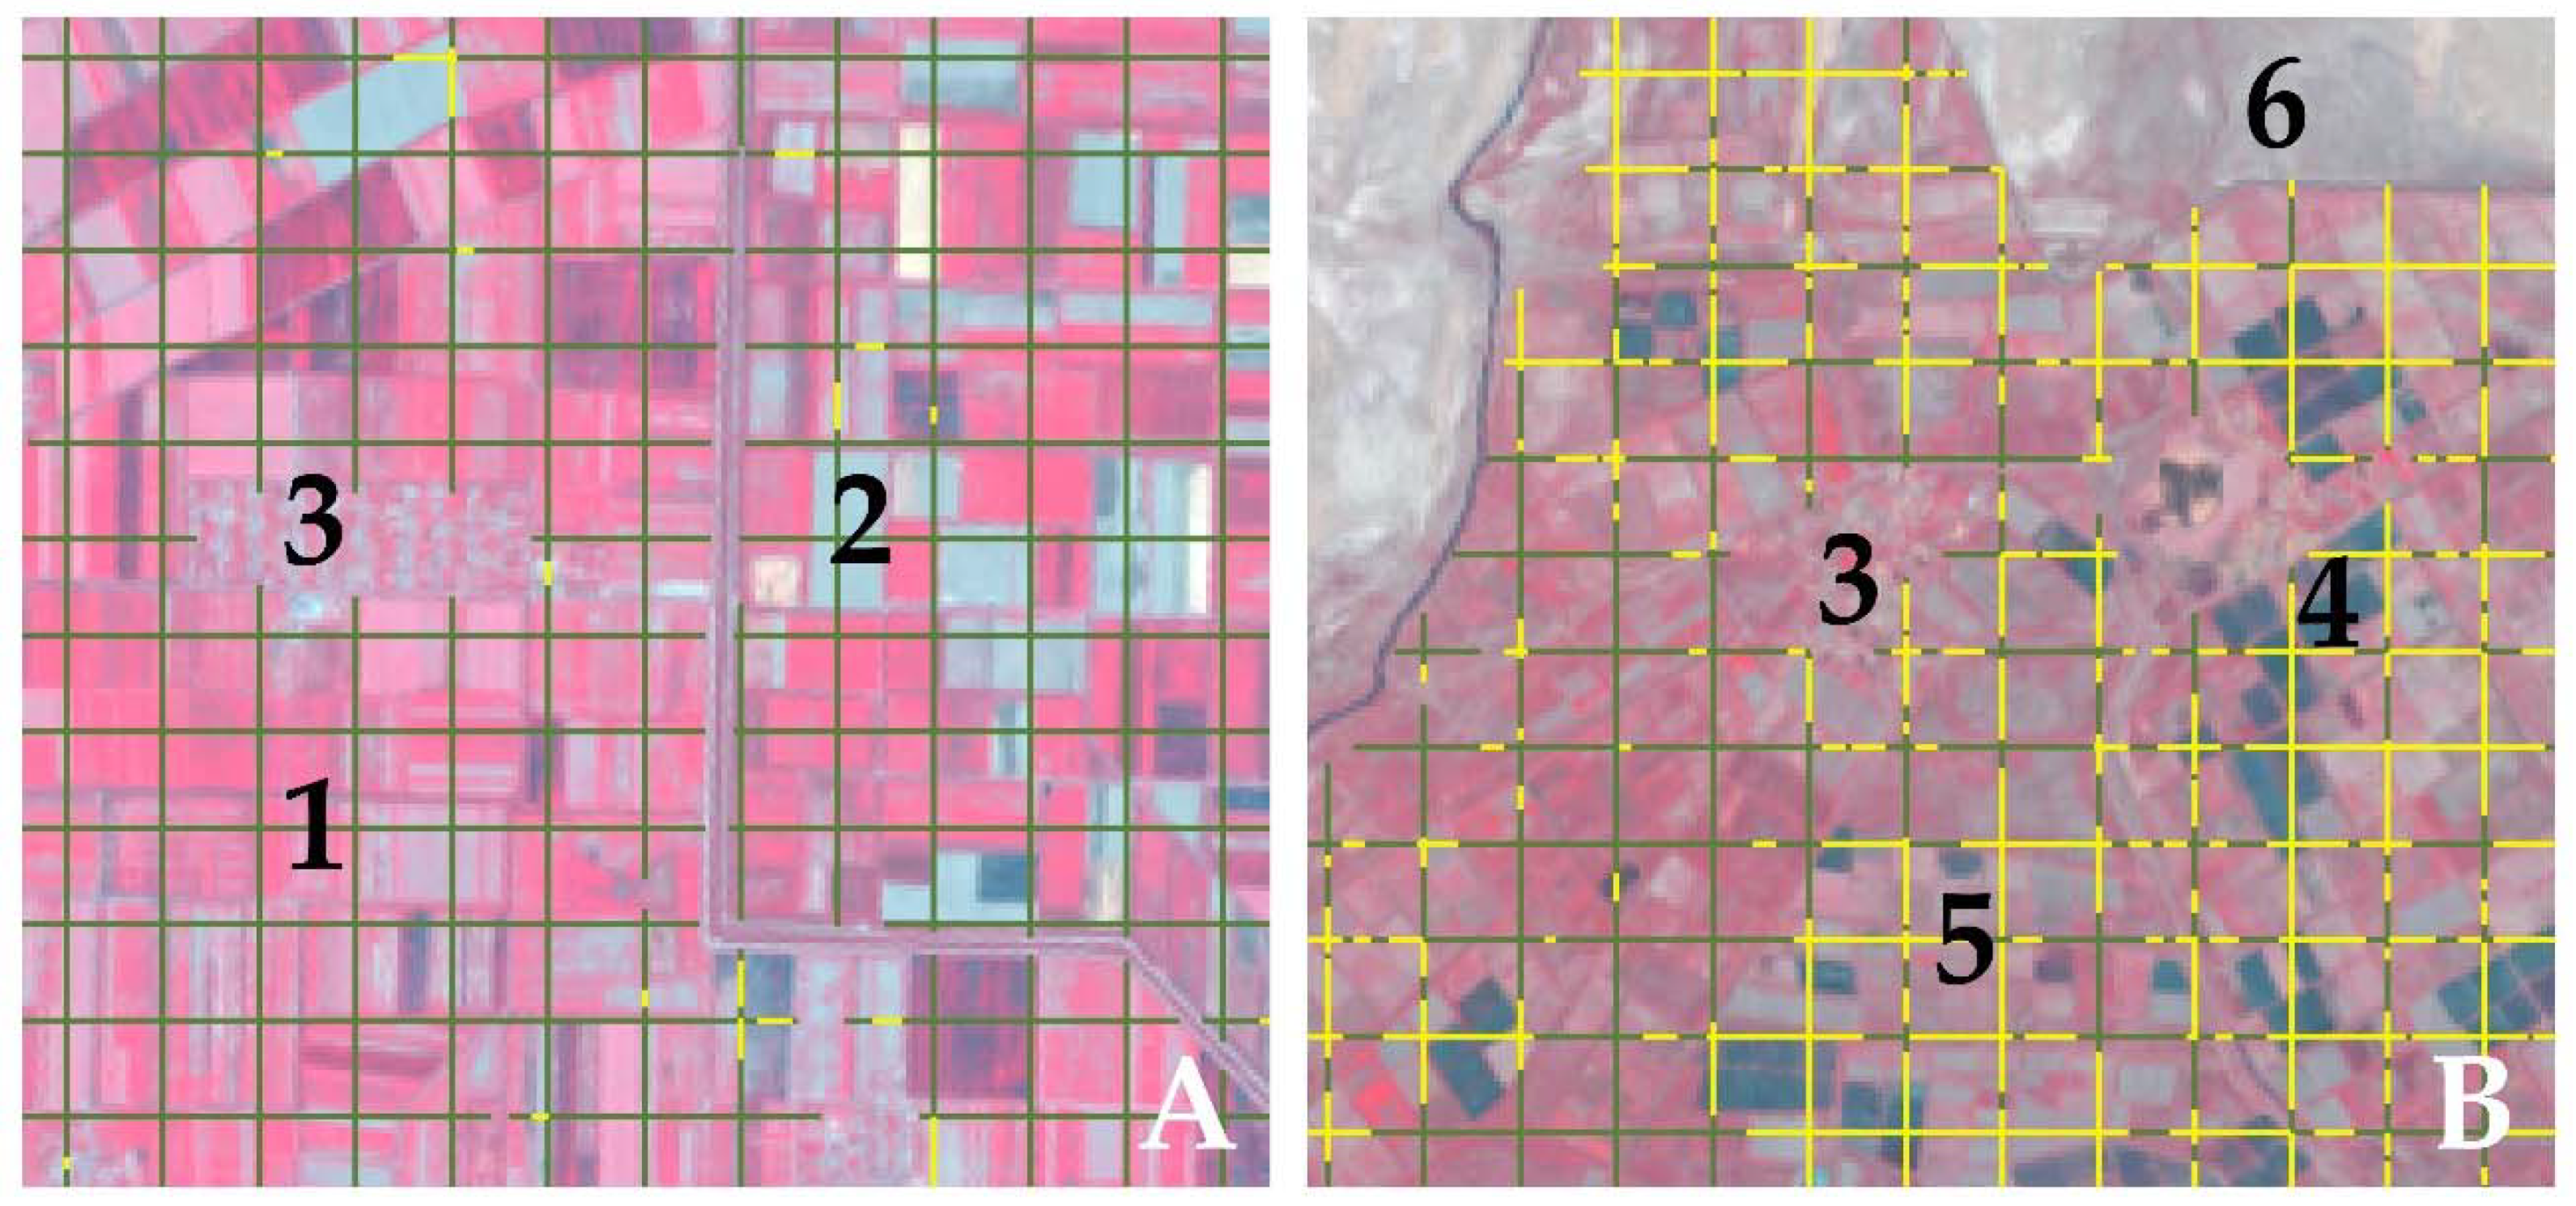
The cropland, where the maximum NDVI was 0.2 and larger during 2019, was considered active cropland, which had been planted in 2019, while the remaining cropland was assumed to be fallow during 2019 (inactive cropland), as shown in an example in Figure 1.
The potential tree windbreaks were simulated as line shapes with lines in the north–south and east–west direction, 1000 m, 500 m, or 200 m apart from each other, respectively. These line shapes were intersected with the active and the inactive cropland areas. Thus, the lines were cut back so that only those lines within respective cropland areas remained. Those lines resembled tree windbreaks under the assumption that each patch of cropland under irrigated agriculture across Central Asia was planted with tree windbreaks (Figure 1). Finally, the total lengths of those lines were calculated and aggregated by active versus inactive cropland and by province.

2.2. Calculation of Tree Numbers and Wood Volumes

Previous studies on tree windbreaks found that single tree rows of poplars, mainly the local P. nigra cultivar Mirza Terek, with an average of 116 trees per 100 m, had become the most common across the study region [17,23]. This study adopted that type of tree windbreaks and accordingly the tree density of 116 trees per 100 m was used to calculate the number of trees from the lengths of tree windbreaks. The number of trees was multiplied by the average timber and wood volume per tree to calculate the total volumes of all tree windbreaks, as is explained below.
In local markets, trees with a diameter at breast height (DBH) between 22 cm and 27 cm form the most common trading class [23]. Therefore, trees of that DBH range were used for further timber and wood volume calculations. Obviously, depending on the local climate, trees need longer or shorter time periods to attain that DBH class, which results in different rotation times.
The main difference in the local climates is the length of the growing season and winter and summer temperatures. As this study focusses on tree windbreaks in irrigated agriculture, no differences in water supply from precipitation were assumed, but sufficient water supply from irrigation. The length of the growing season was defined as the number of months with an average monthly air temperature of at least 5 °C (Table 1). The monthly average air temperatures were collected from [25].
The tree data set in the Supplementary Materials (Table S1), which contains tree data of 728 poplar trees (mainly the Populus nigra cultivar Mirza Terek) from tree windbreaks across the Ferghana Valley (Jalalabad Province), Chui Valley, and Issy Kul Province from the years 2016 to 2018, delivered the data to calculate the volumes of timber and other wood, as well as the rotation time for the potential tree windbreaks on the cropland across Central Asia’s irrigated agriculture.
That data set contains DBH, tree height, stem volume, timber volume, other wood volumes, and tree age data. Tree height and DBH were measured in the field. Tree ages were determined from tree cores and farmers’ statements. A subset of 31 trees was cut down to determine the form factor and the stem and wood volume. The stem volume was determined as the sum of the partial volumes of 1 m long stem sections. That stem volume served as the input to calculate the form factor, which is the ratio of the stem volume divided by the volume of a cylinder of the DBH and the tree height (Equation (2)). The average of those individual form factors (f = 0.421) was used to calculate the stem volume of all other trees on the data set (Table S1).
f = V D B H 2 2 π   h
f—form factor; V—stem volume (measured); DBH—diameter at breast height; h—tree height
The stem and all branches of the trees that had been felled were separated into fractions of >5 cm diameter, 2–5 cm diameter, and <2 cm diameter and weighed to record the field fresh weight. A subsample of each fraction was oven-dried to determine the oven dry weight, its conversion factor from the field fresh weight to oven-dry weight, and to measure the wood density. All field fresh weights were converted into oven-dry weights and divided by the wood density, which yielded the volumes of each fraction. The bark thickness was measured at the DBH height, which allowed us to calculate the diameter of the stem wood at the DBH height and consequently the wood volume of the stem. The timber volume in this study refers to the stem volume without bark of the stem section that is thicker than 5 cm. According to farmers’ information, that fraction of the stems was actually used in house construction and to manufacture furniture or household items. The branches and the remaining stem were used as fuel wood. Accordingly, those fractions of the felled trees were considered as other wood. The average ratio between timber volume and the volume of other wood was used to calculate the volume of other wood for all other trees on the data set.
Finally, all trees that fell into the DBH range of 22 cm to 27 cm, i.e., the size at which trees are cut and traded, were extracted from that tree data set (Table S1) and separated by their origin from Jalalabad, Chui, and Issyk Kul Province, respectively, to calculate the average DBH, tree height, stem volume, timber volume, other wood volume, and average tree age by province. The average volumes of timber and other wood of those three tree groups divided by the respective average tree age yielded the annual timber and wood increment by Jalalabad, Chui, and Issyk Kul Province, respectively. This annual increment summed up over all tree wind breaks of each of the provinces was taken as the maximum amount of timber and wood that can be harvested. The trees from those three provinces grow under different climatic conditions, as the length of the growing season is nine months in Jalalabad, seven months in Chui, and five months in Issyk Kul Province (Table 1). Finally, these data from Jalalabad, Chui, and Issyk Kul Province were used to calculate the volumes and annual increments of timber and other wood of all other provinces of the study region. Thereby, the data of Jalalabad, Chui, and Issyk Kul Province were assigned to the other provinces with a growing season of ≥9 months, 7–8 months, and ≤6 months, respectively (Table 1).
The results from the timber and wood volume calculations as described above delivered a theoretical upper limit of the amount of wood resources that can be accrued from tree windbreaks, because not all cropland will be planted with tree windbreaks. Ruppert et al. [22] found that on average, 26% of farmers had a positive perception of tree windbreaks across different regions of Kyrgyzstan. For a more realistic assessment of the timber and wood volumes that can be delivered by tree windbreaks, the theoretical maxima of tree windbreak length, number of trees, timber volume, and wood volume were multiplied by 0.26 to obtain the corresponding numbers, which is named “current adoption” herein after in this study. The assumption behind “current adoption” was that according to the current farmers’ perception, 26% of the potential tree windbreaks actually would become tree windbreaks. Countries’ policies or an increasing demand for domestically produced wood have the potential to increase the number of farmers who eventually plant tree windbreaks so that another set of tree windbreak length, number of trees, timber volume, and wood volume was calculated, under the assumption that 50% of the potential tree windbreaks would be realized, which is named “optimistic adoption” further on in this study.

3. Results

3.1. Tree Data

For this study, trees with DBH between 22 cm and 27 cm were chosen for further volume calculations. Trees within this DBH range, but from different growing season lengths, are introduced in Table 2 with regard to their tree height, DBH, tree age, as well as stem, timber, wood volume. The figures of the timber volume (wood volume of stem parts with diameter >5 cm), other wood, and tree age were used to calculate the potential annual timber and other wood harvests (cf. Section 3.4).

3.2. Cropland Area of Irrigated Agriculture

The cropland area of irrigated agriculture was largest in Uzbekistan with 5.4 million ha, followed by Turkmenistan with 2.7 million ha, Kazakhstan with 2.6 million ha, Kyrgyzstan with 1 million ha, and Tajikistan with 0.75 million ha (Table 3).
With respect to the active cropland area, which was the cropland, where the NDVI peaked with at least ≥0.2 during the growing season 2019, the countries ranked the same. Only Turkmenistan had much less active cropland, 1.5 million ha, than Kazakhstan with 2.2 million ha (Table 3). Regions further downstream along the rivers had larger shares of inactive cropland compared to regions further upstream. As a whole country, inactive cropland covered 45% of the total cropland area in Turkmenistan, and in Uzbekistan, for the regions Karakalpakstan and Kashkadarya, the inactive cropland accounted for 32% of the total cropland each. In contrast, the Tashkent region in Uzbekistan only had a share of 2% inactive cropland and Kyrgyzstan as a whole country only 11%.

3.3. Length of Potential Tree Windbreaks and Number of Trees

The potential length of tree windbreaks, if planted across all active cropland under irrigated agriculture in Central Asia, so the theoretical maximum, amounted to 199,000 km, 398,000 km, and 994,000 km under a 1000 m grid, 500 m grid, and 200 m grid, respectively (Table S2). These numbers would increase to 251,000 km, 502,000 km, and 1,254,000 km, respectively, if the inactive cropland was added to the active cropland (Table S2). These potential tree windbreak lengths corresponded to 231 million, 461 million, and 1153 million trees across all active cropland under irrigated agriculture in Central Asia under a 1000 m grid, 500 m grid, and 200 m grid, respectively. The number of trees would increase to 291 million, 582 million, and 1455 million trees, respectively, if the potential of the inactive cropland was added (Table S2). The numbers of this theoretical maximum are listed in Supplementary Table S2 by country and province.
The tree windbreak lengths under current adoption, which is 26% of the theoretical maximum, are listed in Table 4 by country and the different grid sizes. By country, Uzbekistan harbored almost half of Central Asia’s potential length of tree windbreaks on active cropland, followed by Kazakhstan, Turkmenistan, Kyrgyzstan, and Tajikistan. This ranking corresponds to the cropland area of those countries. Corresponding to the tree windbreak lengths, Uzbekistan harbored almost half of all those trees of Central Asia’s potential tree windbreaks on active cropland. Under the current adoption, there were (rounded to thousands) 52,000 km, 103,000 km, and 120,000 km of tree windbreaks across the active cropland under a 1000 m grid, 500 m grid, and 200 m grid, respectively (Table 4). The tree windbreak lengths and corresponding tree numbers by country and province are listed in the Supplementary Table S3 for current adoption and Table S4 for the optimistic adoption.

3.4. Timber and Wood Volume from Tree Windbreaks

The theoretical maximum of the timber volume of tree windbreaks, if planted across all active cropland under irrigated agriculture in Central Asia in a 1000 m grid, 500 m grid, and 200 m grid, summed up to 73.8 million m3, 156.2 million m3, and 390 million m3, respectively (Table S2). Those numbers shrunk to 19.1 million m3, 40.6 million m3, and 101 million m3, respectively, under calculations of current adoption (Table 5).
The theoretical maximum of annual timber harvest from tree windbreaks with a harvesting rate of 100% of the total harvestable volume in m3 across the active cropland was 5.6, 11.3, and 28.1 million m3 per year for Central Asia as a whole, if we look at 1000 m, 500 m, and 200 m tree windbreak grids, respectively (Table S2). In this table, the numbers divided by countries and provinces are also listed. The calculations for an optimistic adoption resulted in annual timber volumes of half the numbers above (Table S4), while the current adoption (adoption rate of 26%) resulted in 1.5, 2.9, and 7.3 million m3 per year, respectively (Table 6 and Table S3).
Among the provinces, the smallest annual timber amounts were calculated for the mountainous provinces Gorno-Badakhshan in Tajikistan and Naryn in Kyrgyzstan, where the cropland area is small and which have the shortest growing seasons. Evidently, cities were also among the administrative units with the smallest annual timber amounts.
The annual volume of other wood, i.e., branches, twigs, and stem parts smaller than 5 cm in diameter (current adoption), from the active cropland across Central Asia was 0.1, 0.2, and 0.5 million m3 per year for a 1000 m, 500 m, and 200 m grid, respectively (Table 6 and Table S3).

4. Discussion

The tree data that were used in this study (Table 2) are in the same range as the tree data of poplars in other agroforestry systems. A study in India [26] reported timber volumes of poplars with a DBH of 24 cm. The timber volumes were 0.341 m3 and 0.415 m3, of trees with heights of 18 m and 22 m, respectively. Timber volumes without bark were 0.282 m3 and 0.313 m3 for trees of 18 m and 20 m height, respectively. The data published by Rizvi et al. [27], also from India, report that poplar trees in agroforestry systems with a DBH of 21.70–27.45 cm and tree heights of 20.13–24.30 m have timber volumes of 0.224–0.353 m3. Those volumes are in the same range as the data that were used in this study. Seventeen-year-old P. × canadensis trees in a plantation in Jiangsu, China [28], reached a DBH of 24.2 cm to 27.2 cm, with tree heights of 21.3 m to 22.4 m. This corresponds to trees from areas with a growing season of 9 months and longer, which matches with the growing season in Jiangsu. A DBH of 24.6 cm corresponded with a stem volume of 0.47 m3, which is larger than the trees of this study. This difference might be explained by differences between the poplar species P. nigra, which was the dominant one in this study, and P. × canadensis.
The cropland area, as was digitized for this study, is similar to data on irrigated cropland by FAOSTAT [18] (Table 3 and Table 7). For Kyrgyzstan, the numbers of digitized cropland and reported cropland are very close. For Kazakhstan, the area of active cropland, as digitized for this study, matches with the area equipped with irrigation as reported by FAOSTAT [18], while the total digitized area is much larger. This difference can be partly explained by inactive cropland areas in the Almaty and Zhambul provinces, which met the criteria for the digitizing and selection afterwards, but today are no longer equipped with irrigation systems, and therefore have not been reported to FAO. The same applies to Uzbekistan, where cropland that had been irrigated during the Soviet Union period was abandoned after independence, due to salinization and dropping water supply from the Amu Darya River. It is possible that those areas are no longer reported to FAOSTAT.
For Uzbekistan, the annual timber harvest from a 1000 m tree windbreak grid under the calculations for current adoption was slightly more than twice the current annual roundwood production and imports of the country, as published by FAOSTAT [18] in Table 8. In Kyrgyzstan, the tree windbreaks with 1000 m spacing would provide the same amount of timber volume as the current domestic production and imports together. In Kazakhstan, the annual timber harvest from a 500 m tree windbreak grid met the current roundwood production of the country [18]. Therefore, in those three countries, tree windbreaks already at the wider spacings of 1000 m and 500 m, respectively, and under the current adoption can deliver wood resources domestically as a raw material for wood-based value chains, ranging from construction material for housing to applications from the field of bioeconomy, such as the production of cellulose, fiber, and other chemicals, while reducing pressure on forests for domestic timber production and potentially reducing the need for timber and wood imports. Tree windbreaks with spacing of 500 m (current adoption) would provide about twice the current roundwood production and import of Kyrgyzstan and about 4.5-times the current roundwood production and import of Uzbekistan. Such substantial contributions can be expected for Tajikistan and Turkmenistan as well. Evidently, a higher adoption rate and, even on parts of the cropland, establishment of tree windbreaks with 200 m spacing would result in higher amounts of domestic wood production. Further potential to increase the annually available timber and wood volume lies in introducing poplar cultivars, which have been developed more recently compared to the currently dominant cultivar Mirza Terek. In particular, P. deltoides × nigra and P. nigra × maximoviczii cultivars were shown to have a substantially higher growth potential than Mirza Terek [29]. This high potential of agroforestry systems to deliver domestic timber and other wood resonates with the outcomes of agroforestry adoption in India. There, an estimated 65% of the country’s timber and almost half of its fuel wood come from trees grown on farms [30,31].
While the assessment of agroforestry potential above was based on the locally dominant cultivar Mirza Terek, a P. nigra cultivar, to keep the calculations simple, there are good reasons to argue for more diversity in the tree species used. On the one hand, using the same species, or possibly the same clone or variety, makes the agroforestry system vulnerable to calamities or the impacts of climate change. From an ecological point of view, using locally adapted cultivars of poplar and other tree species should be favored. Even if the growth rate might be lower than with poplars as the only tree species, the value of the timber, for example for different construction purposes, can be higher. Such assessments can be built on the findings of this paper to advance the understanding for scientists and practitioners.

5. Conclusions

This study assessed the potential absolute and annually available poplar timber and wood volumes delivered by tree windbreak systems on irrigated cropland across Central Asia. Under the assumptions of an adoption rate of these tree windbreak systems of 26% of the geographically and theoretically possible expansion, tree windbreak systems deliver wood resources that exceed the levels of current production and imports. Therefore, tree windbreaks offer great untapped potential to deliver wood resources domestically as a raw material for wood-based value chains (e.g., construction material for housing), but also for further value chains in the field of bioeconomy, such as the production of cellulose, fiber, and other chemicals. Next to wood as a raw material, tree windbreaks deliver co-benefits, such as improving the local climate, which favors crop production. Research is needed to further assess farmers’ perceptions and willingness to plant and manage shelterbelts, as well as analyzing the current processing capacities in the timber-based value chains. In addition, future climate conditions may pose a challenge to the agroforestry systems, despite their water saving capacity. From an ecological point of view, the use of a single tree species can pose risks; thus, studies on the potential of other locally adapted species are needed.

Supplementary Materials

The following supporting information can be downloaded at: https://www.mdpi.com/article/10.3390/f13081193/s1, Table S1: Poplar tree data from Ferghana Valley, Chui Valley, and Issyk Kul. Table S2: Tree wind break length, number of trees, timber and wood volumes, theoretical maximum; 100% of all potential tree wind breaks are realized. Table S3: Tree wind break length, number of trees, timber and wood volumes under current adoption; 26% of all potential tree wind breaks are realized. Table S4: Tree wind break length, number of trees, timber and wood volumes, theoretical maximum; 50% of all potential tree wind breaks are realized.

Author Contributions

Conceptualization, N.T.; methodology, N.T.; validation, K.A., D.Y. and G.E.; formal analysis, N.T.; investigation, K.A., B.E. and N.T.; data curation, B.E., K.A. and N.T.; writing—original draft preparation, N.T. and M.W.; writing—review and editing, M.W.; visualization, N.T. All authors have read and agreed to the published version of the manuscript.

Funding

In 2020, during the investigation and data curation, N.T.’s position as an integrated expert at World Agroforestry was co-funded by BMZ as part of the Center for International Migration and Development (CIM) program. During 2022, the workload was funded by VEGERA. The APC was funded by VEGERA—Improving energy efficiency in the building sector through the use of renewable raw materials from agroforestry systems (International Climate Initiative, 2021–2024).

Acknowledgments

We thank the student interns, who contributed to the digitizing work.

Conflicts of Interest

The authors declare no conflict of interest.

References

  1. Jose, S. Agroforestry for ecosystem services and environmental benefits: An overview. Agrofor. Syst. 2009, 76, 1–10. [Google Scholar] [CrossRef]
  2. Mbow, C.; Smith, P.; Skole, D.; Duguma, L.; BustaMante, M. Achieving mitigation and adaptation to climate change through sustainable agroforestry practices in Africa. Curr. Opin. Environ. Sustain. 2014, 6, 8–14. [Google Scholar] [CrossRef] [Green Version]
  3. Torralba, M.; Fagerholm, N.; Burgess, P.J.; Moreno, G.; Plieninger, T. Do European agroforestry systems enhance biodiversity and ecosystem services? A meta-analysis. Agric. Ecosyst. Environ. 2016, 230, 150–161. [Google Scholar] [CrossRef] [Green Version]
  4. FAO. Agroforestry; FAO: Rome, Italy, 2015; Available online: https://www.fao.org/forestry/agroforestry/en/ (accessed on 28 June 2022).
  5. Hardy, K.A.; Thevs, N.; Aliev, K.; Welp, M. Afforestation and Reforestation of Walnut Forests in Southern Kyrgyzstan: An Economic Perspective. Mt. Res. Dev. 2019, 38, 332–341. [Google Scholar] [CrossRef] [Green Version]
  6. Huang, I.Y.; James, K.; Thamthanakoon, N.; Pinitjitsamut, P.; Rattanamanee, N.; Pinitjitsamut, M.; Yamklin, S.; Lowenberg-DeBoer, J. Economic outcomes of rubber-based agroforestry systems: A systematic review and narrative synthesis. Agrofor. Syst. 2022. [Google Scholar] [CrossRef]
  7. de Stefano, A.; Jacobson, M.G. Soil carbon sequestration in agroforestry systems: A meta-analysis. Agrofor. Syst. 2018, 92, 285–299. [Google Scholar] [CrossRef]
  8. Shi, L.; Feng, W.; Xu, J.; Kuzyakov, Y. Agroforestry systems: Meta-analysis of soil carbon stocks, sequestration processes, and future potentials. Land Degrad. Dev. 2018, 29, 3886–3897. [Google Scholar] [CrossRef]
  9. IPCC. Special Report Climate Change and Land; IPCC: Geneva, Switzerland, 2019; Available online: https://www.ipcc.ch/srccl/ (accessed on 10 February 2021).
  10. IPCC. Climate Change 2022: Mitigation of Climate Change; IPCC: Geneva, Switzerland, 2022; Available online: https://www.ipcc.ch/report/ar6/wg3/ (accessed on 7 March 2022).
  11. Kort, J. Benefits of windbreaks to field and forage crops. Agric. Ecosyst. Environ. 1988, 22, 165–190. [Google Scholar] [CrossRef]
  12. Alemu, M.M. Ecological benefits of trees as windbreaks and shelterbelts. Int. J. Ecosyst. 2016, 6, 10–13. [Google Scholar]
  13. Albenskii, A.V.; Kalashnikov, A.F.; Ozolin, G.P.; Nikitin, P.L.; Surmach, G.P.; Kulik, N.F.; Senkevich, A.A.; Kasyanov, F.M.; Pavlovskii, E.S.; Roslyakov, N.V. Agroforestry Melioration; Lesnaya Promyshlennost: Moscow, Russia, 1972. [Google Scholar]
  14. Vasilyev, M.E. Melioration through Forests and Harvest; Kainar: Almaty, Kazakhstan, 1980. [Google Scholar]
  15. Puri, S.; Bangarwa, K.S. Effects of trees on the yield of irrigated wheat crop in semi-arid regions. Agrofor. Syst. 1992, 20, 229–241. [Google Scholar] [CrossRef]
  16. Perry, C.H.; Woodall, C.W.; Liknes, G.C.; Schoeneberger, M.M. Filling the gap: Improving estimates of working tree resources in agricultural landscapes. Agrofor. Syst. 2009, 75, 91–101. [Google Scholar] [CrossRef] [Green Version]
  17. Thevs, N.; Gombert, A.J.; Strenge, E.; Lleshi, R.; Aliev, K.; Emileva, B. Tree Wind Breaks in Central Asia and Their Effects on Agricultural Water Consumption. Land 2019, 8, 167. [Google Scholar] [CrossRef] [Green Version]
  18. FAO. FAOSTAT—Food and Agricultural Data; FAO: Rome, Italy, 2022; Available online: https://www.fao.org/faostat/en/#home (accessed on 10 May 2022).
  19. Stepanov, A.M. Agroforestry Melioration in Irrigated Lands; Agropromizdat: Moscow, Russia, 1987. [Google Scholar]
  20. Schroeder, W.R.; Kort, J. Shelterbelts in the Soviet Union. J. Soil Water Conserv. 1989, 44, 130–134. [Google Scholar]
  21. UNECE/FAO. Forest Landscape Restoration in the Caucasus and Central Asia; Geneva Timber and Forest Discussion Paper, 72. ECE/TIM/DP/72; Forestry and Timber Section: Geneva, Switzerland, 2019; Available online: http://www.unece.org/fileadmin/DAM/timber/publications/DP-72-flr-cca-en.pdf (accessed on 18 June 2019).
  22. Ruppert, D.; Welp, M.; Spies, M.; Thevs, N. Farmers’ Perceptions of Tree Shelterbelts on Agricultural Land in Rural Kyrgyzstan. Sustainability 2020, 12, 1093. [Google Scholar] [CrossRef] [Green Version]
  23. Thevs, N.; Aliev, K. Agro-economy of tree wind break systems in Kyrgyzstan, Central Asia. Agrofor. Syst. 2021, 1–16. [Google Scholar] [CrossRef]
  24. FAO. Global Forest Resources Assessment. Country Reports 2020; FAO: Rome, Italy, 2020; Available online: http://www.fao.org/forest-resources-assessment/fra-2020/country-reports/en/ (accessed on 2 August 2020).
  25. Klimadaten. Available online: https://de.climate-data.org/ (accessed on 2 April 2022).
  26. Dhanda, R.S.; Verma, R.K. Timber volume and weight tables of farm-grown poplar (Populus deltoides Bartr. ex Marsh.) in Panjab (India). Indian For. 2001, 127, 115–130. [Google Scholar]
  27. Rizvi, R.H.; Dhyani, S.K.; Yadav, R.S.; Singh, R. Biomass production and carbon stock of poplar agroforestry systems in Yamunanagar and Saharanpur districts of northwestern India. Curr. Sci. 2011, 100, 736–742. [Google Scholar]
  28. Sun, Y.; Liang, X.; Liang, Z.; Welham, C.; Li, W. Deriving Merchantable Volume in Poplar through a Localized Tapering Function from Non-Destructive Terrestrial Laser Scanning. Forests 2016, 7, 87. [Google Scholar] [CrossRef]
  29. Thevs, N.; Fehrenz, S.; Aliev, K.; Emileva, B.; Fazylbekov, R.; Kentbaev, Y.; Qonunov, Y.; Qurbonbekova, Y.; Raissova, N.; Razhapbaev, M.; et al. Growth Rates of Poplar Cultivars across Central Asia. Forests 2021, 12, 373. [Google Scholar] [CrossRef]
  30. Dev, I.; Ram, A.; Bhaskar, S.; Chaturvedi, O.P. Role of agroforestry in current scenario. In Agroforestry in Climate Resilience and Rural Livelihood; Dev, I., Ram, A., Kumar, N., Singh, R., Uthappa, A.R., Handa, A.K., Eds.; Scientific Publishers: Jodhpur, India, 2019; pp. 1–10. [Google Scholar]
  31. World Agroforestry. India Leads the Way with Agroforestry Policy. Available online: https://www.worldagroforestry.org/news/india-leads-way-agroforestry-policy (accessed on 2 April 2022).
Figure 1. Example for line shapes that simulate tree windbreaks with 500 m spacing with Landsat OLI. Green: lines that intersect active cropland. Yellow: lines that intersect inactive cropland. 1: cropland that was cropped in 2019 with crops that are harvested in autumn (such as maize or cotton), 2: cropland that was cropped in 2019 with crops that are harvested in early summer (such as winter wheat), 3: settlement, 4: flooded paddy rice, 5: cropland rhat was not cropped in 2019 or not well managed so that the NDVI never reached 0.2, 6: desert. Panel (A): example from Tashkent Province, Uzbekistan; Landsat OLI from 20 August 2019. Panel (B): example from Karakalpakstan, Uzbekistan; Landsat OLI from 4 July 2019.
Forests 13 01193 g001
Table 1. Growing season, expressed as number of months with an average air temperature of ≥5 °C, and monthly average air temperature of January and July.
Country/ProvinceGrowing SeasonLength of Growing SeasonMonthly Average Temperature [°C]
(Months)JanuaryJuly
Kazakhstan
AlmatyApril–October7−618.9
QyzylordaMarch–October8−5.728.5
South KazakhstanMarch–November9−0.826.9
ZhambulMarch–October8−3.326
Kyrgyzstan
BatkenMarch–November90.124.4
BishkekApril–October7−3.922.8
ChuiApril-October7−3.922.8
JalalabadMarch–November9−224.6
NarynMay–September5−14.813.3
Osh CityMarch–October8−422.4
OshMarch–October8−422.4
TalasApril–October7−7.419.8
Issyk KulMay–September5−10.814.3
Tajikistan
DushanbeMarch–November9−1.525.1
Gorno-BadakhshanJune–September4−16.712.4
KhatlonFebruary–December114.332.4
KhujandMarch–November92.127.4
Tajikistan TerritoriesMarch–November9−1.525.1
Turkmenistan
AshgabatMarch–November93.230.2
AhalMarch–November93.230.2
BalkanFebruary–November103.432.3
TurkmenabadMarch–October82.433.1
MaryFebruary–December114.631.9
DashagouzMarch–October8−1.630.1
Uzbekistan
AndijanMarch–November90.229.1
BukharaFebruary–November102.631.6
FerghanaMarch–November91.729
JizzakMarch–November91.327.4
KarakalpakstanMarch–October8−2.729.4
KashkadaryaFebruary–November103.429.8
KhorezmMarch–November9−1.430.2
NamanganMarch–November90.730.1
NavoiMarch–November92.329.4
SamarkandMarch–November91.126.4
SyrdaryaMarch–November92.630
SurkhandaryaFebruary–December114.833.6
Tashkent CityMarch–November90.327.9
TashkentMarch–November90.327.9
Table 2. Tree data (average ± standard deviation) from the three groups of different lengths of growing season. Thereby, the initial tree data for the length of growing season of ≥9 months, 7–8 months, and ≤6 months came from the trees with a DBH of 22 cm to 27 cm from Jalalabad, Chui, and Issyk Kul Province, respectively.
Length of Growing Season in Months≥97–8≤6
Tree age [yr]13 ± 417 ± 127 ± 11
Tree height [m]20.2 ± 2.816 ± 1.417 ± 3.2
DBH [cm]24.6 ± 1.724.5 ± 1.524.6 ± 1.5
Stem volume (m3)0.407 ± 0.0770.309 ± 0.0540.341 ± 0.071
Stem volume without bark (m3)0.371 ± 0.0700.281 ± 0.0490.310 ± 0.065
Timber volume (wood volume of stem parts with diameter > 5 cm) (m3)0.361 ± 0.0680.274 ± 0.0480.302 ± 0.063
Other wood volume (branches, twigs, stem with diameter ≤ 5 cm) (m3)0.121 ± 0.0230.092 ± 0.0160.101 ± 0.021
Table 3. Cropland area under irrigated agriculture by country and province.
Country/ProvinceActive Cropland [ha]Inactive Cropland [ha]Total Cropland [ha]
Kazakhstan
Almaty167,24180,942248,183
Qyzylorda1,012,924104,6301,117,554
South Kazakhstan211,17264,313275,485
Zhambul797,161128,228925,389
Total Kazakhstan2,188,498378,1132,566,611
Kyrgyzstan
Batken48,694348352,177
Bishkek2129492178
Chui395,83322,521418,354
Jalalabad129,66761129,728
Naryn31,6173831,655
Osh City30325328
Osh73,710403777,747
Talas90,02340,201130,225
Issyk Kul124,50634,931159,437
Total Kyrgyzstan896,482105,3471,001,829
Tajikistan
Dushanbe2549652614
Gorno-Badakhshan37752834059
Khatlon343,35722,973366,330
Khujand283,86223,336307,198
Tajikistan Territories72,705126173,965
Total Tajikistan706,24747,919754,166
Turkmenistan
Ashgabat434151585
Ahal545,671508,3751,054,046
Balkan48,202164,351212,553
Turkmenabad208,59195,705304,296
Mary340,595159,618500,213
Dashagouz384,573330,325714,898
Total Turkmenistan1,528,0661,258,5262,786,592
Uzbekistan
Andijan256,10911,143267,252
Bukhara303,81643,763347,579
Ferghana344,58726,879371,465
Jizzak612,15149,880662,032
Karakalpakstan446,676210,703657,379
Kashkadarya460,619216,931677,550
Khorezm301,30732,299333,606
Namangan286,75820,930307,688
Navoi181,48819,156200,644
Samarkand414,774109,785524,559
Syrdarya340,61824,658365,275
Surkhandarya266,09831,820297,919
Tashkent City31232573380
Tashkent388,7288341397,069
Total Uzbekistan4,606,853806,5445,413,397
Table 4. Length of tree windbreaks by country under assumption of 1000 m, 500 m, and 200 m grids, current adoption (26% of the potential tree windbreaks realized).
CountryPotential Length of Tree Windbreaks (1000 km) on:
Active CroplandInactive CroplandTotal Cropland
1000 m grid
Kazakhstan11.42.013.4
Kyrgyzstan4.70.65.2
Tajikistan3.70.23.9
Turkmenistan7.96.614.5
Uzbekistan24.04.228.2
Total Central Asia51.713.565.2
500 m grid
Kazakhstan22.83.926.7
Kyrgyzstan9.31.110.4
Tajikistan7.40.57.9
Turkmenistan15.913.129.0
Uzbekistan48.08.456.4
Total Central Asia103.427.0130.4
200 m
Kazakhstan56.99.866.8
Kyrgyzstan23.32.726.1
Tajikistan18.41.219.6
Turkmenistan39.832.872.5
Uzbekistan120.021.0141.0
Total Central Asia258.467.6326.0
Table 5. Timber volume (standing) under 1000 m, 500 m, 200 m grids by country (million m3), current adoption (26% of the potential tree windbreaks realized).
CountryTimber Volume (Standing) (Million m3) on:
Active CroplandInactive CroplandTotal Cropland
1000 m grid
Kazakhstan4.20.74.9
Kyrgyzstan0.50.10.6
Tajikistan1.50.11.6
Turkmenistan32.55.6
Uzbekistan9.91.711.5
Total Central Asia19.15.124.3
500 m grid
Kazakhstan8.51.49.9
Kyrgyzstan3.20.43.6
Tajikistan3.10.23.3
Turkmenistan6.15.111.2
Uzbekistan19.73.323
Total Central Asia40.610.350.9
200 m
Kazakhstan21.13.524.6
Kyrgyzstan8.20.99.1
Tajikistan7.70.58.2
Turkmenistan15.312.728
Uzbekistan49.28.357.5
Total Central Asia10126127
Table 6. Timber volume per year, volume of other wood per year, and total wood volume per year under 1000 m, 500 m, 200 m grids by country (million m3), current adoption (26% of the potential tree windbreaks realized).
CountryTimber Volume per Year (1000 m3 yr−1)Volume of Other Wood per year (1000 m3 yr−1)Total Volume per Year (1000 m3 yr−1)
Active CroplandTotal CroplandActive CroplandTotal CroplandActive CroplandTotal Cropland
1000 m grid
Kazakhstan2893342023309357
Kyrgyzstan9710767103114
Tajikistan118126910127135
Turkmenistan2163991629232428
Uzbekistan7458665665801931
Total Central Asia1465183110713315721965
500 m grid
Kazakhstan5786684046618714
Kyrgyzstan1952141213207227
Tajikistan2362521819254272
Turkmenistan4337983158465856
Uzbekistan1486172811313115991859
Total Central Asia2928366121426731423927
200 m grid
Kazakhstan1442166810011515421783
Kyrgyzstan4865343033516567
Tajikistan5906304548636679
Turkmenistan108319967814411612140
Uzbekistan3716432228232639984649
Total Central Asia7317915153566778539818
Table 7. Cropland under irrigated agriculture as digitized within this study and irrigated cropland according to [18].
CountryActive Cropland [1000 ha] as DigitizedTotal Cropland [1000 ha] as DigitizedCropland Equipped with Irrigation [18] [1000 ha]Cropland Actually Irrigated [18] [1000 ha]
Kazakhstan2188256722041779
Kyrgyzstan89610021023934
Tajikistan706754822747
Turkmenistan152827871995
Uzbekistan460754134306
Table 8. Annual production, import, and export of roundwood and annual fuel wood production, all in 1000 m3, for the five countries of Central Asia [17].
CountryYearRoundwood, ProductionRoundwood, ImportRoundwood, ExportFuel Wood, Production
Kazakhstan20153401370241
202049613819.3303
Kyrgyzstan201545.95.2036.6
202045.940.115.236.6
Tajikistan2015360015.903600
202036742.90.163674
Turkmenistan201501300
20201038.4010
Uzbekistan2015342830.5524
202023.72950.1317.7
Publisher’s Note: MDPI stays neutral with regard to jurisdictional claims in published maps and institutional affiliations.

