
Bar-HRM for Species Confirmation of Native Plants Used in Forest Restoration in Northern Thailand


Abstract
:1. Introduction
2. Materials and Methods
2.1. Plant Samples and DNA Extraction
2.2. Data Mining
2.3. Simulated High-Resolution Melting Analysis
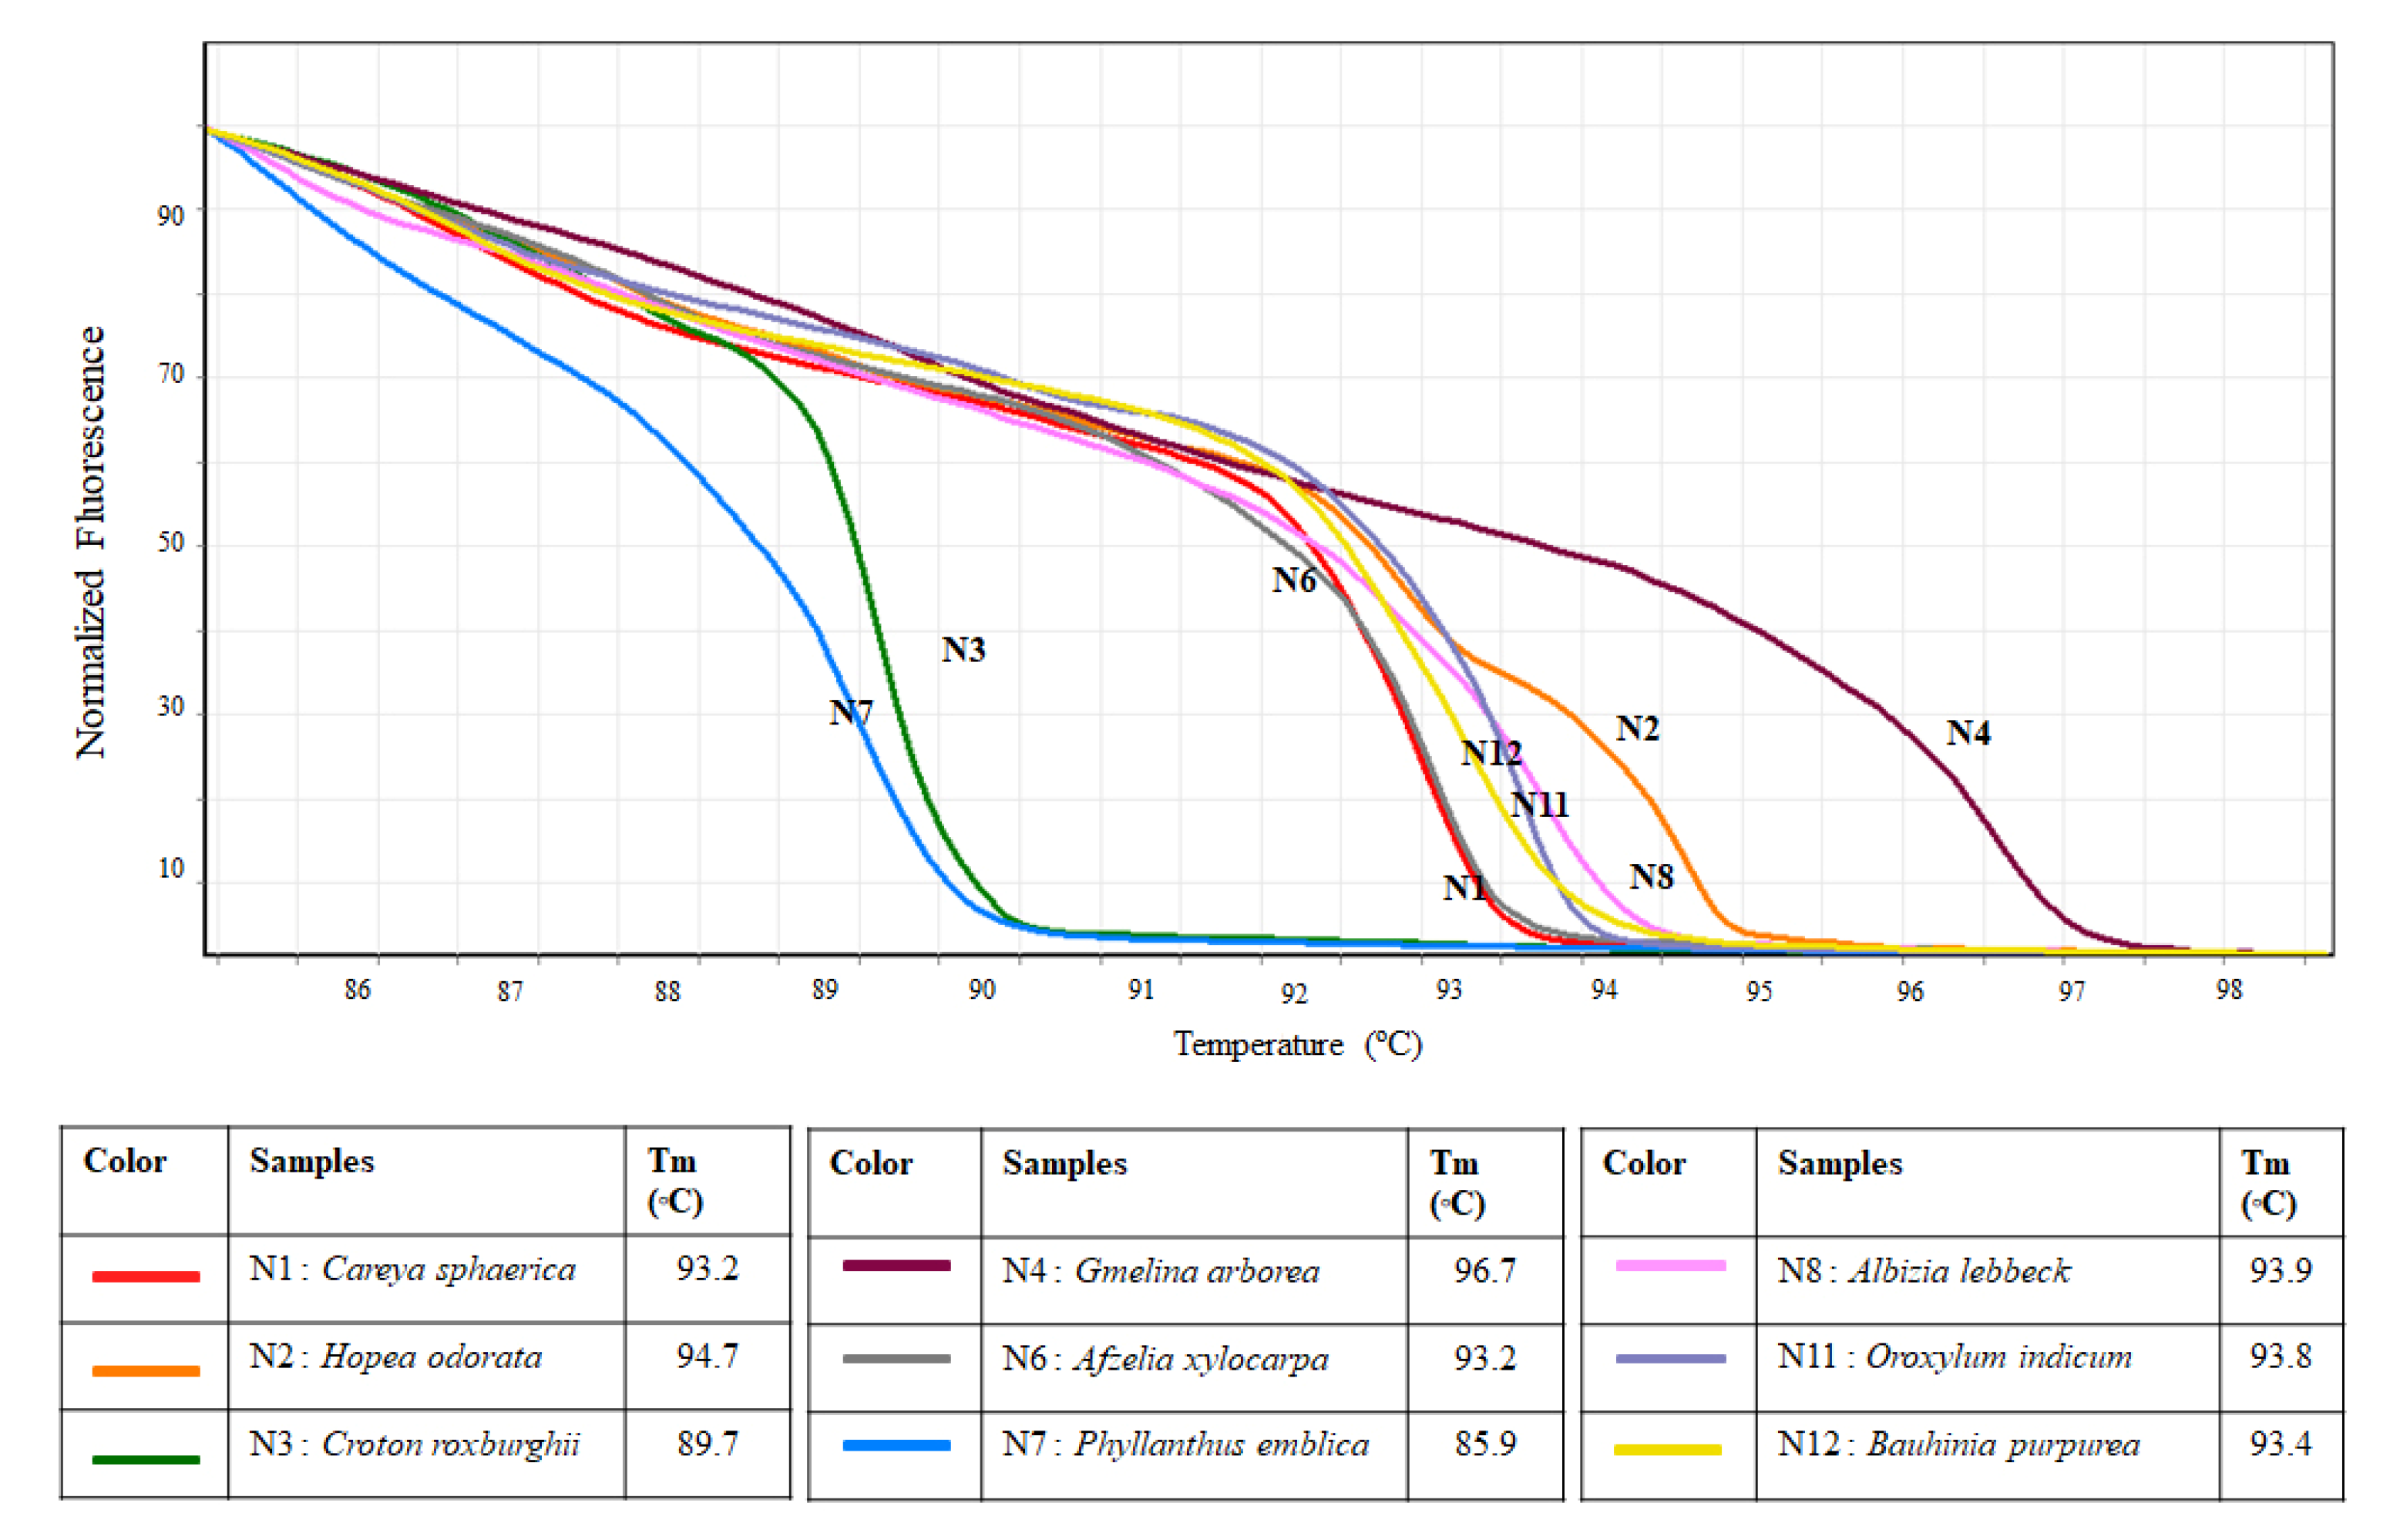
2.4. In Vitro High-Resolution Melting Analysis
3. Results
4. Discussion
5. Conclusions
Author Contributions
Funding
Data Availability Statement
Acknowledgments
Conflicts of Interest
References
- Bierregaard, R.O., Jr.; Lovejoy, T.E.; Kapos, V.; dos Santos, A.A.; Hutchings, R.W. The biological dynamics of tropical rainforest fragments: A prospective comparison of fragments and continuous forest. BioScience 1992, 42, 859–866. [Google Scholar] [CrossRef]
- DeFries, R.; Hansen, A.; Newton, A.C.; Hansen, M.C. Increasing isolation of protected areas in tropical forests over the past twenty years. Ecol. Appl. 2005, 15, 19–26. [Google Scholar] [CrossRef] [Green Version]
- Stibig, H.J.; Achard, F.; Carboni, S.; Rasi, R.; Miettinen, J. Change in tropical forest cover of Southeast Asia from 1990 to 2010. Biogeosciences 2014, 11, 247–258. [Google Scholar] [CrossRef] [Green Version]
- Achard, F.; Eva, H.D.; Stibig, H.J.; Mayaux, P.; Gallego, J.; Richards, T.; Malingreau, J.P. Determination of deforestation rates of the world’s humid tropical forests. Science 2002, 297, 999–1002. [Google Scholar] [CrossRef] [Green Version]
- Sodhi, N.S.; Posa, M.R.C.; Lee, T.M.; Bickford, D.; Koh, L.P.; Brook, B.W. The state and conservation of Southeast Asian biodiversity. Biodivers. Conserv. 2010, 19, 317–328. [Google Scholar] [CrossRef]
- Miettinen, J.; Shi, C.; Liew, S.C. Deforestation rates in insular Southeast Asia between 2000 and 2010. Glob. Chang. Biol. 2011, 17, 2261–2270. [Google Scholar] [CrossRef]
- Estoque, R.C.; Ooba, M.; Avitabile, V.; Hijioka, Y.; DasGupta, R.; Togawa, T.; Murayama, Y. The future of Southeast Asia’s forests. Nat. Commun. 2019, 10, 1829. [Google Scholar] [CrossRef] [Green Version]
- Feng, Y.; Ziegler, A.D.; Elsen, P.R.; Liu, Y.; He, X.; Spracklen, D.V.; Holden, J.; Jiang, X.; Zheng, C.; Zeng, Z. Upward expansion and acceleration of forest clearance in the mountains of Southeast Asia. Nat. Sustain. 2021, 4, 892–899. [Google Scholar] [CrossRef]
- Royal Forest Department. 2018. Forest Area of Thailand 1973–2018. Available online: http://forestinfo.forest.go.th/Content/file/stat2561/Binder1.pdf (accessed on 21 February 2022).
- Delang, C.O. Deforestation in northern Thailand: The result of Hmong farming practices or Thai development strategies? Soc. Nat. Resour. 2002, 15, 483–501. [Google Scholar] [CrossRef]
- Virapongse, A. Smallholders and forest landscape restoration in upland northern Thailand. Int. For. Rev. 2017, 19, 102–119. [Google Scholar] [CrossRef]
- Carnus, J.M.; Parrotta, J.; Brockerhoff, E.; Arbez, M.; Jactel, H.; Kremer, A.; Lamb, D.; O’Hara, K.; Walters, B. Planted forests and biodiversity. J. For. 2006, 104, 65–77. [Google Scholar]
- Nghiem, N.; Tran, H. The biodiversity benefits and opportunity costs of plantation forest management: A modelling case study of Pinus radiata in New Zealand. Forests 2016, 7, 297. [Google Scholar] [CrossRef] [Green Version]
- Erskine, P.D.; Lamb, D.; Bristow, M. Tree species diversity and ecosystem function: Can tropical multi-species plantations generate greater productivity? For. Ecol. Manag. 2006, 233, 205–210. [Google Scholar] [CrossRef]
- Alem, S.; Pavlis, J.; Urban, J.; Kucera, J. Pure and mixed plantations of Eucalyptus camaldulensis and Cupressus lusitanica: Their growth interactions and effect on diversity and density of undergrowth woody plants in relation to light. Open J. For. 2015, 5, 375–386. [Google Scholar]
- Moore, S.E.; Allen, H.L. Plantation forestry. In Maintaining Biodiversity in Forest Ecosystems; Hunter, M.L., Ed.; Cambridge University Press: New York, NY, USA, 1999; pp. 400–433. [Google Scholar]
- Baral, H.; Guariguata, M.R.; Keenan, R.J. A proposed framework for assessing ecosystem goods and services from planted forests. Ecosyst. Serv. 2016, 22, 260–268. [Google Scholar] [CrossRef] [Green Version]
- Manson, D.G.; Schmidt, S.; Bristow, M.; Erskine, P.D.; Vanclay, J.K. Species-site matching in mixed species plantations of native trees in tropical Australia. Agrofor. Syst. 2013, 87, 233–250. [Google Scholar] [CrossRef]
- Potvin, C.; Dutilleul, P. Neighborhood effects and size asymmetric competition in a tree plantation varying in diversity. Ecology 2009, 90, 321–327. [Google Scholar] [CrossRef] [Green Version]
- Petit, B.; Montagnini, F. Growth in pure and mixed plantations of tree species used in reforesting rural areas of the humid region of Costa Rica, Central America. For. Ecol. Manag. 2006, 233, 338–343. [Google Scholar] [CrossRef]
- McNamara, S.; Tinh, D.V.; Erskine, P.D.; Lamb, D.; Yates, D.; Brown, S. Rehabilitating degraded forest land in central Vietnam with mixed native species plantings. For. Ecol. Manag. 2006, 233, 358–365. [Google Scholar] [CrossRef]
- Raman, T.; Mudappa, D.; Kapoor, V. Restoring rainforest fragments: Survival of mixed-native species seedlings under contrasting site conditions in the western Ghats, India. Restor. Ecol. 2009, 17, 137–147. [Google Scholar] [CrossRef]
- Ashton, M.S.; Gunatilleke, C.V.S.; Gunatilleke, I.A.U.N.; Singhakumara, B.M.P.; Gamage, S.; Shibayama, T.; Tomimura, C. Restoration of rain forest beneath pine plantations: A relay floristic model with special application to tropical South Asia. For. Ecol. Manag. 2014, 329, 351–359. [Google Scholar] [CrossRef]
- Elliott, S.; Chairuangsri, S.; Cherdsak, K.; Sangkum, S.; Sinhaseni, K.; Shannon, D.; Nippanon, P.; Manohan, B. Collaboration and conflict-developing forest restoration techniques for Northern Thailand’s upper watersheds whilst meeting the needs of science and communities. Forests 2019, 10, 732. [Google Scholar] [CrossRef] [Green Version]
- Shono, K.; Davies, S.J.; Chua, Y. Performance of 45 native tree species on degraded lands in Singapore. J. Trop. For. Sci. 2007, 19, 25–34. [Google Scholar]
- Meli, P.; Martínez-Ramos, M.; Rey-Benayas, J.M.; Carabias, J. Combining ecological, social, and technical criteria to select species for forest restoration. Appl. Veg. Sci. 2014, 17, 744–753. [Google Scholar] [CrossRef] [Green Version]
- Kremer, K.N.; Bauhus, J. Drivers of native species regeneration in the process of restoring natural forests from mono-specific, even-aged tree plantations: A quantitative review. Restor. Ecol. 2020, 28, 1074–1086. [Google Scholar] [CrossRef]
- Margules, C.R.; Pressey, R.L. Systematic conservation planning. Nature 2000, 405, 243. [Google Scholar] [CrossRef]
- Forman, L.L. Trigonobalanus a new genus of Fagaceae with notes on the classification of the family. Kew Bull. 1964, 17, 381–396. [Google Scholar] [CrossRef]
- Francis, J.F. Collection. In Tropical Tree Seed Manual. Agriculture Handbook Number 721; Vozzo, J.A., Ed.; United States Department of Agriculture Forest Service: Washington, DC, USA, 2003; pp. 119–124. [Google Scholar]
- CBOL Group. A DNA barcode for land plants. Proc. Natl. Acad. Sci. USA 2009, 106, 12794–12797. [Google Scholar] [CrossRef] [Green Version]
- Chen, S.; Yao, H.; Han, J.; Liu, C.; Song, J.; Shi, L.; Zhu, Y.; Ma, X.; Gao, T.; Pang, X.; et al. Validation of the ITS2 Region as a Novel DNA Barcode for Identifying Medicinal Plant Species. PLoS ONE 2010, 5, e8613. [Google Scholar] [CrossRef]
- Hollingsworth, P.M. Refining the DNA barcode for land plants. Proc. Natl. Acad. Sci. USA 2011, 108, 19451–19452. [Google Scholar] [CrossRef] [Green Version]
- China Plant BOL Group; Li, D.-Z.; Gao, L.-M.; Li, H.-T.; Wang, H.; Ge, X.-J.; Liu, J.-Q.; Chen, Z.-D.; Zhou, S.-L.; Chen, S.-L.; et al. Comparative analysis of a large dataset indicates that internal transcribed spacer (ITS) should be incorporated into the core barcode for seed plants. Proc. Natl. Acad. Sci. USA 2011, 108, 19641–19646. [Google Scholar] [PubMed] [Green Version]
- Madesis, P.; Ganopoulos, I.; Anagnostis, A.; Tsaftaris, A. The application of Bar-HRM (Barcode DNA-High Resolution Melting) analysis for authenticity testing and quantitative detection of bean crops (Leguminosae) without prior DNA purification. Food Control 2012, 25, 576–582. [Google Scholar] [CrossRef]
- Madesis, P.; Ganopoulos, I.; Bosmali, I.; Tsaftaris, A. Barcode High Resolution Melting analysis for forensic uses in nuts: A case study on allergenic hazelnuts (Corylus avellana). Food Res. Int. 2013, 50, 351–360. [Google Scholar] [CrossRef]
- Osathanunkul, M.; Madesis, P.; de Boer, H. Bar-HRM for Authentication of Plant-Based Medicines: Evaluation of Three Medicinal Products Derived from Acanthaceae Species. PLoS ONE 2015, 10, e0128476. [Google Scholar] [CrossRef] [Green Version]
- Osathanunkul, M.; Suwannapoom, C.; Ounjai, S.; Rora, J.A.; Madesis, P.; de Boer, H. Refining DNA barcoding coupled high resolution Melting for discirmination of 12 closely related Croton species. PLoS ONE 2015, 10, e0138888. [Google Scholar] [CrossRef]
- Osathanunkul, M.; Suwannapoom, C.; Khamyong, N.; Pintakum, D.; Lamphun, S.; Triwitayakorn, K.; Osathanunkul, K.; Madesis, P. Hybrid analysis (barcode-high resolution melting) for authentication of Thai herbal products, Andrographis paniculata (Burm.f.) Wall. ex Nees. Pharmacogn. Mag. 2016, 12, 71–75. [Google Scholar] [CrossRef] [Green Version]
- Singtonat, S.; Osathanunkul, M. Fast and reliable detection of toxic Crotalaria spectabilis Roth. in Thunbergia laurifolia Lindl. herbal products using DNA barcoding coupled with HRM analysis. BMC Complement. Altern. Med. 2015, 15, 162. [Google Scholar] [CrossRef] [Green Version]
- Ganopoulos, I.; Madesis, P.; Darzentas, N.; Argiriou, A.; Tsaftaris, A. Barcode High Resolution Melting (Bar-HRM) analysis for detection and quantification of PDO “Fava Santorinis” (Lathyrus clymenum) adulterants. Food Chem. 2012, 133, 505–512. [Google Scholar] [CrossRef]
- Lahaye, R.; Van der Bank, M.; Bogarin, D.; Warner, J.; Pupulin, F. DNA barcoding the floras of biodiversity hotspots. Proc. Natl. Acad. Sci. USA 2008, 105, 2923–2928. [Google Scholar] [CrossRef] [Green Version]
- Ballin, N.Z.; Onaindia, J.O.; Jawad, H.; Fernandez-Carazo, R.; Maquet, A. High-resolution melting of multiple barcode amplicons for plant species authentication. Food Control 2019, 105, 141–150. [Google Scholar] [CrossRef]
- Osathanunkul, M.; Madesis, P. The identification of several Dipterocarpaceae and Fagaceae trees by barcode DNA coupled with high-resolution melting analysis. Forests 2021, 12, 1466. [Google Scholar] [CrossRef]
- Doyle, J.J.; Doyle, J.L. A rapid DNA isolation procedure from small quantities of fresh leaf tissues. Phytochem. Bull. 1987, 19, 11–15. [Google Scholar]
- Tamura, K.; Stecher, G.; Kumar, S. MEGA11: Molecular Evolutionary Genetics Analysis Version 11. Mol. Biol. Evol. 2021, 38, 3022–3027. [Google Scholar] [CrossRef]
- Dwight, Z.; Palais, R.; Wittwer, C.T. uMELT: Prediction of high-resolution melting curves and dynamic melting profiles of PCR products in a rich web application. Bioinformatics 2011, 27, 1019–1020. [Google Scholar] [CrossRef] [Green Version]
- Wittwer, C.T.; Reed, G.H.; Gundry, C.N.; Vandersteen, J.G.; Pryor, R.J. High-Resolution Genotyping by Amplicon Melting Analysis Using LCGreen. Clin. Chem. 2003, 49, 853–860. [Google Scholar] [CrossRef] [Green Version]
- Kress, W.J.; Erickson, D.L. A two-locus global DNA barcode for land plants: The coding rbcL gene complements the non-coding trnH-psbA spacer region. PLoS ONE 2007, 2, e508. [Google Scholar] [CrossRef] [Green Version]
- Slomka, M.; Sobalska-Kwapis, M.; Wachulec, M.; Bartosz, G.; Strapagiel, D. High Resolution Melting (HRM) for high-throughput genotyping—Limitations and caveats in practical case studies. Int. J. Mol. Sci. 2017, 18, 2316. [Google Scholar] [CrossRef] [Green Version]
- Ng, J.W.S.; Holt, D.C.; Andersson, P.; Giffard, P.M. DNA concentration can specify DNA melting point in a High-Resolution Melting analysis master mix. Clin. Chem. 2014, 60, 414–416. [Google Scholar] [CrossRef]


| Sample ID | Species | Sample ID | Species |
|---|---|---|---|
| N1 | Careya sphaerica Roxb. | N7 | Phyllanthus emblica L. |
| N2 | Hopea odorata Roxb. | N8 | Albizia lebbeck (L.) Benth. |
| N3 | Croton roxburghii N.P. Balakr. | N9 | Chukrasia velutina Wight & Arn. |
| N4 | Gmelina arborea Roxb. | N10 | Spondias mombin L. |
| N5 | Irvingia malayana Oliv. ex A.W. Benn. | N11 | Oroxylum indicum (L.) Benth. ex Kurz |
| N6 | Afzelia xylocarpa (Kurz) Craib | N12 | Bauhinia purpurea L. |
| Sample ID | Included in In Vitro HRM | Average DNA Concentration (ng/uL) |
|---|---|---|
| N1 | ✓ | 327.52 |
| N2 | ✓ | 578.21 |
| N3 | ✓ | 1743.1 |
| N4 | ✓ | 674.65 |
| N5 | x | 16.18 |
| N6 | ✓ | 827.69 |
| N7 | ✓ | 306.78 |
| N8 | ✓ | 382.46 |
| N9 | x | 73.29 |
| N10 | x | 18.17 |
| N11 | ✓ | 170.58 |
| N12 | ✓ | 2802.91 |
| ID | Scientific Name | No. of Sequences in GenBank | DNA Region | |||||||
|---|---|---|---|---|---|---|---|---|---|---|
| ITS | matK | rbcL | trnL | |||||||
| Accession Number | No. of Sequences | Accession Number | No. of Sequences | Accession Number | No. of Sequences | Accession Number | No. of Sequences | |||
| N1 | Careya sphaerica | 15 | MN699345 | 2 | MG742305 | 5 | AF077655 | 3 | DQ924313 | 2 |
| N2 | Hopea odorata | 34 | MZ782439 | 1 | KY972951 | 7 | DQ157306 | 6 | KY972753 | 6 |
| N3 | Croton roxburghii | 20 | AY971244 | 6 | AB428650 | 5 | KP789671 | 2 | AY971329 | 6 |
| N4 | Gmelina arborea | 20,000 | KR532195 | 5 | JX495721 | 13 | JF272486 | 16 | JQ669310 | 3 |
| N5 | Irvingia malayana | 107 | EF135553 | 6 | JX664054 | 7 | ||||
| N6 | Afzelia xylocarpa | 22 | KX690239 | 2 | ||||||
| N7 | Phyllanthus emblica | 205 | AY830087 | 47 | AY936594 | 11 | AY765269 | 13 | FJ847837 | 1 |
| N8 | Albizia lebbeck | 318 | N181375 | 8 | EU812047 | 8 | KC417043 | 12 | KX268143 | 4 |
| N9 | Chukrasia velutina | 42 | FJ518894 | 12 | AB924836 | 8 | AY128222 | 12 | KU939115 | 1 |
| N10 | Spondias mombin | 580 | AF080064 | 2 | AY594480 | 3 | JQ590140 | 9 | KC283103 | 45 |
| N11 | Oroxylum indicum | 84 | FJ606747 | 12 | HQ384520 | 9 | HQ384886 | 11 | FJ870048 | 2 |
| N12 | Bauhinia purpurea | 214 | MH548397 | 15 | JN881391 | 2 | JX856647 | 10 | FJ801069 | 4 |
| DNA Region | Sample | Length (bp) | Nucleotide Variation |
|---|---|---|---|
| ITS | N1–N3, N7–N9, N10–N12 | 744 | 61.56% (458 bp) |
| rbcL | N1–N5, N7–N12 | 626 | 21.56% (135 bp) |
| matK | N1–N2, N4–N5, N7–N9, N10–N12 | 1186 | 41.99% (498 bp) |
| trnL | N1–N4, N7–N12 | 677 | 40.47% (274 bp) |
Publisher’s Note: MDPI stays neutral with regard to jurisdictional claims in published maps and institutional affiliations. |
© 2022 by the authors. Licensee MDPI, Basel, Switzerland. This article is an open access article distributed under the terms and conditions of the Creative Commons Attribution (CC BY) license (https://creativecommons.org/licenses/by/4.0/).
Share and Cite
Osathanunkul, M.; Sawongta, N.; Madesis, P.; Pheera, W. Bar-HRM for Species Confirmation of Native Plants Used in Forest Restoration in Northern Thailand. Forests 2022, 13, 997. https://doi.org/10.3390/f13070997
Osathanunkul M, Sawongta N, Madesis P, Pheera W. Bar-HRM for Species Confirmation of Native Plants Used in Forest Restoration in Northern Thailand. Forests. 2022; 13(7):997. https://doi.org/10.3390/f13070997
Chicago/Turabian StyleOsathanunkul, Maslin, Nipitpong Sawongta, Panagiotis Madesis, and Wittaya Pheera. 2022. "Bar-HRM for Species Confirmation of Native Plants Used in Forest Restoration in Northern Thailand" Forests 13, no. 7: 997. https://doi.org/10.3390/f13070997
APA StyleOsathanunkul, M., Sawongta, N., Madesis, P., & Pheera, W. (2022). Bar-HRM for Species Confirmation of Native Plants Used in Forest Restoration in Northern Thailand. Forests, 13(7), 997. https://doi.org/10.3390/f13070997