Abstract
Ancient Pu’er tea trees (Camellia sinensis var. assamica (J. W. Mast.) Kitam.) are an important ecological resource with high economic value. Knowledge of the environmental variables shaping the original distribution and the effects of climate change on the future potential distribution of these trees, as well as the identification of sustainable management approaches, is essential for ensuring their future health and production. Here, we used 28 current environmental variables and the future climate data to model the suitable areas for ancient Pu’er tea trees. We also compared the health of these ancient trees in areas under different local management strategies. The results suggested the general distribution is likely to remain stable, but there are environmentally suitable areas outside its current habitats. To achieve more sustainable management, the main areas in which the management of poorly-managed trees can be improved include learning from managers of well-managed trees and following the common technical management regulations stipulated by the local government. The suitable value ranges for environmental factors, potentially suitable areas under climate change, and assessment of management approaches will aid the future cultivation and transplantation of ancient Pu’er tea trees. The methodology includes management-level analysis and provides practical insights that could be applied to regions outside the most suitable areas identified.
1. Introduction
Commercial forest and cash crops are important sources of income for a large segment of the world’s population. Sustainable management and long-term developmental strategies are particularly important for ensuring that these income sources continually meet the needs of those that depend on them. Over 2 billion cups of tea are consumed daily [1], making tea one of the world’s most popular drinks; it is a non-timber product that requires scientific breeding and extraction methods. Many recent studies have examined the effects of climatic conditions on the growth and nutritional properties of tea. For example, Nowogrodzki [2] suggested that climate change can affect the growing season, flavor, and health benefits of tea; Kfoury et al. [3] indicated that elevation and season are factors affecting the nutritional components of tea and preferences by consumers. However, few studies have explored how environmental factors and climate change might affect the niches and distributions of tea species. Few have even suggested that endemic tea be transplanted to other suitable regions with a tea culture.
The tea species Camellia sinensis (L.) Kuntze is widely planted, and China is one of the largest tea producers globally [4]. The origin and taxonomic classification of tea are controversial due to plasticity in their morphological traits [5,6]. Assam-type tea (C. sinensis var. assamica) is a cultivated variety, along with China-type tea (C. sinensis var. sinensis). However, recent studies have suggested that Assam-type tea belongs to two distinct genetic entities in China and India [4]. In Yunnan Province, southwestern China, the Latin name of Assam-type tea was used as a translation of an endemic species in the Pu’er region and changed from “Assam tea” to “Pu’er tea” by Professor Hongda Zhang in 1981 [7]. The historical context has impeded taxonomic classification because the Latin name of Assam-type tea is widely considered a cultivated variety. However, in the Pu’er region, the same term is used to refer to a wild relative considered to be the origin of these cultivated varieties, similar to Camellia taliensis [8]. In this study, we used the term “ancient Pu’er tea” to refer to naturally occurring ancient tea plants that might be the ancestors of cultivated ones. The plants we studied have the same Latin name as Assam-type tea.
Pu’er tea products are famous for their special aromas and tastes, and these properties are amplified by a process called “artificial pile” fermentation [9]. The products are popular and traded worldwide. Tea from ancient trees fetches high prices because of its rarity and flavor. “Ancient” trees are often defined as trees over 100 years of age or regrown trees from trunks over 100 years of age [10]. Tea from ancient trees has unique properties. According to Zhao et al. [11], ancient tea is rich in nutrients, and the genetic diversity of these ancient trees significantly contributes to tea cultivation. Lu et al. [10] indicated that the study of the genes of ancient trees under natural selection can provide insights into the evolutionary mechanisms, diversification, and domestication of trees and aid the functional characterization and genetic improvement of trees. A photochemical analysis of ancient Pu’er tea trees suggests that their high polyphenol concentration has detoxifying and elastin-protecting properties, which slows skin aging [12].
Ancient trees can withstand changes in environmental conditions, and these properties of ancient trees merit further study. However, these trees are retained in only a few natural communities. In previous decades, the number of ancient trees has decreased in Australia [13,14], China [11], Europe [15], South America [16], and the United States [17]. These resources require protection because of their high natural, economic, and cultural value. Ancient teas are economically important plants that require conservation efforts to ensure that the production of tea from these plants is sustainable. China has a long history of tea culture, and interest in the silviculture of tea trees has increased nationwide [18], especially for rare plants such as ancient Pu’er tea, which makes China one of the most important areas for examining the potential distribution and sustainable management of Pu’er tea. Other countries with tea culture are also aiming to expand tea production and improve the quality of tea products. For example, Britain has imported teas from China since the 19th century and developed its own tea drinking culture [19]. In India, which is the second largest tea producer in the world, much research is being conducted to determine how tea production can be improved under future climate change [20]. Tea has been produced in Kenya since 1924, and the sustainable supply chain management in the country is continually being improved [21]. There is thus a need to explore the future potential niches of species on a global scale.
Many studies have suggested that the diversity and density of ancient trees are affected by climate [22,23,24], landform [25,26], soils [27], and disturbance [28,29], which are the main environmental factors affecting the niches and distributions of plants [30]. Previous studies have also indicated that climate change [31] and management approaches [32] can have a substantial effect on the niches and distributions of species. However, previous studies of ancient teas have mainly focused on their chemical composition [33], cultural heritage [9,34], genetic diversity [35], and health benefits [12]. Analysis of the original habitat of these ancient plants requires examination to achieve transplantation and cultivation of new ancient tea plants. Understanding the environmental factors contributing to the development of ancient plants are key before achieving these goals and are of broad interest [36].
Hence, the aim of our study was to characterize the effects of environmental variables on the distribution of ancient Pu’er tea trees and the effects of future climate change on the future potential niches of these trees; we also aimed to identify management approaches that could be implemented to achieve the sustainable development of tea from ancient trees. Based on contemporary theory suggesting that increases in atmospheric carbon dioxide concentration [37] and temperature [38] might promote the adaptation and development of tropical and subtropical plants [39], we assume that climate change will increase the potentially suitable areas for ancient Pu’er teas. Based on our field studies, we also assume that management approaches will have a significant effect on the health and sustainable development of tea plants.
2. Materials and Methods
2.1. Study Area
Our study area focused on China, which is known to possess environmentally suitable areas for ancient Pu’er tea. We also examined future niches on a global scale to evaluate the potential development of tea culture and production. The data were collected from the Pu’er region, southwestern Yunnan Province, China, which is located between 22°02′ and 24°50′ N and between 99°09′ and 102°19′ E and covers approximately 0.45 million hectares (Figure 1). The region experiences a subtropical monsoon climate, and the forest-free period is over 315 days. The mountainous area makes up 98.3% of the total area, and the altitude ranges from 320 to 3199 m; thus, there is substantial vertical variation in climate. Forest resources are abundant in this region because of the unique climate conditions and terrain.
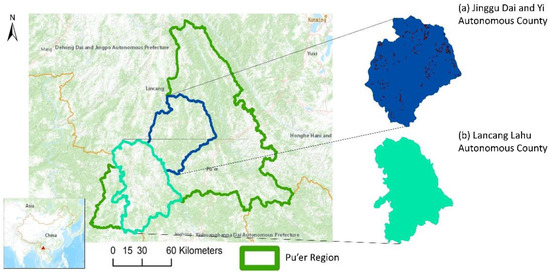
Figure 1.
Location of the Pu’er region (green) and Yunnan Province (orange), China. We sampled all known ancient tea trees in Jinggu Dai and Yi Autonomous County (a), which was used in the training set to model the potential distribution of ancient tea trees in Pu’er. Sample points are shown to visualize their general spread. We used Lancang Lahu Autonomous County (b) as the test area to assess modeling accuracy.
According to local government data [40], the region’s forest coverage is 74.59%, and the value of forest ecological services is approximately 285 billion RMB annually. The forest product-related area is approximately 3.1 million hectares, and the area of tea gardens is over 212,000 hectares. In 2020, the GDP of Pu’er tea products was 94.54 billion RMB, which was 2.5% higher than the GDP of these products in 2019. The primary industries (agriculture, forestry, animal husbandry, sideline production, and fishery industries) make up 22.74% of the total GDP. The yield of tea is 0.12 million tons and is increasing annually. There are 530,987 hectares of land involved in the natural forest protection project, and 66.67 hectares involved in the closing hillsides project; 26,326.13 hectares are artificially afforested. There are two national-, five provincial-, and nine county-level natural reserves, which comprise a total area of 105,830.53 hectares, making the Pu’er region one of the most biodiverse regions in the country. The region is also characterized by multicultural integration and indigenous autonomy. The population of Pu’er is 2.41 million, and minorities make up 61.2% of the total population. Most ethnic minorities manage their own tea gardens and have a longstanding culture of tea cultivation.
2.2. Data
We took the coordinates of 1614 ancient tea trees in Jinggu Dai and Yi Autonomous County, which included all known ancient tea trees in the county. The occurrence records were obtained from a long-term field study of a team comprising members of our research group, government staff, and locals. These records were supplemented annually with assigned unique IDs, which were verified regularly. We then obtained data on 28 environmental variables and rasterized them on the map. We downloaded 19 bioclimatic, wind speed, water vapor pressure, and solar radiation layers at a spatial resolution of 30 arc-seconds (1 km2) from the WorldClim version 2.1 database [41]. Average values from 1970 to 2000 (released in January 2020) were calculated and used in the analysis. In addition, we extracted the slope and aspect values from the Advanced Land Observing Satellite (ALOS) 12.5 m digital elevation model (DEM, scale 1:50,000) [42] to characterize terrain conditions. We also obtained soil texture data from the Resource and Environment Science and Data Center, including proportions of sand, silt, and clay [43]. Details of these parameters are shown in Table 1. As for climate change data, we used bioclimatic variables at a spatial resolution of 2.5 min (19 km2) for the following periods: 2021–2040, 2041–2060, 2061–2080, and 2081–2100. The global climate model (GCM) was obtained from the Meteorological Research Institute Earth System Model version 2.0 [44], along with the shared socioeconomic pathway (SSP) 370 [45].

Table 1.
Details of the 28 parameters used in the model. Their value ranges, suitable value ranges, percent contribution, and permutation importance are shown. The suitable values were extracted when the logistic output > 0.5 (high values indicate high suitability) [53]. Contribution and importance are percentage values.
Furthermore, we noted the management methods employed by local people during fieldwork. We also referenced a local government report [46] that summarized the effects of the management of ancient tea trees.
2.3. Calibration and Validation
The 28 rasterized environmental data layers were standardized into the same band, cell size, pixel type, pixel depth, coordinate system, and spatial datum by ArcGIS Desktop 10.8. We used ArcGIS Conversion Tools to project our data to the World Geodetic System (WGS) 1984; we then resampled these data using the nearest-neighbor approach to a 30 arc-second resolution and converted the data into ASCII format. We assumed that the variables were theoretically independent and had unique environmental significance; thus, they were all retained at this stage. The potential multicollinearity caused by correlations among variables and other uncertainties are discussed in the Section 4. We calculated the contribution and importance of the parameters by the maximum entropy algorithm, a machine learning-based method that estimates a probability surface that maximizes entropy, subject to constraints imposed by the ancient tree occurrence data. Specifically, we used Maxent 3.4.4 [47] with the jackknife procedure to model the niches of ancient tea trees. This software has been widely used to model the distributions of diverse species [48,49]. The accuracy of the maximum entropy method of species distribution modeling (SDM) depends on the quality of presence-only data [50]; thus, we included as many occurrence records as possible. To assess the degree of uncertainty in the predicted occurrence probability, we built response curves of the means of ten replicate Maxent runs [51]. These curves showed clear patterns with acceptable ranges of standard deviation; therefore, we decided to not calibrate variables further nor present redundant figures. Among the 1614 individual plants, the model was run 10 times, and the average result was used. We set the running type as cross-validation, the random test percentage as 75, the maximum number of background points as 10,000, the maximum number of iterations as 500, and the output format as logistic. All other software settings were left at their default values. To facilitate interpretation of the logistic values, we categorized them into three classes, high, medium, and low, using the Jenks natural breaks to visualize environmental suitability. Interpretation of three classes is more straightforward for our data compared with the current five probability classes [51,52]. We also calculated areas at the province level to evaluate distributional changes corresponding to climate change in China. In addition, the potential global distribution was evaluated by applying the same approach to each 20-year dataset. The only difference is that we calculated the average values of the dataset over the next 80 years to represent the potential future distribution.
To evaluate the efficacy of the management strategies employed, we compared the health conditions of ancient tea trees and selected extremes to reflect good and poor management. The management approaches and figures in our study were assessed based on our field investigation and government reports using scientific standards. We then proposed guidelines based on horizontal comparisons, the experience of experts, and government reports.
3. Results
3.1. Niches and Distributions
The percent contribution and relative importance of the 28 parameters are shown in Table 1. The suitable ranges indicate the conditions in which ancient tea trees exist. These values were extracted when the effect on environmental suitability (called “logistic output” in the model) was greater than 0.5. The variables with the highest percent contribution were annual precipitation and min temperature of coldest month. The least important variables were mean temperature of wettest quarter and max temperature of warmest month.
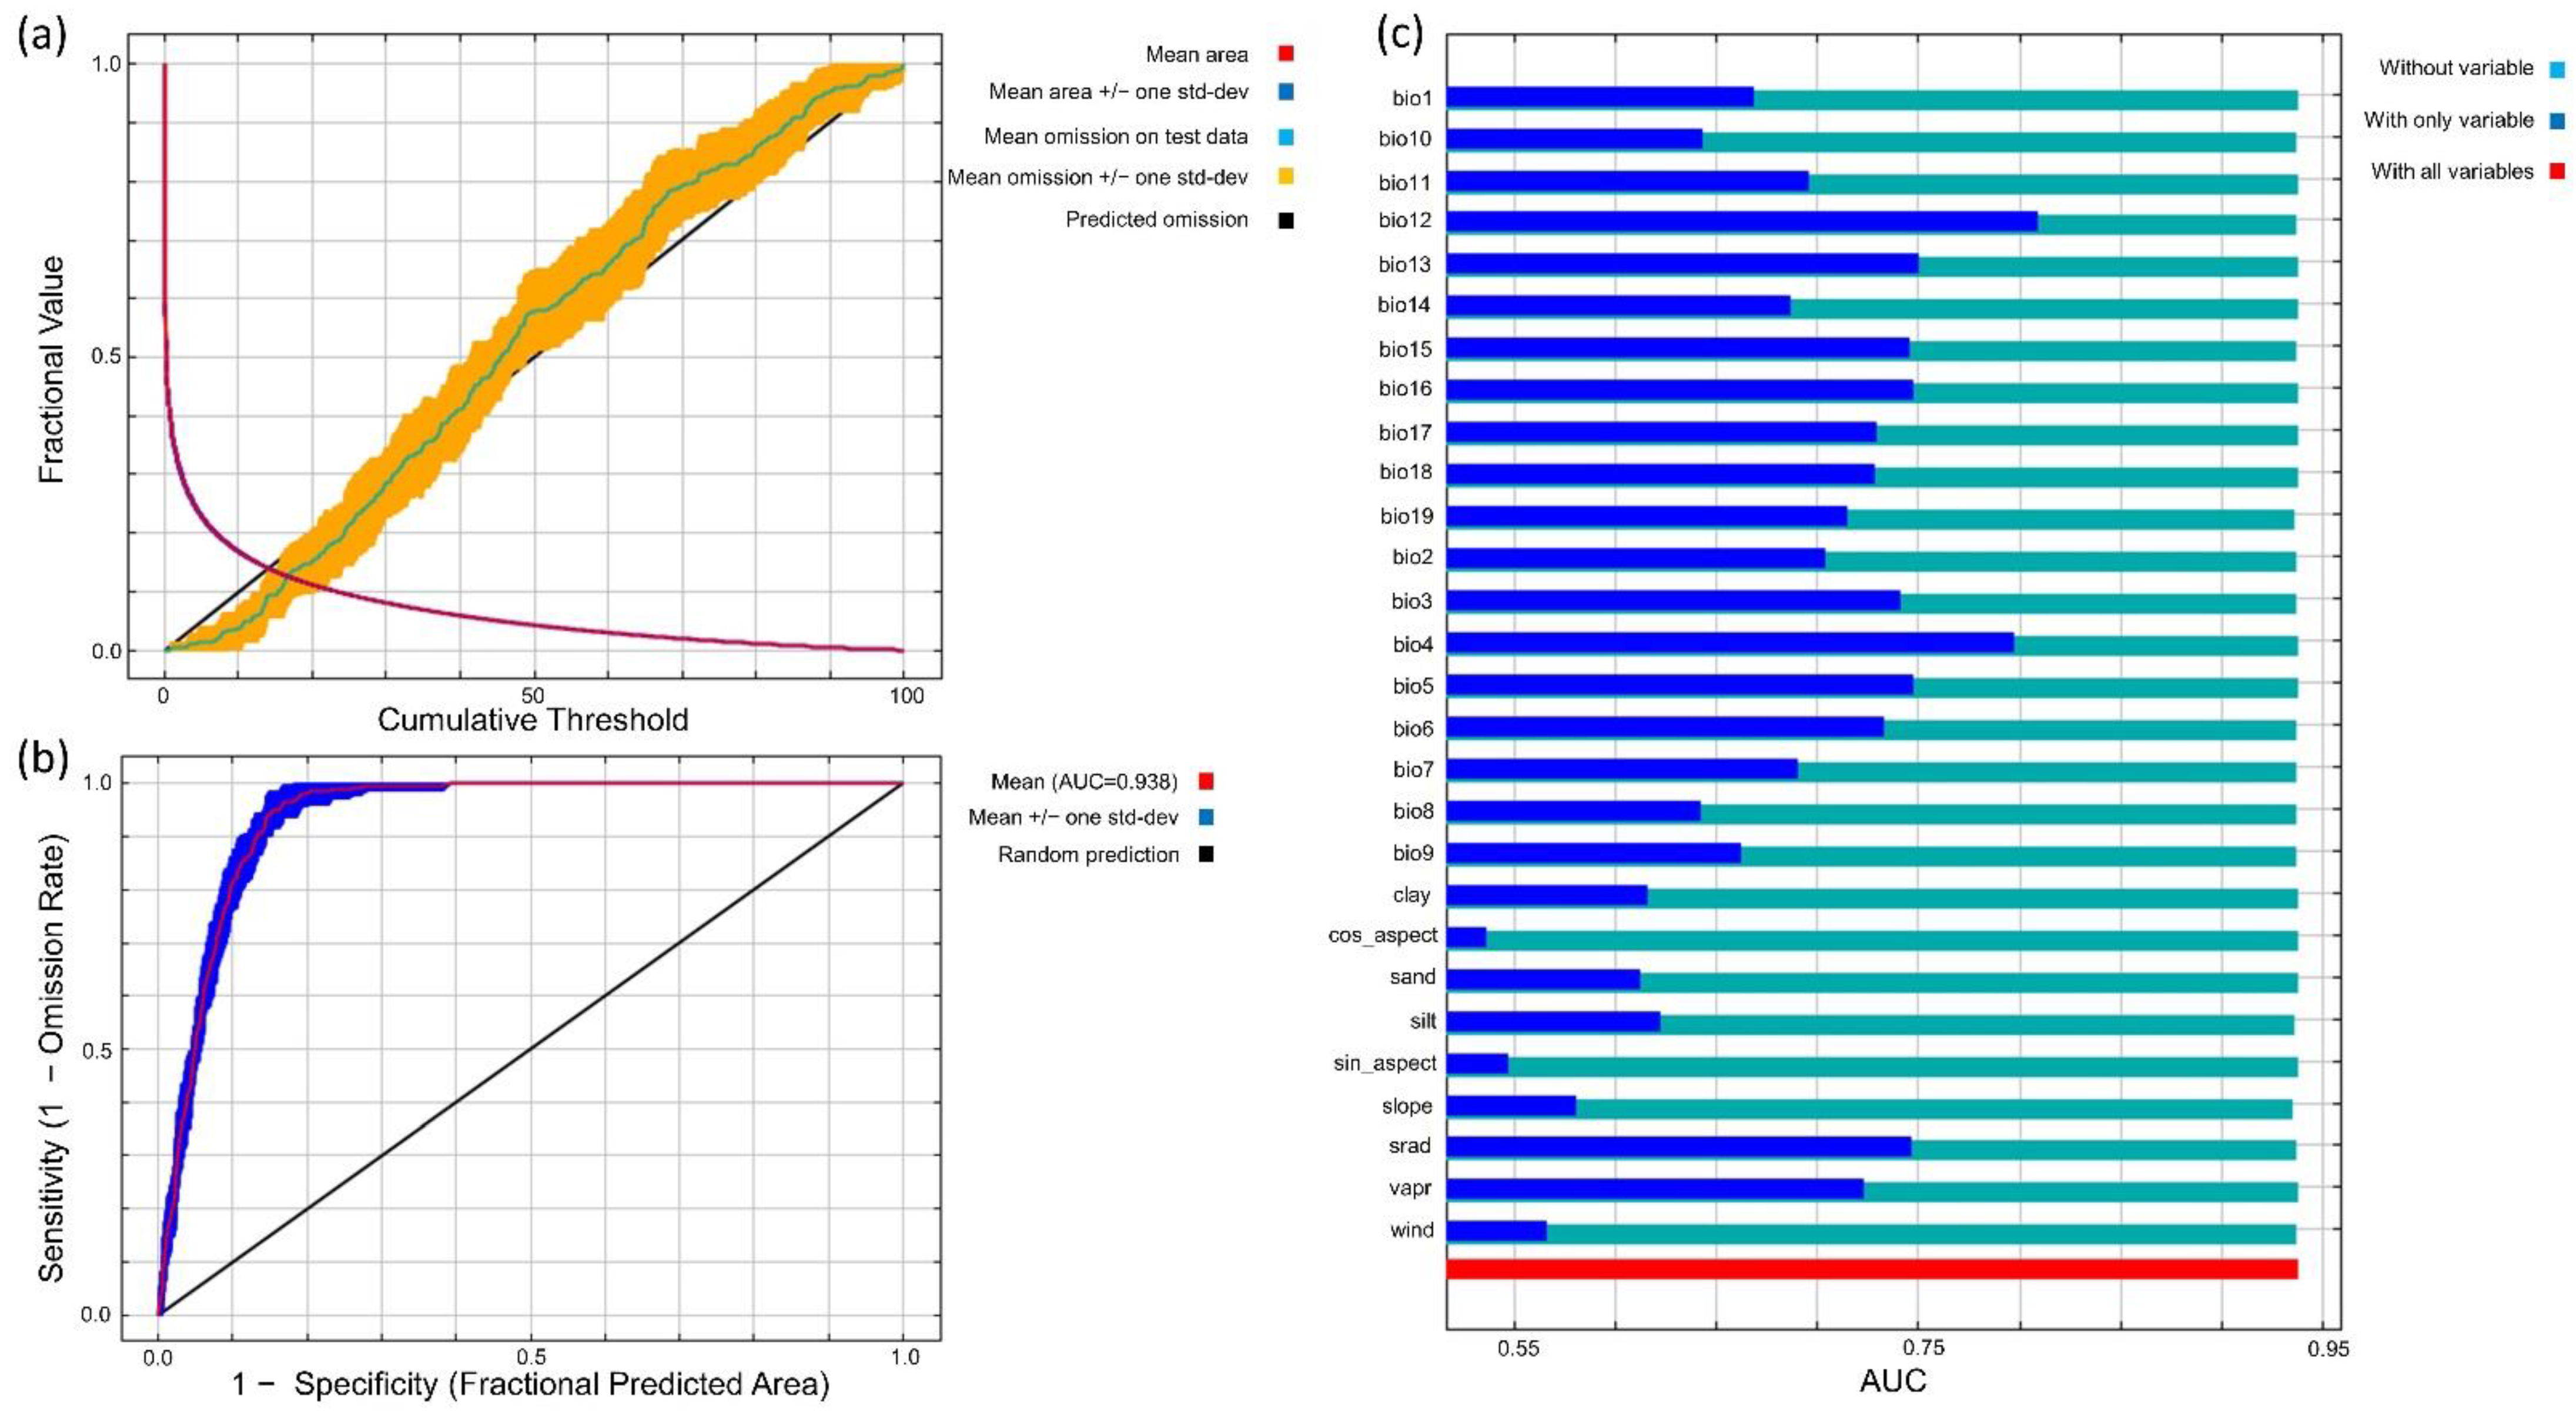
The omission rate was close to the predicted omission rate (Figure 2a), suggesting that the fit of the model was adequate [47]. The area under the receiver operating characteristic curve (AUC) for the replicate runs was 0.938, and the standard deviation was 0.007 (Figure 2b), indicating high model accuracy. The jackknife test of AUC variable importance revealed the information gains from the different environmental variables (Figure 2c). Values shown are averages over replicate runs.
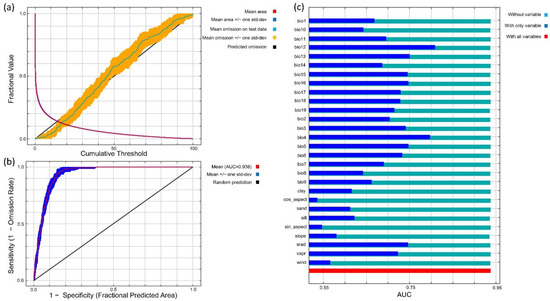
Figure 2.
Analysis of omission/commission (a) revealed the test omission rate and predicted area as a function of the cumulative threshold. The receiver operating characteristic (ROC) curve (b) indicated that the average test area under the curve (AUC) for the replicate runs was 0.938, and the standard deviation was 0.007. The results of the jackknife test of AUC variable importance (c) revealed that information gains differed when each variable was isolated.
The model suggested that the most suitable area of Pu’er ancient trees was located in the middle and western part of the study region (Figure 3a). Suitable areas were also located in the southwestern portion of the study region, but the suitability of the area in this region was lower than that in the midwestern portion of the study region. The suitable areas were concentrated northeast of the Lancang River and southwest of the Chuan River, and the elevation ranged from ca. 800 to 1600 m (Figure 3b).
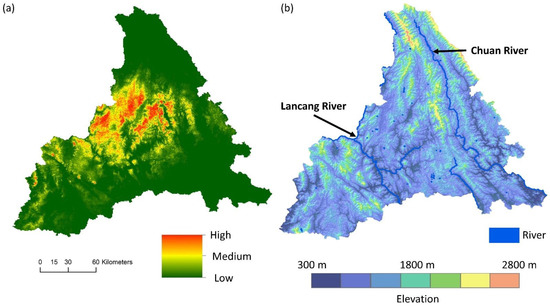
Figure 3.
Suitable areas of ancient Pu’er tea trees (a). High values indicate high probabilities (logistic output) of plant occurrence, and we categorized them into three classes (high, medium, and low) for better understanding. The elevation map (b) with the two main rivers marked is shown to aid visualization of the potential habitat of ancient tea trees across different elevations and rivers.
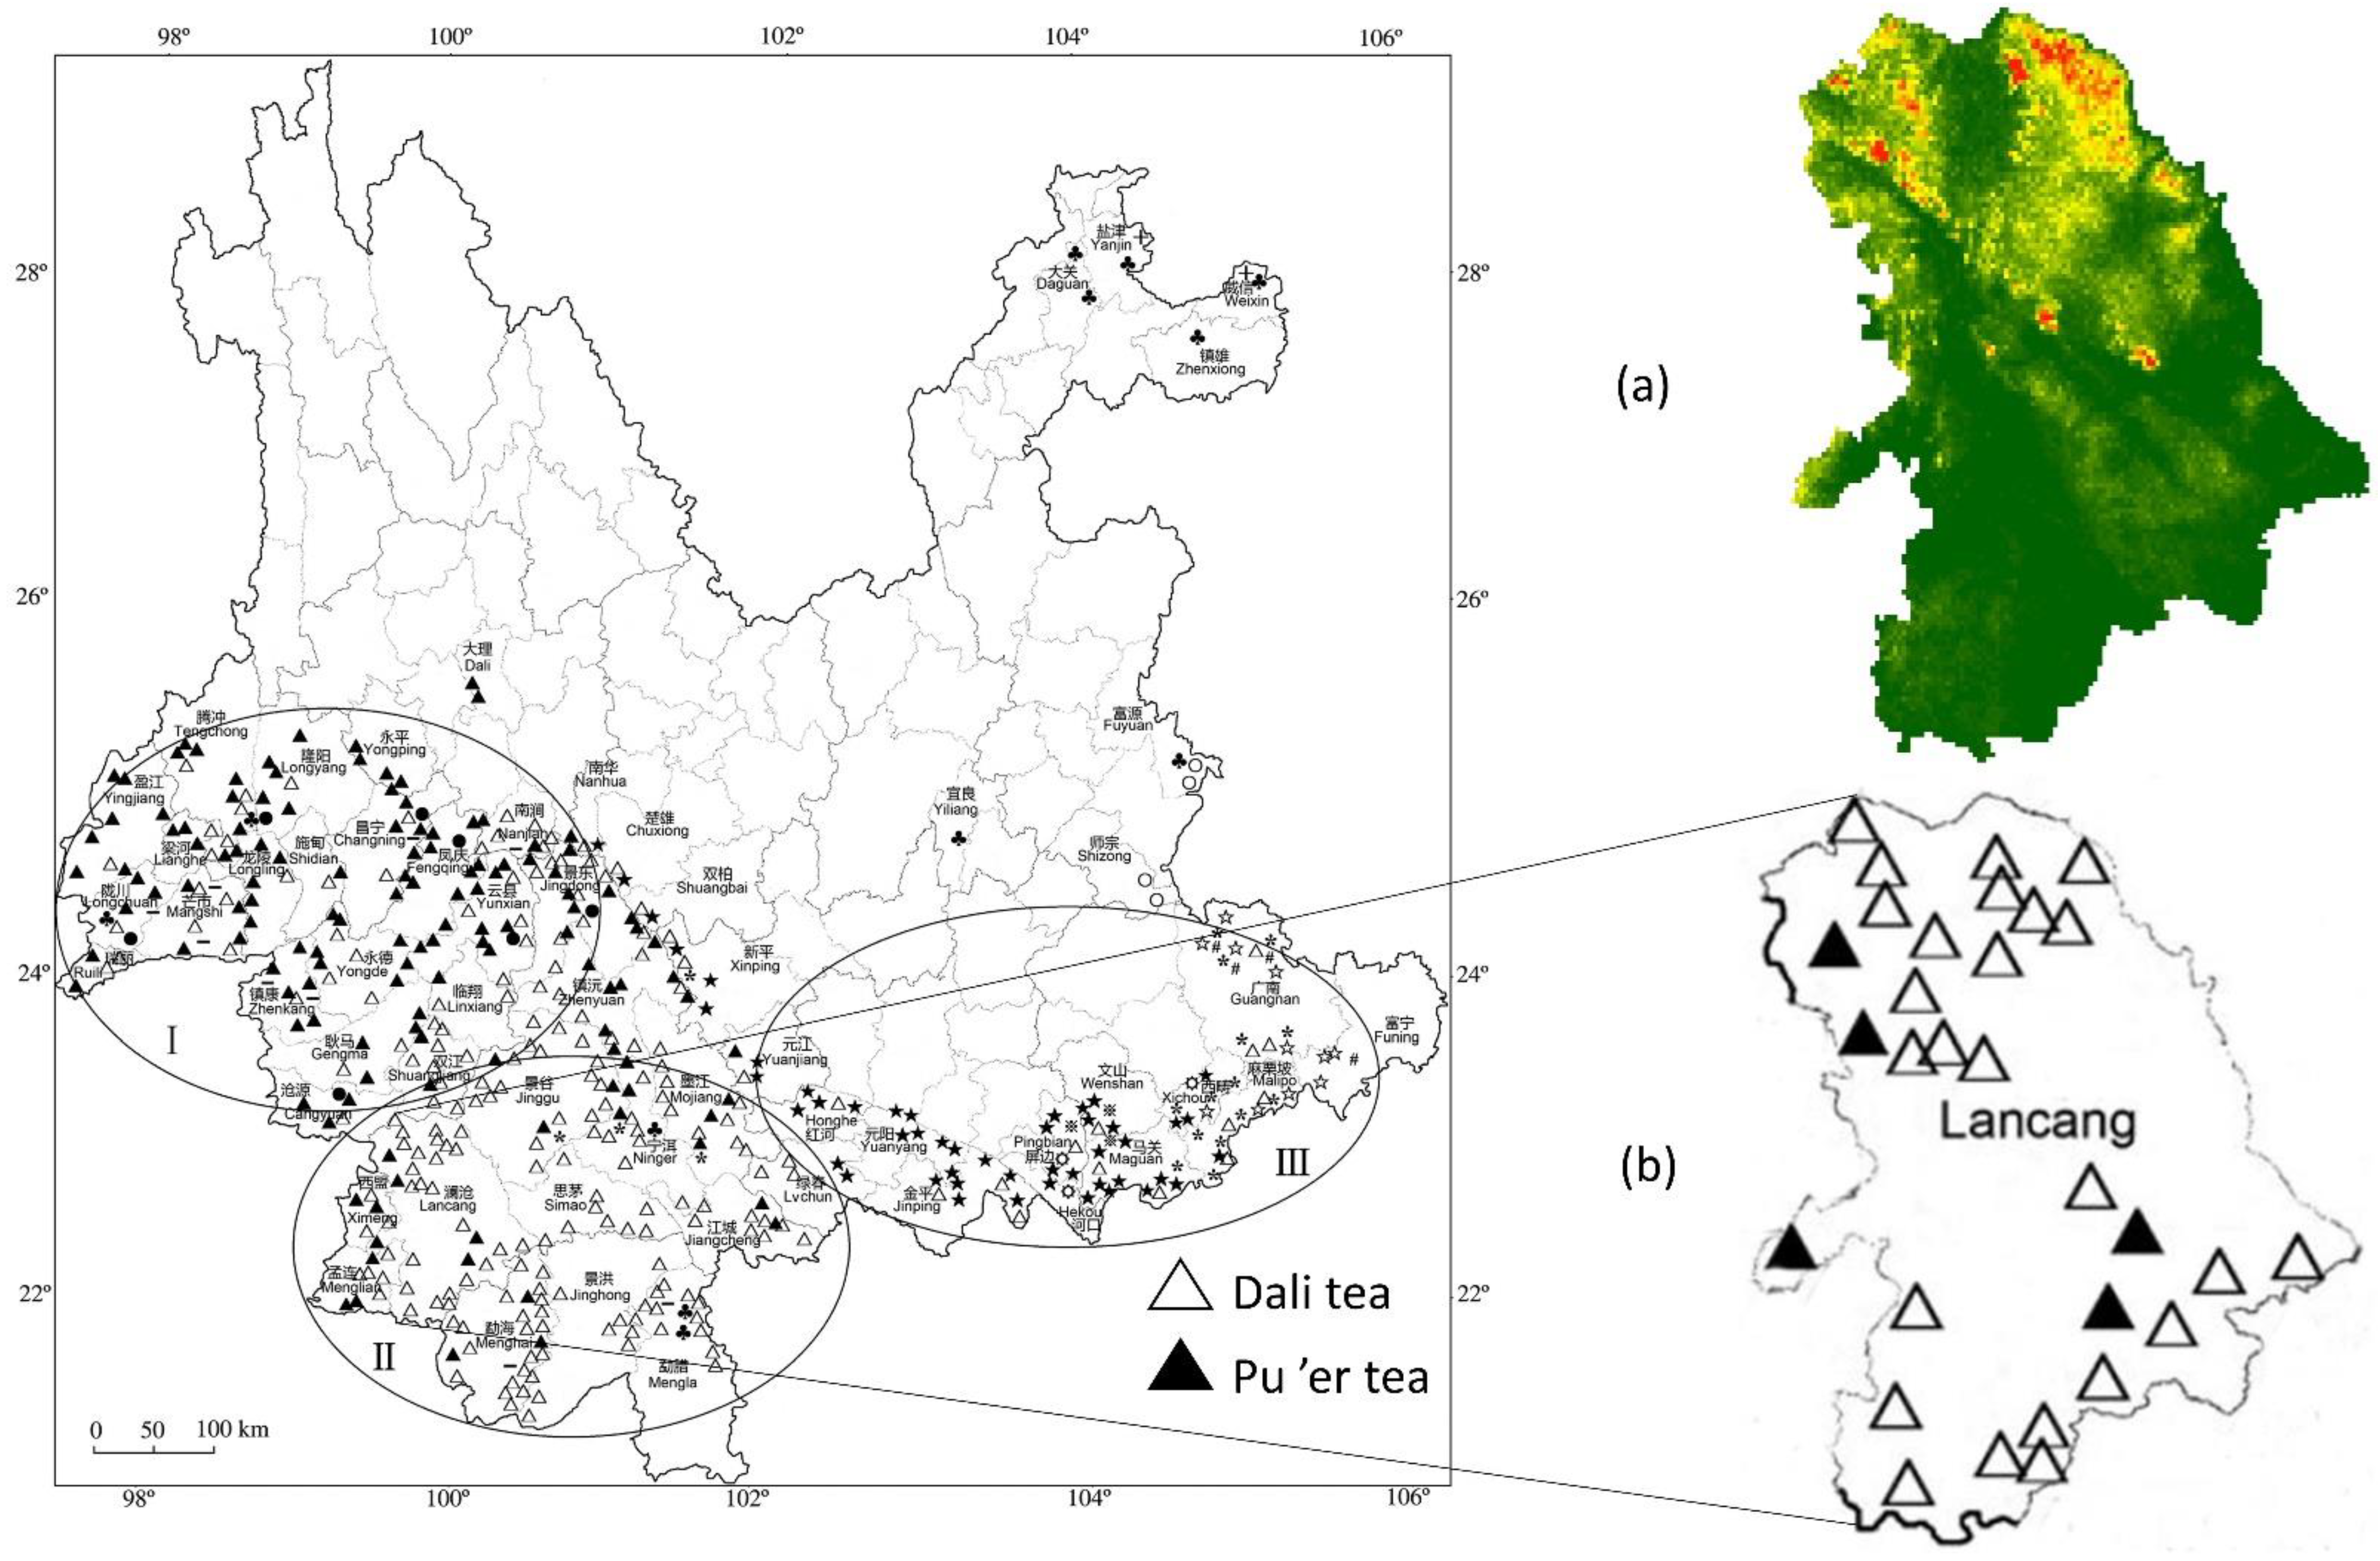
Data from Lancang Lahu Autonomous County (Figure 4a) were extracted as a supplementary way to test model accuracy. The distribution of ancient tea trees in a study of ancient tea tree resources in Yunnan Province [54] over the same area was compared with that predicted in our study (Figure 4b). The most suitable areas in our model overlapped with the distribution of ancient tea trees in this previous study in the central and northern regions. By contrast, the model indicated that there were few suitable areas in the southern region.

Figure 4.
The distribution of ancient tea resources in Yunnan from Jiang, Tang, Chen, Wang, Cai, Yu, Yang, Wang, Li, Jiang, Wang, Duan, Li, He, Wang, Li and Bu [54] (Figure 2, p. 300). The hollow triangle represents the Dali tea species (Camellia taliensis (W. W. Sm.) Melch.), and the solid triangle represents the Pu’er tea species. Other symbols also represent tea species, but the legend was omitted, and we only kept the two species that occurred in this county as legends for better visualization. There are three major distribution areas of Yunnan’s ancient tea resources: western Yunnan (I), southern Yunnan (II), and southeast Yunnan (III), and we focused on southern Yunnan. We extracted the data of Lancang Lahu Autonomous County (test set) from our model (a) and the map (b) to evaluate model performance.
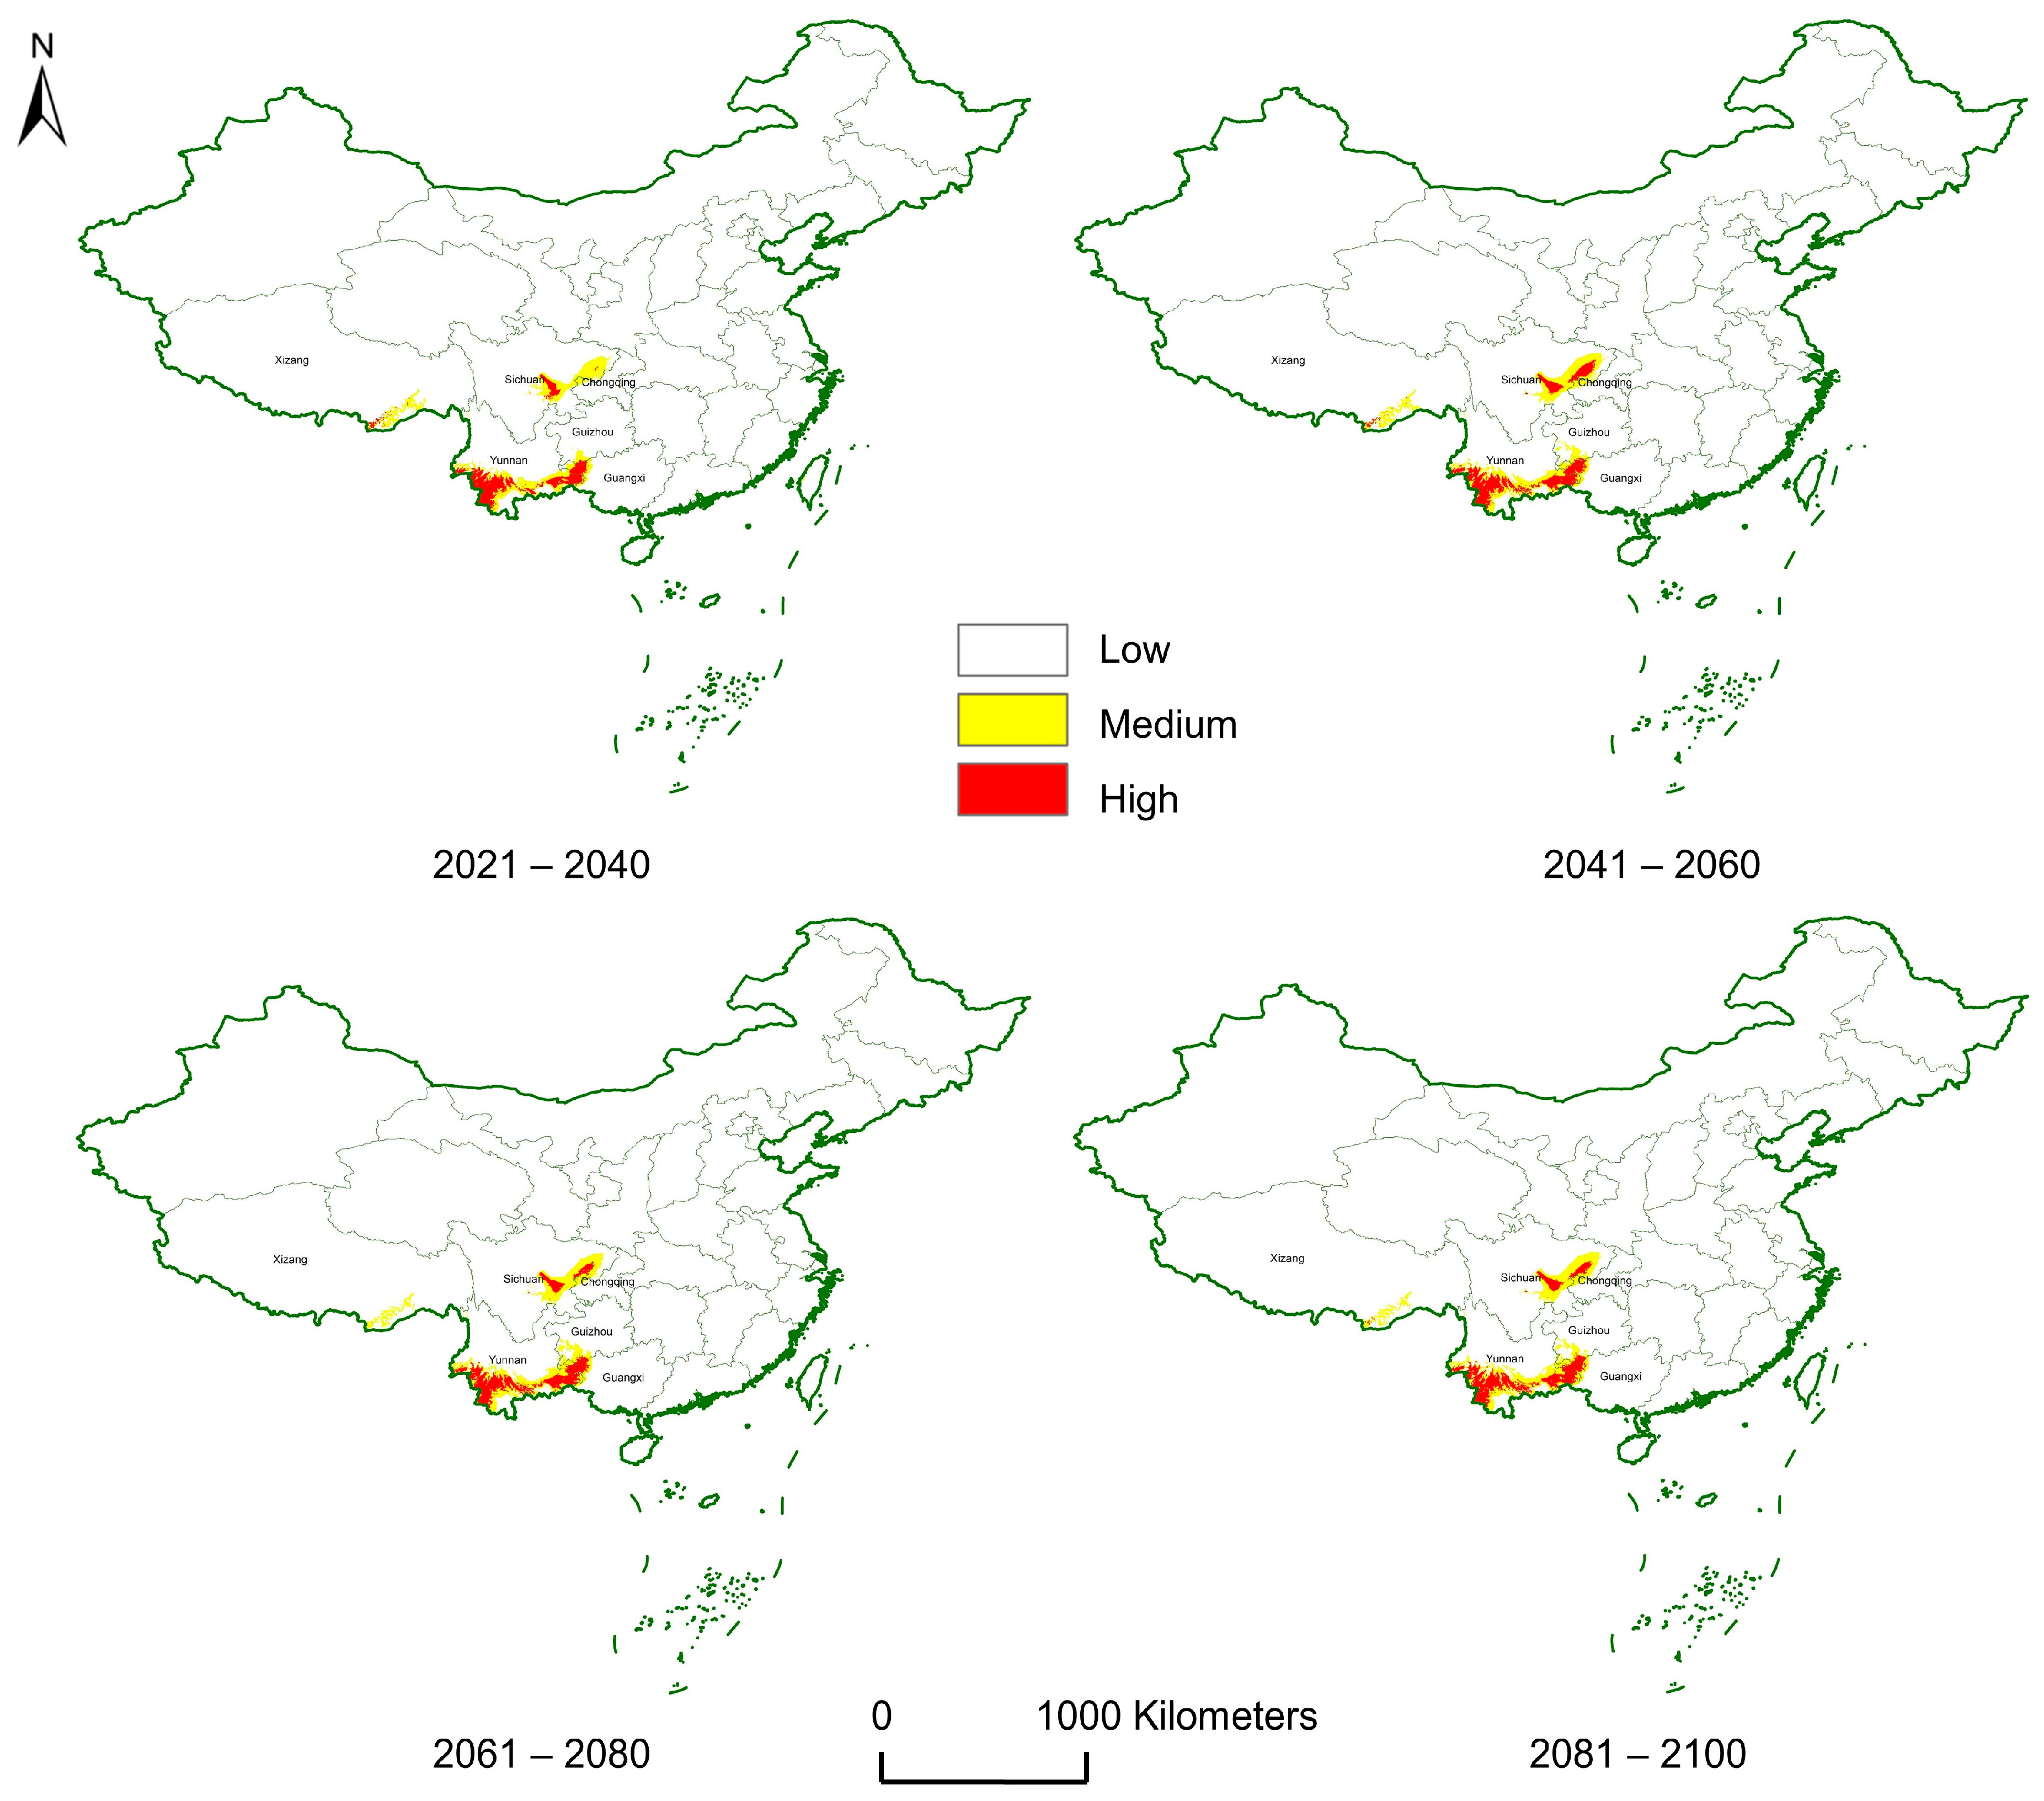
We analyzed the effects of climate change on the suitable areas of ancient Pu’er tea trees over 80 years, from 2021 to 2100, and expanded the extent of the model to a nationwide and global scale. The model in Pu’er predicted a southwestward and southward expansion of the suitable areas over the following 80 years. Although small shifts in the distribution are possible, the general distribution is likely to remain stable. We found that the area of high environmental suitability will increase and decrease in Sichuan and Xizang provinces, respectively (Figure 5). Detailed area shifts are shown in Table 2. Overall, the area of high and medium environmental suitability was predicted to be higher in Yunnan, Guangxi, and Guizhou provinces in 2100 relative to 2021; environmentally suitable areas in Xizang are predicted to decrease over this same period. Potentially suitable areas for ancient Pu’er tea trees occurred in several countries (Figure 6). Countries with high environmentally suitable areas include China, Vietnam, Laos, Myanmar (Burma), Thailand, India, Bhutan, Nepal, Ethiopia, Tanzania, Zimbabwe, South Africa, Swaziland, Madagascar, the United States, Mexico, Guatemala, Colombia, Peru, and Brazil. However, the most suitable area occurs in Asia.
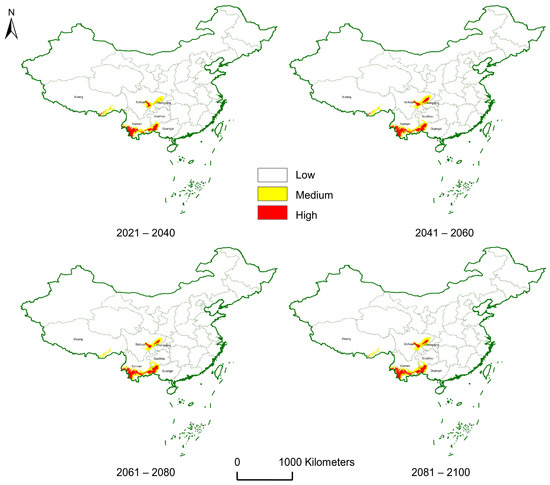
Figure 5.
Potential niches of ancient Pu’er tea trees over the next 80 years in China. The classes indicate levels of environmental suitability.
Table 2.
Areas (km2) of different environmental suitability over the next 80 years in China by province. Red text indicates increases and blue text indicates decreases (relative to the previous 20 years).
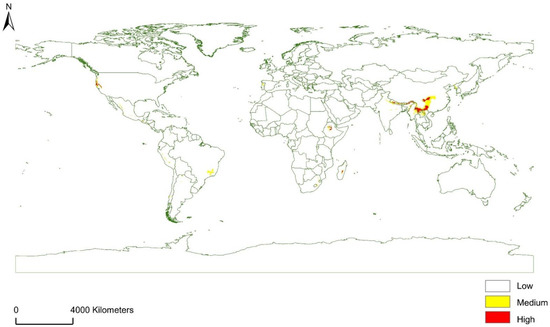
Figure 6.
Potential niches of ancient Pu’er tea trees for 2021–2100 (averaged) in the world. The classes represent levels of environmental suitability.
3.2. Management
We collected management data from fieldwork and a local report [46], which included both poorly managed and well-managed trees. Among the poorly-managed trees, the main areas for improvement included the following:
- (1)
- Disturbances from humans and livestock.
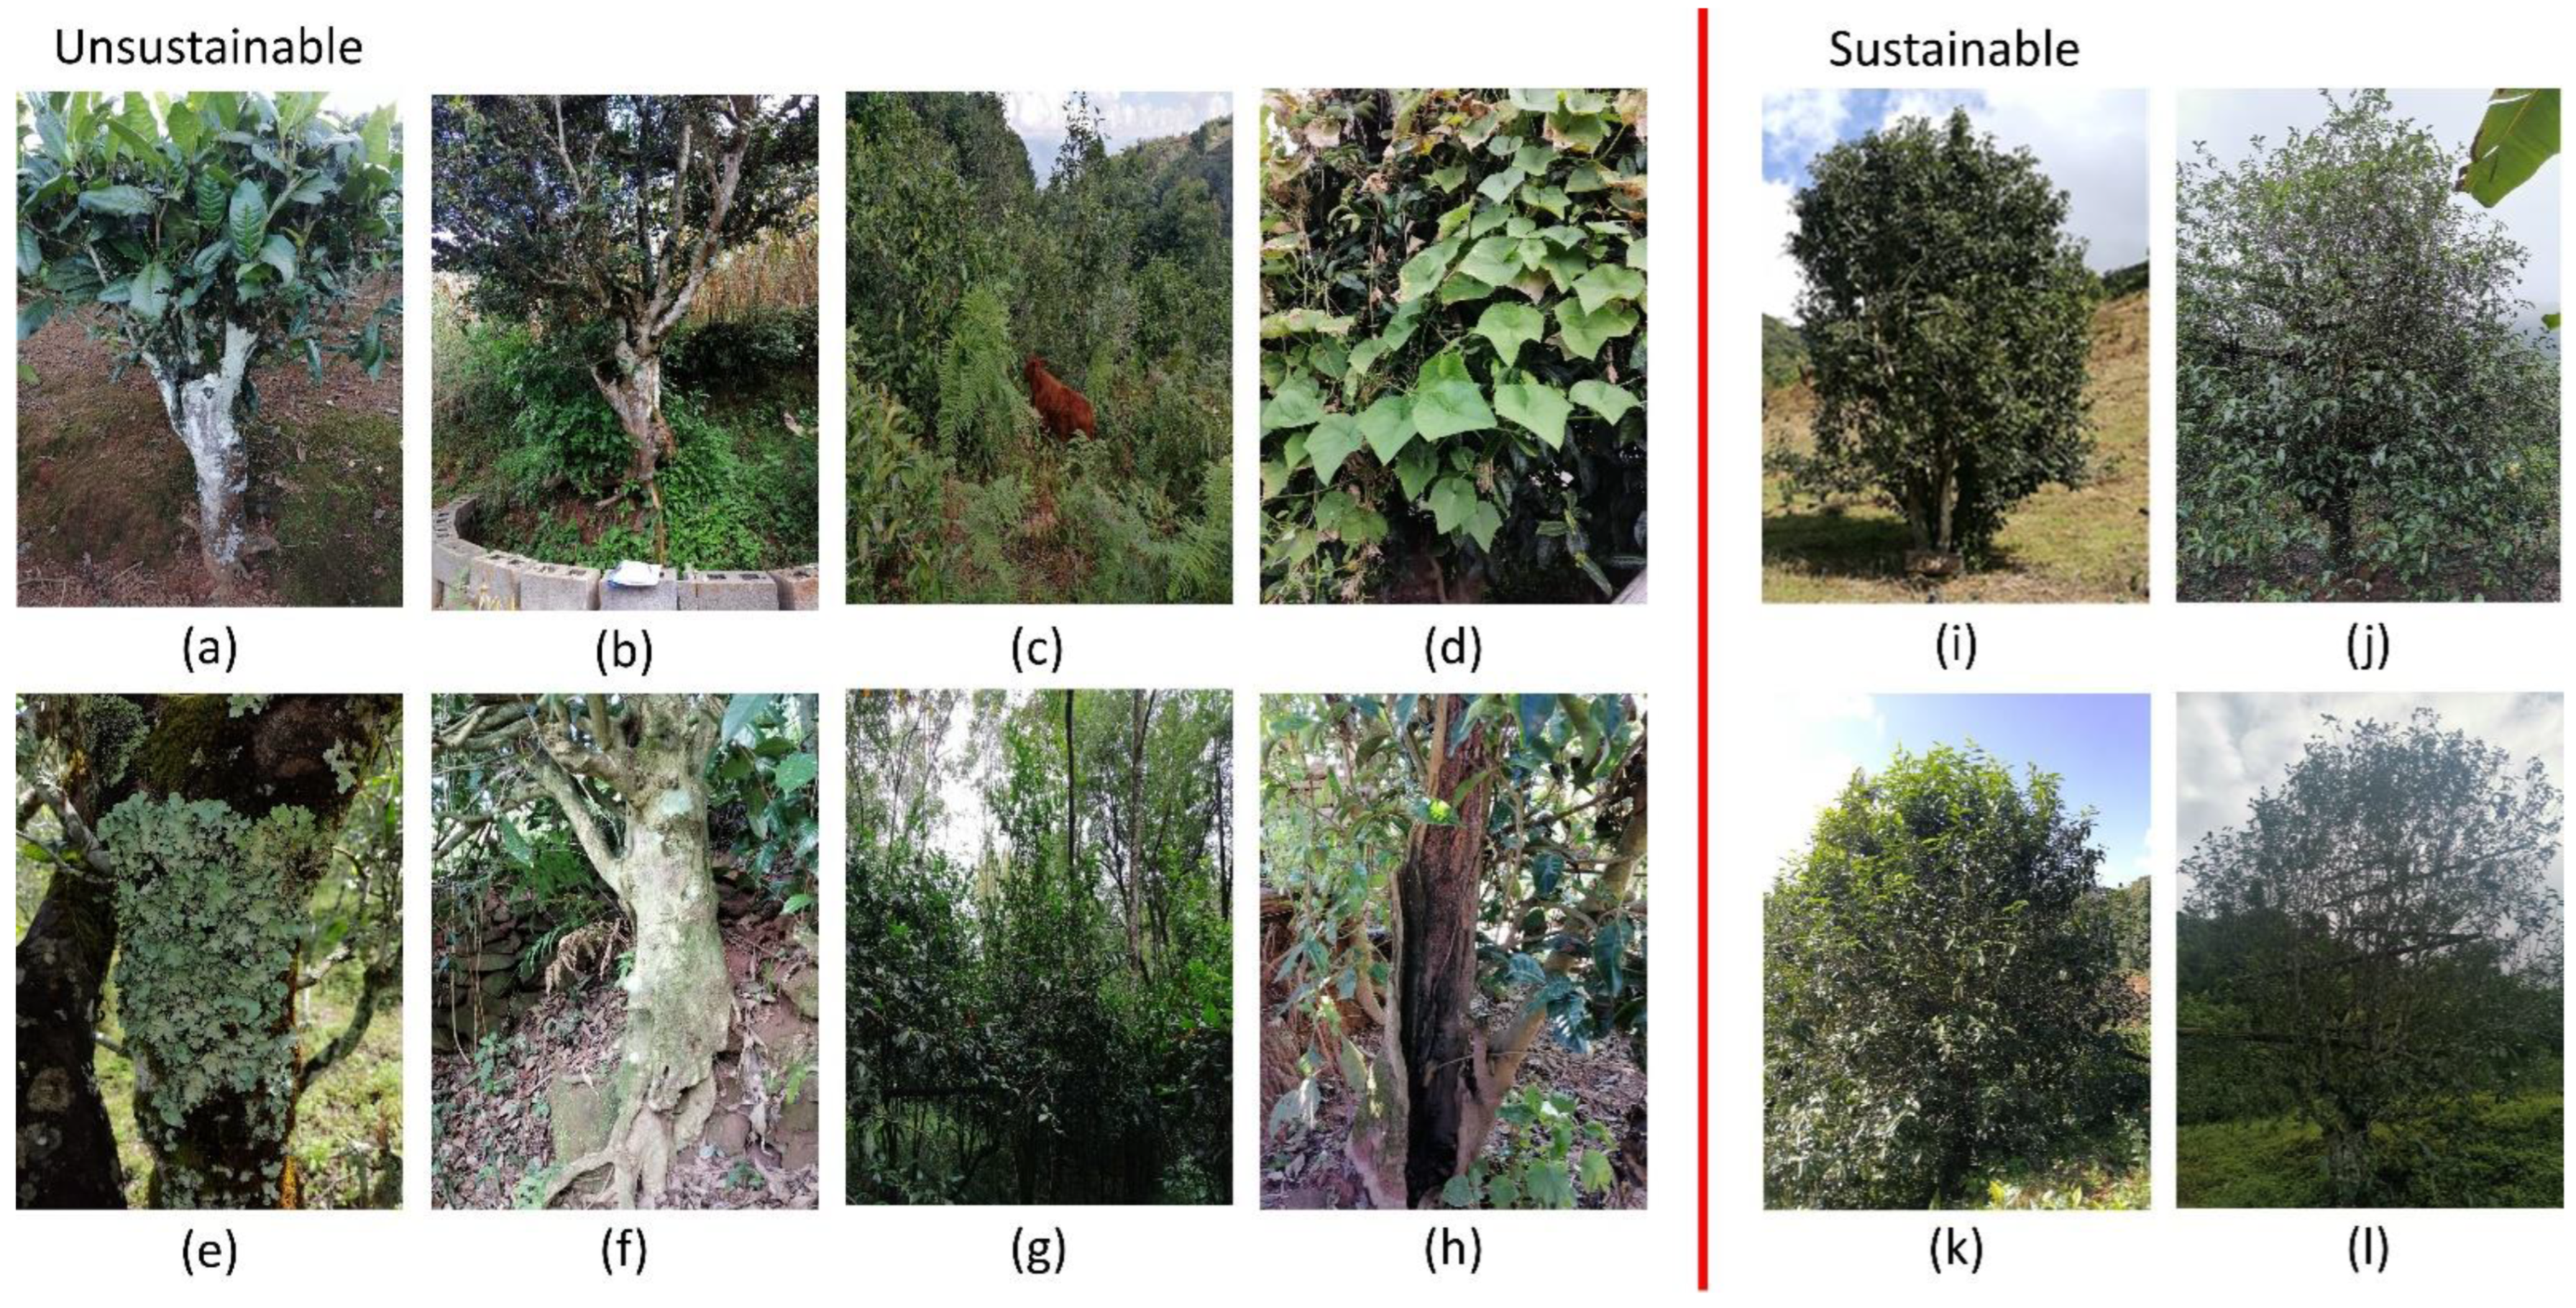
Some trees were modified by the application of iron brands, and structures were altered to display propaganda (Figure 7a). Some trees were surrounded by stone fences for organizational purposes (Figure 7b). Some managers grazed or permitted grazing in the tea gardens (Figure 7c).

Figure 7.
Variation in the management of ancient Pu’er tea trees. (a–h) are unsustainable (poorly managed); (i–l) are sustainable (well managed).
- (2)
- Weak protection awareness.
Some trees were not under any management. Consequently, some were invaded by pests (Figure 7d,e); some lacked soil nutrients (Figure 7f), and some experienced extensive shading due to the growth of other plants (Figure 7g).
- (3)
- Lack of management techniques.
Some trees were managed by indigenous tea growers. They knew how to maximize the productivity of their tea resources. However, some of them were unable to ensure the long-term survival of their trees because of lack of knowledge of or access to remedial treatment, even if they knew that the trees were dying. For example, some trunks had hollows created by bacteria and fungi (Figure 7h).
Managers of well-managed trees followed the common technical management regulations provided by the local government. Most of these trees were in good health and evaluated as “sustainable” (Figure 7i,j). The successful management approaches include the following:
- (1)
- Habitat management.
Destructive exploitation, excavation, mining, emission pollution, landfill, and deleterious construction projects were forbidden in the areas surrounding ancient tea trees (usually within a 10 m distance). With harmless plants retained and pests managed, stand density was regulated to promote tree development.
- (2)
- Tree growth management.
In addition to ventilation, shading reduction, and pest control, trees were pruned and reinforced to maximize growth. The water and soils were regularly monitored. Irrigation and fertilization measures were applied at appropriate intervals when necessary.
- (3)
- Harvest management.
The frequency of harvest (once or twice a year) depends on the trees’ vigor. Harvest was forbidden in summer for conservation purposes (the time trees grow fastest during the year). Only the middle and lower part of the canopy was harvested; one to two true leaves were left on the tree for every bud with two leaves removed.
4. Discussion
Here, we analyzed the suitable areas of ancient Pu’er tea trees using environmental variables, including historical and predicted future global climate data, as well as soil and landform data. The Maxent algorithm and occurrence records of ancient tea trees were used for modeling. We also assessed local management strategies and provide suggestions to guide conservation and production activities. Unlike many studies evaluating the extent of suitable areas using sampling surveys [55] and data from herbaria, the literature (meta-analysis) [56], or both, we conducted comprehensive surveys in the field. All our species occurrence records were derived from long-term field investigations. The dataset covered all known, targeted individual plants in the study area and was verified by the local government in the report. Thus, we believe that our dataset fits the Maxent requirements, and our findings could be applied to other areas. The use of management analysis of the suitable areas provides important practical insights.
We included all 28 parameters in the initial model, and some studies have indicated that potential correlations among variables might induce uncertainty related to multicollinearity in the results [51,53,57]. However, we did not omit any variable in the first stage because these variables are theoretically independent and possess unique significance. For example, we applied the sine and cosine functions to aspect values (see details in Table 1) and generated two variables: sin aspect and cos aspect. The former represents the east–west aspect, and the latter represents the north–south aspect. These variables are theoretically independent and important in environmental studies; however, they are statistically correlated, and there are algorithms to transfer one to the other. Another example is that the annual precipitation is statistically correlated with the min precipitation in the driest month. However, the two differ in their significance and both merit study. Hence, we think the statistic-based approach of leaving variables in the initial model lacks explanatory power at the theory-level; thus, we did not use the Pearson correlation analysis to keep the most important variables when variables correlated [58].
Our methodology minimized the theoretical uncertainty but increased the statistical uncertainty. To deal with this problem, we used the average of 10 replicates instead of only the 10th replicate, as has been performed in some previous studies [51]. We also set the maximum number of background points as 10,000 and the maximum number of iterations as 500 to account for potentially redundant calculations. The logistic outputs, AUC, and standard deviations of the ten runs were similar; thus, the level of statistical uncertainty was acceptable. We used 19 bioclimate variables instead of 28 in the climate change model because of data limitations.
The accuracy of the WorldClim data was evaluated by global correlation coefficients (between estimated and observed values). All temperature parameters had coefficients >0.99; solar radiation and vapor pressure had coefficients >0.95; precipitation had a coefficient of 0.86; and wind speed had a coefficient of 0.76 [41]. Future climate data from the new Earth system model MRI-ESM2.0 can produce more accurate simulations than MRI-CGCM3 and MRI-ESM1 in CMIP5. Specific improvements include the atmospheric vertical resolution, which consists of 80 layers (compared with 48 in its predecessor); enhanced resolution through the stratosphere–mesosphere and near the surface; non-orographic gravity wave drag parameterization; and an improved stratocumulus cloud scheme, including cloud macro- and microphysics, cloud radiation, aerosols, and atmospheric chemistry [44].
We calculated the average values of the bioclimate variables from 1970 to 2000 so that they reflected the general environmental conditions, given that ancient tea trees have long growth cycles. We also used annually averaged values of wind speed, water vapor pressure, and solar radiation. However, we did not consider whether the extremes (e.g., wind in spring and solar radiation in autumn) limit the distribution of tea trees. Future phytogeographical studies are needed to test this possibility. We used soil texture as an indicator of soil traits because it is quantitative, and these data are accessible. However, other parameters such as soil type, pH, and nutrition are also important. Additional field-based studies are needed to collect these data directly from the environment. Climate monitoring points could be established around these trees to improve the quality of the climate data; alternatively, data could be regularly collected from nearby weather stations. The climate change prediction models and the distribution models can be optimized using these data.
The estimates of percent contribution and importance (Table 1) were determined by variation in the AUC. To determine the first estimate, the increase in regularized gain was added to the contribution of the corresponding variable in each run of the training process; alternatively, it was subtracted from the corresponding variable if the change was negative. For the second estimate, the values of each environmental variable in the training and background data were randomly permuted. The model was then reassessed on the permuted data, and the following decrease in training AUC was normalized to percentages. We did not show the AUC and standard deviations of the climate change models of China and the world because the same modeling parameters as the Pu’er model were used, and only the extent was modified; we found that the accuracy of these models was nearly the same (>0.9).
Some of the often overlooked assumptions of Maxent are that the observed results are an outcome of random or representative sampling and that detectability does not change with the covariates that determine occurrence probability [57]. In our study, we used all known ancient Pu’er tea trees in the county to ensure that sampling was comprehensive, and the detection of coordinates was conducted prior to building the environmental dataset. However, the data distribution appeared “biased” in the global map. The inclusion of samples outside the study area or even outside China better meets these assumptions, but our study objects are endemic and special. Thus, our modeling results still have reference value for inferring the environmental suitability of other regions and the effects of climate change on the future distribution of ancient tea trees. Additional studies are needed to evaluate the feasibility of transplanting trees to other suitable areas to more robustly determine the role that the environment plays in the distribution of ancient Pu’er tea trees.
We used coordinates from Jinggu Dai and Yi Autonomous County as the training set, assuming that the environmental conditions in this area were representative of the Pu’er region and thus suitable for ancient tea trees. However, this does not mean that other environmental conditions are unsuitable. Our model only provided predictions on the suitability of habitat from a small-scale dataset. A more systematic study that considers more factors such as extreme environmental conditions, genes, and ecosystems is needed. In addition, niches have reference value but do not reflect the actual distributions of species. The reason is that the distribution of species is not only determined by the environment but also by other factors such as genes, management, and disturbances. Hence, it is not unexpected that the suitable areas (shaded red and yellow areas) in southern Lancang were low, despite the fact that only the distributions of ancient tea trees were considered in our model; the current study mapped teas in all ages (Figure 4). Nevertheless, the overall fitness of the model was acceptable.
Robust management strategies are also important for ensuring the sustainable development of ancient tea tree cultivation. In this study, we conducted field investigations, consulted a government report [46], and took photographs to characterize the health of trees under different management strategies. The results indicated that there was much variation in the health conditions of the trees. Although we surveyed only a single county in Pu’er, our sampling was comprehensive; our findings indicate that deficiencies in management in one region can have reference value for other regions. Globally, although our model identified countries with high environmentally suitable areas, high environmental suitability does not indicate that such countries are currently aiming to cultivate Pu’er tea. Thus, our findings merely indicate where ancient Pu’er tea trees could potentially occur or be transplanted. In the event that interest in the development of tea plantations increases in some countries, dedicated efforts at improving current management practices will be needed to optimize production and expand the area in which ancient Pu’er tea trees can be cultivated.
Managers and potential managers of ancient tea trees need to find a balance between the needs of conservation and production. We propose the following suggestions in light of our investigation of the effects of local management strategies to balance economic growth and sustainable development:
- (1)
- Improve and unify management regulations.
Regulations in different villages and towns should be unified at the regional scale, whilst allowing appropriate local adaptation. Strategies should be developed based on those that have proven successful for other well-managed trees. For example, evaluating and classifying trees will help determine optimal harvesting schemes and management strategies. Specifying methodologies for different classes will increase the efficacy of management and conservation. Penalties should be in place for instances in which rules are violated.
- (2)
- Increase publicity and education.
The need to increase public awareness to conserve ancient tea tree resources should be emphasized in local media. A sense of responsibility should be cultivated in both local people and tourists.
- (3)
- Increase investments in technologies and the livelihoods of natives.
Technical training for tea growers is necessary for improving their management skills, such as pruning, water and fertilization, management, and pest control. The provision of relevant support and equipment should be guaranteed. For areas that have been historically overexploited, the income of local people should be improved via alternative means, such as the planting of other economic crops, providing work opportunities, and offering extra financial incentives to care for ancient tea trees.
- (4)
- Quality control for brand building.
Quality control will enhance sales, reputation, and the long-term development of a multi-brand strategy. Quality control will enhance sales, reputation, and the long-term development of multi-brand strategies.
- (5)
- Collect and preserve germplasm resources for long-term use.
Ancient tea trees are important biological resources requiring long-term collection and preservation. Genetic information and seed banks are valuable resources for tea plantations as well as for improving tea production. A long-term project for storing related biological resources is needed.
Overall, our findings revealed the effects of environmental variables on the distribution of ancient Pu’er tea trees and the effects of climate change on the future potential niches of these trees. We identified potentially suitable areas at different scales from 2021 to 2100. We also provided an example in which climate change facilitates a range expansion of ancient tea trees. This is inconsistent with previous studies indicating the negative effects of climate change on trees and forests [22,51]. Hence, climate change’s effects on different species and the effects of different temperature bands are worth exploring. Our management analysis provided suggestions that could be used to promote sustainable development. Insights from cases of effective and poor management in the ancient tea tree’s habitat could be applied to other cash forests or economically important ancient plant resources.
Ancient tea trees are different from other ancient tree resources because of their high economic value and potential to be sustainably managed. Unlike timber products from old trees, tea harvesting can be conducted annually or biannually for the productive life of the tree; their conservation and sustainable management thus require sufficient attention. Such research is the first step in the study of ancient tea trees. Several outstanding research questions remain. For example, do other environmentally suitable conditions aside from those in the Pu’er region exist? Can Pu’er tea species be cultivated in regions outside of where they currently occur and can this be practically achieved in the current political environment? How will human activities, such as harvesting, quantitatively affect the age of Pu’er tea trees? Such questions merit further research.
5. Conclusions
In this study, we modeled the distribution of ancient Pu’er tea trees, characterized potential shifts in the suitable areas that might occur due to climate change, and analyzed the set of management measures currently employed for ancient tea trees. We also made several management suggestions. The results suggest that suitable areas are present within the current distribution, and the most important variables are annual precipitation and min temperature of the coldest month. Under climate change, the area of suitable habitat is predicted to increase over the next 80 years, which verified our assumption. Other suitable areas were identified in other regions and continents outside of our study area. Most of them are in Asian countries such as Vietnam, Laos, and India. The conditions in these regions are similar to the environment in which the ancient individual plants naturally occur. Our findings provide important insights for future analyses of transplantation and suggest the possibilities of cultivating long-lasting teas in subsequent centuries. We also found that effective management approaches will improve the health of these ancient tea trees significantly. Poorly managed trees are damaged or dying, even if they are in suitable environments. Hence, the conservation and sustainable development of ancient tea trees require management strategies that are based on successful cases of well-managed trees and effective policies. In future studies, our dataset should be expanded to include other regions where ancient tea trees occur in Southeast Asia; the ability of ancient tea trees to be cultivated in other regions both inside and outside of the suitable areas predicted by our model should be explored; and effective and unified management policies should be developed.
Author Contributions
S.Z. and S.L. conceived the project and designed the methodology; S.Z. analyzed the data and led the writing of the manuscript; and X.C., Z.W., K.C. and S.L. collected the data. All authors have read and agreed to the published version of the manuscript.
Funding
This research was funded by the Science and Technology Development Center of State Forestry and Grassland Administration, grant number KJZXSA202039, and the Chinese Academy of Forestry, grant number CAFYBB2019ZC007.
Institutional Review Board Statement
Not applicable.
Informed Consent Statement
Not applicable.
Data Availability Statement
The datasets generated during and/or analyzed during the current study are available from the first and corresponding authors on reasonable request.
Acknowledgments
This research is a part of the Ancient Tea Trees Land Resource Survey Project. We thank the Forestry and Grassland Bureau in Jinggu Dai and Yi Autonomous County for supplying equipment and providing local reports and Peter Kanowski at Australian National University for reviewing our manuscript. We also acknowledge the World Climate Research Program, which, through its Working Group on Coupled Modelling, coordinated and promoted CMIP6. We thank the climate modeling groups for producing and making available their model outputs, the Earth System Grid Federation (ESGF) for archiving the data and providing access to them, and the multiple funding agencies supporting the CMIP6 and ESGF.
Conflicts of Interest
The authors declare no conflict of interest.
References
- Brody, H. Tea. Nature 2019, 566, S1. [Google Scholar] [CrossRef] [PubMed] [Green Version]
- Nowogrodzki, A. How climate change might affect tea. Nature 2019, 566, S10–S11. [Google Scholar] [CrossRef] [PubMed] [Green Version]
- Kfoury, N.; Scott, E.R.; Orians, C.M.; Ahmed, S.; Cash, S.B.; Griffin, T.; Matyas, C.; Stepp, J.R.; Han, W.; Xue, D.; et al. Plant-Climate Interaction Effects: Changes in the Relative Distribution and Concentration of the Volatile Tea Leaf Metabolome in 2014–2016. Front. Plant Sci. 2019, 10, 1518. [Google Scholar] [CrossRef] [PubMed] [Green Version]
- Meegahakumbura, M.K.; Wambulwa, M.C.; Li, M.-M.; Thapa, K.K.; Sun, Y.-S.; Möller, M.; Xu, J.-C.; Yang, J.-B.; Liu, J.; Liu, B.-Y.; et al. Domestication Origin and Breeding History of the Tea Plant (Camellia sinensis) in China and India Based on Nuclear Microsatellites and cpDNA Sequence Data. Front. Plant Sci. 2017, 8, 2270. [Google Scholar] [CrossRef] [Green Version]
- Banerjee, B. Botanical Classification of Tea; Springer: Dordrecht, Germany, 1992. [Google Scholar]
- Wight, W. A Revision of the Genus Camellia. Theor. Appl. Genet. 1959, 28, 89. [Google Scholar]
- Zhang, H. Systematic Classification of Tea Plants. J. Sun Yatsen Univ. 1981, 89–101. [Google Scholar]
- Li, M.; Meegahakumbura, M.K.; Yan, L.; Liu, J.; Gao, L. Genetic Involvement of Camellia taliensis in the Domestication of C. sinensis var. assamica (Assimica Tea) Revealed by Nuclear Microsatellite Markers. Plant Divers. Resour. 2015, 37, 29–37. [Google Scholar]
- Zhang, J. Puer Tea: Ancient Caravans and Urban Chic; University of Washington Press: Seattle, WA, USA, 2014. [Google Scholar]
- Lu, L.; Chen, H.; Wang, X.; Zhao, Y.; Yao, X.; Xiong, B.; Deng, Y.; Zhao, D. Genome-level diversification of eight ancient tea populations in the Guizhou and Yunnan regions identifies candidate genes for core agronomic traits. Hortic. Res. 2021, 8, 190. [Google Scholar] [CrossRef]
- Zhao, Y.; Wang, R.; Liu, Q.; Dong, X.; Zhao, D.-G. Genetic Diversity of Ancient Camellia sinensis (L.) O. Kuntze in Sandu County of Guizhou Province in China. Diversity 2021, 13, 276. [Google Scholar] [CrossRef]
- Bonte, F.; Ulrichova, J.; Saladin, R. Skin Antiaging and Detoxifying Properties of Ancient Tea Forest Pu’er Tea. Free. Radic. Biol. Med. 2016, 100, S80. [Google Scholar] [CrossRef]
- Fischer, J.; Zerger, A.; Gibbons, P.; Stott, J.; Law, B.S. Tree decline and the future of Australian farmland biodiversity. Proc. Natl. Acad. Sci. USA 2010, 107, 19597–19602. [Google Scholar] [CrossRef] [PubMed] [Green Version]
- Le Roux, D.S.; Ikin, K.; Lindenmayer, D.B.; Manning, A.D.; Gibbons, P. The future of large old trees in urban landscapes. PLoS ONE 2014, 9, e99403. [Google Scholar] [CrossRef] [PubMed]
- Linder, P.; Östlund, L. Structural changes in three mid-boreal Swedish forest landscapes, 1885–1996. Biol. Conserv. 1998, 85, 9–19. [Google Scholar] [CrossRef]
- Laurance, W.F.; Delamônica, P.; Laurance, S.G.; Vasconcelos, H.L.; Lovejoy, T.E. Rainforest fragmentation kills big trees. Nature 2000, 404, 836. [Google Scholar] [CrossRef]
- Gibbons, P.; Lindenmayer, D.B.; Fischer, J.; Manning, A.D.; Weinberg, A.; Seddon, J.; Ryan, P.; Barrett, G. The future of scattered trees in agricultural landscapes. Conserv. Biol. 2008, 22, 1309–1319. [Google Scholar] [CrossRef]
- Benn, J.A. Tea in China: A Religious and Cultural History; University of Hawaii Press: Honolulu, HI, USA, 2015. [Google Scholar]
- Rose, S. For All the Tea in China: How England Stole the World’s Favorite Drink and Changed History; Penguin Books: New York, NY, USA, 2011. [Google Scholar]
- Dutta, R. Climate change and its impact on tea in Northeast India. J. Water Clim. Chang. 2014, 5, 625–632. [Google Scholar] [CrossRef]
- Wamalwa, B.P. Sustainable Supply Chain Management as a Strategic Tool for Competitive Advantage in Tea Industry in Kenya. J. Manag. Sustain. 2014, 4, 157. [Google Scholar] [CrossRef]
- Campbell, E.M.; Magnussen, S.; Antos, J.A.; Parish, R. Size-, species-, and site-specific tree growth responses to climate variability in old-growth subalpine forests. Ecosphere 2021, 12, e03529. [Google Scholar] [CrossRef]
- Larjavaara, M. The world’s tallest trees grow in thermally similar climates. New Phytol. 2014, 202, 344–349. [Google Scholar] [CrossRef]
- Slik, J.W.F.; Paoli, G.; McGuire, K.; Amaral, I.; Barroso, J.; Bastian, M.; Blanc, L.; Bongers, F.; Boundja, P.; Clark, C.; et al. Large trees drive forest aboveground biomass variation in moist lowland forests across the tropics. Glob. Ecol. Biogeogr. 2013, 22, 1261–1271. [Google Scholar] [CrossRef]
- Kim, D.; Arthur, M.A. Changes in community structure and species–landform relationship after repeated fire disturbance in an oak-dominated temperate forest. Ecol. Res. 2014, 29, 661–671. [Google Scholar] [CrossRef]
- You, Q.; Kociolek, J.P.; Yu, P.; Cai, M.; Lowe, R.; Wang, Q. A new species ofSimonseniafrom a karst landform, Maolan Nature Reserve, Guizhou Province, China. Diatom Res. 2016, 31, 269–275. [Google Scholar] [CrossRef]
- Venter, M.; Dwyer, J.; Dieleman, W.; Ramachandra, A.; Gillieson, D.; Laurance, S.; Cernusak, L.A.; Beehler, B.; Jensen, R.; Bird, M.I. Optimal climate for large trees at high elevations drives patterns of biomass in remote forests of Papua New Guinea. Glob. Chang. Biol. 2017, 23, 4873–4883. [Google Scholar] [CrossRef] [PubMed]
- Lindenmayer, D.B.; Laurance, W.F. The ecology, distribution, conservation and management of large old trees. Biol. Rev. Camb. Philos. Soc. 2017, 92, 1434–1458. [Google Scholar] [CrossRef] [PubMed]
- Pavlin, J.; Nagel, T.A.; Svitok, M.; Pettit, J.L.; Begović, K.; Mikac, S.; Dikku, A.; Toromani, E.; Panayotov, M.; Zlatanov, T.; et al. Disturbance history is a key driver of tree life span in temperate primary forests. J. Veg. Sci. 2021, 32, e13069. [Google Scholar] [CrossRef]
- Soley-Guardia, M.; Radosavljevic, A.; Rivera, J.L.; Anderson, R.P. The effect of spatially marginal localities in modelling species niches and distributions. J. Biogeogr. 2014, 41, 1390–1401. [Google Scholar] [CrossRef]
- Koch, A.; Kaplan, J.O. Tropical forest restoration under future climate change. Nat. Clim. Chang. 2022, 12, 279–283. [Google Scholar] [CrossRef]
- Janusz, C.; Radosław, G.; Kamil, M.; Magdalena, J.; Jan, T.; Łukasz, S. The influence of the forest management in the Białowieża forest on the species structure of the forest community. For. Ecol. Manag. 2021, 496, 119363. [Google Scholar] [CrossRef]
- Shen, Q.; Zhang, X.; Li, L.; He, Y. Analysis of Sensory Quality and Chemical Components for Ancient Tea Trees in Yanhe. Guizhou Nong Ye Ke Xue 2015, 43. [Google Scholar]
- Sigley, G. Reimagining the ‘Central Plains’ (Zhongyuan) and ‘Borderlands’ (Bianjiang): The cultural heritage scholarship of the Ancient Tea Horse Road (Chamagudao) of Southwest China. Int. J. Herit. Stud. IJHS 2021, 27, 904–919. [Google Scholar] [CrossRef]
- Ji, P.-Z.; Jiang, H.-B.; Huang, X.-Q.; Zhang, J.; Liang, M.-Z.; Wang, P.-S. Genetic diversity of ancient tea gardens and tableland tea gardens from Yunnan Province as revealed by AFLP marker. Yíchuán 2009, 31, 101–108. [Google Scholar] [CrossRef] [PubMed]
- Tian, G.; Xu, Y.; Gao, Y.; Wang, Y. Ecological Environment of Erhai and Lashihai Watersheds of the Ancient Tea Horse Road on the Yunnan-Tibet Line. J. Coast. Res. 2020, 115, 401–404. [Google Scholar] [CrossRef]
- Gamage, D.; Thompson, M.; Sutherland, M.; Hirotsu, N.; Makino, A.; Seneweera, S. New insights into the cellular mechanisms of plant growth at elevated atmospheric carbon dioxide concentrations. Plant Cell Environ. 2018, 41, 1233–1246. [Google Scholar] [CrossRef] [PubMed]
- Hayes, S. Why Do Leaves Rise with the Temperature? Plant Physiol. 2019, 180, 691–692. [Google Scholar] [CrossRef] [Green Version]
- Mirza, H. Plant Ecophysiology and Adaptation under Climate Change: Mechanisms and Perspectives I: General Consequences and Plant Responses; Springer: Singapore, 2020. [Google Scholar]
- Pu’er-Municipal-People’s-Government. Geographical Environment (Translated). Available online: www.puershi.gov.cn (accessed on 4 March 2022).
- Fick, S.E.; Hijmans, R.J. WorldClim 2: New 1-km spatial resolution climate surfaces for global land areas. Int. J. Climatol. 2017, 37, 4302–4315. [Google Scholar] [CrossRef]
- NASA. Advanced Land Observing Satellite-1. Available online: https://search.asf.alaska.edu (accessed on 11 February 2022).
- Resource and Environment Science and Data Center. Soil Texture Spatial Distribution Data in China. Available online: www.resdc.cn (accessed on 17 January 2022).
- Yukimoto, S.; Kawai, H.; Koshiro, T.; Oshima, N.; Yoshida, K.; Urakawa, S.; Tsujino, H.; Deushi, M.; Tanaka, T.; Hosaka, M.; et al. The Meteorological Research Institute Earth System Model Version 2.0, MRI-ESM2.0: Description and Basic Evaluation of the Physical Component. J. Meteorol. Soc. Jpn. Ser. II 2019, 97, 931–965. [Google Scholar] [CrossRef] [Green Version]
- Eyring, V.; Bony, S.; Meehl, G.A.; Senior, C.A.; Stevens, B.; Stouffer, R.J.; Taylor, K.E. Overview of the Coupled Model Intercomparison Project Phase 6 (CMIP6) experimental design and organization. Geosci. Model Dev. 2016, 9, 1937–1958. [Google Scholar] [CrossRef] [Green Version]
- Liao, S.; Li, L.; Lv, H.; Wu, W.; Wang, Z.; Kong, W.; Li, Z.; Ma, F.; Xu, L. Jinggu Dai and Yi Autonomous County Ancient (Wild) Tea Trees Resources; Yunnan Institute of Forest Inventory and Planning, Chinese Academy of Forestry Research Institute of Resource Insects: Pu’er, Yunnan, China, 2019. [Google Scholar]
- Phillips, S.J.; Anderson, R.P.; Dudík, M.; Schapire, R.E.; Blair, M.E. Opening the black box: An open-source release of Maxent. Ecography 2017, 40, 887–893. [Google Scholar] [CrossRef]
- Bradie, J.; Leung, B. A quantitative synthesis of the importance of variables used in MaxEnt species distribution models. J. Biogeogr. 2017, 44, 1344–1361. [Google Scholar] [CrossRef]
- Sobek-Swant, S.; Kluza, D.A.; Cuddington, K.; Lyons, D.B. Potential distribution of emerald ash borer: What can we learn from ecological niche models using Maxent and GARP? For. Ecol. Manag. 2012, 281, 23–31. [Google Scholar] [CrossRef]
- Phillips, S.J.; Anderson, R.P.; Schapire, R.E. Maximum entropy modeling of species geographic distributions. Ecol. Model. 2006, 190, 231–259. [Google Scholar] [CrossRef] [Green Version]
- Khan, A.M.; Li, Q.; Saqib, Z.; Khan, N.; Habib, T.; Khalid, N.; Majeed, M.; Tariq, A. MaxEnt Modelling and Impact of Climate Change on Habitat Suitability Variations of Economically Important Chilgoza Pine (Pinus gerardiana Wall.) in South Asia. Forests 2022, 13, 715. [Google Scholar] [CrossRef]
- Li, Y.; Li, M.; Li, C.; Liu, Z. Optimized Maxent Model Predictions of Climate Change Impacts on the Suitable Distribution of Cunninghamia lanceolata in China. Forests 2020, 11, 302. [Google Scholar] [CrossRef] [Green Version]
- Elith, J.; Phillips, S.J.; Hastie, T.; Dudík, M.; Chee, Y.E.; Yates, C.J. A statistical explanation of MaxEnt for ecologists. Divers. Distrib. 2011, 17, 43–57. [Google Scholar] [CrossRef]
- Jiang, H.; Tang, Y.; Chen, L.; Wang, P.; Cai, X.; Yu, F.; Yang, L.; Wang, X.; Li, C.; Jiang, H.; et al. Survey and Analysis of Ancient Tea Plant Resources in Yunnan Province, China. J. Plant Genet. Resour. 2020, 21, 296–307. [Google Scholar]
- Zhang, Z.; Sun, J.; Liu, M.; Shang, H.; Wang, J.; Wang, J.; Zhou, H.; Li, Y.; Wang, Y.; Chen, W. Context-Dependency in Relationships Between Herbaceous Plant Leaf Traits and Abiotic Factors. Front. Plant Sci. 2022, 13, 757077. [Google Scholar] [CrossRef]
- Ahmad, A.; Ahmad, S.R.; Gilani, H.; Tariq, A.; Zhao, N.; Aslam, R.W.; Mumtaz, F. A Synthesis of Spatial Forest Assessment Studies Using Remote Sensing Data and Techniques in Pakistan. Forests 2021, 12, 1211. [Google Scholar] [CrossRef]
- Yackulic, C.B.; Chandler, R.; Zipkin, E.F.; Royle, J.A.; Nichols, J.D.; Campbell Grant, E.H.; Veran, S.; O’Hara, R.B. Presence-only modelling using MAXENT: When can we trust the inferences? Methods Ecol. Evol. 2013, 4, 236–243. [Google Scholar] [CrossRef]
- Jiang, R.; Zou, M.; Qin, Y.; Tan, G.; Huang, S.; Quan, H.; Zhou, J.; Liao, H. Modeling of the Potential Geographical Distribution of Three Fritillaria Species Under Climate Change. Front. Plant Sci. 2022, 12, 749838. [Google Scholar] [CrossRef]


Publisher’s Note: MDPI stays neutral with regard to jurisdictional claims in published maps and institutional affiliations. |
© 2022 by the authors. Licensee MDPI, Basel, Switzerland. This article is an open access article distributed under the terms and conditions of the Creative Commons Attribution (CC BY) license (https://creativecommons.org/licenses/by/4.0/).