Article

Stomatal Limitation Is Able to Modulate Leaf Coloration Onset of Temperate Deciduous Tree

1
State Key Laboratory of Severe Weather, Chinese Academy of Meteorological Sciences, Beijing 100081, China
2
Hebei Gucheng Agricultural Meteorology National Observation and Research Station, Hebei 072656, China
3
Collaborative Innovation Center on Forecast Meteorological Disaster Warning and Assessment, Nanjing University of Information Science & Technology, Nanjing 210044, China
4
College of Resources and Environmental Sciences, China Agricultural University, Beijing 100193, China
*
Authors to whom correspondence should be addressed.
Forests 2022, 13(7), 1099; https://doi.org/10.3390/f13071099
Submission received: 13 June 2022 / Revised: 10 July 2022 / Accepted: 11 July 2022 / Published: 13 July 2022
(This article belongs to the Section Forest Ecophysiology and Biology)

Abstract

:
Autumn phenology, determined mainly by temperature and photoperiod, is essential for ecosystem carbon sequestration. Usually, the variations in the maximum rate of Rubisco (Vcmax) and the maximum rate of ribulose-bisphosphate regeneration (Jmax) are taken as the mechanism regulating the seasonal pattern of photosynthetic rates and autumn phenology. In this study, we used Quercus mongolicus seedlings as an example to examine the photosynthetically physiological mechanism of leaf coloration onset (LCO) responding to different warming and photoperiod treatments based on experimental data acquired from large artificial climate simulation chambers. The results indicated that: (1) LCO and the net CO2 assimilation rate (Pn), transpiration rate (Tr), stomatal conductance (Gs), Vcmax, and Jmax of Quercus mongolicus seedlings were significantly affected by the changes of photoperiod. (2) LCO was significantly correlated only with the Pn approach, supporting the view that leaf senescence is the result of a trade-off between nutrient resorption and reserves. (3) The major variation in stomatal conductance (Gs) is the mechanism by which photoperiod regulates the seasonal pattern of photosynthetic rates, implying that both limitations of stomatal and photosynthetical capacity (Vcmax and Jmax, non-stomatal limitation) are able to modulate LCO. Our study riches the knowledge of phenology and provides a reference for phenological modelling and ecosystem carbon estimation.

1. Introduction

Plant phenology, particularly the length of the growing season (from leaf expansion to leaf coloring), is closely related to vegetation productivity and carbon sequestration [1,2,3,4]. Plant phenology is sensitive to climate change and has already changed because of the increase in global warming [5,6,7]. Evidence from many regions worldwide demonstrates that climate change has advanced spring phenology, delayed autumn phenology, and induced a prolonged growing season [8,9,10,11]. Autumn phenology (i.e., leaf coloring and leaf drop) may affect individual plant reproductive ability and the length of the growing season, which are crucial to ecosystem net productivity and the carbon cycle [12,13,14,15]. Phenological changes over the Northern Hemisphere suggest that the extension of the growing season in recent decades is due to the postponed autumn phenology rather than advanced spring phenology [16]. A flux study from 22 forest sites in North America and Europe also showed that changes in ecosystem net productivity can be largely explained by autumn phenology variation, and autumn phenology has a greater impact than spring phenology [17]. These results highlight that autumn phenology influences ecosystem carbon sequestration more than spring phenology does. However, research on autumn phenology and its mechanism is far less than spring phenology.
Temperature and photoperiod are the two major limiting factors of autumn phenology [15,18]. Reports have indicated that leaf phenology is particularly sensitive to temperature; warming can delay leaf senescence and postpone the end of the growth season [19,20,21,22]. Because of the regulation of photoperiod, another factor driving plant phenology, leaf senescence in some plants occurs almost on the same day each year [2,23]. A study of the Qinghai Tibet Plateau found that leaf senescence of all alien species is mainly caused by the shortening of photoperiod, not the location [20]. Effects of temperature and photoperiod on leaf senescence may be attributed to a trade-off between carbon and nitrogen metabolism. Plants choose the best leaf senescence time to simultaneously extend the growing season to increase carbon reserves, reduce the risk of low-temperature damage, and maximize nitrogen recovery before frost [24,25,26]. Zani et al. [27] found that increased seasonal productivity could be an influential driver of earlier leaf senescence in temperate deciduous trees because elevated carbon capture shortens the productive season. The physiological processes and mechanisms underlying the effects of photoperiod and temperature on autumn phenology are unclear.
Quercus mongolicus is one of the dominant tree species in East Asian broad-leaved forests; it protects from the wind, conserves water, and prevents fire and ecological development; it has been observed in Russia, China, the Korean Peninsula, and Japan [28]. As a light-favored species, light conditions play a vital role in the morphology, photosynthesis, biomass, and phenology of Quercus mongolicus [29]. With global climate warming, the distribution of Quercus mongolicus will expand, leading to changes in temperature and photoperiod. Based on this background, studying the influence of temperature and photoperiod on the autumn phenology of Quercus mongolicus and the associated mechanism is a matter of urgency. We performed a simulated experiment with a large artificial climate chamber to study the effects and interactions of warming and photoperiod on Quercus mongolicus seedling (3-year-old) leaf coloration onset (LCO), explored the underlying physiological mechanism from the viewpoint of photosynthetic physiology, and provided a basis for the development of phenological models of Quercus mongolicus. We hypothesized that (1) photoperiod and warming affect LCO by influencing photosynthesis indirectly; (2) there is a critical period for photosynthesis to adjust the LCO; (3) photosynthesis regulates the LCO by the maximum rate of Rubisco (Vcmax) and the maximum rate of ribulose-bisphosphate regeneration (Jmax).

2. Materials and Methods

2.1. Experimental Design

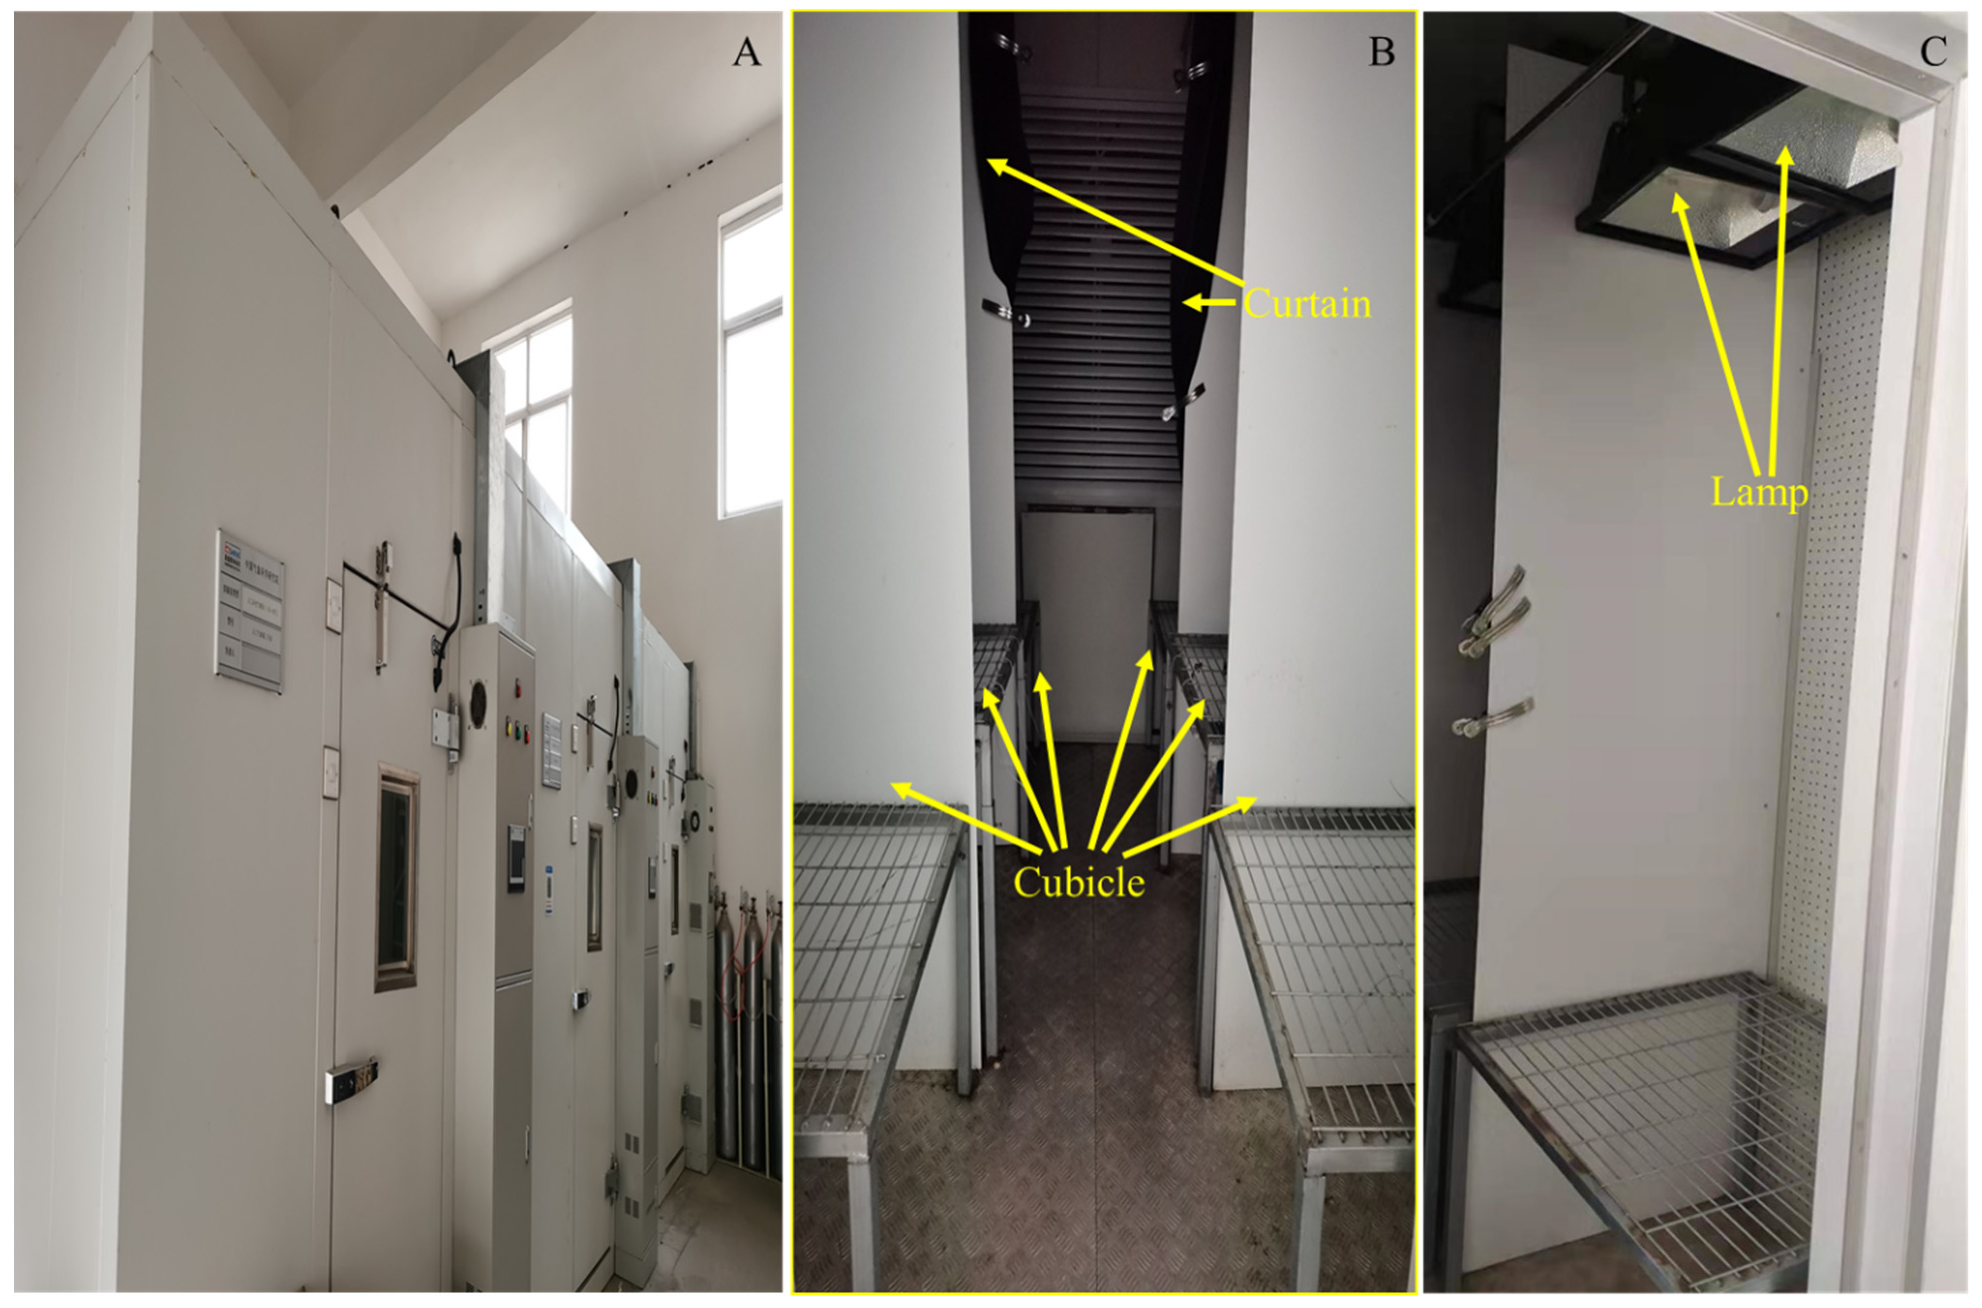
2.1.1. Study Site and Climate Chambers

This experiment was conducted at the Hebei Gucheng Agricultural Meteorology National Observation and Research Station, Hebei Province, China (39′08″ N, 115′40″ E, 15.2 m a.s.l.). Three large artificial climate chambers were used to simulate and control the growth conditions. The chamber could be artificially warmed/cooled by a centralized heating/cooling system which could ensure different levels of continuous (day and night) warming/cooling above/below fluctuating ambient air temperature. Each chamber was assigned to one temperature treatment and separated into six cubicles by wooden boards and opaque curtains to achieve different photoperiod treatments (Figure 1). Each cubicle of each chamber had one group of sodium lamps and accommodated 2 saplings; we switched the lamps and curtains at different times to obtain three photoperiod treatments.

2.1.2. Tree Material

We selected 3-year-old Quercus mongolicus seedlings with similar growth status from the forest farm of Baiquan County, Qiqihar City, Heilongjiang Province, China. Seedlings were transplanted to plastic pots (20 cm in diameter, 20 cm in height) filled with soil from their original location (1 plant per pot). Seedlings were moved into large artificial climate chambers and maintained in the simulated environment of their original place for 15 d. Temperature and photoperiod control experiments were started in April 2019.

2.1.3. Treatments and Environment Controls

We set up three temperature treatments and three photoperiod treatments, resulting in nine treatments. The temperature treatments were as follows: control (the mean corresponding month temperature of the original place of Quercus mongolicus seedlings from 1989 to 2018, T1) (Table 1); 1.5 °C warming (T2); 2.0 °C warming (T3), and the temperature was set at the first day of each month during the experiment. Photoperiod treatments were as follows: 18 h photoperiod (long photoperiod, L1); 14 h photoperiod, the average photoperiod of the original place from 1989 to 2018 (control, L2); 10 h photoperiod (short photoperiod, L3). Each treatment had four replicates, and each replicate contained one seedling. Temperature and air relative humidity (the mean corresponding month air relative humidity of the original place of Quercus mongolicus seedlings from 1989 to 2018) (Table 1) were set on the first day of each month and automatically controlled by the large artificial climate chamber. The concentration of CO2 was set to the atmospheric CO2 concentration (400 ± 20 μmol/mol). To ensure seedling survival, the seedlings were watered every 3 d with the amount calculated by the mean corresponding month precipitation of the original place (Table 1). We did not apply any fertilizer during the experiment.

2.2. Phenology Observation

According to Wan and Liu [30], LCO was defined as the date when the first leaves had an autumn color. Observations were conducted every 2 d at 2:00 p.m., and LCO was recorded.

2.3. Leaf Gas Exchange Parameters and CO2 Response Curve Measurements

The net CO2 assimilation rate (Pn), transpiration rate (Tr), stomatal conductance (Gs), intercellular CO2 concentration (Ci), and Ci/Ca ratio (Ci/Ca) were measured from 8:30 a.m. to 3:30 p.m. on 22 May, 27 June, 18 July, 1 August, and LCO in 2019, using an open gas exchange system (LI-6400, Li-COR Inc., Lincoln, NE) with a leaf chamber fluorometer attachment (LI6400-40, LCF). Three plants from each treatment were selected, and the first full-spread leaf at the top of the chosen plant was used for testing. The concentration of CO2 was fixed at 400 μmol·mol−1, temperature was set at 25 °C, photosynthetic photon flux density (PPFD) was applied with saturating irradiance (1500 μmol·m−2·s−1) supplied via a red-blue LED, and leaves were acclimated under this environmental condition for 10 min.
Measurements were made on the same leaves under a saturated PPFD of 1500 μmol·m−2·s−1 at 25 °C on 1 August 2019. The CO2 concentration gradient for the A/Ci curves was 400, 300, 200, 100, 0, 400, 400, 600, 800, 1000, 1500, 1800, and 2000 μmol·mol−1. Leaves are able to maintain a steady state quickly when external CO2 concentration changes (even shorter than 1s) [31,32]. We set minimum wait time at 60 s after each CO2 concentration change, which is enough for leaf to adapt, and then system will check stability to see if it can log. Detailed steps were provided in the Supplementary Information.
Data were recorded when system stability was met: (1) the standard deviation of the net CO2 assimilation rate (Pn) in 20 s was <0.5; (2) the standard deviation of stomatal conductance (Gs) in 20 s was <0.1; (3) the rate of change of Pn was <0.1 per minute; and (4) the rate of change of Gs was <0.05 per minute. We matched before each recording to minimize offsets between the sample and reference analyzers and improve the accuracy of the measurements. The maximum rate of Rubisco (Vcmax) and maximum rate of ribulose-bisphosphate regeneration (Jmax) were calculated using photosynthesis software (Li-COR Inc., Lincoln, NE, USA).

2.4. Leaf Chlorophyll Content and Water Content Measurements

The contents of leaf chlorophyll and water were measured at the same leaf used to measure leaf gas exchange parameters and the CO2 response curve. Leaf chlorophyll content was measured by a chlorophyll content meter (CCM-300, Opti-Sciences Inc., Hudson, NH, USA).
Leaves were quickly separated and weighed after all the other measurements, to avoid water loss, and then placed in an oven at 80 °C for at least 48 h to a constant dry weight. The leaf water content (LWC) was calculated by using the following formula [33,34].
LWC = LFW -   LDM LFW   × 100 %
where LFW and LDM indicate leaf fresh weight and leaf dry mass (g), respectively.

2.5. Statistical Analysis

A two-way ANOVA with LSD tests was used to test the effects of temperature, photoperiod, and their interaction on Pn, Tr, Gs, Ci, and Ci/Ca at different periods; LCO; Vcmax; Jmax; chlorophyll content; and the LWC of Quercus mongolicus seedlings. Pearson’s correlation analysis was used to explore the correlation between the Pn of different periods and LCO. All analyses were performed by SPSS 21.0 (IBM, Armonk, NY, USA). The structural equation model (SEM) conducted by Amos 21.0 (Amos Development, Spring House, PA, USA) was used to analyze pathways that may explain how temperature and photoperiod regulate LCO. The statistical significance level of all analyses was set at p < 0.05 unless stated otherwise.

3. Results

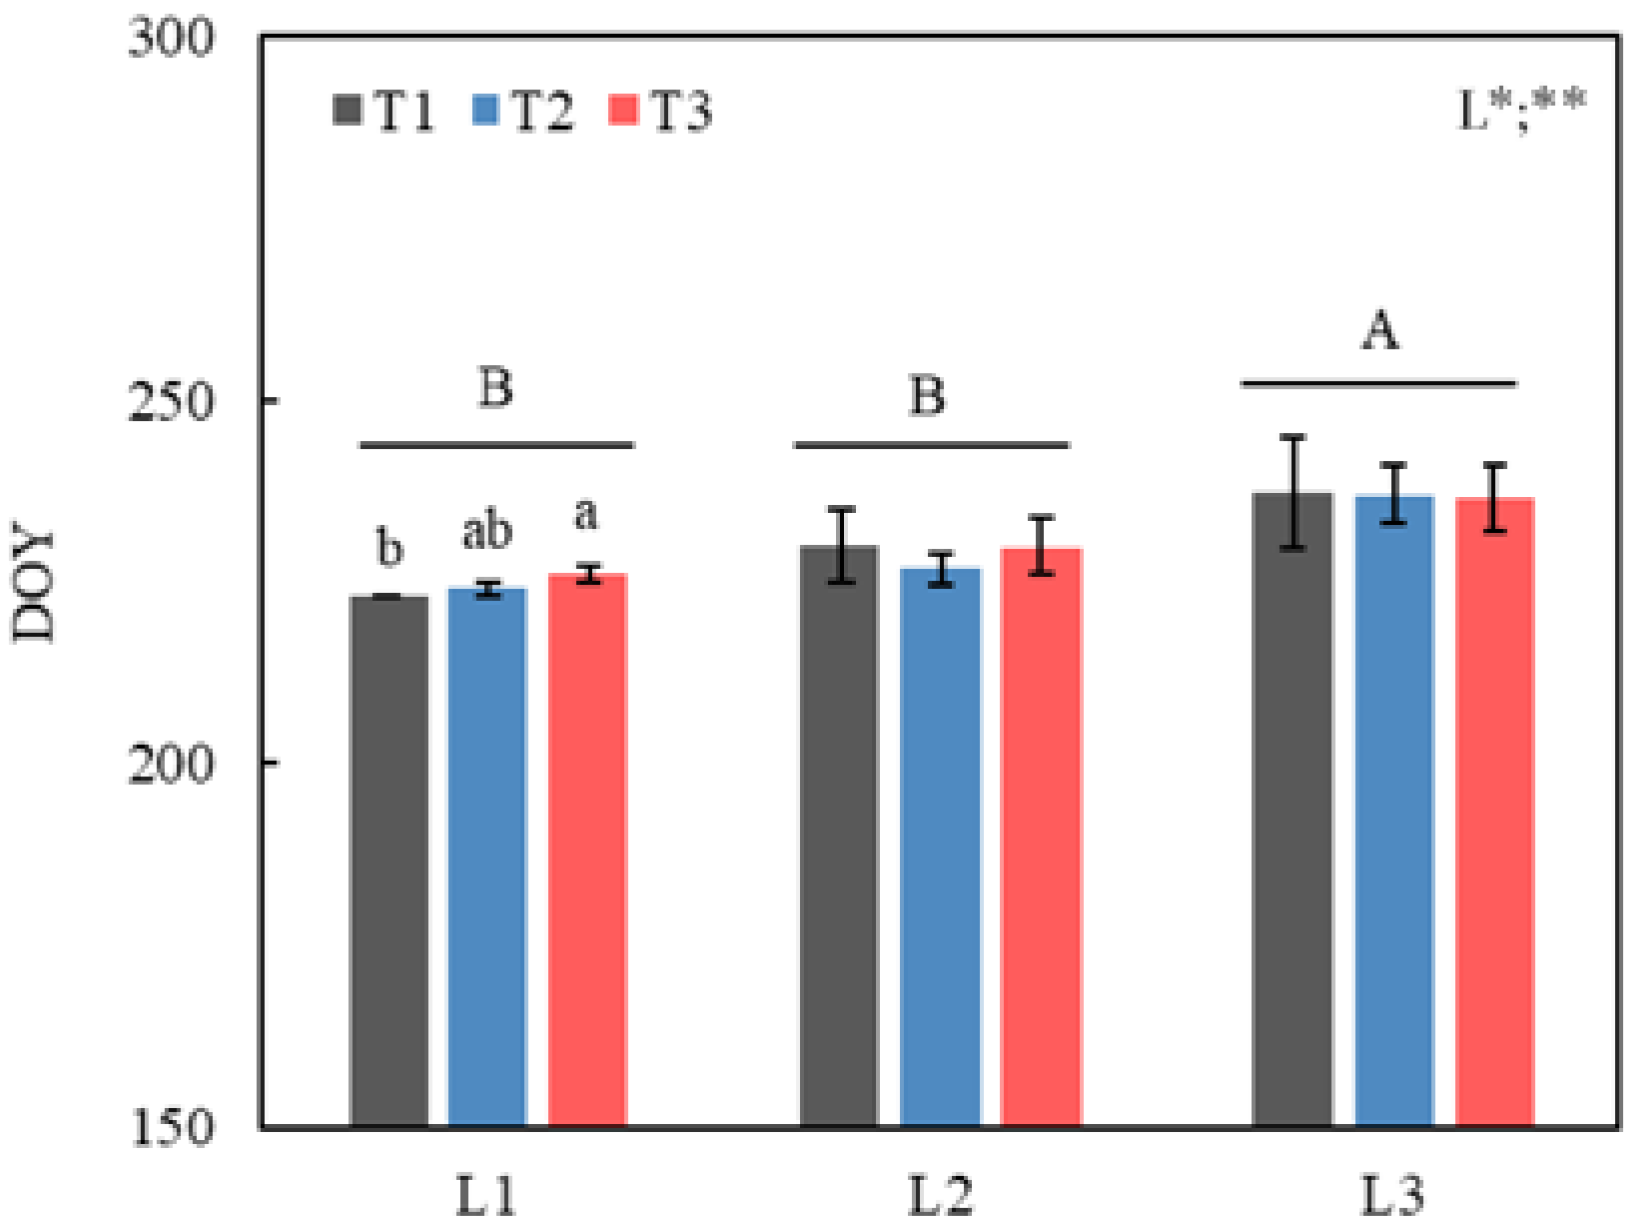
3.1. LCO under Different Temperature and Photoperiod Treatments

Photoperiod had a significant effect on LCO of Quercus mongolicus seedlings (p < 0.01); LCO of the L3 (short photoperiod, 10 h) was significantly later than that of L2 (control, 14 h) and L1 (long photoperiod, 18 h) (p < 0.05, Figure 2). Temperature and its interaction with photoperiod had no significant effects. Only under L1 treatment, LCO of T3 was significantly later than that of T1. The average LCO of the L1, L2, and L3 treatments were 224.3 d, 228.8 d, 236.9 d, respectively.

3.2. Leaf Gas Exchange Parameters under Different Temperature and Photoperiod Treatments

The photoperiod significantly changed Pn from July to LCO, Tr from May to LCO, and Gs from June to LCO (p < 0.05) and reached an extremely significant level in August (p < 0.01) (Table 2, Figure 3). For Ci and Ci/Ca, the photoperiod only significantly affected them in May (p < 0.01) (Table 2). Temperature had significant effects on Pn in May and July, Tr from May to July, and Gs in May and June (Table 2). The interaction between temperature and photoperiod affected the Pn of LCO, Tr in June and July, and Gs in June (Table 2).

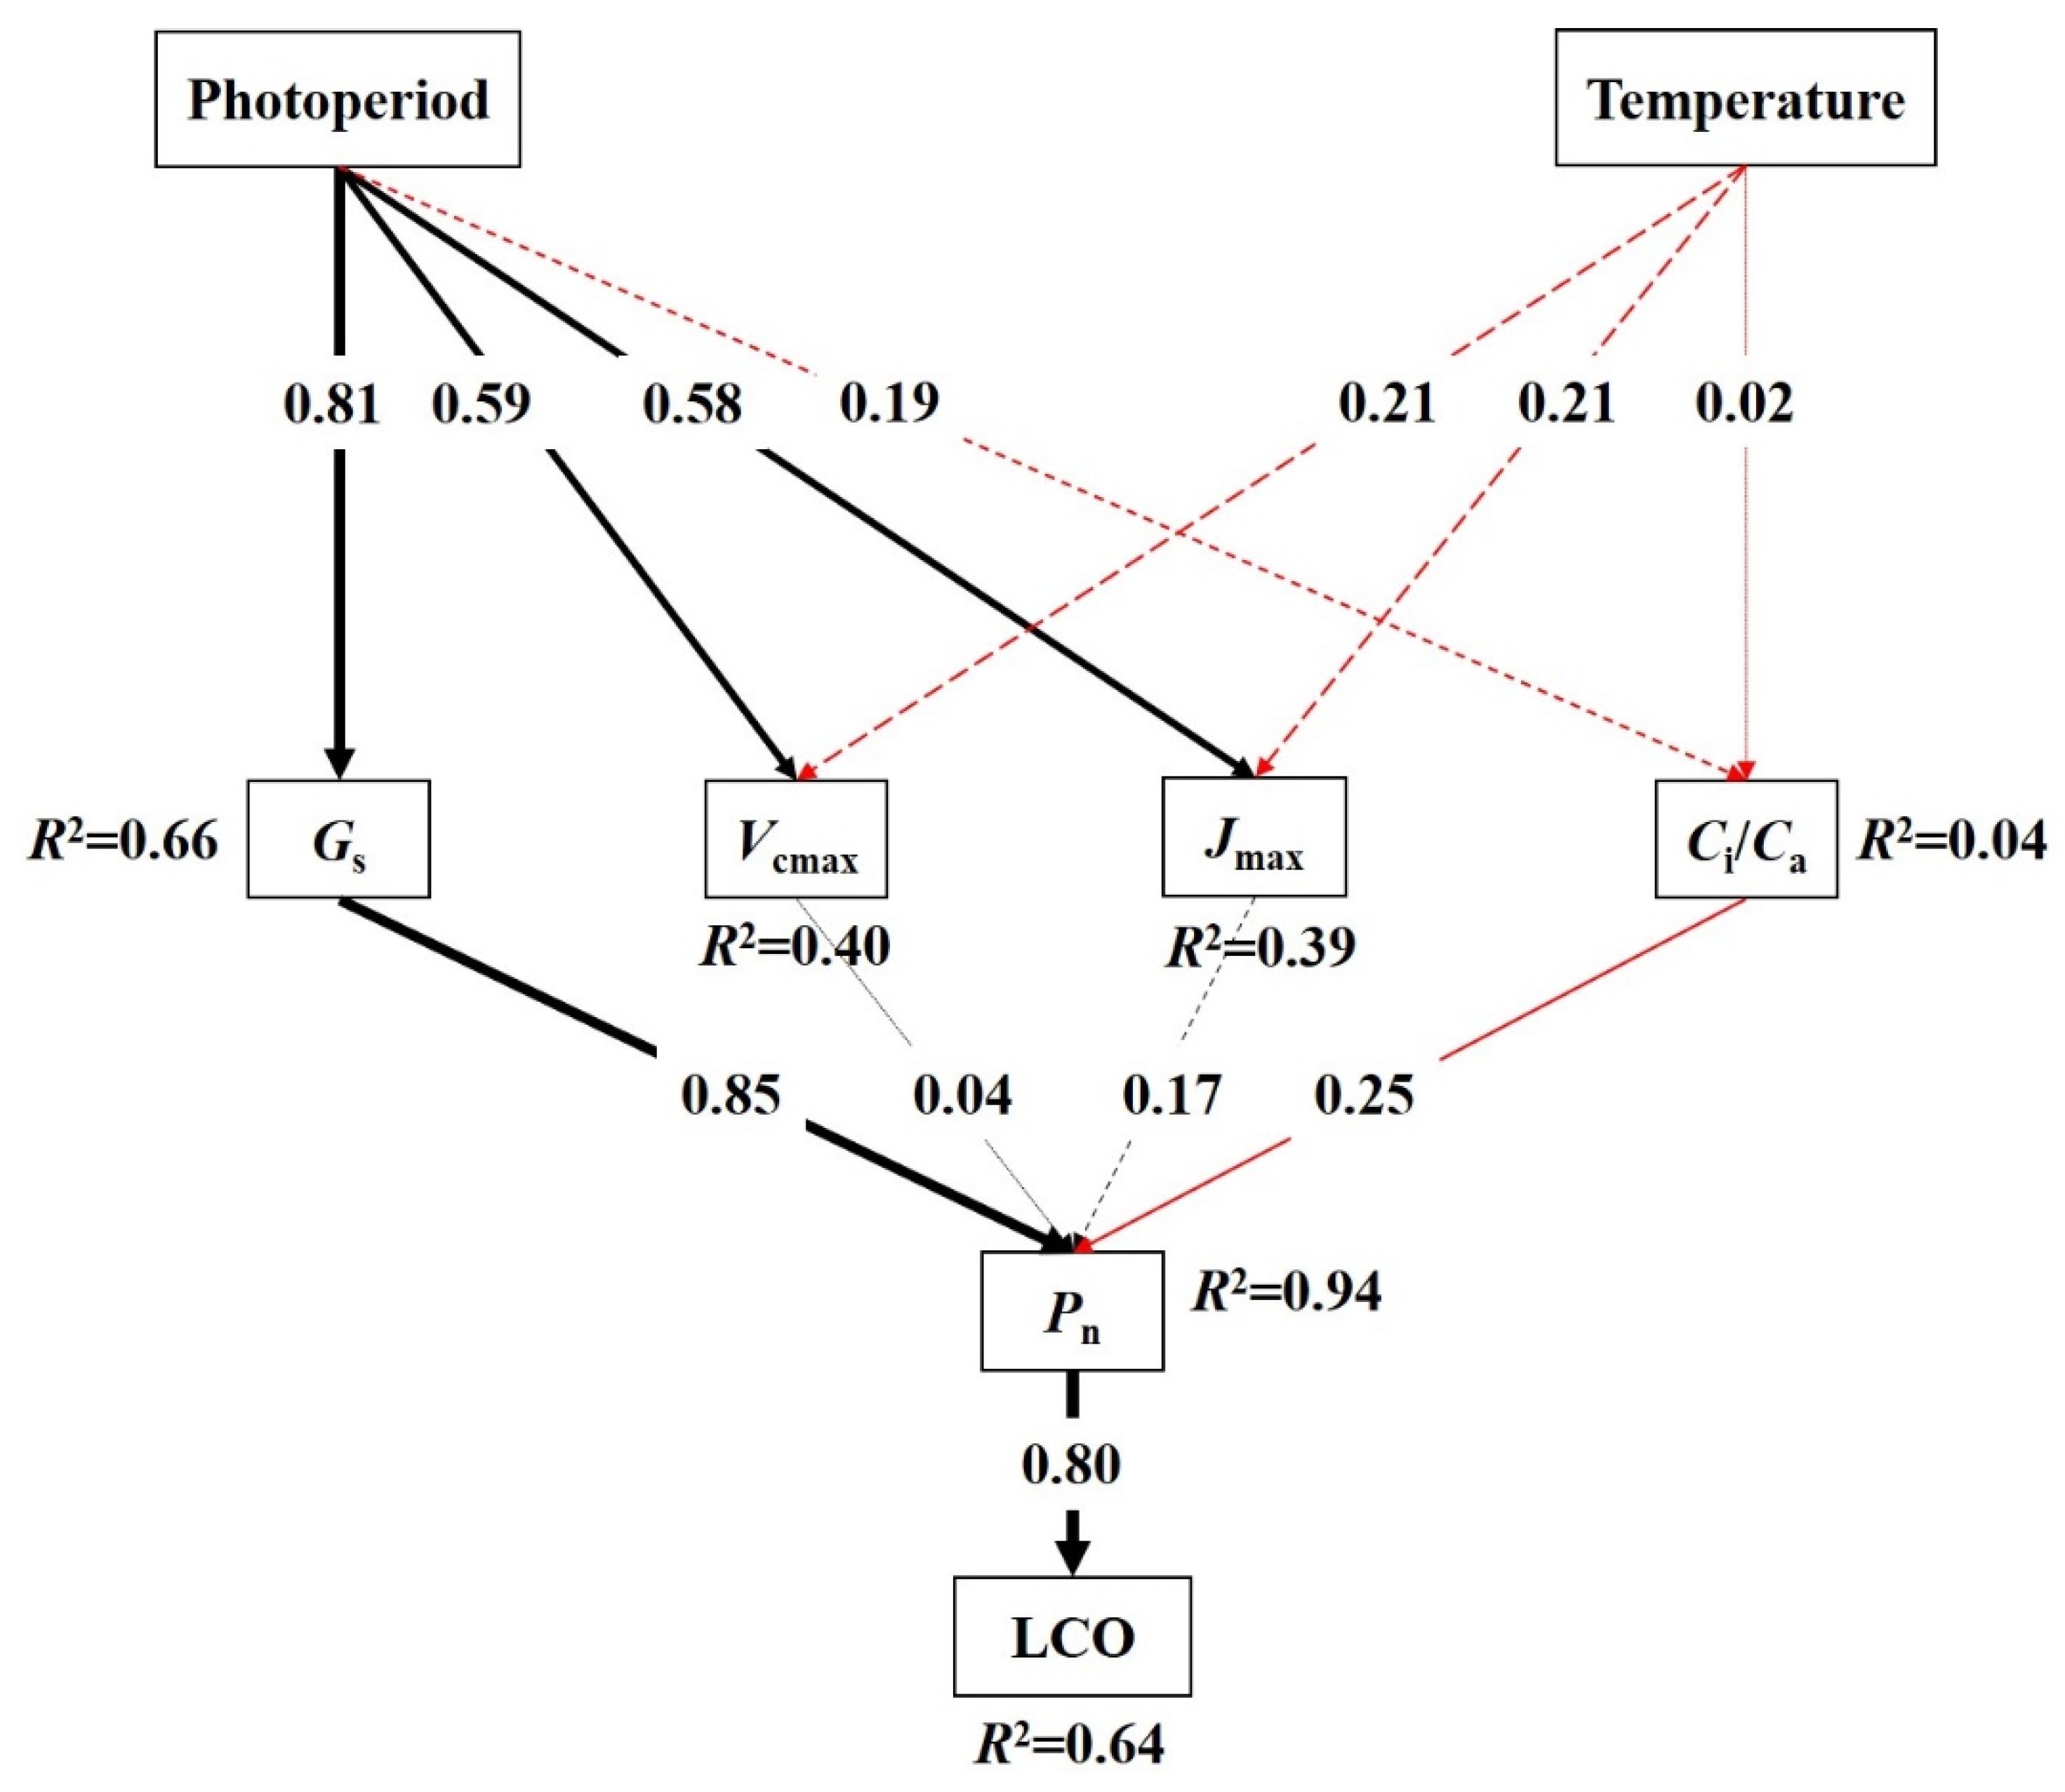
3.3. Regulation Mechanisms of Temperature and Photoperiod on LCO

As shown, only Pn in August (near LCO) was significantly correlated with LCO (R2 = 0.65, p < 0.01) (Figure 4); therefore, the time near LCO may be the key regulating LCO variations. The photoperiod significantly changed the maximum rate of Rubisco (Vcmax) and the maximum rate of ribulose-bisphosphate regeneration (Jmax) near the time of LCO, whereas temperature and its interaction with photoperiod had no significant effect (p < 0.05, Table 3). Both leaf chlorophyll content and water content showed no significant response to photoperiod, temperature, or their interaction (Table 3).
The structural equation model (SEM) results indicated that temperature had no significant direct or indirect impact on photosynthetic characteristics and LCO. Photoperiod had a significant direct impact on Gs, Vcmax, and Jmax and explained 66% of the variation in Gs. Among the photosynthetic characteristics, Gs had a significant direct impact on Pn, with a standardized path coefficient of 0.85 (Figure 5). In summary, photoperiod affected Pn near LCO indirectly by changing Gs and regulating LCO (Figure 5). The model explained 64% of the variation in LCO (Figure 5).

4. Discussion

In deciduous plants, leaf senescence is the transition between the active and dormant periods. Plants complete nutrient resorption before leaf drop to provide nutrients for the construction of new leaves in the following year [25]. The duration of leaf senescence results from a trade-off between nitrogen and carbon requirements. Trees shorten their growing season and decrease photosynthetic proficiency by triggering senescence early to efficiently remobilize nitrogen. By contrast, trees that are senescent too late can obtain more photosynthates but are threatened by nitrogen loss in leaves, owing to frost damage and the reduction of nutrient support for the growth of leaves in the next season [23,35,36]. Temperature and photoperiod are the two main climatic factors affecting autumn phenology [37,38,39]. Photoperiod is a signal that predicts the arrival of cold and frost, and temperature can predict warmth [25,40].
In this study, the temperature had no significant effect on LCO. Studies have illustrated that autumn phenology is delayed as temperatures increase [41,42,43,44]; nonetheless, different species respond differently to temperature. Temperature exerted various influences on leaf senescence in four deciduous forest species (Liquidambar styraciflua, Quercus rubra, Populus grandidentata, Betula alleghaniensis) and affected Quercus the least [45]. Morin et al. [46] also found different responses of leaf senescence to temperature in two deciduous species (Quercus robur, Quercus pubescens). Similarly, autumn phenology from 13 observation sites in Finnish Lapland showed no trends or relationships with climatic conditions [47]. In this study, the interaction effect of photoperiod and temperature on LCO of Quercus mongolicus seedlings was not significant. This was not in line with previous results, which may be caused by spatial and interspecific difference. Delpierre et al. [38] proposed a photoperiod-sensitive cold-degree day summation model to simulate leaf coloring and obtained a good result. Lang et al. [20] reported the coupling effect of photoperiod shortening and temperature decreases on leaf senescence. The start of leaf senescence was 61.2% controlled by photoperiod shortening, and 38.8% controlled by daily minimum temperature decrease, particularly for the native species. In all exotic species, leaf senescence start was triggered by photoperiod shortening. They concluded that the response of leaf senescence to photoperiod and temperature varied by species and space, as confirmed by Tanino et al. [48].
In our study, photoperiod changed LCO significantly; the short photoperiod postponed LCO, and long photoperiod advanced it, which is inconsistent with results in the literature. A general consensus is that photoperiod drives leaf coloring and senescence. Experimental and observational data have proved that the senescence process started around the same date, and a vast majority of studies have demonstrated that the shortening photoperiod is a driver of leaf coloring and senescence [20,23,35,49]. However, our results support the view that leaf senescence is the result of a trade-off between nutrient resorption and reserves. Plants postponed LCO to compensate for the enormous insufficiency in photosynthetic time under the condition of a long-time short photoperiod relative to a long-photoperiod and maximum carbon accumulation. During our experiment, Pn of the short-photoperiod treatment was gradually higher than that of the control and long-photoperiod treatments and reached a significant level near LCO, which may be a compensatory measure by which plants can shift from resource assimilation to remobilization as soon as possible. Furthermore, leaf senescence relies heavily on photosynthesis to provide the energy it demands. Quercus mongolicus seedlings in short-photoperiod treatments for long periods therefore need to defer LCO and increase Pn to ensure the energy required for leaf senescence [23,35].
We found that the Pn near LCO had a close relationship with LCO, and the photoperiod adjusted the Pn near LCO indirectly by changing Gs and modulating LCO. Studies have shown that the photoperiod is pivotal in plant photosynthesis [50,51]. Photoperiod explains the major variation in Vcmax and Jmax across 23 tree species and is the mechanism by which photoperiod regulates the seasonal pattern of photosynthetic rates [52]. In Gingko biloba, photoperiod is highly synchronized and correlated with Vcmax [53]. Contrary to their results, our study supports that even photoperiod had significant direct effects on Gs, Vcmax, and Jmax, which mainly controlled Pn by altering Gs. The interspecific difference and the seedlings we used instead of mature trees may be responsible for this difference.
To be noted, the seedlings in pots usually have distinctly different biomass allocation, carbohydrate dynamics and attendant variation in carbon assimilation mechanisms compared to massive adult trees in natural systems. The controlled pot studies, however, are necessary to improve the understanding of the process and mechanism of forest ecosystems from seedlings to adult trees. There are uncertainties associated with jumping from the pot to the forest scale, and the results from the controlled pot studies could not directly come to generalizing to the trees. In order to realize the results from manipulated experiment to generalizing to the trees, in-situ control experimental research should be strengthened in the future, although it has high costs and it is difficult to achieve multi-environmental factor control.

5. Conclusions

We conducted an experiment with three temperature and three photoperiod treatments and found that photoperiod was the driver of LCO in Quercus mongolicus seedlings, but not temperature or their interaction. The Quercus mongolicus seedlings that suffered in a short photoperiod for a long time postponed LCO significantly, and seedlings of the long-photoperiod treatments advanced their LCO. Seedlings in the short-photoperiod treatments had higher Pn than the other two treatments, especially at the date near LCO. The later LCO and higher Pn of the short-photoperiod seedlings may compensate for insufficiency in photosynthetic time and maximize carbon accumulation before leaf senescence, supporting the view that leaf senescence is a trade-off between plant nutrient resorption and reserves from another insight. The close relationship between Pn near LCO and LCO suggests that Pn is the key driver of LCO, and the pathway of the photoperiod regulation of LCO is that photoperiod changes Gs near LCO, which indirectly affects Pn.

Supplementary Materials

The following supporting information can be downloaded at: https://www.mdpi.com/article/10.3390/f13071099/s1.

Author Contributions

Conceptualization, G.Z. and Q.H.; methodology, M.Z., G.Z. and Q.H.; software, H.Y.; formal analysis, H.Y.; investigation, H.Y., X.L. and M.Z.; resources, X.L. and M.Z.; writing—original draft, H.Y.; writing—review & editing, M.Z., G.Z. and Q.H.; visualization, H.Y.; supervision, G.Z.; project administration, G.Z. and Q.H.; funding acquisition, G.Z. and Q.H. All authors have read and agreed to the published version of the manuscript.

Funding

This study is supported by the National Key Research and Development Program of China (No. 2018YFD0606103), the National Natural Science Foundation of China (No. 4213000565), and the Basic Research Fund of Chinese Academy of Meteorological Sciences (2020Z004).

Institutional Review Board Statement

Not applicable.

Informed Consent Statement

Not applicable.

Data Availability Statement

Not applicable.

Acknowledgments

The authors wish to thank Mingxin, Hu, Siqi Wang, Shiya Zhang, Wenjie Gu, Ruochen Li, Xingyang Song Erhua Liu, and Huailin Zhou for their assistance in the manipulation experiment.

Conflicts of Interest

The authors declare that they have no known competing financial interests or personal relationships that could have appeared to influence the work reported in this paper.

References

  1. Ge, Q.; Wang, H.; Rutishauser, T.; Dai, J. Phenological response to climate change in China: A meta-analysis. Glob. Chang. Biol. 2015, 21, 265–274. [Google Scholar] [CrossRef]
  2. Piao, S.; Liu, Q.; Chen, A.; Janssens, I.A.; Fu, Y.; Dai, J.; Liu, L.; Lian, X.; Shen, M.; Zhu, X. Plant phenology and global climate change: Current progresses and challenges. Glob. Chang. Biol. 2019, 25, 1922–1940. [Google Scholar] [CrossRef] [PubMed]
  3. Wang, S.Q.; Zhou, G.S.; Zhou, M.Z.; Lü, X.M.; Zhou, L.; Ji, Y.H. Photosynthetically physiological mechanism of Stipa krylovii withered and yellow phenology response to precipitation under the background of warming. J. Appl. Ecol. 2021, 32, 845–852. [Google Scholar] [CrossRef]
  4. Zhou, L.; Wang, Y.; Jia, Q.; Zhou, G. Increasing temperature shortened the carbon uptake period and decreased the cumulative net ecosystem productivity in a maize cropland in Northeast China. Field Crop Res. 2021, 267, 108150. [Google Scholar] [CrossRef]
  5. Steinaker, D.F.; Wilson, S.D. Phenology of fine roots and leaves in forest and grassland. J. Ecol. 2008, 96, 1222–1229. [Google Scholar] [CrossRef]
  6. Huang, L.; Koubek, T.; Weiser, M.; Herben, T.; Cornelissen, H. Environmental drivers and phylogenetic constraints of growth phenologies across a large set of herbaceous species. J. Ecol. 2018, 106, 1621–1633. [Google Scholar] [CrossRef]
  7. Berra, E.F.; Gaulton, R. Remote sensing of temperate and boreal forest phenology: A review of progress, challenges and opportunities in the intercomparison of in-situ and satellite phenological metrics. Forest Ecol. Manag. 2021, 480, 118663. [Google Scholar] [CrossRef]
  8. Menzel, A. Trends in phenological phases in Europe between 1951 and 1996. Int. J. Biometeorol. 2000, 44, 76–81. [Google Scholar] [CrossRef]
  9. Cleland, E.E.; Allen, J.M.; Crimmins, T.M.; Dunne, J.A.; Pau, S.; Travers, S.E.; Zavaleta, E.S.; Wolkovich, E.M. Phenological tracking enables positive species responses to climate change. Ecology 2012, 93, 1765–1771. [Google Scholar] [CrossRef]
  10. Svystun, T.; Lundströmer, J.; Berlin, M.; Westin, J.; Jönsson, A.M. Model analysis of temperature impact on the Norway spruce provenance specific bud burst and associated risk of frost damage. Forest Ecol. Manag. 2021, 493, 119252. [Google Scholar] [CrossRef]
  11. Zhang, R.; Wang, F.; Zheng, J.; Lin, J.; Hänninen, H.; Wu, J. Chilling accumulation and photoperiod regulate rest break and bud burst in five subtropical tree species. Forest Ecol. Manag. 2021, 485, 118813. [Google Scholar] [CrossRef]
  12. Liu, L.; Zhang, X.; Yu, Y.; Donnelly, A. Detecting spatiotemporal changes of peak foliage coloration in deciduous and mixedforests across the Central and Eastern United States. Environ. Res. Lett. 2017, 12, 024013. [Google Scholar] [CrossRef] [Green Version]
  13. Li, P.; Peng, C.; Wang, M.; Luo, Y.; Li, M.; Zhang, K.; Zhang, D.; Zhu, Q. Dynamics of vegetation autumn phenology and its response to multiple environmental factors from 1982 to 2012 on Qinghai-Tibetan Plateau in China. Sci. Total Environ. 2018, 637–638, 855–864. [Google Scholar] [CrossRef] [PubMed]
  14. Li, P.; Zhu, Q.; Peng, C.; Zhang, J.; Wang, M.; Zhang, J.; Ding, J.; Zhou, X. Change in autumn vegetation phenology and the climate controls from 1982 to 2012 on the Qinghai–Tibet Plateau. Front. Plant Sci. 2020, 10, 1677. [Google Scholar] [CrossRef] [Green Version]
  15. Zhang, S.; Dai, J.; Ge, Q. Responses of autumn phenology to climate change and the correlations of plant hormone regulation. Sci. Rep. 2020, 10, 9039. [Google Scholar] [CrossRef]
  16. Jeong, S.J.; Ho, C.H.; Gim, H.J.; Brown, M.E. Phenology shifts at start vs. end of growing season in temperate vegetation over the Northern Hemisphere for the period 1982–2008. Glob. Chang. Biol. 2011, 17, 2385–2399. [Google Scholar] [CrossRef]
  17. Wu, C.; Chen, J.M.; Black, T.A.; Price, D.T.; Kurz, W.A.; Desai, A.R.; Gonsamo, A.; Jassal, R.S.; Gough, C.M.; Bohrer, G.; et al. Interannual variability of net ecosystem productivity in forests is explained by carbon flux phenology in autumn. Global Ecol. Biogeogr. 2013, 22, 994–1006. [Google Scholar] [CrossRef]
  18. Lee, S.; Jeong, S.; Park, C.E.; Kim, J. A Simple method of predicting autumn leaf coloring date using machine learning with spring leaf unfolding date. Asia-Pac. J. Atmos. Sci. 2022, 58, 219–226. [Google Scholar] [CrossRef]
  19. Menzel, A.; Sparks, T.H.; Estrella, N.; Koch, E.; Aasa, A.; Ahas, R.; Alm-Kübler, K.; Bissolli, P.; Braslavská, O.; Briede, A.; et al. European phenological response to climate change matches the warming pattern. Glob. Chang. Biol. 2006, 12, 1969–1976. [Google Scholar] [CrossRef]
  20. Lang, W.; Chen, X.; Qian, S.; Liu, G.; Piao, S. A new process-based model for predicting autumn phenology: How is leaf senescence controlled by photoperiod and temperature coupling? Agric. For. Meteorol. 2019, 268, 124–135. [Google Scholar] [CrossRef]
  21. Chu, X.; Man, R.; Zhang, H.; Yuan, W.; Tao, J.; Dang, Q.L. Does climate warming favour early season species? Front. Plant Sci. 2021, 12, 765351. [Google Scholar] [CrossRef] [PubMed]
  22. Chen, S.; Fu, Y.H.; Geng, X.; Hao, Z.; Tang, J.; Zhang, X.; Xu, Z.; Hao, F. Influences of shifted vegetation phenology on runoff across a hydroclimatic gradient. Front. Plant Sci. 2022, 12, 802664. [Google Scholar] [CrossRef] [PubMed]
  23. Keskitalo, J.; Bergquist, G.; Gardestrom, P.; Jansson, S. A cellular timetable of autumn senescence. Plant Physiol. 2005, 139, 1635–1648. [Google Scholar] [CrossRef] [Green Version]
  24. Saxe, H.; Cannell, M.G.R.; Johnsen, Ø.; Ryan, M.G.; Vourlitis, G. Tree and forest functioning in response to global warming. New Phytol. 2001, 149, 369–399. [Google Scholar] [CrossRef] [PubMed]
  25. Estiarte, M.; Peñuelas, J. Alteration of the phenology of leaf senescence and fall in winter deciduous species by climate change: Effects on nutrient proficiency. Glob. Chang. Biol. 2015, 21, 1005–1017. [Google Scholar] [CrossRef] [PubMed] [Green Version]
  26. Bucher, S.F.; Römermann, C.; Bonser, S. The timing of leaf senescence relates to flowering phenology and functional traits in 17 herbaceous species along elevational gradients. J. Ecol. 2021, 109, 1537–1548. [Google Scholar] [CrossRef]
  27. Zani, D.; Crowther, T.W.; Mo, L.D.; Renner, S.S.; Zohner, C.M. Increased growing-season productivity drives earlier autumn leaf senescence in temperate trees. Science 2020, 370, 1066–1071. [Google Scholar] [CrossRef]
  28. Xia, H.; Wang, B. Complete chloroplast genome sequence of the Mongolian oak, Quercus mongolica (Fagaceae). Mitochondrial DNA Part B 2019, 4, 1089–1090. [Google Scholar] [CrossRef] [Green Version]
  29. Hu, M.X.; Zhou, G.S.; Lü, X.M.; Wang, S.Q.; Zhang, S.Y. Interactive effects of different warming and changing photoperiod on spring phenology of Quercu smongolicus seedlings. Acta Ecol. Sin. 2021, 41, 2816–2825. [Google Scholar] [CrossRef]
  30. Wan, M.W.; Liu, X.Z. Phenological Observation Methods in China; Science Press: Beijing, China, 1979. [Google Scholar]
  31. Davis, J.E.; Arkebauer, T.J.; Norman, J.M.; Brandle, J.R. Rapid field measurement of the assimilation rate versus internal CO2 concentration relationship in green ash (Fraxinus pennsylvanica Marsh.): The influence of light intensity. Tree Physiol. 1987, 3, 387–392. [Google Scholar] [CrossRef]
  32. McDermitt, D.; Norman, J.; Davis, J.; Ball, T.; Arkebauer, T.; Welles, J.; Roerner, S. CO2 response curves can be measured with a field-portable closed-loop photosynthesis system. Ann. Sc. For. 1989, 46, 416s–420s. [Google Scholar] [CrossRef] [Green Version]
  33. Zhou, H.; Zhou, G.; He, Q.; Zhou, L.; Ji, Y.; Lv, X. Capability of leaf water content and its threshold values in reflection of soil–plant water status in maize during prolonged drought. Ecol. Indic. 2021, 124, 107395. [Google Scholar] [CrossRef]
  34. Garnier, E.; Laurent, G. Leaf anatomy, specific mass and water content in congeneric annual and perennial grass species. New Phytol. 1994, 128, 725–736. [Google Scholar] [CrossRef]
  35. Fracheboud, Y.; Luquez, V.; Bjorken, L.; Sjodin, A.; Tuominen, H.; Jansson, S. The control of autumn senescence in European aspen. Plant Physiol. 2009, 149, 1982–1991. [Google Scholar] [CrossRef] [PubMed] [Green Version]
  36. Inoue, S.; Dang, Q.L.; Man, R.; Tedla, B. Photoperiod, [CO2] and soil moisture interactively affect phenology in trembling aspen: Implications to climate change-induced migration. Environ. Exp. Bot. 2020, 180, 104269. [Google Scholar] [CrossRef]
  37. Estrella, N.; Menzel, A. Responses of leaf colouring in four deciduous tree species to climate and weather in Germany. Clim. Res. 2006, 32, 253–267. [Google Scholar] [CrossRef] [Green Version]
  38. Delpierre, N.; Dufrêne, E.; Soudani, K.; Ulrich, E.; Cecchini, S.; Boé, J.; François, C. Modelling interannual and spatial variability of leaf senescence for three deciduous tree species in France. Agric. For. Meteorol. 2009, 149, 938–948. [Google Scholar] [CrossRef]
  39. Singh, R.K.; Bhalerao, R.P.; Eriksson, M.E. Growing in time: Exploring the molecular mechanisms of tree growth. Tree Physiol. 2021, 41, 657–678. [Google Scholar] [CrossRef]
  40. Meng, L.; Zhou, Y.; Gu, L.; Richardson, A.D.; Penuelas, J.; Fu, Y.; Wang, Y.; Asrar, G.R.; De Boeck, H.J.; Mao, J.; et al. Photoperiod decelerates the advance of spring phenology of six deciduous tree species under climate warming. Glob. Chang. Biol. 2021, 27, 2914–2927. [Google Scholar] [CrossRef]
  41. Doi, H.; Takahashi, M. Latitudinal patterns in the phenological responses of leaf colouring and leaf fall to climate change in Japan. Global Ecol. Biogeogr. 2008, 17, 556–561. [Google Scholar] [CrossRef]
  42. Fu, Y.H.; Piao, S.; Delpierre, N.; Hao, F.; Hanninen, H.; Liu, Y.; Sun, W.; Janssens, I.A.; Campioli, M. Larger temperature response of autumn leaf senescence than spring leaf-out phenology. Glob. Chang. Biol. 2018, 24, 2159–2168. [Google Scholar] [CrossRef] [PubMed]
  43. Wang, G.; Huang, Y.; Wei, Y.; Zhang, W.; Li, T.; Zhang, Q. Inner Mongolian grassland plant phenological changes and their climatic drivers. Sci. Total Environ. 2019, 683, 1–8. [Google Scholar] [CrossRef] [PubMed]
  44. Wu, L.; Ma, X.; Dou, X.; Zhu, J.; Zhao, C. Impacts of climate change on vegetation phenology and net primary productivity in arid Central Asia. Sci. Total Environ. 2021, 796, 149055. [Google Scholar] [CrossRef] [PubMed]
  45. Gunderson, C.A.; Edwards, N.T.; Walker, A.V.; O’Hara, K.H.; Campion, C.M.; Hanson, P.J. Forest phenology and a warmer climate-growing season extension in relation to climatic provenance. Glob. Chang. Biol. 2012, 18, 2008–2025. [Google Scholar] [CrossRef]
  46. Morin, X.; Roy, J.; Sonie, L.; Chuine, I. Changes in leaf phenology of three European oak species in response to experimental climate change. New Phytol. 2010, 186, 900–910. [Google Scholar] [CrossRef]
  47. Pudas, E.; Tolvanen, A.; Poikolainen, J.; Sukuvaara, T.; Kubin, E. Timing of plant phenophases in Finnish Lapland in 1997–2006. Boreal Environ. Res. 2008, 13, 31–43. [Google Scholar]
  48. Tanino, K.K.; Kalcsits, L.; Silim, S.; Kendall, E.; Gray, G.R. Temperature-driven plasticity in growth cessation and dormancy development in deciduous woody plants: A working hypothesis suggesting how molecular and cellular function is affected by temperature during dormancy induction. Plant Mol. Biol. 2010, 73, 49–65. [Google Scholar] [CrossRef]
  49. Barr, A.G.; Black, T.A.; Hogg, E.H.; Kljun, N.; Morgenstern, K.; Nesic, Z. Inter-annual variability in the leaf area index of a boreal aspen-hazelnut forest in relation to net ecosystem production. Agric. For. Meteorol. 2004, 126, 237–255. [Google Scholar] [CrossRef]
  50. Frechette, E.; Chang, C.Y.; Ensminger, I. Variation in the phenology of photosynthesis among eastern white pine provenances in response to warming. Glob. Chang. Biol. 2020, 26, 5217–5234. [Google Scholar] [CrossRef]
  51. Kong, D.; Zhang, Y.; Wang, D.; Chen, J.; Gu, X. Photoperiod explains the asynchronization between vegetation carbon phenology and vegetation greenness phenology. J. Geophys. Res. Biogeosci. 2020, 125, 1–15. [Google Scholar] [CrossRef]
  52. Bauerle, W.L.; Oren, R.; Way, D.A.; Qian, S.S.; Stoy, P.C.; Thornton, P.E.; Bowden, J.D.; Hoffman, F.M.; Reynolds, R.F. Photoperiodic regulation of the seasonal pattern of photosynthetic capacity and the implications for carbon cycling. Proc. Natl. Acad. Sci. USA 2012, 109, 8612–8617. [Google Scholar] [CrossRef] [PubMed] [Green Version]
  53. Kinoshita, T.; Kume, A.; Hanba, Y.T. Seasonal variations in photosynthetic functions of the urban landscape tree species Gingko biloba: Photoperiod is a key trait. Trees 2020, 35, 273–285. [Google Scholar] [CrossRef]
Figure 1. The large artificial climate chamber photos showing (A) the three artificial climate chambers, (B) six cubicles of each chamber separated by wooden boards and opaque curtains, and (C) a view of the cubicle and the lamps in it.
Forests 13 01099 g001
Figure 2. Changes in leaf coloration onset (LCO) of Quercus mongolicus seedlings under the temperature and photoperiod treatments. Error bars represent means ± SE (n = 4). DOY represents day of year; T1 represents control; T2 represents 1.5 °C warming; T3 represents 2.0 °C warming; L1 represents 18 h photoperiod (long photoperiod), L2 represents 14 h photoperiod (control), and L3 represents 10 h photoperiod (short photoperiod). The different uppercase letters show significant differences among photoperiod treatments (p < 0.05), and the lowercase letters show significant differences among temperature treatments (p < 0.05). * and ** were used to indicate significant differences in temperature (T) and photoperiod (L) and their interaction effect at p < 0.05 and p < 0.01, respectively.
Forests 13 01099 g002
Figure 3. Changes in the net CO2 assimilation rate (Pn) of different periods under the temperature and photoperiod treatments. Error bars represent means ± SE (n = 3). T1 represents control; T2 represents 1.5 °C warming; T3 represents 2.0 °C warming; L1 represents 18 h photoperiod (long photoperiod), L2 represents 14 h photoperiod (control), and L3 represents 10 h photoperiod (short photoperiod).
Forests 13 01099 g003
Figure 4. Relationships between Pn of different periods and LCO of Quercus mongolicus seedlings.
Forests 13 01099 g004
Figure 5. Structural equation model (SEM) analysis of the effects of photoperiod and temperature on LCO. Square boxes indicate variables in the model. Results of model fitting: χ2 = 4.00, p = 0.95, df = 10, and n = 23. Black and red arrows denote the positive and negative correlation pathways, respectively. Arrow width indicates relationship strength. Solid and dashed lines represent significant (p < 0.05) and nonsignificant (p > 0.05) pathways, respectively. The number associated with the arrow represents standardized path coefficients, and R2 values indicate the proportion of the variation explained for each dependent variable in the model.
Forests 13 01099 g005
Table 1. Simulated climatic parameters of the control group during the experiment.
MonthTemperature (℃)Relative Humidity (%)Precipitation (mm)Irrigation Amount (mL)
April5.6550.9419.5155
May14.0251.4137.64107
June19.9665.1687.04247
July22.3376.87155.24440
August20.2878.68113.22321
September13.6169.7554.45154
October4.4561.7620.1657
Table 2. Effects of photoperiod (L), temperature (T), and their interaction on leaf gas exchange parameters of Quercus mongolicus seedlings.
MonthLTL × T
dfFPdfFPdfFP
PnMay20.490.6224.24<0.0540.330.86
June22.520.1422.580.1341.540.27
July23.86<0.0525.23<0.0542.440.10
August233.39<0.0121.260.3141.510.25
LCO24.19<0.0521.840.2044.06<0.05
GsMay21.070.3628.45<0.0141.040.42
June27.74<0.0529.23<0.0144.79<0.05
July24.96<0.0522.530.1241.850.18
August223.86<0.0120.110.9041.300.32
LCO24.13<0.0521.240.3242.620.09
CiMay29.53<0.0123.360.0640.450.77
June20.030.9721.550.2640.340.85
July22.970.0821.710.2243.020.05
August20.840.4520.560.5841.390.29
LCO20.380.6920.060.9440.160.95
Ci/CaMay29.58<0.0123.450.0640.450.77
June20.050.9521.670.2440.370.82
July22.940.0921.690.2243.020.06
August20.820.4620.500.6241.400.28
LCO20.400.6820.050.9540.150.96
TrMay24.84<0.05213.18<0.0142.300.10
June222.35<0.01215.48<0.0147.49<0.01
July211.66<0.0124.37<0.0543.74<0.05
August218.88<0.0120.070.9341.480.26
LCO25.31<0.0521.010.3941.940.17
Notes: Pn represents the net CO2 assimilation rate; Gs represents stomatal conductance; Ci represents intercellular CO2 concentration; Ci/Ca represents Ci/Ca ratio; Tr represents transpiration rate; LCO represents leaf coloration onset. The bold data indicate significant differences at p < 0.05 and p < 0.01, respectively.
Table 3. Effects of photoperiod (L), temperature (T), and their interaction on photosynthetic parameters, leaf chlorophyll content, and water content near LCO.
LTL × T
dfFPdfFPdfFP
Vcmax25.15<0.0520.820.4640.980.45
Jmax25.30<0.0520.930.4240.031.00
Chl21.260.3120.370.7040.350.84
LWC22.740.0921.970.1740.370.83
Notes: Vcmax and Jmax represent the maximum rate of Rubisco and maximum rate of ribulose-bisphosphate regeneration, respectively. Chl represents the chlorophyll content. LWC represents the leaf water content. The bold data indicate significant differences at p < 0.05 and p < 0.01, respectively.
Publisher’s Note: MDPI stays neutral with regard to jurisdictional claims in published maps and institutional affiliations.

